Stability of Glutaraldehyde in Biocide Compositions

 ,
, 

Abstract
1. Introduction
2. Results and Discussion
2.1. Raman Spectra
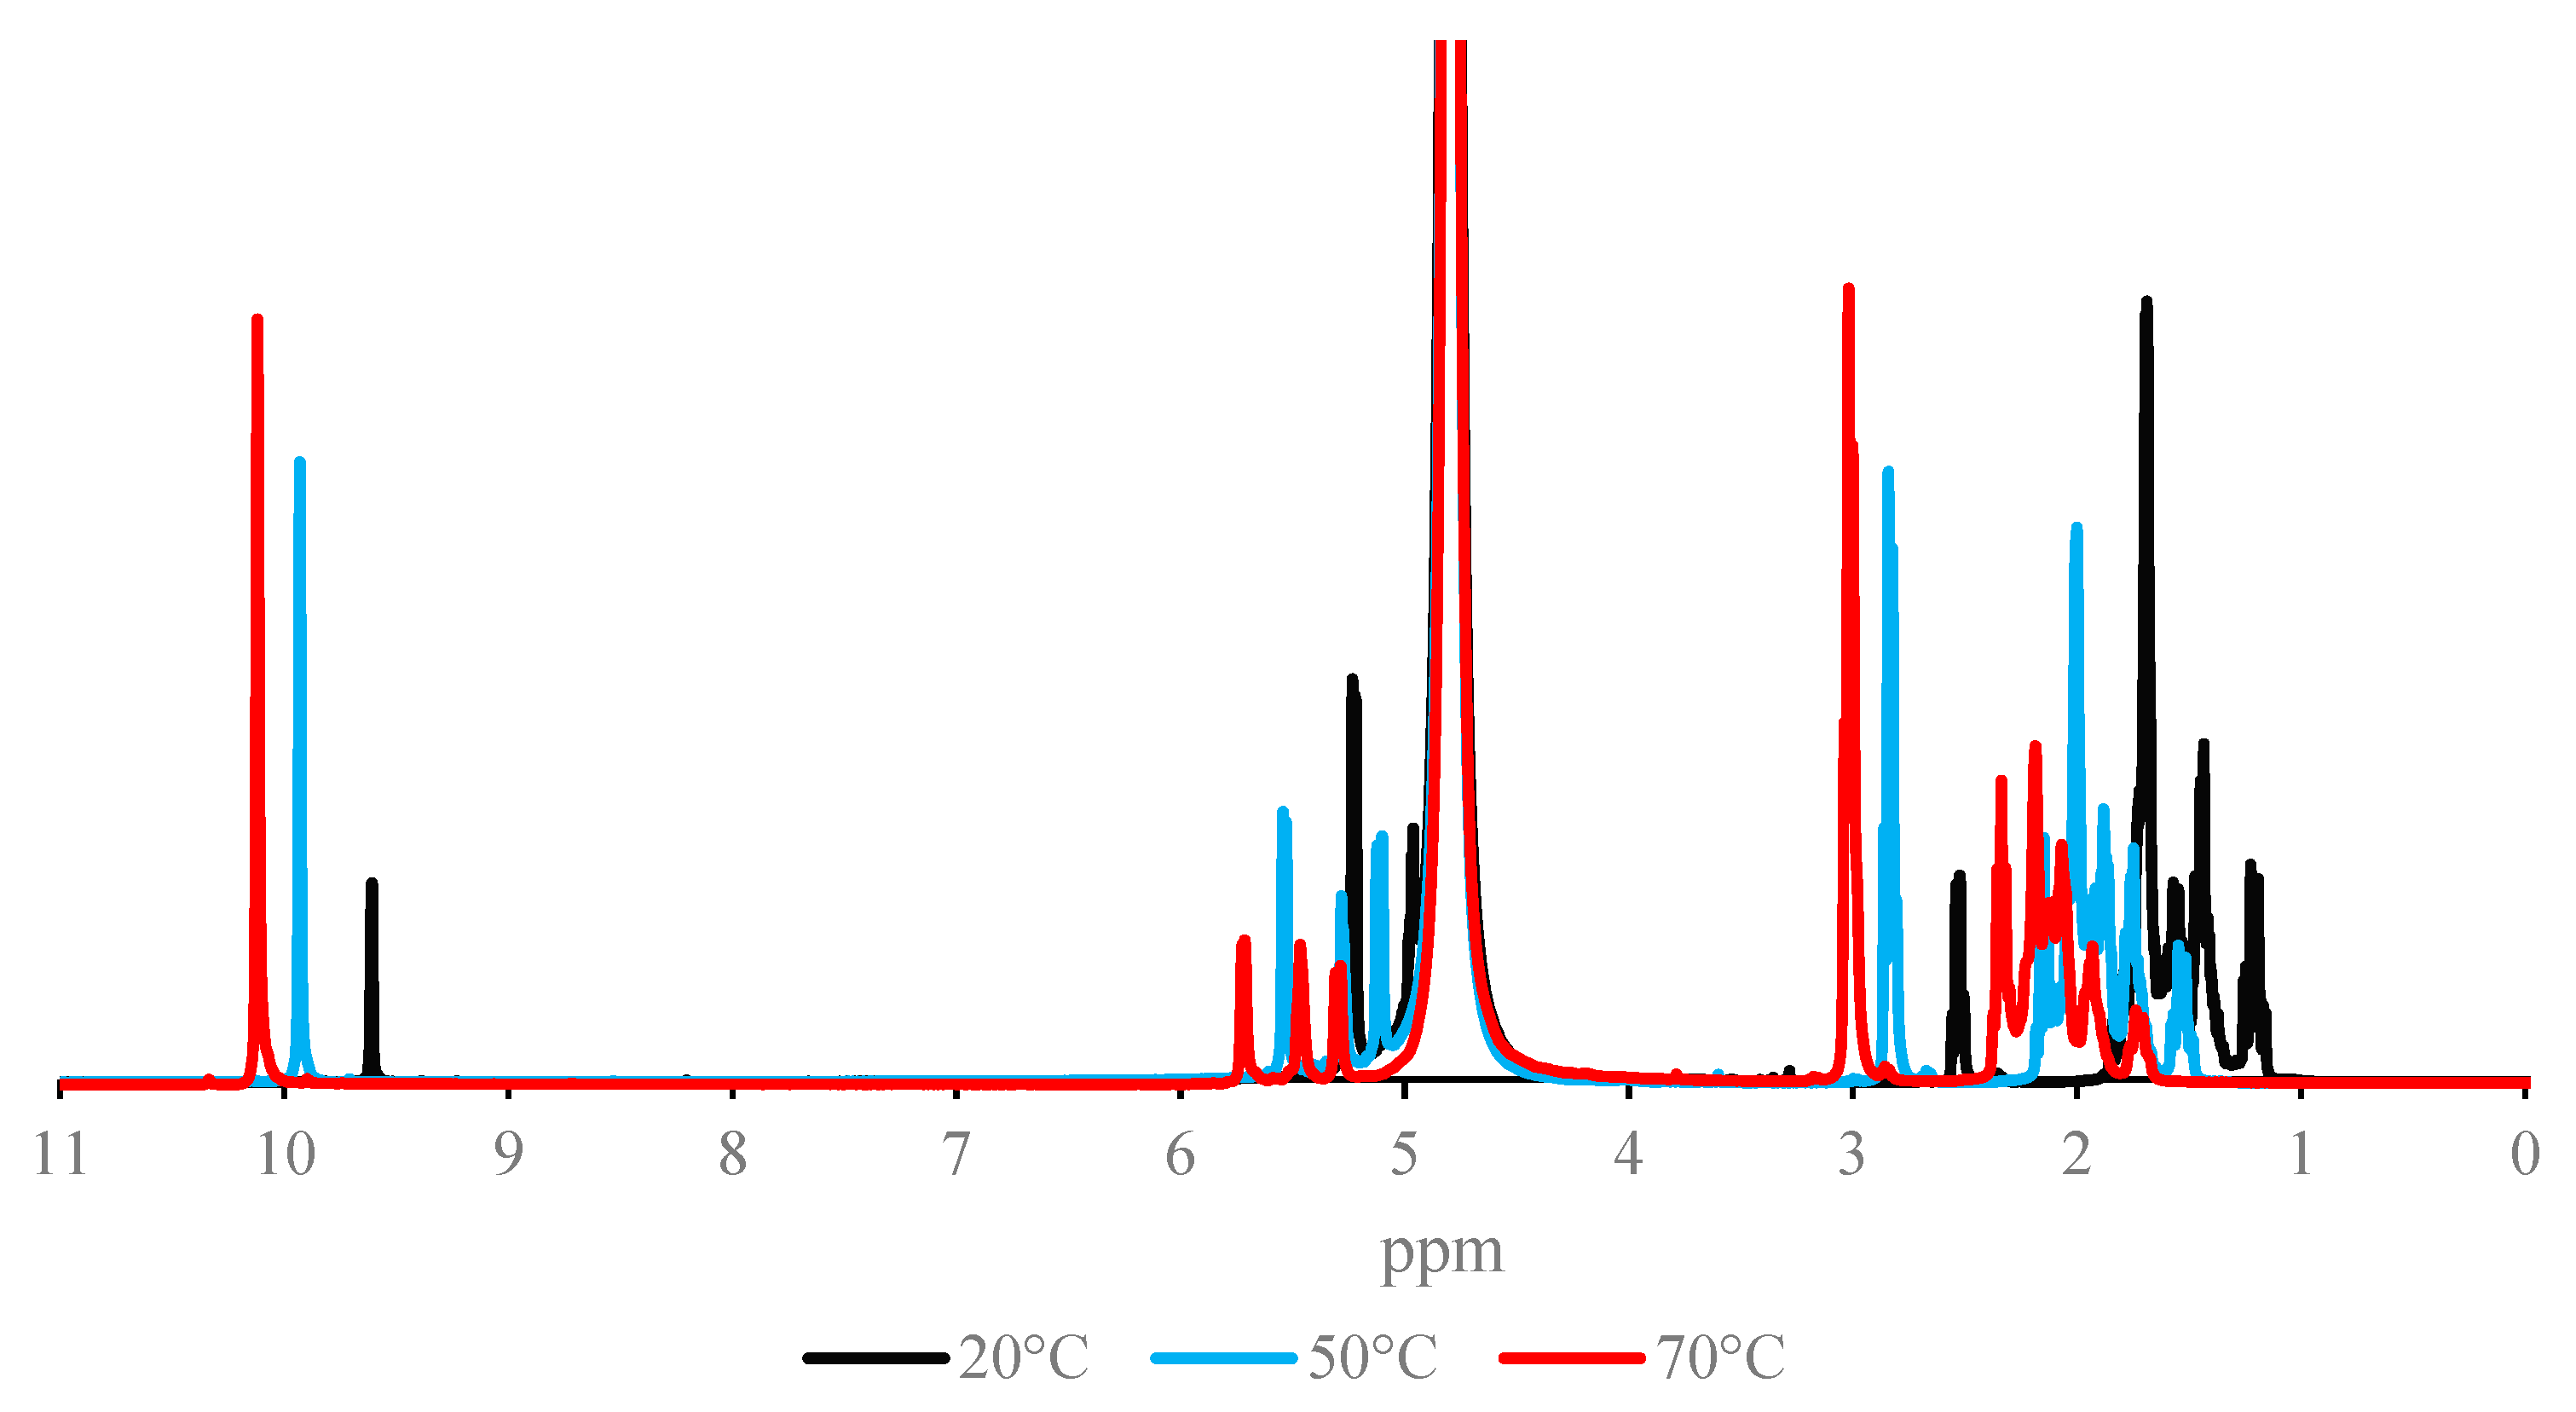
2.2. NMR Spectra
2.3. LC-MS Analysis
2.4. Titration with Glycine
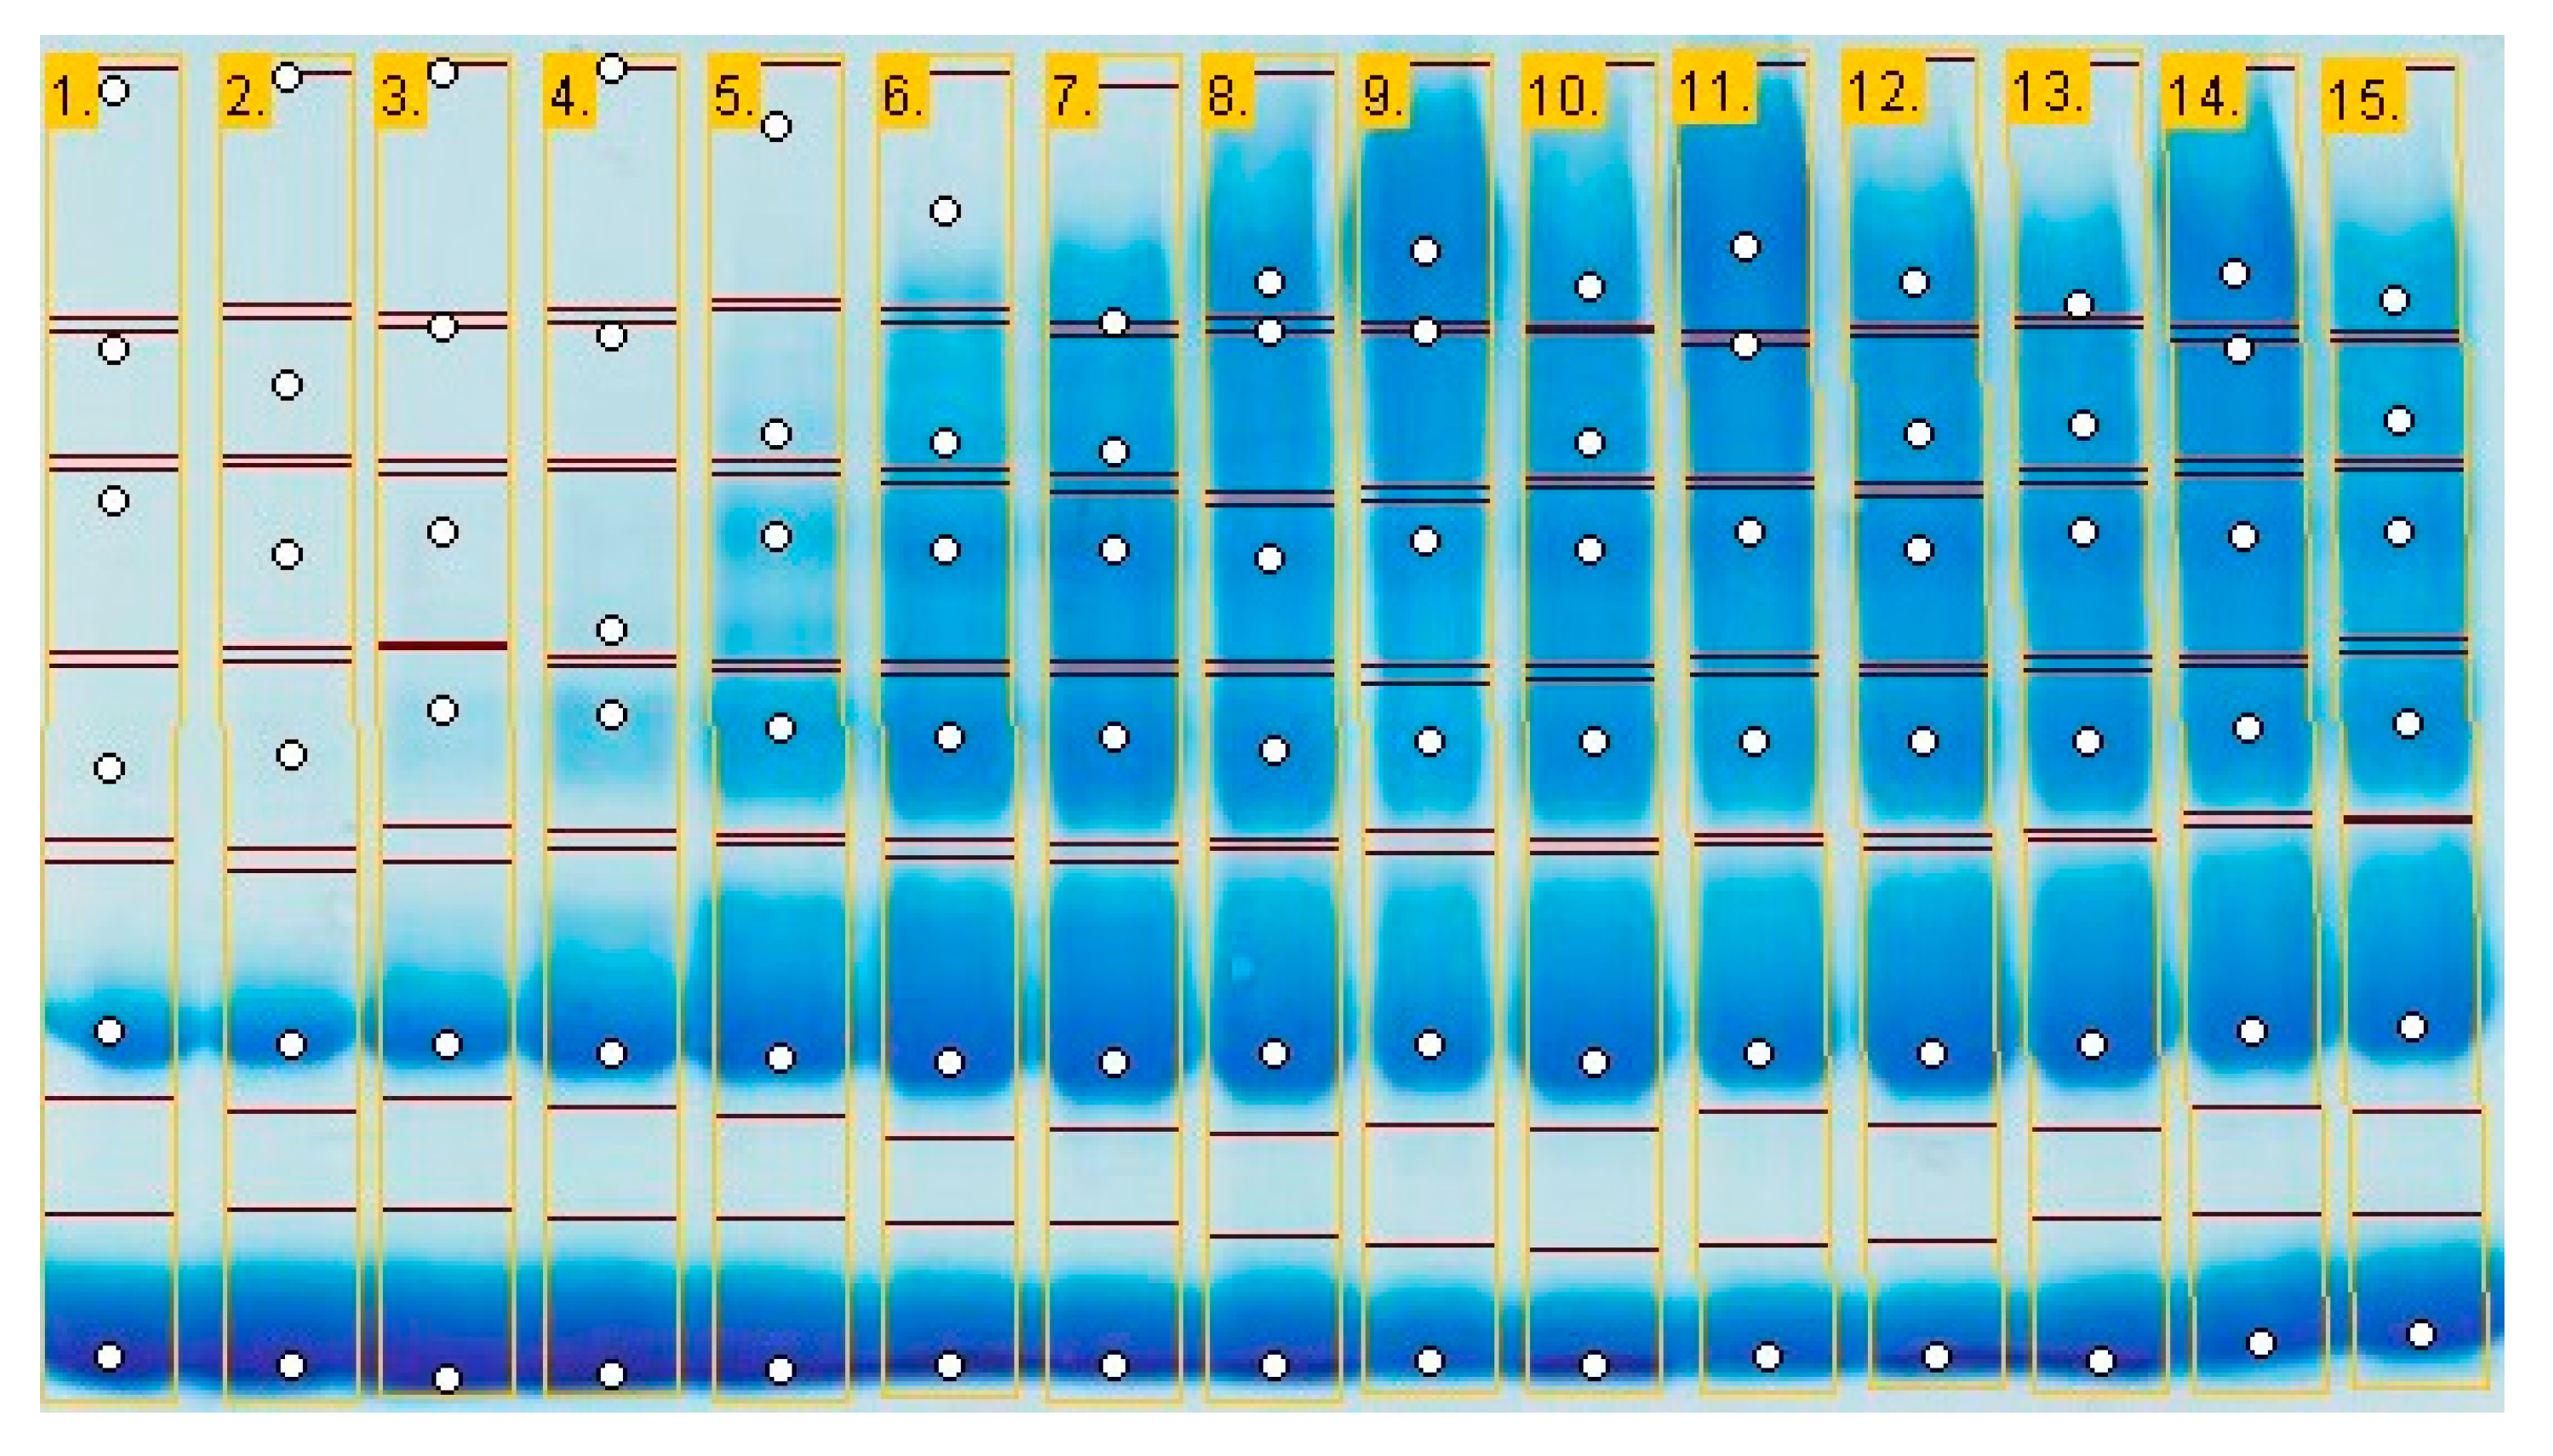
2.5. Efficiency on Protein Crosslinking (SDS-PAGE)
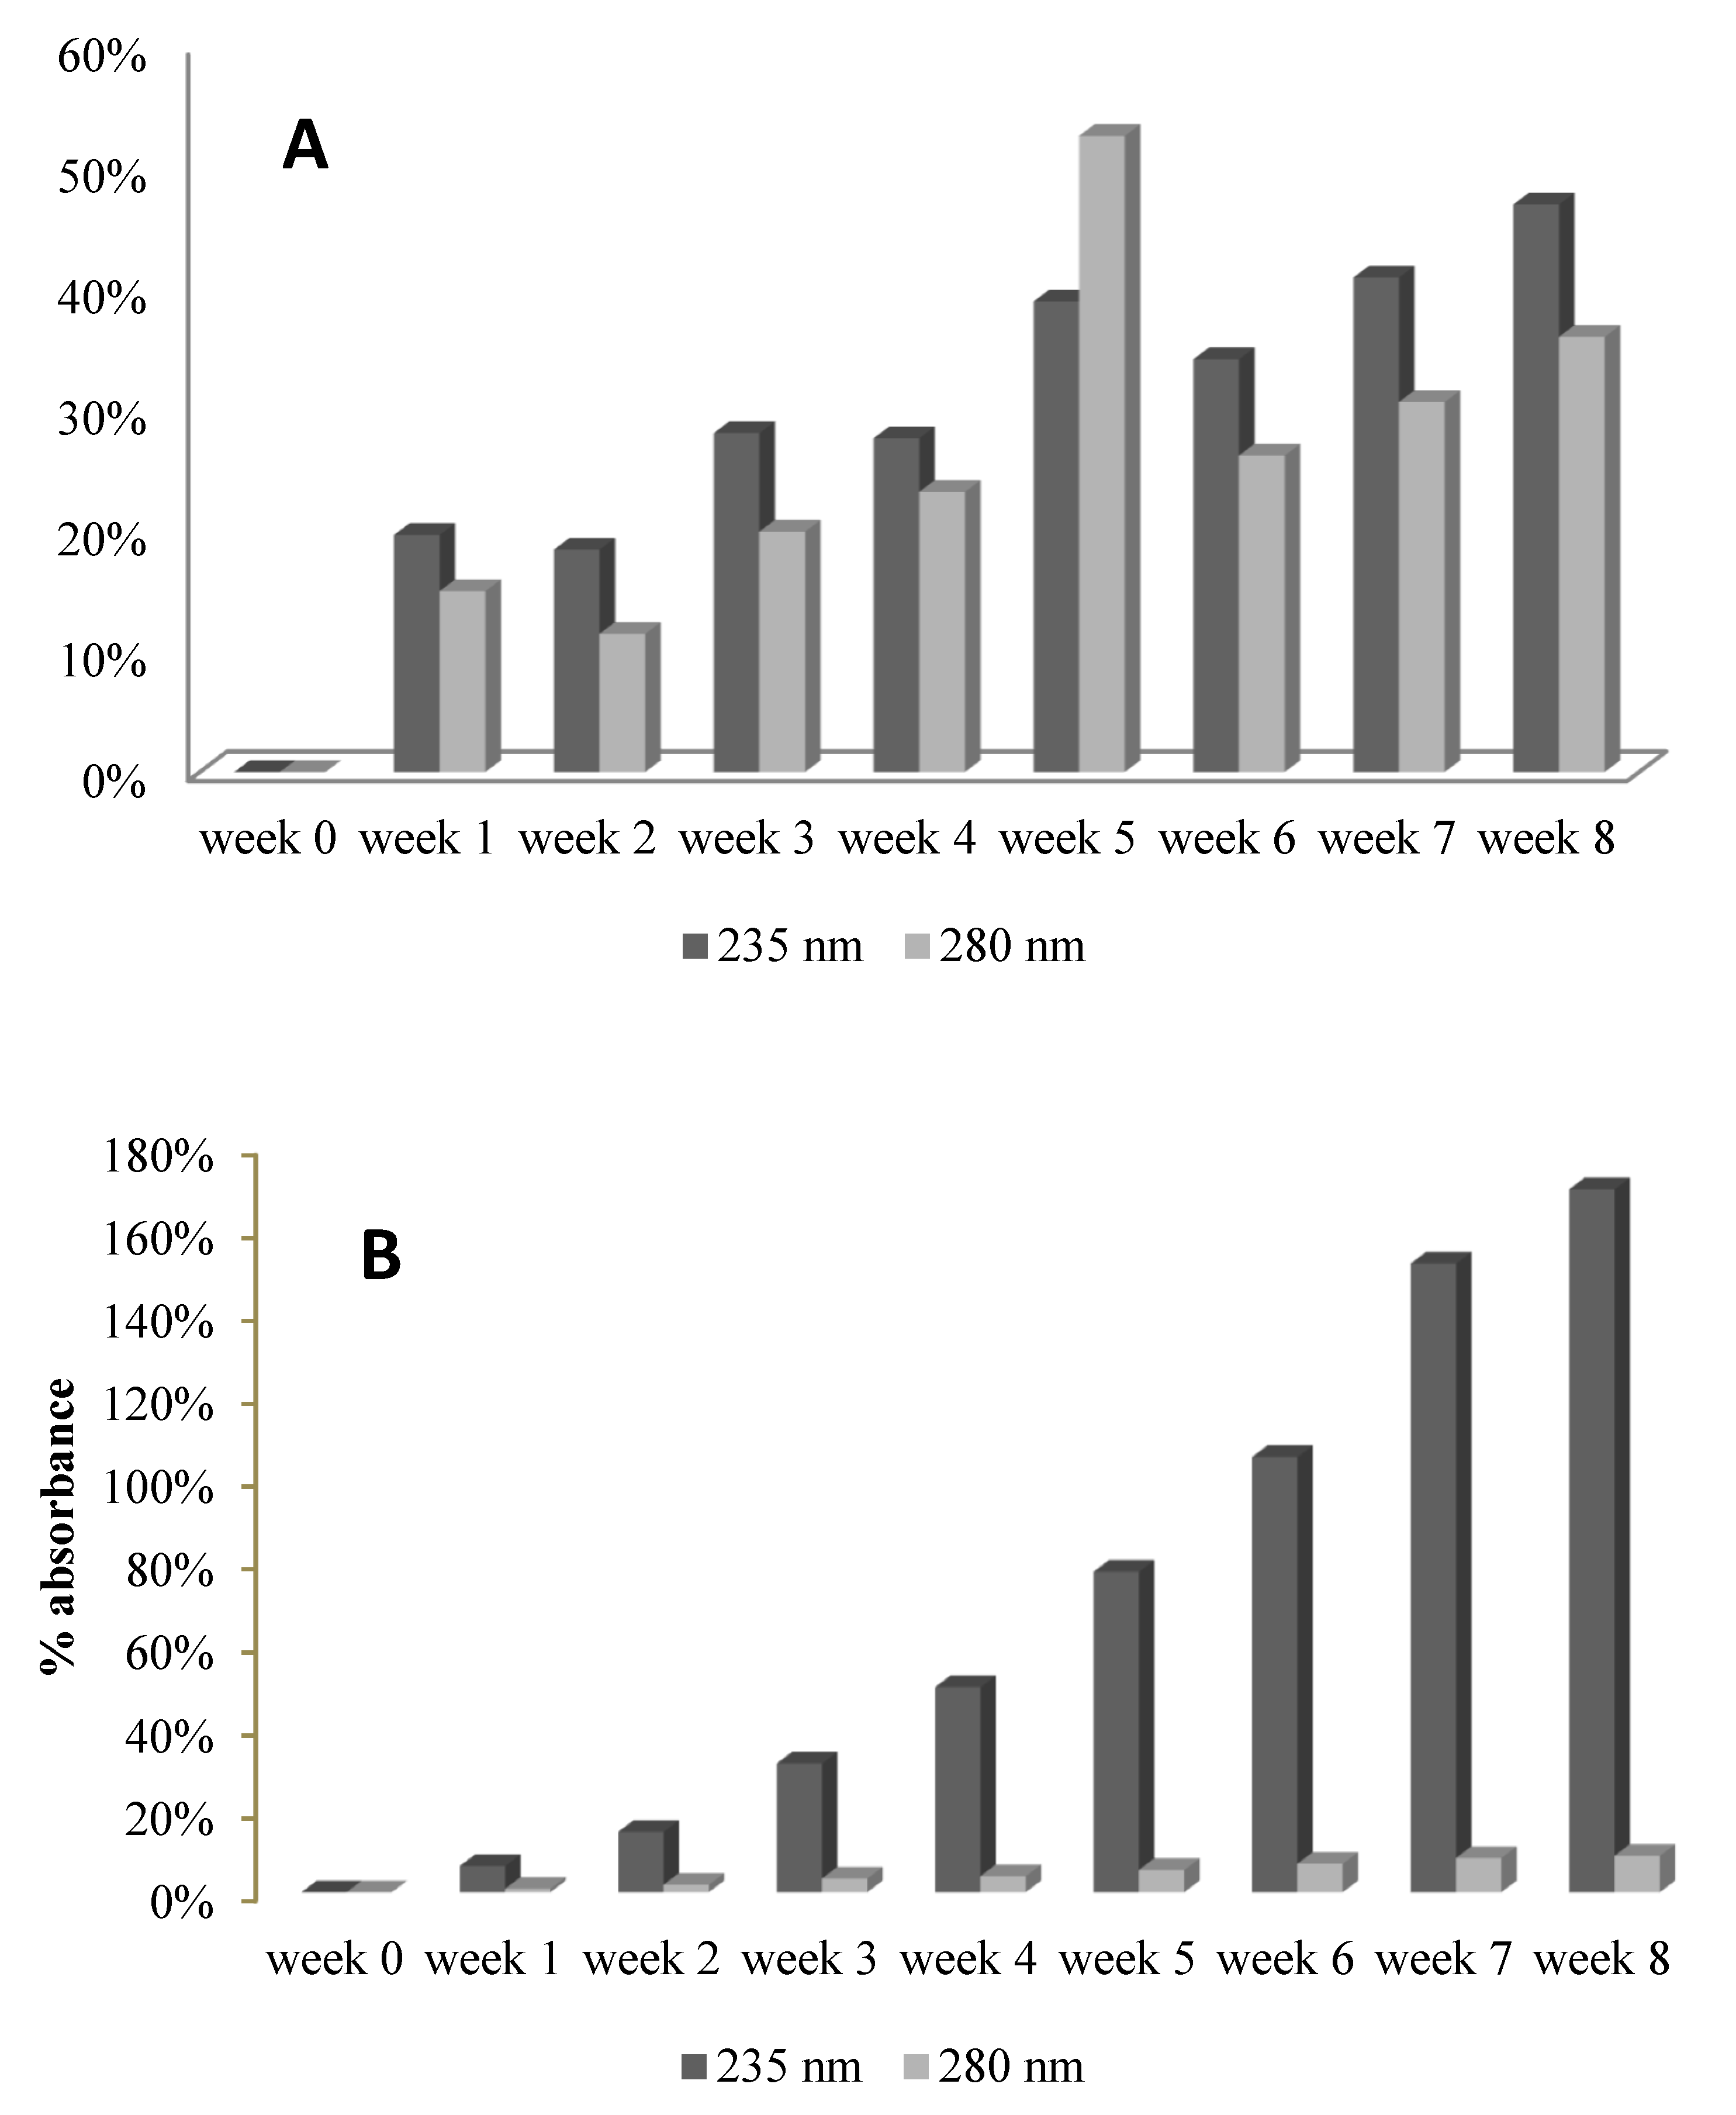
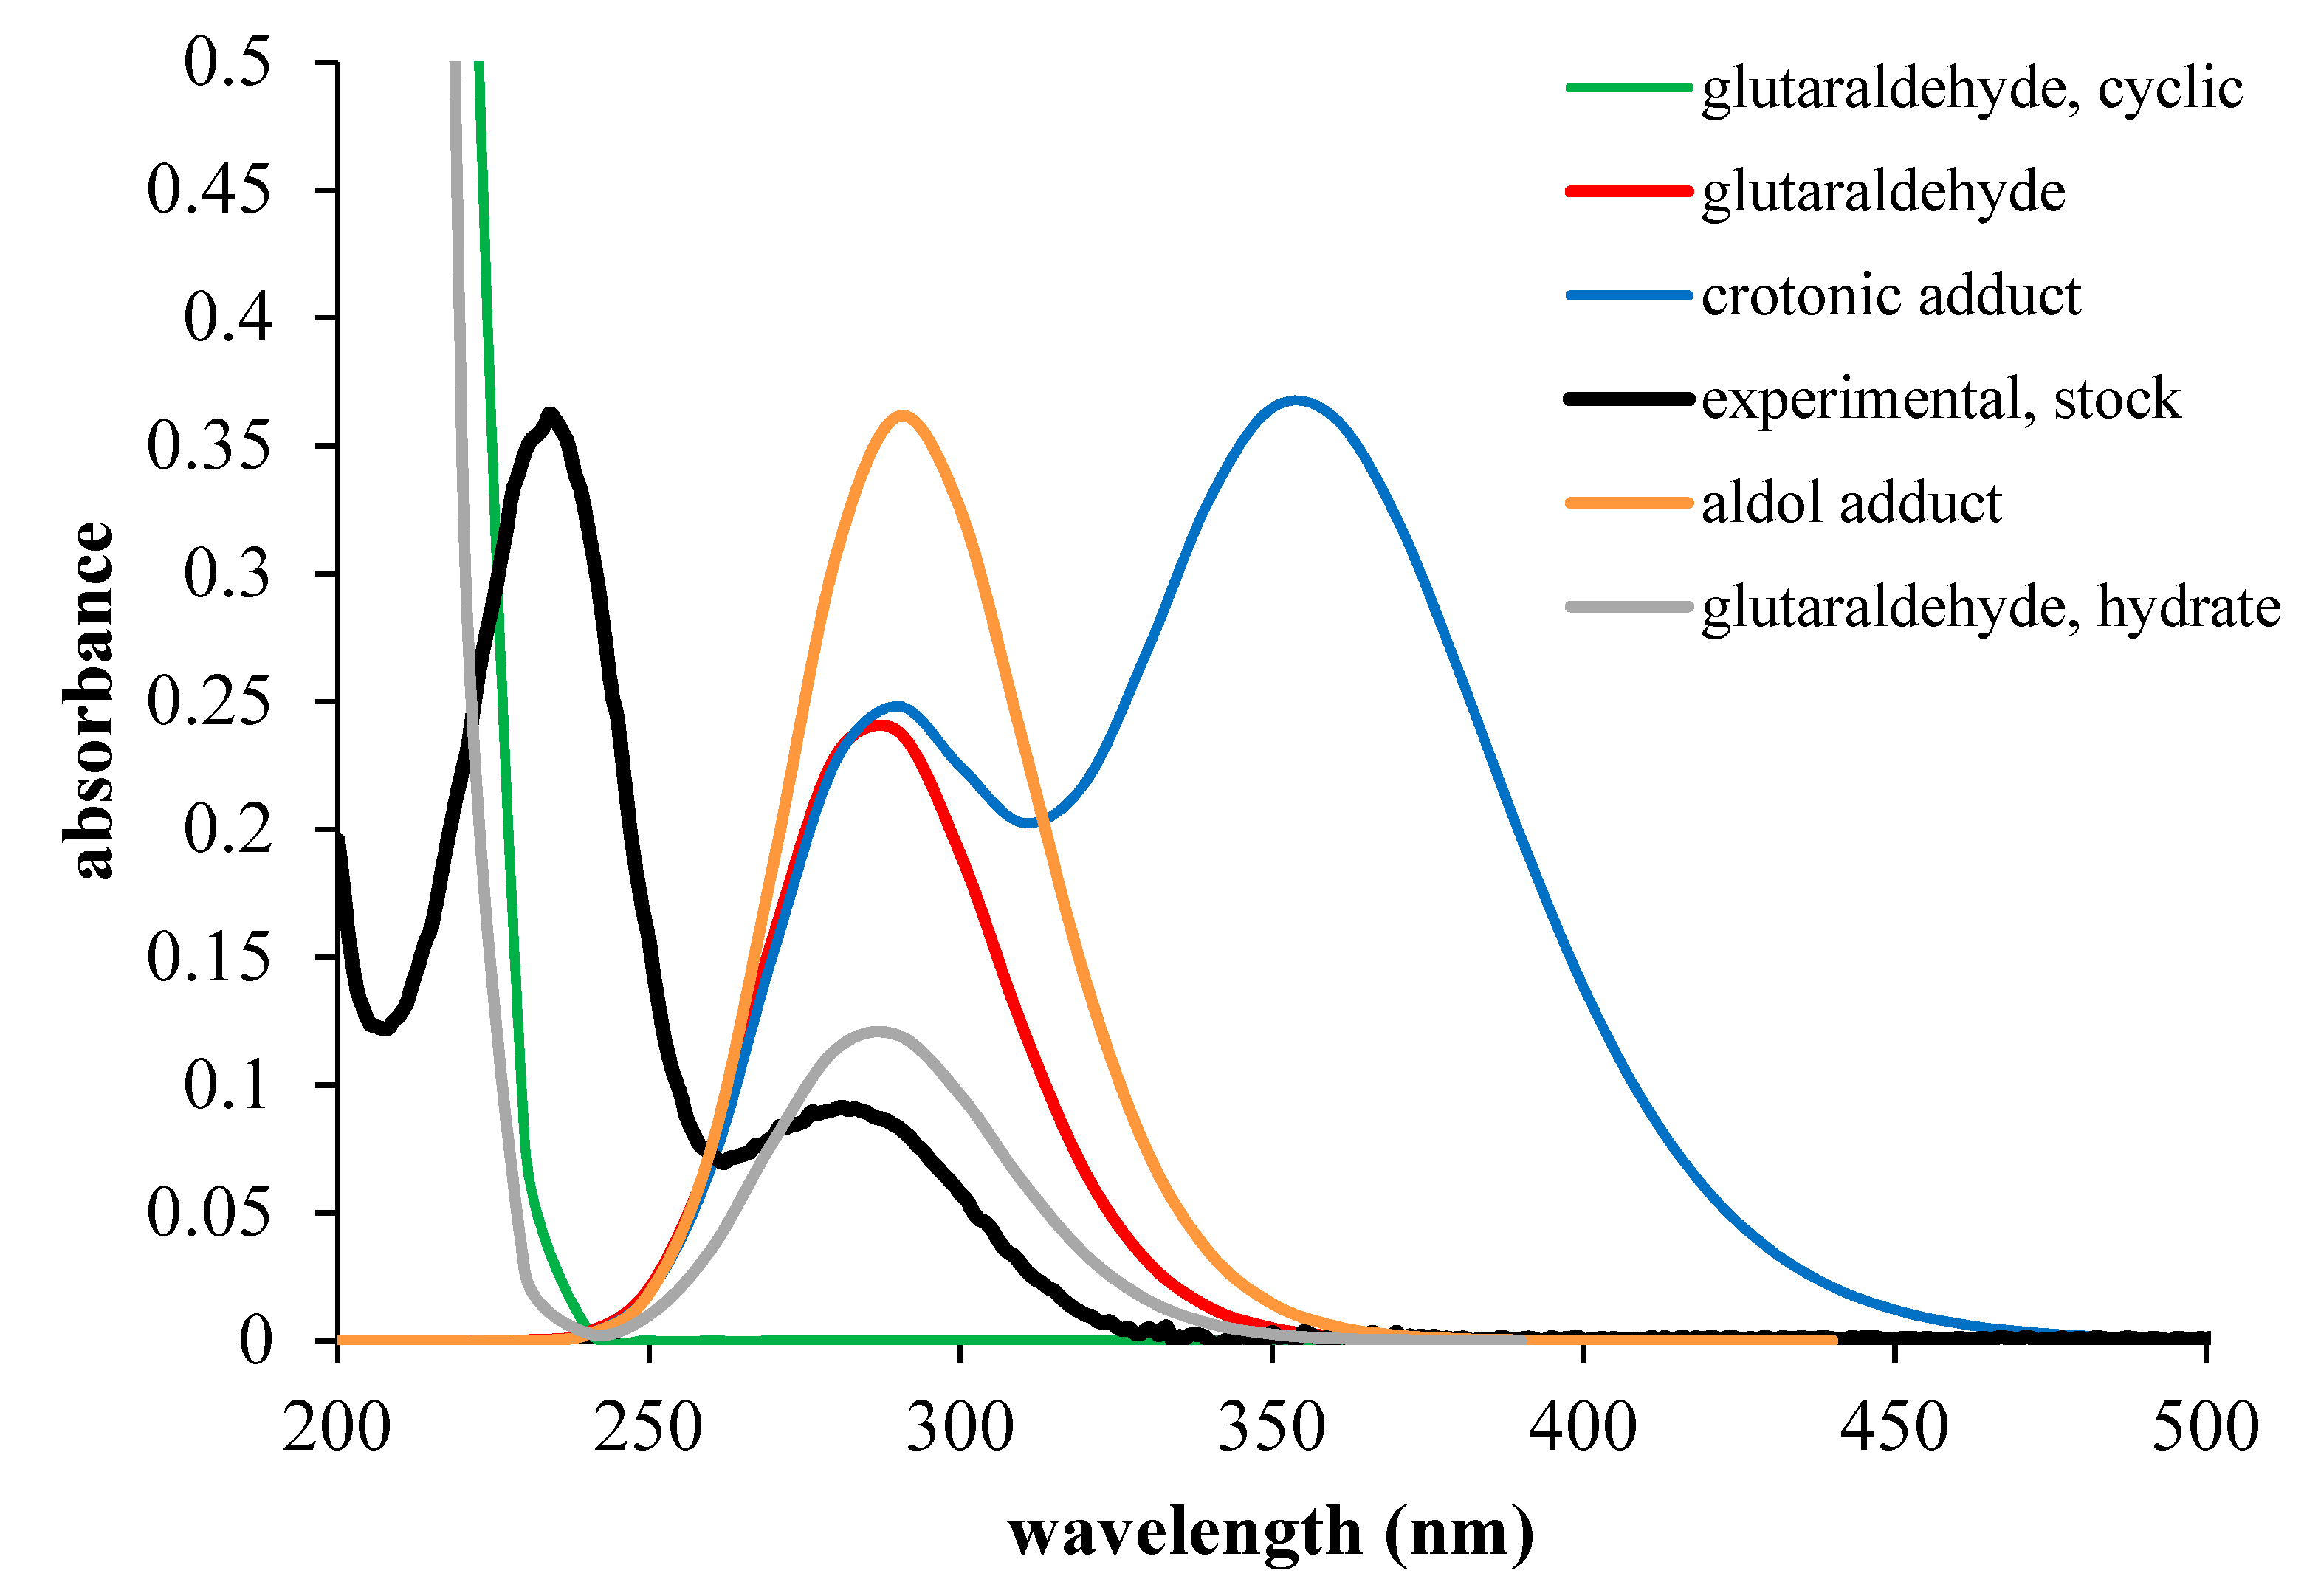
2.6. UV-VIS Spectra
3. Materials and Methods
4. Conclusions
Supplementary Materials
Author Contributions
Funding
Conflicts of Interest
Abbreviations
| MDPI | Multidisciplinary Digital Publishing Institute |
| DOAJ | Directory of open access journals |
| TLA | Three letter acronym |
| LD | linear dichroism |
References
- Ballantyne, B.; Jordan, S.L. Toxicological, medical and industrial hygiene aspects of glutaraldehyde with particular reference to its biocidal use in cold sterilization procedures. J. Appl. Toxicol. 2001, 21, 131–151. [Google Scholar] [CrossRef] [PubMed]
- Power, E.G.M.; Russell, A.D. Assessment of “Cold Sterilog Glutaraldehyde Monitor”. J. Hosp. Infect. 1988, 11, 376–380. [Google Scholar] [CrossRef]
- Gannon, P.F.; Bright, P.; Campbell, M.; O’Hickey, S.P.; Burge, P.S. Occupational asthma due to glutaraldehyde and formaldehyde in endoscopy and x ray departments. Thorax 2008, 50, 156–159. [Google Scholar] [CrossRef] [PubMed]
- Jolibois, B.; Guerbet, M.; Vassal, S. Glutaraldehyde in hospital wastewater. Arch. Environ. Contam. Toxicol. 2002, 42, 137–144. [Google Scholar] [CrossRef] [PubMed]
- Barnes, A.R. Determination of glutaraldehyde in solution as its bis-2,4-dinitrophenylhydrazone derivative; determination of geometrical isomer ratios. Pharm. Acta Helv. 1993, 68, 113–119. [Google Scholar] [CrossRef]
- Pieraccini, G.; Bartolucci, G.; Pacenti, M.; Dugheri, S.; Boccalon, P.; Focardi, L. Gas chromatographic determination of glutaraldehyde in the pentafluorobenzyl hydroxylamine on a solid-phase microextraction fibre. J. Chromatogr. A 2002, 955, 117–124. [Google Scholar] [CrossRef]
- Kang, H.I.; Shin, H.S. Determination of glutaraldehyde in water samples by headspace solid-phase microextraction and gas chromatography-mass spectrometry after derivatization with 2,2,2-trifluoroethylhydrazine. J. Chromatogr. A 2016, 1448, 115–120. [Google Scholar] [CrossRef]
- Kang, H.I.; Shin, H.S. Sensitive determination of glutaraldehyde in environmental water by derivatization and gas chromatography-mass spectrometry. Anal. Methods 2016, 8, 3216–3223. [Google Scholar] [CrossRef]
- Pranaityte, B.; Padarauskas, A.; Dikčius, A.; Ragauskas, R. Rapid capillary electrophoretic determination of glutaraldehyde in photographic developers using a cationic polymer coating. Anal. Chim. Acta 2004, 507, 185–190. [Google Scholar] [CrossRef]
- Shaw, J.; Frigerio, A. A Simple Method for Determination of Glutaraldehyde. J. Histochem. Citochemistry 1969, 17, 176–181. [Google Scholar]
- Isabelle, M.; Catherine, D.; Bertrand Michel, J.; Waldron Karen, C. Glutaraldehyde: Behavior in aqueous solution, reaction with proteins, and application to enzyme crosslinking. Biotechniques 2004, 37, 790–802. [Google Scholar]
- Scurtu, F.; Zolog, O.; Iacob, B.; Silaghi-Dumitrescu, R. Hemoglobin-albumin cross-linking with disuccinimidyl suberate (DSS) and/or glutaraldehyde for blood substitutes. Artif. Cells Nanomedicine Biotechnol. 2014, 42, 13–17. [Google Scholar] [CrossRef] [PubMed]
- Hospital Scandal Brings Down Romanian Pharma Co. Forbes. 2016. Available online: https://www.forbes.com/sites/stephenmcgrath/2016/0 (accessed on 20 April 2020).
- Romanian prosecutors make first arrest in the diluted disinfectants scandal | Romania Insider. Romania-Insider. 2016. Available online: https://www.romania-insider.com/first-arrest-diluted-disinfectants-scandal (accessed on 20 April 2020).
- Bowes, J.H.; Cater, C.W. The reaction of glutaraldehyde with proteins and other biological materials. J. R. Microsc. Soc. 1966, 85, 193–200. [Google Scholar] [CrossRef]
- Guthrie, J.P. Equilibrium constants for a series of simple aldol condensations, and linear free energy relations with other carbonyl addition reactions. Can. J. Chem. 1978, 56, 962–973. [Google Scholar] [CrossRef]
- Kurz, J.L. The Hydration of Acetaldehyde. I. Equilibrium Thermodynamic Parameters. J. Am. Chem. Soc. 1967, 89, 3524–3528. [Google Scholar] [CrossRef]
- Okuda, K.; Urabe, I.; Yamada, Y.; Okada, H. Reaction of glutaraldehyde with amino and thiol compounds. J. Ferment. Bioeng. 1991, 71, 100–105. [Google Scholar] [CrossRef]
- Korn, A.H.; Feairheller, S.H.; Filachoine, E.M. Glutaraldehyde: Nature of the reagent. J. Mol. Biol. 1972, 65, 525–529. [Google Scholar] [CrossRef]
- Hathazi, D.; Mot, A.C.; Vaida, A.; Scurtu, F.; Lupan, I.; Fischer-Fodor, E.; Damian, G.; Kurtz, D.M., Jr.; Silaghi-Dumitescu, R. Oxidative protection of hemoglobin and hemerythrin by cross-linking with a nonheme iron peroxidase: Potentially improved oxygen carriers for use in blood substitutes. Biomacromolecules 2014, 15, 1920–1927. [Google Scholar]
- Arkosi, M.; Scurtu, F.; Vulpoi, A.; Silaghi-Dumitrescu, R.; Kurtz, D.M., Jr. Copolymerization of Recombinant P. gouldii Hemerythrin with Human Serum Albumin for Use in Blood Substitutes. Artif. Cells Blood Substitutes Biotechnol. 2017, 45, 218–223. [Google Scholar] [CrossRef]
- Silva, C.J.S.M.; Sousa, F.; Gübitz, G.; Cavaco-Paulo, A. Chemical Modifications on Proteins Using Glutaraldehyde. Food Technol. Biotechnol. 2004, 42, 51–56. [Google Scholar]
- Alayash, A.I.; Summers, A.G.; Wood, F.; Jia, Y. Effects of glutaraldehyde polymerization on oxygen transport and redox properties of bovine hemoglobin. Arch Biochem Biophys. 2001, 391, 225–234. [Google Scholar] [CrossRef]
- Attia, A.A.A.; Cioloboc, D.; Lupan, A.; Silaghi-Dumitrescu, R. Multiconfigurational and DFT analyses of the electromeric formulation and UV–vis absorption spectra of the superoxide adduct of ferrous superoxide reductase. J. Inorg. Biochem. 2016, 165, 49–53. [Google Scholar] [CrossRef] [PubMed]
- Everette, J.D.; Bryant, Q.M.; Green, A.M.; Abbey, Y.A.; Wangila, G.W.; Walker, R.B. Thorough study of reactivity of various compound classes toward the folin-Ciocalteu reagent. J. Agric. Food Chem. 2010, 58, 8139–8144. [Google Scholar] [CrossRef] [PubMed]
- Mot, A.C.C.; Bischin, C.; Muresan, B.; Parvu, M.; Damian, G.; Vlase, L.; Silaghi-Dumitrescu, R. Antioxidant activity evaluation by physiologically relevant assays based on haemoglobin peroxidase activity and cytochrome c-induced oxidation of liposomes. Nat. Prod. Res. 2016, 30, 1315–1319. [Google Scholar] [CrossRef] [PubMed]
- Silaghi-Dumitrescu, R.; Tomoiaga, N.; Jurco, E. Variability in biochemical composition of milk among three representative breeds of dairy cows from Romania. Stud. Univ. Babes-Bolyai Chem. 2018, 63, 55–62. [Google Scholar] [CrossRef]
- Frisch, M.J.; Trucks, G.W.; Schlegel, H.B.; Scuseria, G.E.; Robb, M.A.; Cheeseman, J.R.; Scalmani, G.; Barone, V.; Mennucci, B.; Petersson, G.A.; et al. Gaussian 09, Gaussian 09 r. A1; Gaussian, Inc.: Wallingford CT, UK, 2009. [Google Scholar]


| T (K) | ΔS (kcal/mol*K) | ΔH (kcal/mol) | ΔG (kcal/mol) |
|---|---|---|---|
| 293 | −0.02 | −7.78 | −1.27 |
| 323 | −0.60 | ||
| 343 | −0.15 |
| Sample | Peak 1 (Rf/rel. area) | Peak 2 (Rf/rel. area) | Notable MS Signals in Peak 1 | Notable MS Signals in Peak 2 |
|---|---|---|---|---|
| GA control, 0.3 M | 0.573/100 | 0.855/41 | 101 (GA), 119 (II), 165 (VI/X minus water), 183 (VI/X, or IX minus water) | N.D.a |
| GA 0.3 M incubated 4 weeks at 40 °C | 0.632/5 | 0.829/100 | N.D.a | 201 (IX), N.D.a |
| GA control, 2.5 M | 0.581/100 | 0.837/20 | 101 (GA), 165 (VI/X minus water), 183 (VI/X, or IX minus water) | 101 (GA), 119 (II), 183 (VI/X), or IX minus water), N.D.a |
| GA 2.5 M, incubated for 5 h at 70 °C | 0.581/100 | 0.837/18 | 101 (GA), 165 (VI/X minus water), 183 (VI/X, or IX minus water) | 101 (GA), 183 (VI/X, or IX minus water), N.D.a |
| Sample / ≈MW (kDA) | 250 | 130 | 100 | 70 | 55 | 35 |
|---|---|---|---|---|---|---|
| 0 mM GA | 0 | 0 | 0 | 0.01 | 0.49 | 1 |
| 0.5 mM GA | 0.01 | 0 | 0.01 | 0.06 | 0.61 | 1 |
| 1 mM GA | 0 | 0 | 0.03 | 0.18 | 0.81 | 1 |
| 3 mM GA | 0 | 0.05 | 0.34 | 0.49 | 1 | 0.82 |
| 5 mM GA | 0.08 | 0.43 | 0.65 | 0.56 | 1 | 0.67 |
| 7 mM GA | 0.28 | 0.51 | 0.68 | 0.58 | 1 | 0.67 |
| 3 mM GA, RT, week 8 | 0.65 | 0.64 | 0.58 | 0.57 | 1 | 0.77 |
| 5 mM GA, RT, week 8 | 1 | 0.6 | 0.52 | 0.36 | 0.75 | 0.52 |
© 2020 by the authors. Licensee MDPI, Basel, Switzerland. This article is an open access article distributed under the terms and conditions of the Creative Commons Attribution (CC BY) license (http://creativecommons.org/licenses/by/4.0/).
Share and Cite
Matei, A.; Puscas, C.; Patrascu, I.; Lehene, M.; Ziebro, J.; Scurtu, F.; Baia, M.; Porumb, D.; Totos, R.; Silaghi-Dumitrescu, R. Stability of Glutaraldehyde in Biocide Compositions. Int. J. Mol. Sci. 2020, 21, 3372. https://doi.org/10.3390/ijms21093372
Matei A, Puscas C, Patrascu I, Lehene M, Ziebro J, Scurtu F, Baia M, Porumb D, Totos R, Silaghi-Dumitrescu R. Stability of Glutaraldehyde in Biocide Compositions. International Journal of Molecular Sciences. 2020; 21(9):3372. https://doi.org/10.3390/ijms21093372
Chicago/Turabian StyleMatei, Alina, Cristina Puscas, Iulia Patrascu, Maria Lehene, Julia Ziebro, Florina Scurtu, Monica Baia, Dan Porumb, Robert Totos, and Radu Silaghi-Dumitrescu. 2020. "Stability of Glutaraldehyde in Biocide Compositions" International Journal of Molecular Sciences 21, no. 9: 3372. https://doi.org/10.3390/ijms21093372
APA StyleMatei, A., Puscas, C., Patrascu, I., Lehene, M., Ziebro, J., Scurtu, F., Baia, M., Porumb, D., Totos, R., & Silaghi-Dumitrescu, R. (2020). Stability of Glutaraldehyde in Biocide Compositions. International Journal of Molecular Sciences, 21(9), 3372. https://doi.org/10.3390/ijms21093372