Article

The Effects of Human BDH2 on the Cell Cycle, Differentiation, and Apoptosis and Associations with Leukemia Transformation in Myelodysplastic Syndrome

1
Division of Hematology and Medical Oncology, Department of Internal Medicine, E-DA Hospital, Kaohsiung 824, Taiwan
2
Faculty of School of Medicine, College of Medicine, I-Shou University, Kaohsiung 824, Taiwan
3
Department of Laboratory Medicine, Kaohsiung Medical University Hospital, Kaohsiung 807, Taiwan
4
Department of Medical Laboratory Science and Biotechnology, Kaohsiung Medical University, Kaohsiung 807, Taiwan
5
Department of Pathology, Kaohsiung Medical University Hospital, Kaohsiung 807, Taiwan
6
School of Medicine, China Medical University, Taichung 404, Taiwan
7
Trauma and Emergency Center, China Medical University Hospital, Taichung 404, Taiwan
*
Author to whom correspondence should be addressed.
Int. J. Mol. Sci. 2020, 21(9), 3033; https://doi.org/10.3390/ijms21093033
Submission received: 18 March 2020 / Revised: 22 April 2020 / Accepted: 23 April 2020 / Published: 25 April 2020
(This article belongs to the Special Issue Advances in Molecular Biology and Targeted Therapy of Leukemias 2.0)

Abstract

:
Iron overload is related to leukemia transformation in myelodysplastic syndrome (MDS) patients. Siderophores help to transport iron. Type 2-hydroxybutyrate dehydrogenase (BDH2) is a rate-limiting factor in the biogenesis of siderophores. Using qRT-PCR, we analyze BDH2mRNA expression in the bone marrow (BM) of 187 MDS patients, 119 de novo acute myeloid leukemia (AML) patients, and 43 lymphoma patients with normal BM. Elevated BDH2mRNA expression in BM is observed in MDS patients (n = 187 vs. 43, normal BM; P = 0.009), and this is related to ferritin levels. Patients with higher BDH2 expression show a greater risk of leukemia progression (15.25% vs. 3.77%, lower expression; P = 0.017) and shorter leukemia-free-survival (medium LFS, 9 years vs. 7 years; P = 0.024), as do patients with a ferritin level ≥350 ng/mL. Additionally, we investigate the mechanisms related to the prognostic ability of BDH2 by using BDH2-KD THP1. The cell cycle analysis, surface markers, and special stain studies indicate that BDH2-KD induces differentiation and decreases the growth rate of THP1 cells, which is associated with the retardation of the cell cycle. Moreover, many genes, including genes related to mitochondrial catabolism, oncogenes, tumor suppressor genes, and genes related to cell differentiation and proliferation influence BDH2-KD THP1 cells. Herein, we demonstrate that BDH2 is involved in cell cycle arrest and the inhibition of differentiation in malignant cells. Furthermore, the high BDH2 expression in MDS patients could be suggestive of a poor prognostic factor. This study provides a foundation for further research on the roles of BDH2 and iron metabolism in the pathogenesis of MDS.

1. Introduction

Myelodysplastic syndrome (MDS) is a heterogeneous group of clonal hematopoietic stem cell disorders characterized by ineffective hematopoiesis, leading to unilineage and multilineage cytopenias and dysplasia. This disease can progress from cytopenia(s) to acute myeloid leukemia (AML) through several intermediate subtypes [1,2,3,4,5]. Although several genes and splicing pathway mutations, as well as cytogenetic changes, have been reported to be associated with MDS, including mutations of RAS, TP53, RUNX1, ASXL1, c-CBL, DNMT3A, TET2, EZH2, U2AF1, U2AF35, ZRSR2, SRSF2, and SF3B [6,7,8,9,10], the genetic changes associated with the pathogenesis of MDS still remain unclear.
Anemia resulting from multiple blood transfusion induced iron accumulation [11,12] or related to growth differentiation factor-11 (GDF11), GDF15, and hepcidin [13,14,15] is one of the characteristics of MDS [16]. Excess iron in MDS patients is associated with multiple organ damage and is responsible for an increased leukemia transformation rate [14,17], as well as shortened leukemia-free survival (LFS) and overall survival (OS) [18,19].
Lipocalin (LCN2) 24p3 is an iron-trafficking protein that requires small-molecular-weight iron-chelating compounds to sequester iron [20,21]. Devireddy et al. reported that the 24p3-associated mammalian siderophore 2,5-dihydroxybenzoic acid (2,5-DHBA) [22,23] is catalyzed by the enzyme cytosolic type 2-hydroxybutyrate dehydrogenase (BDH2) [23,24] and is related to LCN2 24p3-mediated iron transport and apoptosis [23]. The key physiological implication of BDH2 is that iron-mediated post-transcriptional regulation of human BDH2 controls mitochondrial iron homeostasis in human cells [25]. We observed that BDH2 expression is an independent poor prognostic factor for cytogenetically normal AML (CN-AML), as it plays an anti-apoptotic role [26]. In the present study, we investigated whether BDH2 can serve as a prognostic marker for MDS and act as a predictor for the progression of leukemia. Furthermore, we used THP1, an acute myelomonocytic leukemia cell line, to present the possible mechanism of BDH2-related leukemia transformation in vitro. The THP1 cell line has been used for MDS and AML research in many fields [27,28,29].

2. Results

2.1. Patient Characteristics

We enrolled 318 patients, including 199 newly diagnosed MDS patients and 119 de novo AML patients, at Kaohsiung Medical University, Chung-Ho Memorial Hospital, Taiwan, from 2001 to 2012, and they were reviewed until the end of 2019. We also enrolled 40 normal controls. The characteristics of patients are shown in Table 1. A total of 187 MDS patients with good mRNA quality were examined, including 114 patients with low BDH2 mRNA expression (BDH2Low) and 73 patients with high BDH2 mRNA expression (BDH2High). The patients in both groups were well-matched for age and gender. Patients were classified based on World Health Organization (WHO) criteria and Revised International Prognostic Scoring System (IPSS-R) scores. The patients in the MDS, de novo AML, and normal BM control groups were well-matched with regard to gender distribution. The median ages of patients with MDS, de novo AML, and normal BM were 64.47 (19–88), 60 (21–88), and 55 (32–65) years old, respectively.

2.2. Expression of BDH2 and LCN2 in MDS and Control Patients

The expression of BDH2mRNA was significantly elevated in MDS patients, especially those who were high risk (RAEB-1and RAEB-2), compared to patients with normal bone marrow (BM) (P = 0.009). Further, the expression of BDH2mRNA was higher in de novo AML patients than in MDS patients (p < 0.001; Figure 1A). Conversely, LCN2mRNA expression was significantly lower in MDS patients compared with the normal population, and it reduced further with an increase in blast cells. LCN2mRNA expression levels were significantly lower in de novo AML BM samples than in those of MDS patients and the normal population (p < 0.001; Figure 1B). It was also noted that LCN2mRNA expression was higher in patients with low BDH2 expression (P = 0.015; Figure S1). However, no significant correlation was observed between BDH2 and LCN2 mRNA expression levels in the BM of MDS patients (P = 0.816; Figure S2). According to the IPSS-R prognostic scores, BDH2mRNA expression levels were higher in high- and very high-risk MDS patients than in low-risk patients (Table 1).
We analyzed 13 patients using BM samples preserved at different stages of MDS. Of these, four patients showed increases in BDH2 mRNA expression under progress. Others showed a mild decrease or no change in BHD2 mRNA expression during disease progression (Figure S3).

2.3. BDH2 Expression Is Related to Ferritin Levels

Ferritin levels were available for 115 MDS patients at time of diagnosis before they underwent repeated blood transfusions. Plasma ferritin levels showed no significant linear relationship with the mRNA expression levels of BDH2 and LCN2 (Figure S4A) However, we observed that serum ferritin levels were higher in patients belonging to the high BDH2mRNA expression group (P = 0.02; Table 1 and Figure S4B).

2.4. Prognosis, BDH2 Expression, and Ferritin

Patients in the BDH2High group showed a higher risk (15%) for leukemia progression during a long-term follow-up period than patients in the BDH2Low group (3.81%) (P = 0.017; Table 1). Further, patients in the BDH2Low group had a longer LFS than those in the BDH2High group, with medium LFS of 9 and 7 years, respectively (P = 0.024; Figure 2A), but they did not have a longer OS (P = 0.121; Figure 2B). It is noteworthy that the leukemia transformation rate is related to subtypes of MDS (refractory anemia with ringed sideroblasts (RARS): 0%; refractory anemia (RA): 2%; refractory anemia with excess blasts (RAEB)1: 11.11%; RAEB2: 20.51%; myelodysplastic syndrome/myeloproliferative neoplasm (MDS/MPN): 8.33%; P = 0.002). We found that the leukemia transformation rate was higher in the BDH2High group in each subtype, except for RARS and MDS/MPN patients (BDH2High vs. BDH2Low group: 0 vs. 0 in RARS; 6.25% vs. 0 in RA; 25% vs. 0 in RAEB1; 20% vs. 21.05% in RAEB2; 0 vs. 9.09% in MDS/MPN).Greenberg et al. defined the ferritin level as a survival predictor with a cut-off value of 350 ng/mL [30]. Patients with serum ferritin <350 ng/mL had a trend toward having a longer LFS and significantly improved OS, with medium OS of 8.8 years and LFS of 2.6 years, respectively (Figure 2C,D).

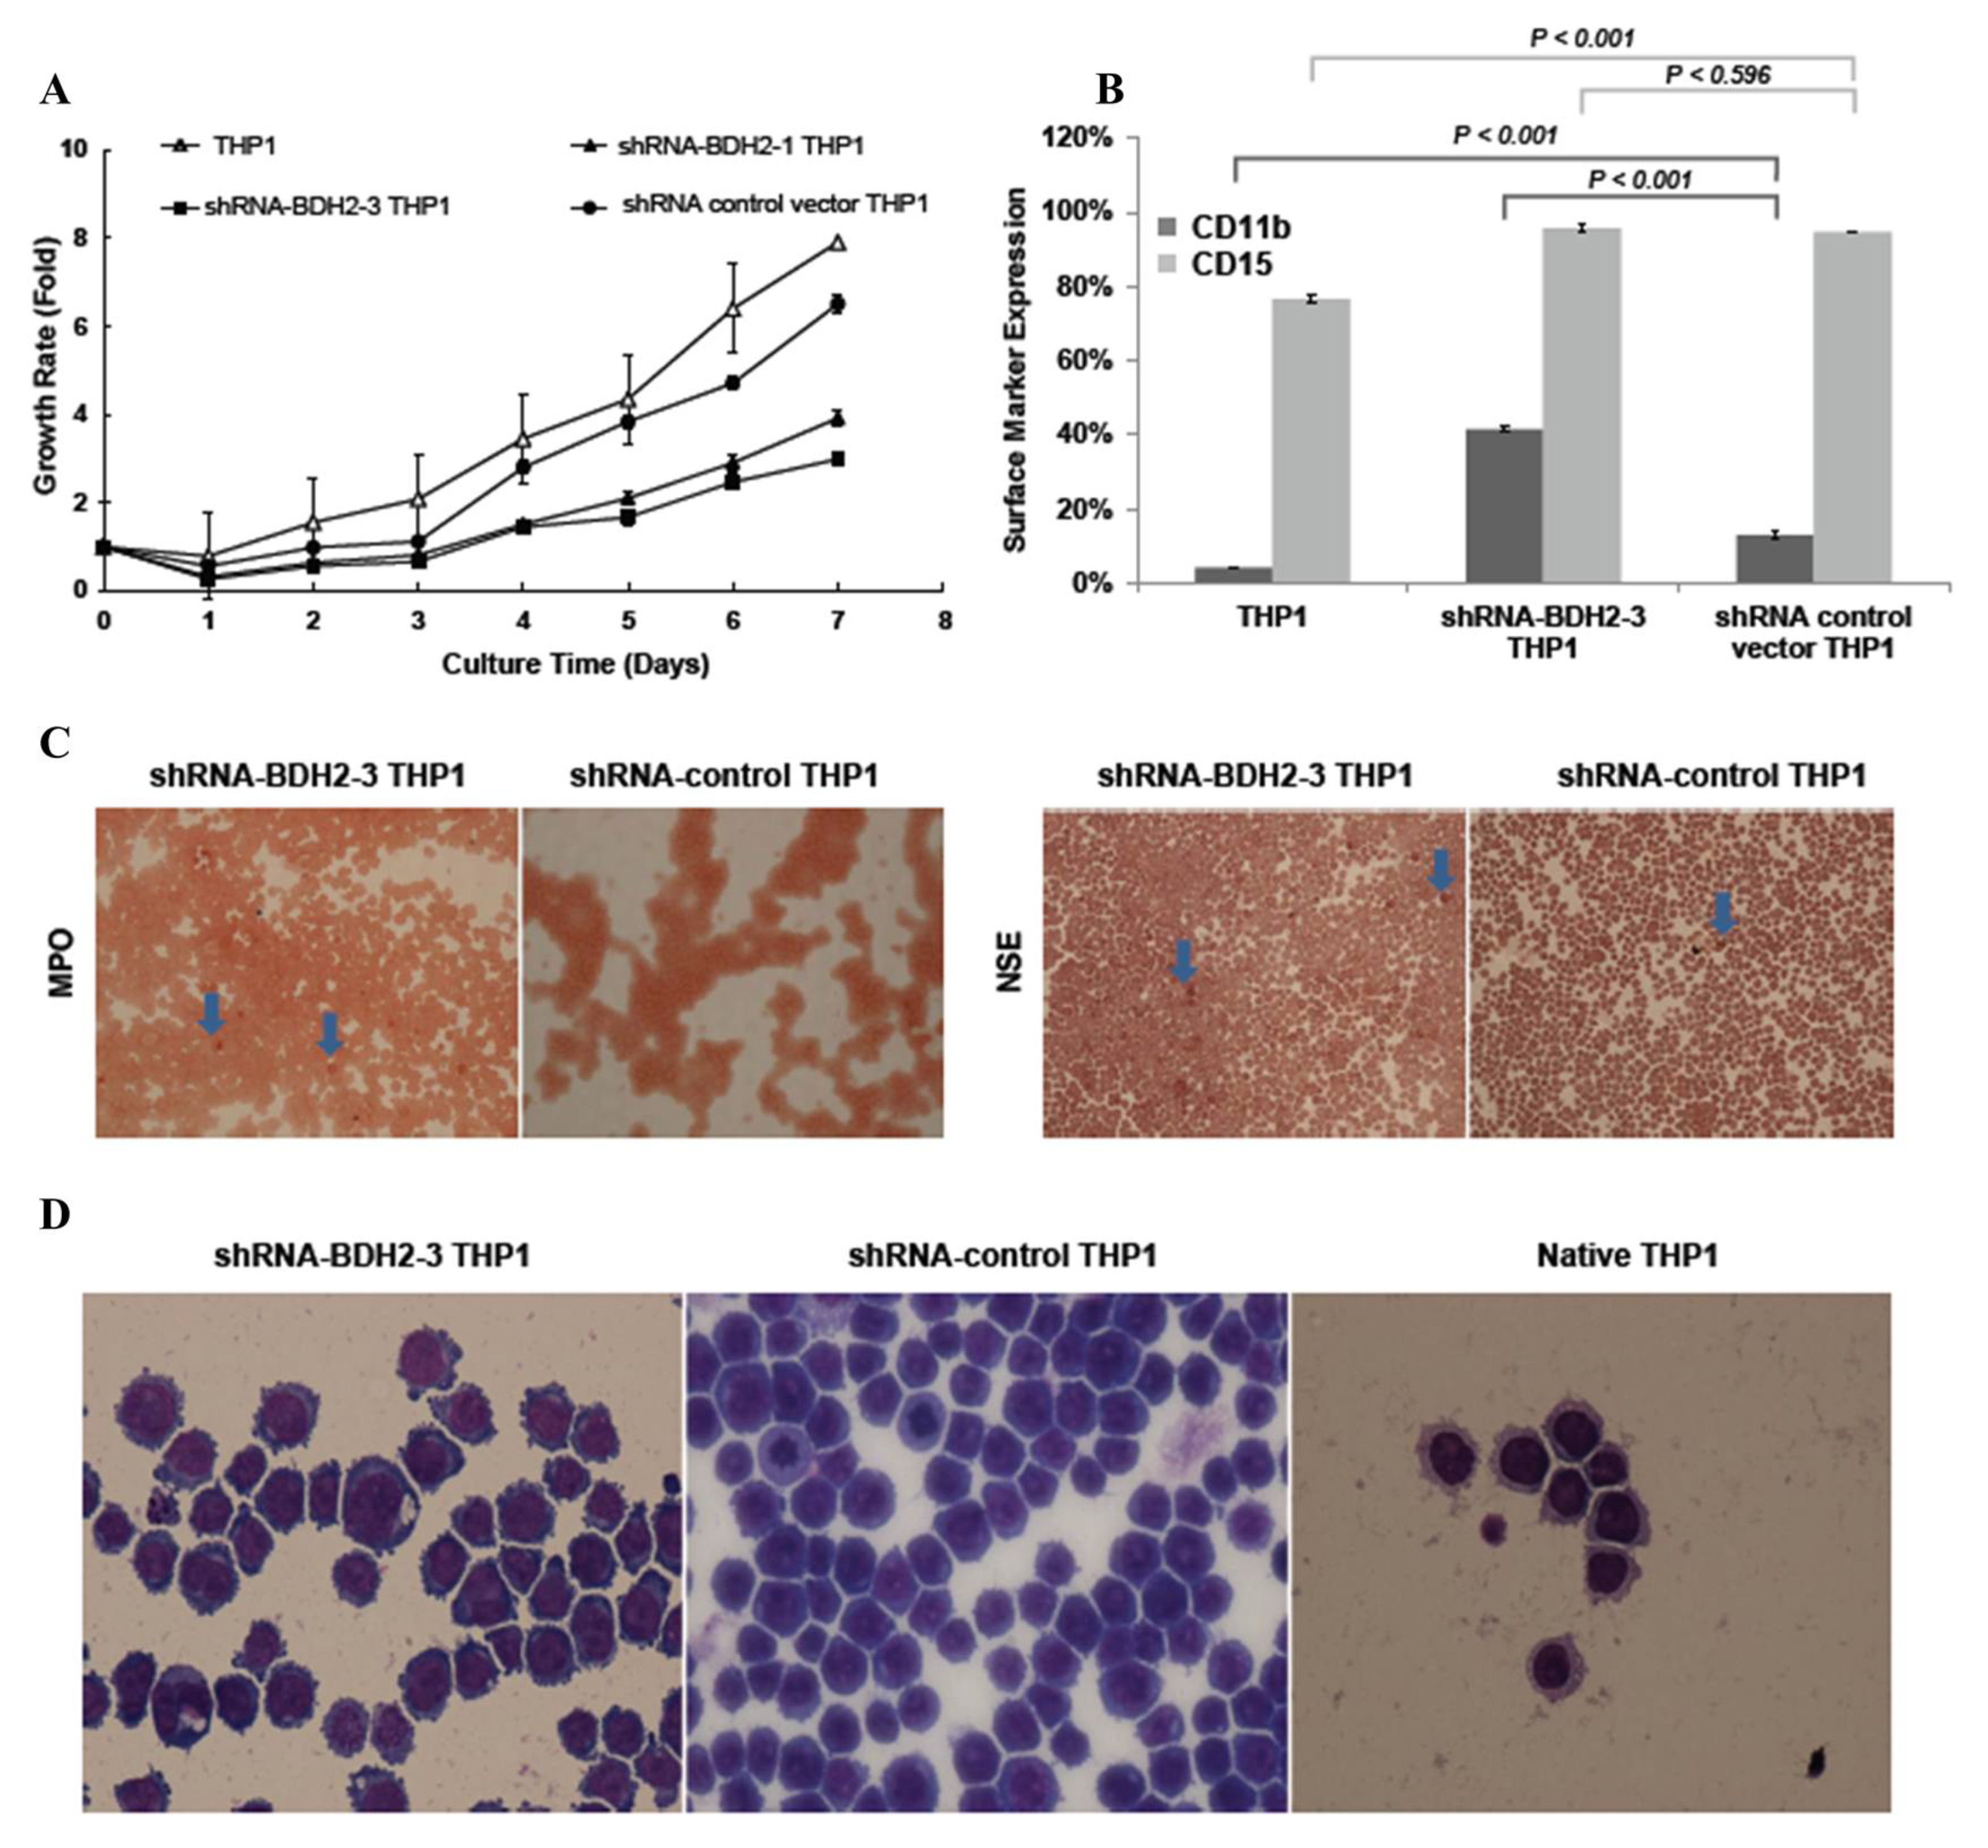
2.5. BDH2 Knockdown (KD) THP1 Showed a Slow Growth Rate Related to Cell Differentiation and Cell Cycle Retardation

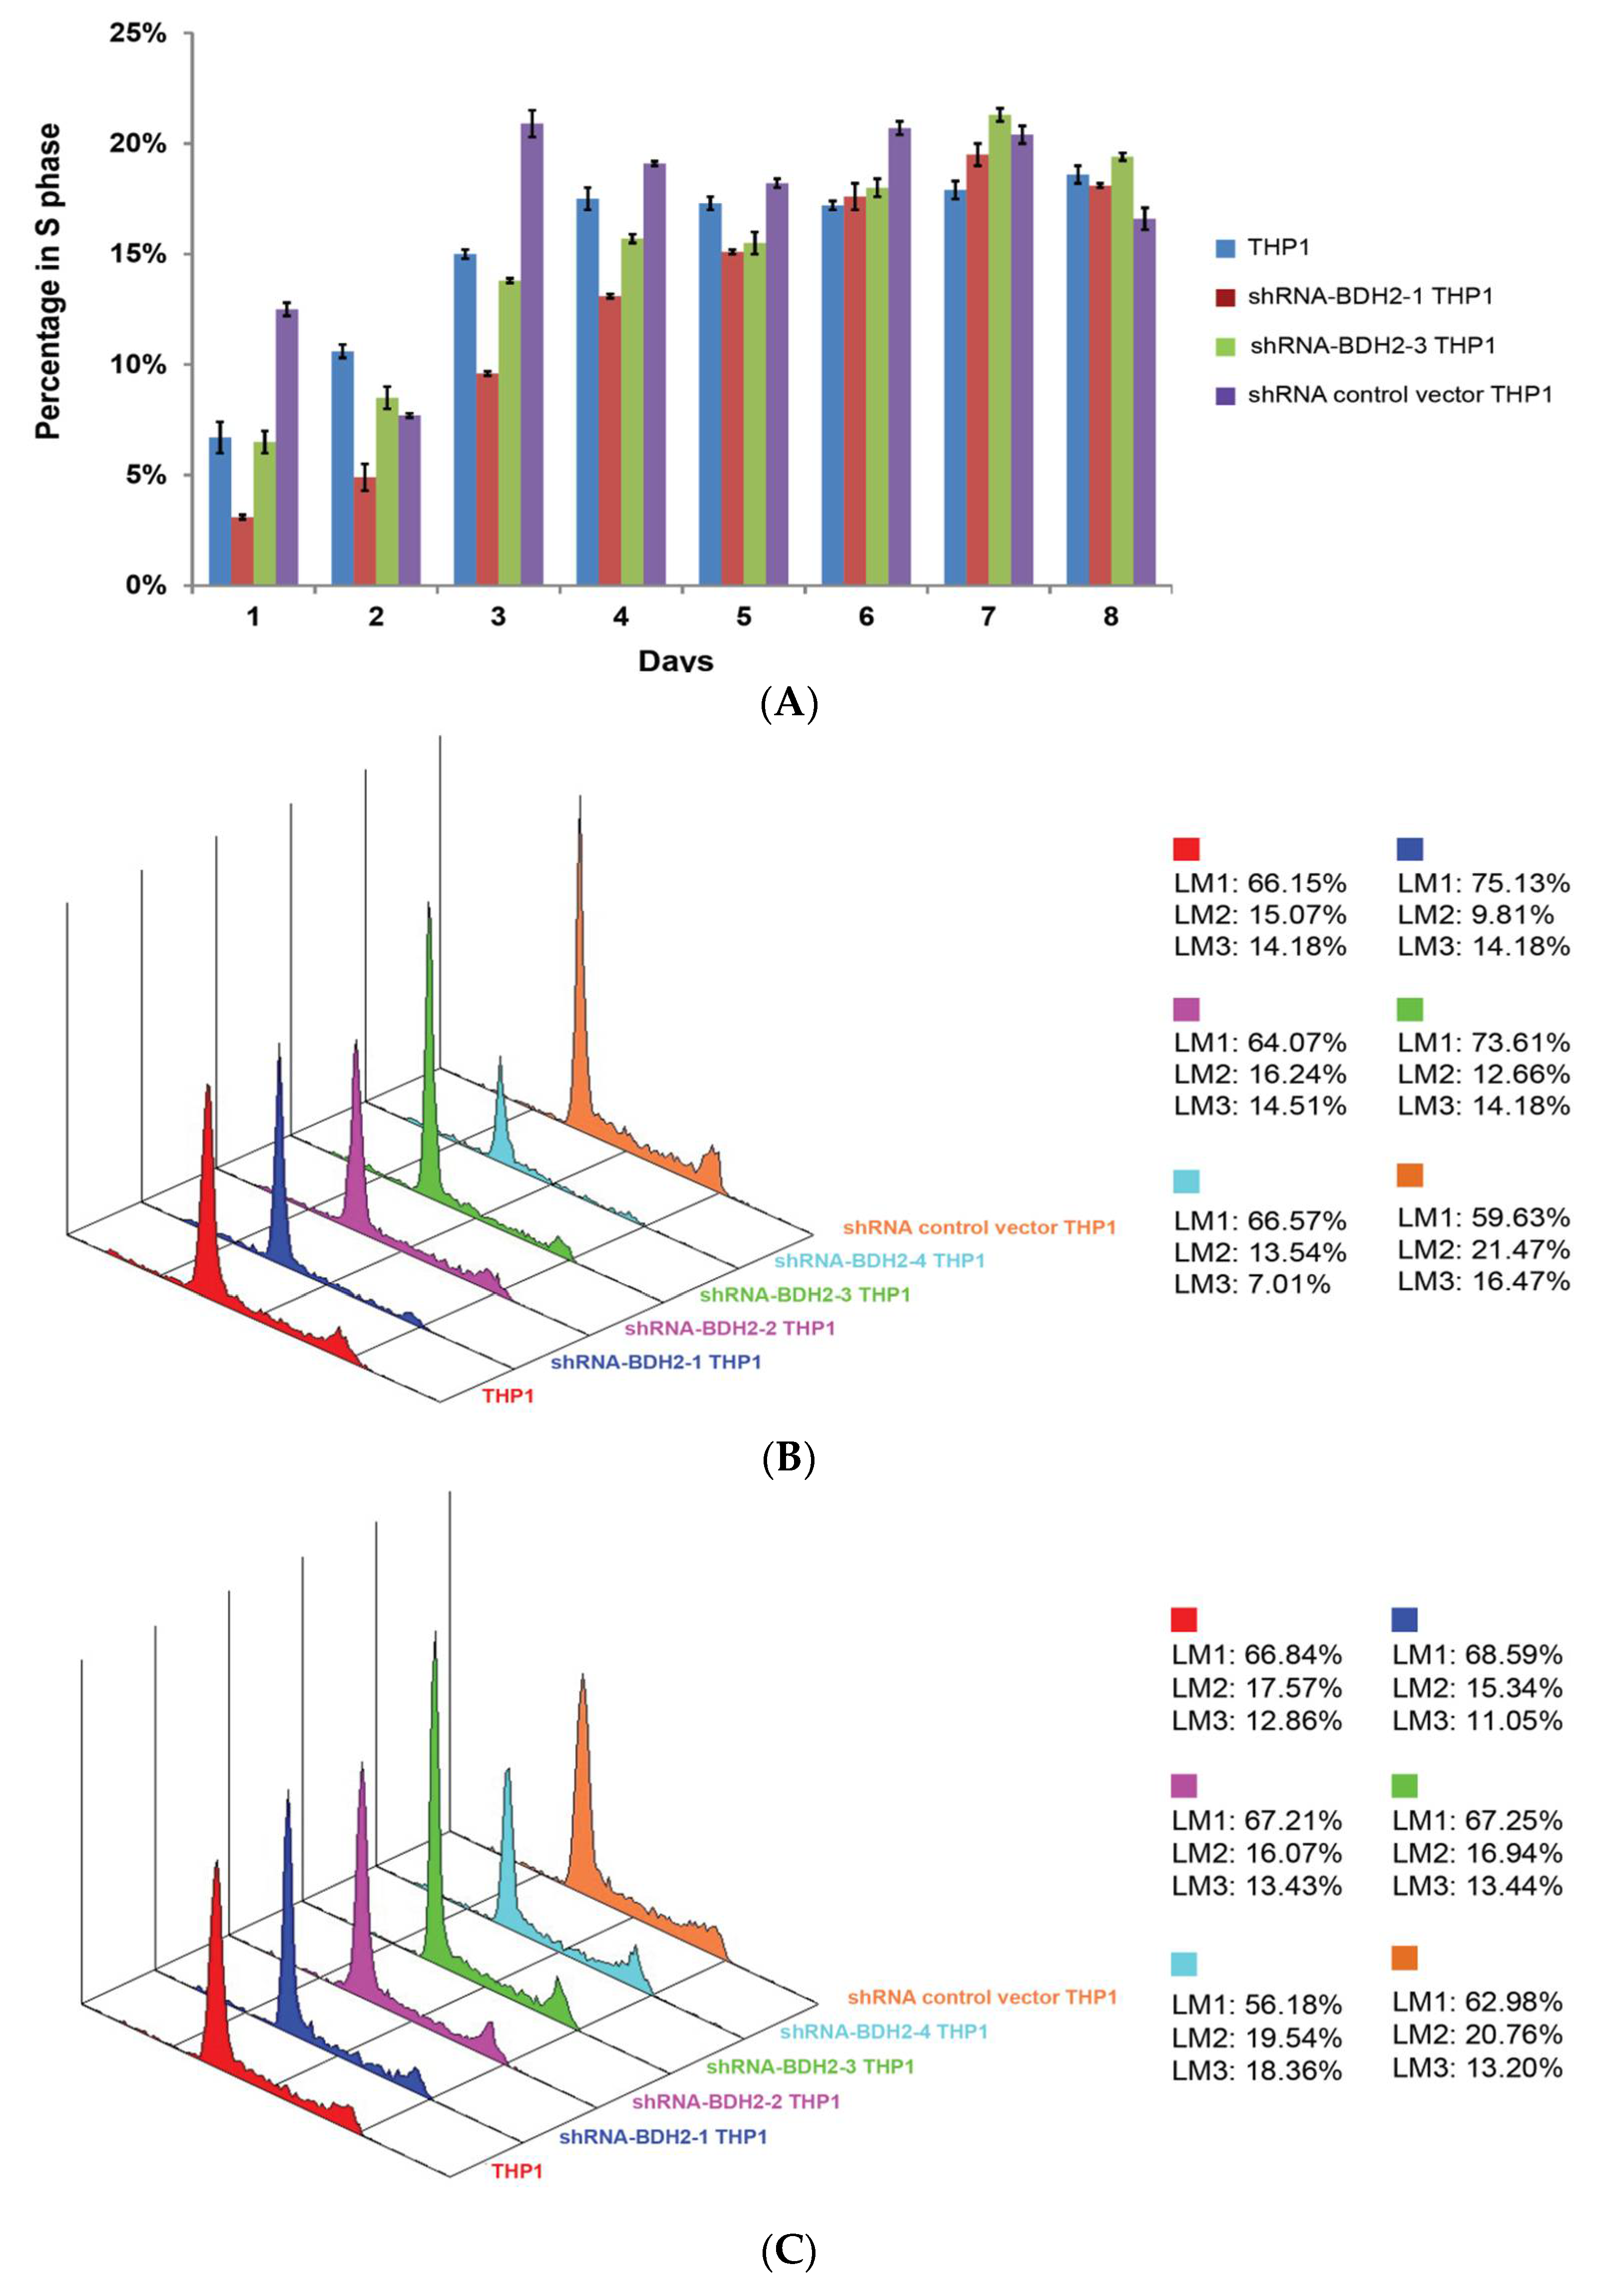
2.5.1. Cell Cycle Retardation

The expression levels of BDH2mRNA and LCN2mRNA in each shRNA BDH2 interference THP1 cell line using qRT-PCR are shown in Figure S5. The strain with the greatest KD efficiency in both mRNA (Figure S5A) and protein levels (Figure S5B) was shRNA-BDH2-3 THP1. We analyzed the growth rate after starving native THP1 cells, THP1 transfected with an shRNA empty vector, and shRNA-BDH2 THP1 cells in serum-free medium. The regrowth rate after reculture in serum-containing medium was retarded in BDH2-KD cells and showed dependency on BDH2 expression levels (Figure 3A).

2.5.2. Increased Differentiation in shRNA-BDH2 THP1 Cells

To study the reason for growth retardation, the surface markers CD11b, CD14, CD15, CD16, and CD64 were analyzed by flow cytometry. It was found that CD11b and CD15 expression increased in shRNA-BDH2 THP1 cells under vitamin D3 treatment, while the difference in CD15 expression was not significant (Figure 3B). There was no difference in CD14 and CD16 expression (Figure S6). CD64, which is expressed in both immature and mature monocytic series cells, was not influenced by BHD2 (Figure S6). In the special stain analysis, a slight increase in the myeloperoxidase (MPO) positive stain and a significant increase in the nonspecific esterase (NSE) stain in BDH2-KD cells were observed; these changes were related to the mRNA expression levels of BDH2 (Figure 3C). Further, during Liu staining for the morphological analysis, it was noticed that the concentration of macrophage-like cells increased in the BDH2-KD group (Figure 3D).

2.5.3. Longer Cell Cycle Arrest in shRNA Interference BDH2-KD THP1 Cells

After starvation and restart of the cell cycle, we noticed that while native and shRNA control vector transfected THP1 cells started the synthesis phase and reached a plateau from day 3, shRNA-BDH2 THP1 cells started synthesis late at day 4 and continued to show increased synthesis up to day 7 (Figure 4 and Figure S7).

2.6. BDH2 in Myeloid and Erythroid Series

To detect BDH2 protein expression in BM, immunohistochemistry was performed. The results showed that both erythroid and myeloid series were positive for BDH2. Immature cells such as blast cells, and mature cells such as band and segmented cells, stained positive for BDH2 antibodies (Figure S8).

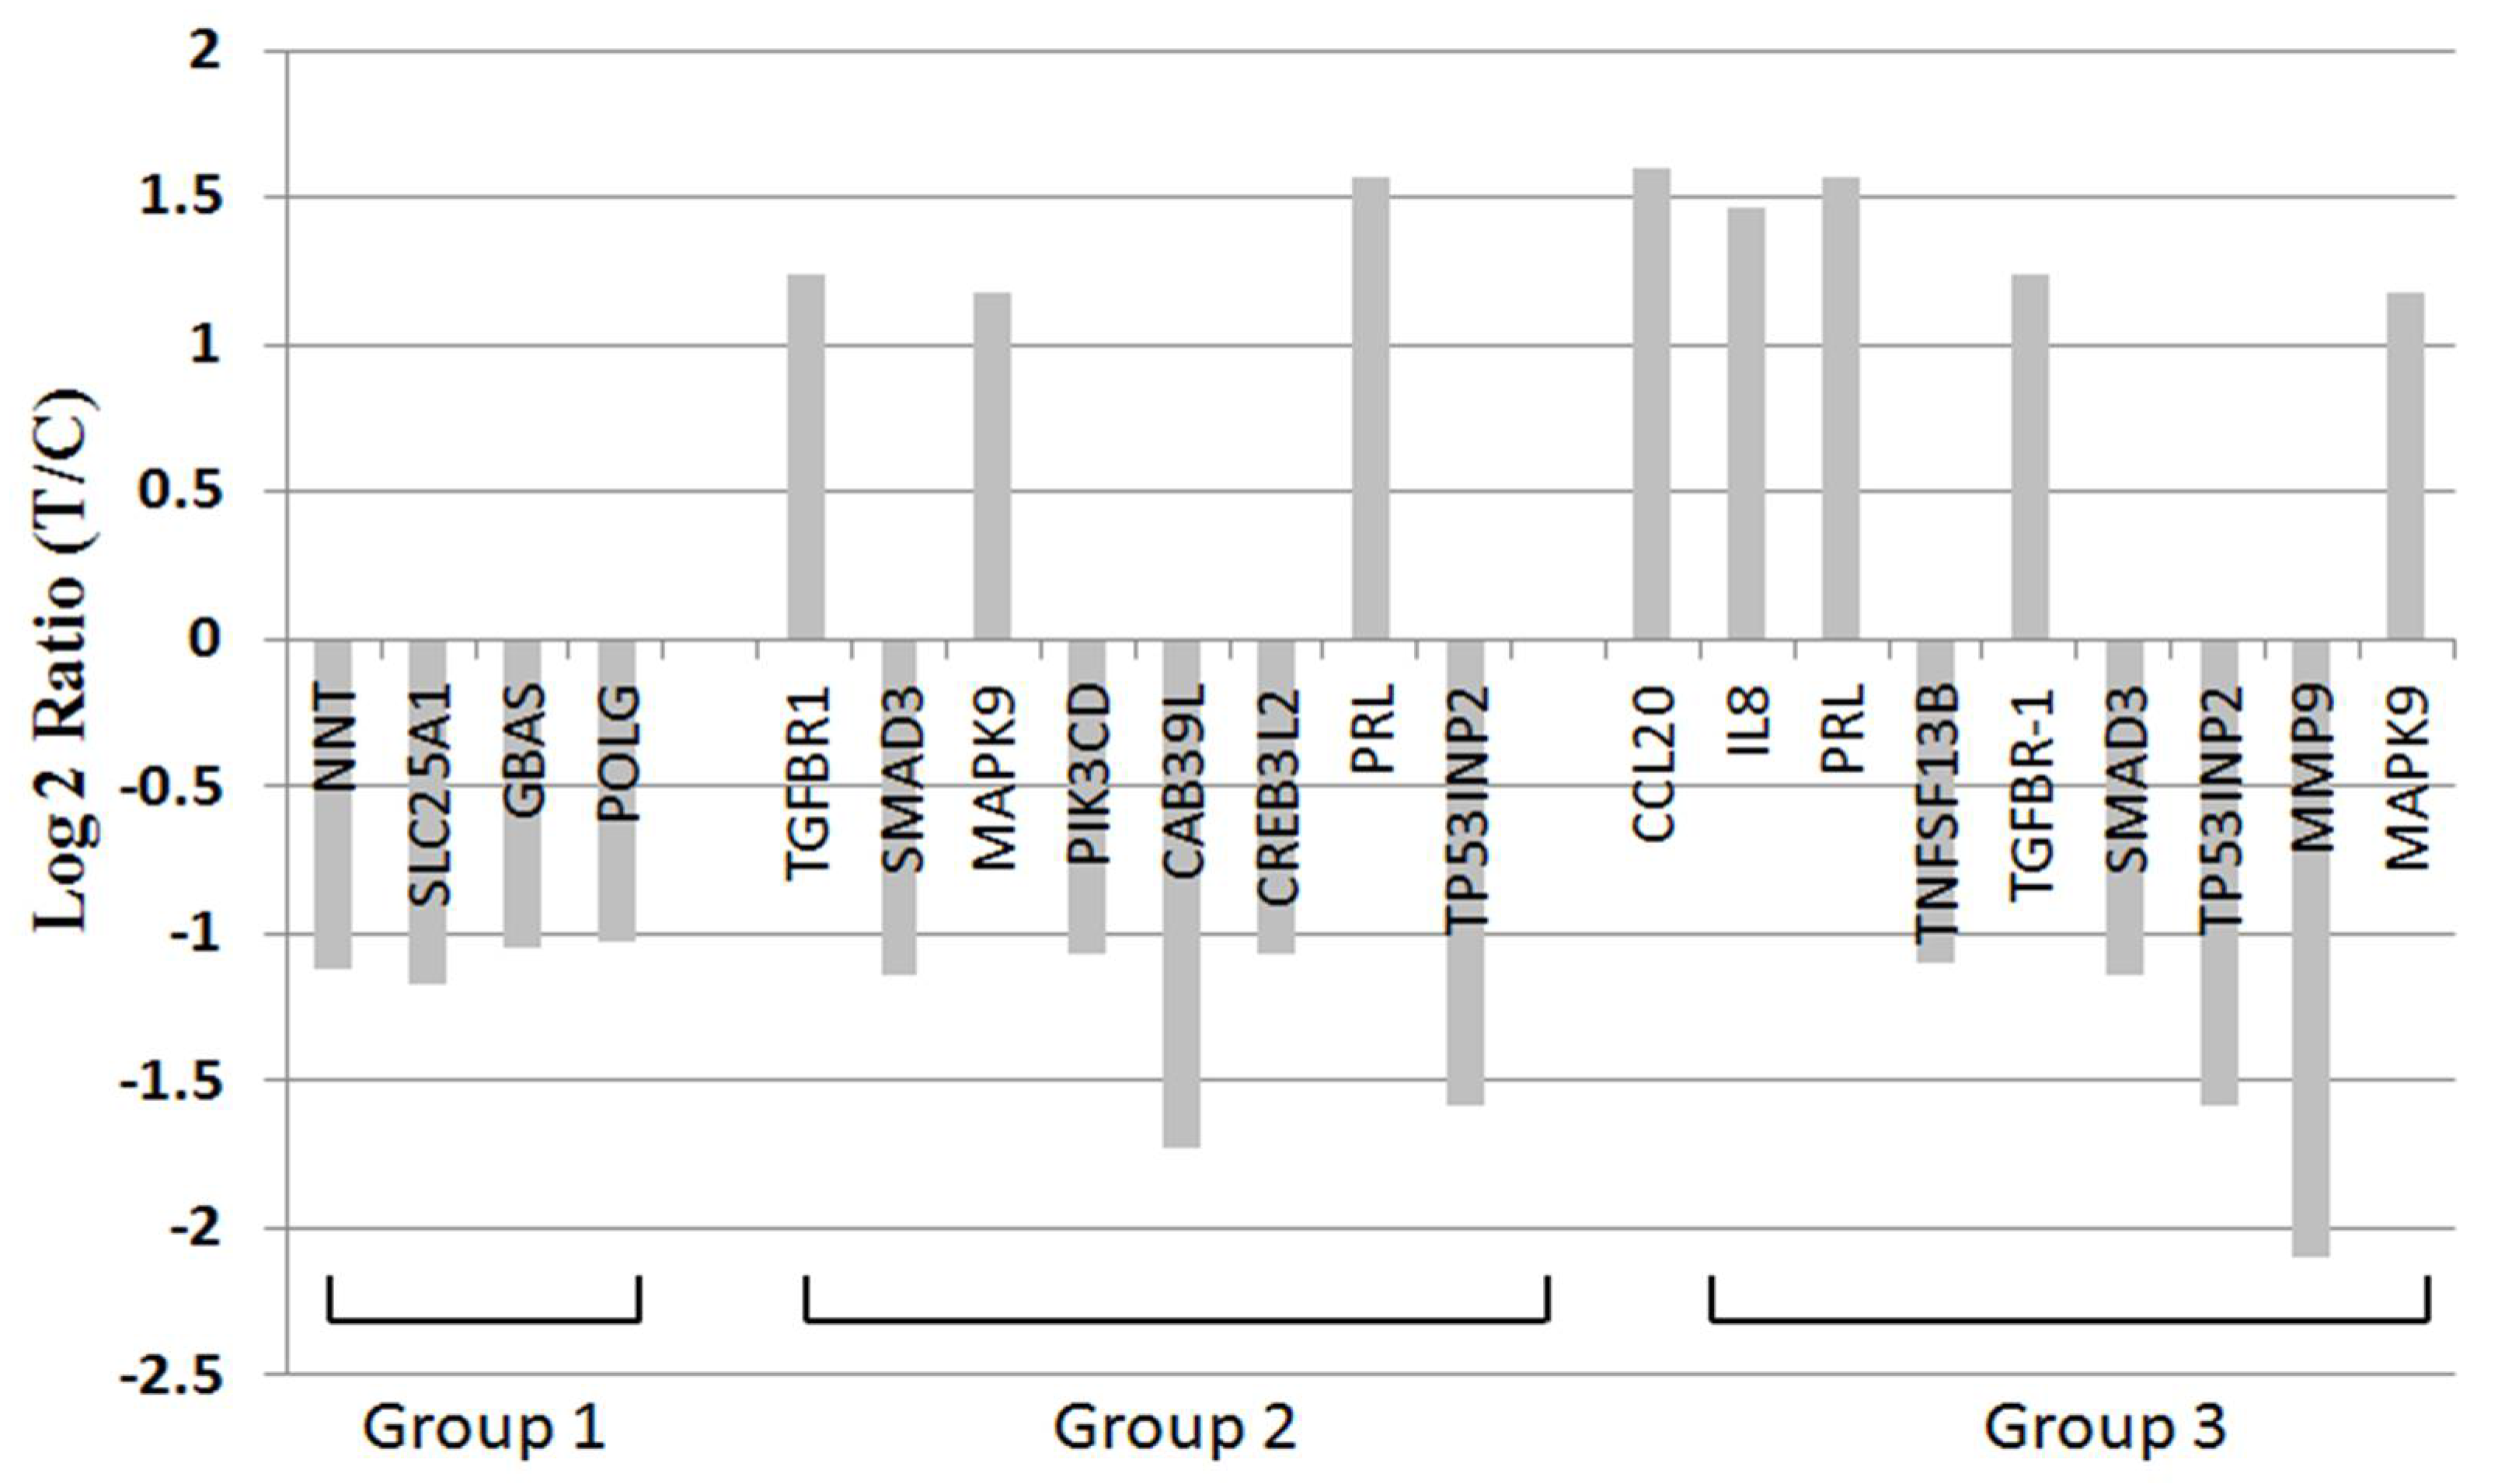
2.7. BDH2 Targets on Multiple Genes Related to Cell Proliferation, Survival, and Cancer Pathway

Under microarray study, many genes related to cell proliferation, growth and survival, and cancer, including colon cancer, pancreatic cancer, and acute leukemia, showed up- or downregulation in BDH2-KD THP1 cells (Figure 5 and Table S1, Figure S9). TGFBR1 upregulation, SMAD3 downregulation, MAPK9 upregulation, and TP53INP2 downregulation can explain stress-induced apoptosis. The phenomenon of TNFSF13B, MMP9, PI3KCD, and TP53INP2 downregulation may be related to poor proliferation of BDH2-KD cells. CCL20 and IL8 showed upregulation in BDH2-KD THP1 cells (Figure 5 and Table S1).

3. Discussion

MDS is a hematological disease that is characterized by ineffective hematopoiesis [31,32]. Iron metabolism plays a crucial role in MDS. In addition, iron overload has an impact on leukemia transformation and survival [17,18,33], and is known to be related to GDF-11, GDF-15, and hepcidin. However, there are remaining unknown factors related to iron overload in MDS patients [13,14,15,34]. Studies have reported that BDH2 plays an important role in maintaining normal cytoplasmic and mitochondrial iron levels through LCN2-mediated iron trafficking activities [23,25]. In addition, lipopolysaccharide (LPS)-induced inflammation combined with endoplasmic reticulum (ER) stress leads to massive BDH2 downregulation, increased expression of ER stress markers, upregulated hepcidin expression, downregulated ferroprotein expression, iron retention in macrophages, and dysregulated cytokine release from macrophages [35].
Our study showed growth retardation of shRNA-BDH2 THP1 cells. This is consistent with our previous study, which concluded that there are possible mechanisms of inducing apoptosis [26], cell cycle arrest, and cell differentiation. In addition, increased apoptosis of BM precursors is a feature that is typically observed in the majority of MDS patients [36,37]. Analysis of the mechanisms involved in the increased rate of apoptosis in MDS showed the involvement of both an extrinsic pathway, the Fas/FasL pathway [38], and an intrinsic pathway through mitochondrial damage [39].
However, some MDS patients at advanced stages showed increased resistance to apoptosis [40], which may be due to the heterogeneity of cytogenetic abnormalities [41]. Apoptosis can be induced by reactive oxygen species (ROS) [42]. In our previous study, we showed that BDH2-KD THP1 cells are more sensitive to ROS-related apoptosis, which is associated with the anti-apoptotic protein survivin [26]. Perhaps the high BDH2 expression in MDS patients has an anti-apoptotic effect, and this may be one of the factors contributing to the more advanced disease status observed in these patients [43,44,45].
Another possible factor contributing to the growth rate might be differentiation. It has been observed that MDS patients with a lower expression level of CD11b have a lower survival rate and a higher risk of progression to AML [46]. In addition, CD15 is a marker of cell maturation, and an increase in the expression of CD15 has been reported in patients with MDS [46,47]. In this study, we noticed that there was an increase in the expression of CD11b but without a significant change in CD15 in shRNA-BDH2 THP1 cells. This suggests that a high expression of BDH2 cells is associated with a lower expression of CD11b, which is associated with a poor prognosis. Moreover, special stain studies for cell lines suggest that BDH2-KD cells have the potential to differentiate into cells with mature myeloid characteristics. Together, these results suggest that BDH2 may play a role in inhibiting differentiation.
The genes influenced by BDH2 may be involved in many pathways. Genes involved in cell metabolism, such as nicotinamide nucleotide transhydrogenase (NNT), which is involved in the tricarboxylic acid (TCA) cycle [48], and solute carrier 25 A1 (SLC25A1), which contributes to citrate transport and is involved in the wnt pathway [49,50,51], are downregulated in BDH2-KD THP1 cells. In addition, genes related to cell proliferation and differentiation are regulated by BDH2 and cause cell growth retardant in BDH2-KD cells. These genes include BBF2H7/CREB3L2, which is an ER-resident transmembrane transcription factor that responds to physiological ER stress and activates hedgehog signaling [52]; transforming growth factor-β (TGF-β) crosstalk between Smad- and MAP-kinase-dependent pathways [53] via TGF-β type I receptor [54]; and matrix metalloproteinase-9 (MMP-9), which is important for hematopoietic stem cell proliferation and differentiation [55].
Phosphoinositide-3-kinase catalytic delta polypeptide (PIK3CD) shows anti-apoptotic effects on all-trans-retinoic acid in acute promyelocytic leukemia cells [56] and is downregulated in BDH2-KD THP1 cells. In addition, TNFSF13B, which is related to B cell survival and maturation [57], is downregulated by knocking down BDH2. Moreover, other genes including interleukin (IL)-8 increase the apoptotic rate of leukemia cells [58]. Chemokine ligand (CCL) 20, a strong chemotactic for lymphocytes [59] that promotes growth of the prostate cancer cell line [60], and prolactin (PRL), which induces cell proliferation and differentiation via Src family tyrosine kinase [61] and the Jak2/Stat pathway [62], were upregulated during the down-regulation of BDH2. All of these downstream genes support the idea that BDH2-KD stimulates apoptosis and differentiation of cells. However, the results of gene expression by microarray only suggest a possible implication of the observed differentially expressed genes in the BDH2 pathway. The impacts of these genes in MDS need to be confirmed by their loss and gain functions in the future.
While the above results suggest the potential mechanism of action of BDH2, we also studied the impact of BDH2 expression in MDS patients. The current study showed that the expression of BDH2mRNA was significantly elevated in the BM of MDS patients as compared with patients with normal BM. Interestingly, the patients with high BDH2 expression showed a higher risk of leukemia progression, a poor IPSS-R risk, and shorter LFS when compared with patients with low BDH2 expression. To assess whether higher BDH2 expression was related to the increase in blast cells associated with leukemia progression, we analyzed BM samples from 13 patients from whom we had collected BM samples for at least two different stages of MDS. Only one MDS/MPN patient who underwent leukemia transformation, another who progressed from MDS/RAEB1 to MDS/RAEB2, another who progressed from MDS/MPN to leukemia transformation, and another who progressed from MDS/RAEB1 to MDS/RAEB2 to leukemia transformation showed increases in BDH2mRNA expression. This suggests that BDH2 expression is a prognostic factor for leukemia transformation but it is not strongly associated with blast number. While these results should be interpreted with caution due to the small sample size, they suggest that the number of blasts cells is not related to BDH2mRNA expression.
Ferritin is a storage form of iron [63]. Kikuchi et al. reported that serum ferritin levels at diagnosis could be associated with leukemia progression in MDS patients. In our study, plasma ferritin levels and BDH2mRNA expression showed a positive correlation. OS was significantly longer, while LFS showed a trend of being longer in the low-ferritin group than in the high-ferritin group. The plasma ferritin levels were positively related to BDH2mRNA levels but not LCN2mRNA levels. This may be attributed to the fact that we analyzed the total LCN2mRNA expression rather than two forms (holo- and apo-LCN2) separately. However, further studies are required to establish the role of BDH2 in iron trafficking, and subsequently in MDS.
The limitations of our study include the small number of MDS patients of each subtype who participated and the lack of a complete ferritin level before blood transfusion in our cohort. This was because we enrolled MDS patients from the years 2001 to 2012, and the ferritin level was not regularly checked in the early 2000s. However, owing to the long follow-up interval, comprehensive information such as survival was highly reliable. We also noticed that a mild decrease or lack of change in BHD2 mRNA expression under disease progression in several patients was in agreement with the absence of a general mechanism in MDS involving BDH2 expression.
In conclusion, BDH2mRNA expression is elevated in MDS patients and is correlated with the ferritin level. Patients with high BDH2 expression showed a higher risk of leukemia progression, poorer IPSS-R scores, and shorter LFS when compared with patients with low BDH2 expression. Therefore, BDH2 may be a factor in poor prognosis in MDS. Possible related mechanisms include anti-apoptosis, facilitation of the cell cycle, and inhibition differentiation through many pathways in malignant cells. Our study provides a foundation for further research on the roles of BDH2 and iron metabolism in the pathogenesis of MDS.

4. Materials and Methods

4.1. Patient Population

A total of 318 patients were enrolled at Kaohsiung Medical University, Chung-Ho Memorial Hospital, Taiwan, from 2001 to 2012. Of these, 199 were newly diagnosed patients with MDS. Only 187 patients with good mRNA quality were analyzed. The remaining 119 patients were diagnosed with de novo AML, including 3 patients with M0, 28 with M1, 52 with M2, 23 with M4, 7 with M5, 1 with M6, and 4 with M7, according to the World Health Organization (WHO) classification criteria [4]. Peripheral blood and bone marrow (BM) samples were collected from these patients. BM samples were also collected from 43 lymphoma patients with normal BM to be used as a control group. Normal BM was defined as normal BM findings proved by two hematologists and one pathologist, and no cytogenetic abnormalities. The protocol was approved by the Kaohsiung Medical University Hospital Institutional Review Board. All patients provided written informed consent.

4.2. RNA Interference-Mediated BDH2-KD in THP1 Cells and Cell Culture

The shRNA-BDH2 lentivirus was purchased from Sigma (St. Louis, MO, USA). The clones TRCN0000036735, TRCN0000036736, TRCN0000036738, and TRCN00000244979 were identified as shRNA-BDH2-1, shRNA-BDH2-2, shRNA-BDH2-3, and shRNA-BDH2-4, respectively. Naive THP1 acute myelomonocytic leukemia cells were transfected with lentivirus-expressing shRNAs and were selected for puromycin resistance (1 µg/mL). THP1 was cultured in RPMI complete medium. Puromycin was added for stress selection of THP1 cells infected with shRNA empty vector and shRNA-BDH2 lentivirus (Sigma, St. Louis, MO, USA, Supplementary Methods). BDH2-KD efficiency was assessed by quantitative reverse-transcription polymerase chain reaction (qRT-PCR) and Western blot analyses.

4.3. qRT-PCR for mRNA Expression of BDH2 and LCN2

Total RNA was extracted from the BM samples of the enrolled patients and BDH2-KD THP1 cells using Trizol (Invitrogen, Life Technologies, Waltham, MA, USA). BDH2mRNA and LCN2mRNA expression was evaluated using specific forward, reverse primers, and the TaqMan® probe [26]. Here, β-actin was used as an internal control (Supplementary Materials).

4.4. Western Blot Analysis

Cells were starved by culturing in serum-free medium for 2 days. BDH2 expressions of nutrient-rich and -starved cells were detected by Western blot analysis, using primary antibodies specific for BDH2 (Sigma) and β-actin (Millipore Corporation, Billerica, MA, USA; Supplementary Materials).

4.5. Flow Cytometry for Cell Differentiation and Cell Cycle Analysis

Flow cytometry was performed using a Gallios flow cytometer (BeckmanCoulter, Brea, California, USA). THP1 cells were initiated to differentiate along the monocytic lineage following exposure to 1.25-dihydroxyvitaminD3 (Vit D3; Sigma), as described previously [64]. Cell differentiation was detected using the following antibodies: CD11b-PE and CD15-FITC, CD14-PE and CD64-FITC, CD16-PE and CD14-FITC double stain, and immunoglobulin G1-PE and immunoglobulin G1-FITC double stain (Beckman Coulter).
For cell cycle analysis, THP1 cells were cultured in serum-free medium for 2 days to induce cell cycle arrest, and the cell cycle was restarted by supplementation with FBS (Supplementary Methods). The cell cycle was analyzed by staining with propidium iodide (Beckman Coulter), and it was detected by flow cytometry (Supplementary Materials).

4.6. Special Stains

THP1 cells were prepared by the cytospin technique. Liu staining, myeloperoxidase (MPO) staining, and nonspecific esterase (NSE) staining were performed for the analysis of cell morphologies and monocytic and myelocytic characteristics (Supplementary Materials).

4.7. Immunohistochemistry (IHC)

Slides measuring 5 μm in thickness were cut from representative tissue blocks, IHC staining was performed using a monoclonal antibody against human BDH2 (sc-104197, Santa Cruz Biotechnology, Dallas, TX, USA), and counterstaining was done with hematoxylin (Supplementary Materials).

4.8. mRNA Microarray Analysis

In order to find the target genes of BDH2, we used an mRNA microarray service (Phalanx Biotech Group, Inc., Taiwan) on shRNA-BDH2-3 THP1 cells and empty vector transfected THP1 cells. The array version was human OneArray microarray (HOA) 5.1. The number of genes subjected to advanced analysis was 29,189. Standard selection criteria to identify differentially expressed genes were established at log2 (fold change) ≥1 and p < 0.05.

4.9. Clinical Endpoints

The endpoint for the follow-up of patients without leukemia progression was the date of death or AML development, and for those who were lost to follow-up, it was the date of the last visit, denoted as “censored” data. OS was defined as the time measured from the date of initial diagnosis until the date of death of the patient; this was censored for patients who were alive at the last follow-up. LFS was defined as the time measured from the date of initial diagnosis to the date of leukemia progression or death from any cause.

4.10. Statistical Analysis

Statistical analyses were performed using SPSS 17.0 (IBM SPSS software, USA). Differences in BDH2 and LCN2 mRNA expression between patients with MDS subtypes, leukemia progression, de novo CN-AML, and normal BM were analyzed using analysis of variance (ANOVA). Age differences among patients with MDS, de novo AML, and normal BM were analyzed using ANOVA. Correlation regression analysis was used to assess the correlations among BDH2 and LCN2 expression and ferritin levels. The receiver operating characteristic (ROC) curve was used to estimate the cut-off point for BDH2—a delta BDH2 of 10.10833. Patients with values above and below the cut-off point were defined as the BDH2High and BDH2Low expression groups, respectively (area under the curve (AUC) = 0.51; sensitivity = 57.6%; specificity = 35%). Time-to-event analysis involved estimating the probability that an event would occur at different time points. Chi-squared tests were used to analyze the risk of leukemia progression, as well as the IPSS-R [27] risk and MDS subtypes between the higher and lower BDH2 expression groups. Kaplan–Meier curves were plotted to estimate survival.

Supplementary Materials

The following are available online at https://www.mdpi.com/1422-0067/21/9/3033/s1.

Author Contributions

Conceptualization, W.-C.Y. and S.-F.L.; methodology, W.-C.Y., S.-C.W. (Shu-Chen Wang), and W.-C.T.; validation, W.-C.Y. and S.-F.L.; formal analysis, W.-C.Y. and S.-C.W. (Shih-Chi Wu); investigation, W.-C.Y. and S.-F.L.; resources, W.-C.Y., S.-F.L., S.-C.W. (Shu-Chen Wang), W.-C.T., and C.-C.W.; data curation, W.-C.Y., S.-C.W. (Shu-Chen Wang), W.-C.T., and C.-C.W.; writing—original draft preparation, W.-C.Y.; writing—review and editing, W.-C.Y., S.-F.L., and S.-C.W. (Shih-Chi Wu); visualization, W.-C.Y., W.-C.T., S.-C.W. (Shu-Chen Wang), and C.-C.W.; project administration, W.-C.Y.; funding acquisition, W.-C.Y. and S.-F.L. All authors have read and agreed to the published version of the manuscript.

Funding

This research received no external funding.

Acknowledgments

The authors thank the Statistical Analysis Laboratory, Department of Internal Medicine, Kaohsiung Medical University Hospital.

Conflicts of Interest

All authors declare no conflict of interest.

Abbreviations

MDSmyelodysplastic syndrome
BDH2type 2-hydroxybutyrate dehydrogenase
BMbone marrow
qRT-PCRquantitative real-time polymerase chain reaction
BDH2-KDBDH2 knockdown
AMLacute myeloid leukemia
RUNX1runt-related transcription factor 1
c-CBLc-Casitas B-lineage lymphoma
DNMT3ADNA methyltransferase 3 alpha
TET2tet methylcytosine dioxygenase 2
EZH2enhancer of zeste homolog 2
U2AF1U2 small nuclear RNA auxiliary factor 1
U2AF35U2 small nuclear RNA auxiliary factor 35
ZRSR2zinc finger CCCH type, RNA binding motif, and serine/arginine-rich 2
SRSF2serine and arginine-rich splicing factor 2
SF3Bsplicing factor 3b subunit 1
GDF11growth differentiation factor-11
GDF15growth differentiation factor-15
LFSLeukemia-free survival
OSoverall survival
LCN2lipocalin 24p3
2,5-DHBA2,5-dihydroxybenzoic acid
WHOWorld Health Organization
IPSS-RRevised International Prognostic Scoring System
RArefractory anemia
RARSrefractory anemia with ring sideroblast
RAEB1refractory anemia with excess of blast 1
RAEB2refractory anemia with excess of blast 2
MDS/MPNmyelodysplasitic syndrome/myeloproliferative neoplasm
NNTnicotinamide nucleotide transhydrogenase
TCAtricarboxylic acid
SLC25A1solute carrier 25 A1
BBF2H7/CREB3L2CAMP responsive element binding protein 3 like 2
ERendoplasmic reticulum
TGF-βtransforming growth factor-β
MMP-9Matrix metalloproteinase-9
PIK3CDPhosphoinositide-3-kinase, catalytic, delta polypeptide
TNFSF13Btumor necrosis factor superfamily member 13B
ILinterleukin
CCLChemokine ligand
PRLprolactin

References

  1. Corey, S.J.; Minden, M.D.; Barber, D.L.; Kantarjian, H.; Wang, J.C.; Schimmer, A.D. Myelodysplastic syndromes: The complexity of stem-cell diseases. Nat. Rev. Cancer 2007, 7, 118–129. [Google Scholar] [CrossRef]
  2. Bennett, J.M.; Catovsky, D.; Daniel, M.T.; Flandrin, G.; Galton, D.A.; Gralnick, H.R.; Sultan, C. Proposals for the classification of the myelodysplastic syndromes. Br. J. Haematol. 1982, 51, 189–199. [Google Scholar] [CrossRef]
  3. Greenberg, P.; Cox, C.; LeBeau, M.M.; Fenaux, P.; Morel, P.; Sanz, G.; Sanz, M.; Vallespi, T.; Hamblin, T.; Oscier, D.; et al. International scoring system for evaluating prognosis in myelodysplastic syndromes. Blood 1997, 89, 2079–2088. [Google Scholar] [CrossRef]
  4. Vardiman, J.W.; Harris, N.L.; Brunning, R.D. The World Health Organization (WHO) classification of the myeloid neoplasms. Blood 2002, 100, 2292–2302. [Google Scholar] [CrossRef]
  5. Moukalled, N.M.; El Rassi, F.A.; Temraz, S.N.; Taher, A.T. Iron overload in patients with myelodysplastic syndromes: An updated overview. Cancer 2018, 124, 3979–3989. [Google Scholar] [CrossRef] [PubMed]
  6. Yoshida, K.; Sanada, M.; Shiraishi, Y.; Nowak, D.; Nagata, Y.; Yamamoto, R.; Sato, Y.; Sato-Otsubo, A.; Kon, A.; Nagasaki, M.; et al. Frequent pathway mutations of splicing machinery in myelodysplasia. Nature 2011, 478, 64–69. [Google Scholar] [CrossRef] [PubMed]
  7. Bejar, R.; Levine, R.; Ebert, B.L. Unraveling the molecular pathophysiology of myelodysplastic syndromes. J. Clin. Oncol. 2011, 29, 504–515. [Google Scholar] [CrossRef] [PubMed]
  8. Thol, F.; Kade, S.; Schlarmann, C.; Löffeld, P.; Morgan, M.; Krauter, J.; Wlodarski, M.W.; Kölking, B.; Wichmann, M.; Görlich, K.; et al. Frequency and prognostic impact of mutations in SRSF2, U2AF1, and ZRSR2 in patients with myelodysplastic syndromes. Blood 2012, 119, 3578–3584. [Google Scholar] [CrossRef] [Green Version]
  9. Bejar, R.; Stevenson, K.; Abdel-Wahab, O.; Galili, N.; Nilsson, N.; Garcia-Manero, G.; Kantarjian, H.; Raza, A.; Levine, R.L.; Neuberg, D.; et al. Clinical effect of point mutations in myelodysplastic syndromes. N. Engl. J. Med. 2011, 364, 2496–2506. [Google Scholar] [CrossRef] [Green Version]
  10. Haferlach, T. Molecular genetics in myelodysplastic syndromes. Leuk. Res. 2012, 36, 1459–1462. [Google Scholar] [CrossRef]
  11. Park, S.; Grabar, S.; Kelaidi, C.; Beyne-Rauzy, O.; Picard, F.; Bardet, V.; Coiteux, V.; Leroux, G.; Lepelley, P.; Daniel, M.T.; et al. Predictive factors of response and survival in myelodysplastic syndrome treated with erythropoietin and G-CSF: The GFM experience. Blood 2008, 111, 574–582. [Google Scholar] [CrossRef] [PubMed]
  12. Arvedson, T.L.; Sasu, B.J. Role and regulation of iron metabolism in erythropoiesis and disease. In Erythropoietins, Erythropoietic Factors, and Erythropoiesis Milestones in Drug Therapy; Birkhäuser: Basel, Switzerland, 2009; Volume 4, pp. 279–298. [Google Scholar]
  13. Cui, R.; Gale, R.; Zhu, G.; Xu, Z.; Qin, T.; Zhang, Y.; Huang, G.; Li, B.; Fang, L.; Zhang, H.; et al. Serum iron metabolism and erythropoiesis in patients with myelodysplastic syndrome not receiving RBC transfusion. Leuk. Res. 2014, 38, 545–550. [Google Scholar] [CrossRef] [PubMed] [Green Version]
  14. Shenoy, N.; Vallumsetla, N.; Rachmilewitz, E.; Verma, A.; Ginzburg, Y. Impact of iron overload and potential benefit from iron chelation in low-risk myelodysplastic syndrome. Blood 2014, 124, 873–881. [Google Scholar] [CrossRef] [PubMed]
  15. Suragani, R.N.; Cadena, S.M.; Cawley, S.M.; Sako, D.; Mitchell, D.; Li, R.; Davies, M.V.; Alexander, M.J.; Devine, M.; Loveday, K.S.; et al. Transforming growth factor-β superfamily ligand trap ACE-536 corrects anemia by promoting late-stage erythropoiesis. Nat. Med. 2014, 20, 408–414. [Google Scholar] [CrossRef] [PubMed]
  16. Nimer, S.D. Myelodysplastic syndromes. Blood 2008, 111, 4841–4851. [Google Scholar] [CrossRef] [PubMed] [Green Version]
  17. Fenaux, P.; Rose, C. Impact of iron overload in myelodysplastic syndromes. Blood Rev. 2009, 23, S15–S19. [Google Scholar] [CrossRef]
  18. Malcovati, L.; Porta, M.G.; Pascutto, C.; Invernizzi, R.; Boni, M.; Travaglino, E.; Passamonti, F.; Arcaini, L.; Maffioli, M.; Bernasconi, P.; et al. Prognostic factors and life expectancy in myelodysplastic syndromes classified according to WHO criteria: A basis for clinical decision making. J. Clin. Oncol. 2005, 23, 7594–7603. [Google Scholar] [CrossRef]
  19. Sanz, G.; Nomdedeu, B.; Such, E.; Bernal, T.; Belkaid, M.; Ardanaz, M.T.; Marco, V.; Pedro, C.; Ramos, F.; Consuelo del Cañizo, M.; et al. Independent impact of iron overload and transfusion dependency on survival and leukemic evolution in patients with myelodysplastic syndrome. Blood 2008, 112, 640. [Google Scholar] [CrossRef]
  20. Goetz, D.H.; Holmes, M.A.; Borregaard, N.; Bluhm, M.E.; Raymond, K.N.; Strong, R.K. The neutrophil lipocalin NGAL is a bacteriostatic agent that interferes with siderophore-mediated iron acquisition. Mol. Cell 2002, 10, 1033–1043. [Google Scholar] [CrossRef]
  21. Yang, J.; Goetz, D.; Li, J.Y.; Wang, W.; Mori, K.; Setlik, D.; Du, T.; Erdjument-Bromage, H.; Tempst, P.; Strong, R.; et al. An iron delivery pathway mediated by a lipocalin. Mol. Cell 2002, 10, 1045–1056. [Google Scholar] [CrossRef]
  22. Devireddy, L.R.; Gazin, C.; Zhu, X.; Green, M.R. A cell-surface receptor for lipocalin 24p3 selectively mediates apoptosis and iron uptake. Cell 2005, 123, 1293–1305. [Google Scholar] [CrossRef] [PubMed] [Green Version]
  23. Devireddy, L.R.; Hart, D.O.; Goetz, D.H.; Green, M.R. A mammalian siderophore synthesized by an enzyme with a bacterial homolog involved in enterobactin production. Cell 2010, 141, 1006–1017. [Google Scholar] [CrossRef] [PubMed] [Green Version]
  24. Guo, K.; Lukacik, P.; Papagrigoriou, E.; Meier, M.; Lee, W.H.; Adamski, J.; Oppermann, U. Characterization of human DHRS6, an orphan short chain dehydrogenase/reductase enzyme: A novel, cytosolic type 2 R-beta-hydroxybutyrate dehydrogenase. J. Biol. Chem. 2006, 281, 10291–10297. [Google Scholar] [CrossRef] [PubMed] [Green Version]
  25. Liu, Z.; Lanford, R.; Mueller, S.; Gerhard, G.S.; Luscieti, S.; Sanchez, M.; Devireddy, L. Siderophore-mediated iron trafficking in humans is regulated by iron. J. Mol. Med. 2012, 90, 1209–1221. [Google Scholar] [CrossRef] [PubMed] [Green Version]
  26. Yang, W.C.; Tsai, W.C.; Lin, P.M.; Yang, M.Y.; Liu, Y.C.; Chang, C.S.; Yu, W.H.; Lin, S.F. Human BDH2, an anti-apoptosis factor, is a novel poor prognostic factor for de novo cytogenetically normal acute myeloid leukemia. J. Biomed. Sci. 2013, 20, 58. [Google Scholar] [CrossRef] [PubMed] [Green Version]
  27. Li, N.; Chen, Q.; Gu, J.; Li, S.; Zhao, G.; Wang, W.; Wang, Z.; Wang, X. Synergistic inhibitory effects of deferasirox in combination with decitabine on leukemia cell lines SKM-1, THP-1, and K-562. Oncotarget 2017, 8, 36517–36530. [Google Scholar] [CrossRef]
  28. Fang, J.; Rhyasen, G.; Bolanos, L.; Rasch, C.; Varney, M.; Wunderlich, M.; Goyama, S.; Jansen, G.; Cloos, J.; Rigolino, C.; et al. Cytotoxic effects of bortezomib in myelodysplastic syndrome/acute myeloid leukemia depend on autophagy-mediated lysosomal degradation of TRAF6 and repression of PSMA1. Blood 2012, 120, 858–867. [Google Scholar] [CrossRef]
  29. Tibes, R.; Al-Kali, A.; Oliver, G.R.; Delman, D.H.; Hansen, N.; Bhagavatula, K.; Mohan, J.; Rakhshan, F.; Wood, T.; Foran, J.M.; et al. The Hedgehog pathway as targetable vulnerability with 5-azacytidine in myelodysplastic syndrome and acute myeloid leukemia. J. Hematol. Oncol. 2015, 8, 114. [Google Scholar] [CrossRef] [Green Version]
  30. Greenberg, P.; Tuechler, H.; Schanz, J.; Sanz, G.; Garcia-Manero, G.; Solé, F.; Bennett, J.M.; Bowen, D.; Fenaux, P.; Dreyfus, F.; et al. Revised International Prognostic Scoring System for Myelodysplastic syndromes. Blood 2012, 120, 2454–2465. [Google Scholar] [CrossRef]
  31. Valent, P.; Horny, H.P.; Bennett, J.M.; Fonatsch, C.; Germing, U.; Greenberg, P.; Haferlach, T.; Haase, D.; Kolb, H.J.; Krieger, O.; et al. Definitions and standards in the diagnosis and treatment of the myelodysplastic syndromes: Consensus statements and report from a working conference. Leuk. Res. 2007, 31, 727–736. [Google Scholar] [CrossRef]
  32. Bennett, J.M.; Komrokji, R.S. The myelodysplastic syndromes: Diagnosis, molecular biology and risk assessment. Hematology 2005, 10, 258–269. [Google Scholar] [CrossRef] [PubMed]
  33. Kikuchi, S.; Kobune, M.; Iyama, S.; Sato, T.; Murase, K.; Kawano, Y.; Takada, K.; Ono, K.; Hayashi, T.; Miyanishi, K.; et al. Prognostic significance of serum ferritin level at diagnosis in myelodysplastic syndrome. Int. J. Hematol. 2012, 95, 527–534. [Google Scholar] [CrossRef] [PubMed]
  34. Jin, X.; He, X.; Cao, X.; Xu, P.; Xu, P.; Xing, Y.; Sui, S.; Wang, L.; Meng, J.; Lu, W.; et al. Iron overload impairs normal hematopoietic stem and progenitor cells through reactive oxygen species and shortens survival in myelodysplastic syndrome mice. Hematologica 2018, 103, 1627–1634. [Google Scholar] [CrossRef] [PubMed] [Green Version]
  35. Zughaier, S.M.; Stauffer, B.B.; McCarty, N.A. Inflammation nad ER stress downregulate BDH2 expression nad dysregulate intracellular iron in macrophages. J. Immunol. Res. 2014, 2014, 140728. [Google Scholar] [CrossRef]
  36. Raza, A.; Gezer, S.; Mundle, S.; Gao, X.Z.; Alvi, S.; Borok, R.; Rifkin, S.; Iftikhar, A.; Shetty, V.; Parcharidou, A.; et al. Apoptosis in bone marrow biopsy samples involving stromal and hematopoietic cells in 50 patients with myelodysplastic syndromes. Blood 1995, 86, 268–276. [Google Scholar] [CrossRef] [Green Version]
  37. Amin, H.M.; Jilani, I.; Estey, E.H.; Keating, M.J.; Dey, A.L.; Manshouri, T.; Kantarjian, H.M.; Estrov, Z.; Cortes, J.E.; Thomas, D.A.; et al. Increased apoptosis in bone marrow B lymphocytes but not T lymphocytes in myelodysplastic syndrome. Blood 2003, 102, 1866–1868. [Google Scholar] [CrossRef] [Green Version]
  38. Claessens, Y.E.; Bouscary, D.; Dupont, J.M.; Picard, F.; Melle, J.; Gisselbrecht, S.; Lacombe, C.; Dreyfus, F.; Mayeux, P.; Fontenay-Roupie, M. In vitro proliferation and differentiation of erythroid progenitors from patients with myelodysplastic syndromes: Evidence for Fas-dependent apoptosis. Blood 2002, 99, 1594–1601. [Google Scholar] [CrossRef] [Green Version]
  39. Tehranchi, R.; Fadeel, B.; Forsblom, A.M.; Christensson, B.; Samuelsson, J.; Zhivotovsky, B.; Hellstrom-Lindberg, E. Granulocyte colony-stimulating factor inhibits spontaneous cytochrome c release and mitochondria-dependent apoptosis of myelodysplastic syndrome hematopoietic progenitors. Blood 2003, 101, 1080–1086. [Google Scholar] [CrossRef] [Green Version]
  40. Horikawa, K.; Nakakuma, H.; Kawaguchi, T.; Iwamoto, N.; Nagakura, S.; Kagimoto, T.; Takatsuki, K. Apoptosis resistance of blood cells from patients with paroxysmal nocturnal hemoglobinuria, aplastic anemia, and myelodysplastic syndrome. Blood 1997, 90, 2716–2722. [Google Scholar] [CrossRef] [Green Version]
  41. Sloand, E.M.; Kim, S.; Fuhrer, M.; Risitano, A.M.; Nakamura, R.; Maciejewski, J.P.; Barrett, A.J.; Young, N.S. Fas-mediated apoptosis is important in regulating cell replication and death in trisomy 8 hematopoietic cells but not in cells with other cytogenetic abnormalities. Blood 2002, 100, 4427–4432. [Google Scholar] [CrossRef]
  42. Simon, H.U.; Haj-Yehia, A.; Levi-Schaffer, F. Role of reactive oxygen species (ROS) in apoptosis induction. Apoptosis 2000, 5, 415–418. [Google Scholar] [CrossRef] [PubMed]
  43. Rajapaksa, R.; Ginzton, N.; Rott, L.S.; Greenberg, P.L. Altered oncoprotein expression and apoptosis in myelodysplastic syndrome marrow cells. Blood 1996, 88, 4275–4287. [Google Scholar] [CrossRef] [PubMed] [Green Version]
  44. Kerbauy, D.B.; Deeg, H.J. Apoptosis and antiapoptotic mechanisms in the progression of myelodysplastic syndrome. Exp. Hematol. 2007, 35, 1739–1746. [Google Scholar] [CrossRef] [PubMed] [Green Version]
  45. Parker, J.E.; Mufti, G.J.; Rasool, F.; Mijovic, A.; Devereux, S.; Pagliuca, A. The role of apoptosis, proliferation, and the Bcl-2-related proteins in the myelodysplastic syndromes and acute myeloid leukemia secondary to MDS. Blood 2000, 96, 3932–3938. [Google Scholar] [CrossRef] [PubMed]
  46. Elghetany, M.T. Surface marker abnormalities in myelodysplastic syndromes. Haematologica 1998, 83, 1104–1115. [Google Scholar] [PubMed]
  47. Clark, R.E.; Hoy, T.G.; Jacobs, A. Granulocyte and monocyte surface membrane markers in the myelodysplastic syndromes. J. Clin. Pathol. 1985, 38, 301–304. [Google Scholar] [CrossRef] [Green Version]
  48. Gameiro, P.A.; Laviolette, L.A.; Kelleher, J.K.; Iliopoulos, O.; Stephanopoulos, G. Cofactor balance by nicotinamide nucleotide transhydrogenase (NNT) coordinates reductive carboxylation and glucose catabolism in the tricarboxylic acid (TCA) cycle. J. Biol. Chem. 2013, 288, 12967–12977. [Google Scholar] [CrossRef] [Green Version]
  49. Palmieri, F. The mitochondrial transporter family SLC25: Identification, properties and physiopathylogy. Mol. Asp. Med. 2013, 34, 465–484. [Google Scholar] [CrossRef]
  50. Morciano, P.; Carrisi, C.; Capobianco, L.; Mannini, L.; Burgio, G.; Cestra, G.; De Benedetto, G.E.; Corona, D.F.; Musio, A.; Cenci, G. A conserved role for the mitochondrial citrate transporter Sea/SLC25A1 in the maintenance of chromosome integrity. Hum. Mol. Genet. 2009, 18, 4180–4188. [Google Scholar] [CrossRef] [Green Version]
  51. An, F.Q.; Compitello, N.; Horwitz, E.; Sramkoski, M.; Knudsen, E.S.; Renne, R. The Latency-associated nuclear antigen of Kaposi’s sarcoma-associated herpesvirus modulates cellular gene expression and protects lymphoid cells from p16 INK4A-induced cell cycle arrest. J. Biol. Chem. 2005, 280, 3862–3874. [Google Scholar] [CrossRef] [Green Version]
  52. Saito, A.; Kanemoto, S.; Zhang, Y.; Asada, R.; Hino, K.; Imaizumi, K. Chondrocyte proliferation regulated by secreted luminal domain of ER stress transducer BBF2H7/CREB3L2. Mol. Cell 2014, 53, 127–139. [Google Scholar] [CrossRef] [PubMed] [Green Version]
  53. Kim, S.J.; Letterio, J. Transforming growth factor-β signaling in normal and malignant hematopoiesis. Leukemia 2003, 17, 1731–1737. [Google Scholar] [CrossRef] [PubMed] [Green Version]
  54. Wrana, J.L.; Attisano, L.; Wieser, R.; Ventura, F.; Massagué, J. Mechanism of activation of TGF-β receptor. Nature 1994, 370, 341–347. [Google Scholar] [CrossRef] [PubMed]
  55. Heissig, B.; Hattori, K.; Dias, S.; Friedrich, M.; Ferris, B.; Hackett, N.R.; Crystal, R.G.; Besmer, P.; Lyden, D.; Moore, M.A.; et al. Recruitment of stem and progenitor cells from the bone marrow niche requires MMP-9 mediated release of Kit-ligand. Cell 2002, 109, 625–637. [Google Scholar] [CrossRef] [Green Version]
  56. Park, S.; Chapuis, N.; Tamburini, J.; Bardet, V.; Cornillet-Lefebvre, P.; Willems, L.; Green, A.; Mayeux, P.; Lacombe, C.; Bouscary, D. Role of the PI3K/AKT and mTOR signaling pathways in acute myeloid leukemia. Haematologica 2010, 95, 819–828. [Google Scholar] [CrossRef] [Green Version]
  57. Henley, T.; Kovesdi, D.; Turner, M. B-cell responses to b-cell activation factor of the TNF family (BAFF) are impaired in the absence of PI3K delta. Eur. J. Immunol. 2008, 38, 3543–3548. [Google Scholar] [CrossRef]
  58. Terui, Y.; Ikeda, M.; Tomizuka, H.; Kasahara, T.; Ohtsuki, T.; Uwai, M.; Mori, M.; Itoh, T.; Tanaka, M.; Yamada, M.; et al. Identification of a novel apoptosis-inducing factor derived from leukemic cells: Endothelial interleukin-8, but not monocyte-derived, induces apoptosis in leukemic cells. Biochem. Biophy. Res. Commun. 1998, 243, 407–411. [Google Scholar] [CrossRef]
  59. Hieshima, K.; Imai, T.; Opdenakker, G.; Van Damme, J.; Kusuda, J.; Tei, H.; Sakaki, Y.; Takatsuki, K.; Miura, R.; Yoshie, O.; et al. Molecular cloning of a novel human CC chemokine liver and activation-regulated chemokine (LARC) expressed in liver. Chemotactic activity for lymphocytes and gene localization on chromosome 2. J. Biol. Chem. 1997, 272, 5846–5853. [Google Scholar] [CrossRef] [Green Version]
  60. Beider, K.; Abraham, M.; Begin, M.; Wald, H.; Weiss, I.D.; Wald, O.; Pikarsky, E.; Abramovitch, R.; Zeira, E.; Galun, E.; et al. Interaction between CXCR4 and CCL20 pathways regulates tumor growth. PLoS ONE 2009, 4, e5125. [Google Scholar] [CrossRef] [Green Version]
  61. Bernard, V.; Young, J.; Chanson, P.; Binart, N. New insights in prolactin: Pathological implications. Nat. Rev. Endocrinol. 2015, 11, 265–275. [Google Scholar] [CrossRef]
  62. Brockman, J.L.; Schroeder, M.D.; Schuler, L.A. PRL activates the cyclin D1 promoter via the Jak2/Stat pathway. Mol. Endocrinol. 2002, 16, 774–784. [Google Scholar] [CrossRef] [PubMed]
  63. Wick, M.; Pinggera, W.; Lehmann, P. Iron Storage—Ferritins, Isoferritins. In Clinical Aspects and Laboratory—Iron Metabolism, Anemias; Springer Science & Business Media: New York, NY, USA, 2011; pp. 8–10. [Google Scholar]
  64. Schwende, H.; Fitzke, E.; Ambs, P.; Dieter, P. Differences in the state of differentiation of THP-1 cells induced by phorbol ester and 1,25-dihydroxyvitamin D3. J. Leukoc. Biol. 1996, 59, 555–561. [Google Scholar] [CrossRef] [PubMed]
Figure 1. Expression levels of (A) BDH2 and (B) LCN2 mRNA in BM in MDS and control patients, including de novo CN-AML and normal BM. The expression levels of the BDH2 and LCN2 genes were normalized to the internal control β-actin to obtain the relative threshold cycle (ΔCT). BDH2, hydroxybutyrate dehydrogenase type 2; BM, bone marrow; CN-AML, cytogenetically normal acute myeloid leukemia; LCN2, lipocalin 2; MDS, myelodysplastic syndrome; RA, refractory anemia; RAEB, refractory anemia with excess blasts; RARS, refractory anemia with ringed sideroblasts.
Ijms 21 03033 g001
Figure 2. Survival rate in patients with MDS. (A) Leukemia-free survival and (B) overall survival in high and low BDH2 expression groups. (C) Leukemia-free survival and (D) overall survival in patients with ferritin level less than, equal to, or more than 350 ng/mL. BDH2, hydroxybutyrate dehydrogenase type 2.
Ijms 21 03033 g002
Figure 3. Cell growth rate and differentiation in BDH2 knockdown and native THP1 cells. Puromycin was used for stress selection for vector transfected cells. THP1 transfected with empty vector (shRNAc) was used as a control. (A) The cell growth rate in different THP1 cells. (B) The differentiation rate in THP1, BDH2 knockdown THP1, and shRNA control THP1 cell lines was measured by flow cytometry using the antibodies CD11b-PE and CD15-FITC. (C) NSE and MPO staining of BDH2 knockdown THP1 and control THP1 cells. The blue arrow indicates NSE-positive cells. (D) The morphology of THP1 after BDH2 knockdown. Lui stain, 40×.BDH2, hydroxybutyrate dehydrogenase type 2; CD, cluster of differentiation; MPO, myeloperoxidase; NSE, nonspecific esterase.
Ijms 21 03033 g003
Figure 4. Cell cycle profile of native THP1 and shRNA control vector transfected THP1 cells from starving condition. (A) Cell cycle profile at the synthesis phase. (B) Analysis graphs on the third and (C) fourth days after re-culture with FBS. Native THP1 and shRNA control vector transfected THP1 cells entered S phase on day 3, while BDH2-KD THP1 cells started S phase on day 4. BDH2, hydroxybutyrate dehydrogenase type 2; FBS, fetal bovine serum. LM1: G0/G1; LM2: S; LM3: G2/M.
Ijms 21 03033 g004
Figure 5. RNA microarray analysis of BDH2 targeting genes. Group 1: genes related to mitochondria; group 2: genes that have been reported as oncogenes or tumor suppressor genes; group 3: genes that function to control the survival, growth, differentiation, proliferation, and effector function of tissues and cells. All of those genes showed statistical significance with p < 0.05.
Ijms 21 03033 g005
Table 1. Comparison of clinical manifestations and laboratory features in patients with MDS in low and high BDH2 expression groups *.
VariablesTotal (n = 186)Low BDH2 Expression (n = 114)High BDH2 Expression (n = 73)P
Sex 0.444
Male11975 (65.79%)44 (60.27%)
Female6839 (34.21%)29 (39.73%)
Age (years) 65 (19–87)66 (35–87)0.976
Laboratory data
WBC, μL−13990 (1100–56,000)3945 (1220–34,000)4100 (1100–56,000)0.144
Hb, g/dL8.4 (4.3–14.7)8.55 (4.3–13.5)8.4 (5.6–14.7)0.720
MCV, fl99.2 (52–122.7)98.5 (70–122.7)99.2 (52–117)0.812
Platelets, ×1000/μL79,000 (8000–456,000)94,000 (8000–456,000)66,000 (12,000–346,000)0.051
Ferritin, ng/mL ||555.75 (62–5912)423.3 (8.1–5614)1003.6 (133.1–5916)0.02 **
Type 0.003 **
RA6547 (35.09%)18 (24.66%)0.027 **
RARS1410 (8.77%)4 (5.48%)0.336
RAEB-13821 (18.42%)17 (23.29%)0.420
RAEB-23617 (14.91%)19 (26.03%)0.060
MDS/MPN1211 (9.65%)1 (1.37%)0.024 **
Leukemia change228(7.02%)14 (19.18%)0.012 **
IPSS-R score §† 0.004 **
Very low65 (4.39%)1 (1.37%)0.254
Low5340 (35.09%)13 (17.81%)0.011 **
Int4329(25.44%)14 (19.18%)0.321
High3213 (11.40%)19 (26.03%)0.017 **
Very high4722 (19.30%)25 (34.25%)0.022 **
Leukemia progression §† 4 (3.77%)9 (15.25%)0.017 **
* The median value of BDH2 expression in the total population of 10.10833 was used as the cut-off level to define the low and high expression groups. Number of patients (%). Median (range). § Patients with more than 30% blasts in bone marrow were excluded. || Only 109 patients had ferritin measured at diagnosis. ** Statistically significant (p < 0.05). BDH2, hydroxybutyrate dehydrogenase type 2; Hb, hemoglobin; Int, intermediate; IPSS-R, Revised International Prognostic Scoring System; MCV, mean corpuscular volume; MDS, myelodysplastic syndrome; MPN, myeloproliferative neoplasm; RA, refractory anemia; RAEB, refractory anemia with excess blasts; RARS, refractory anemia with ringed sideroblasts; WBC, white blood cells.

