Article

A Tetra-Panel of Serum Circulating miRNAs for the Diagnosis of the Four Most Prevalent Tumor Types

by
Belén Pastor-Navarro
1,†,
María García-Flores
1,2,†,
Antonio Fernández-Serra
1,2,
Salvador Blanch-Tormo
3,
Fernando Martínez de Juan
4,
Carmen Martínez-Lapiedra
4,
Fernanda Maia de Alcantara
4,
Juan Carlos Peñalver
5,
José Cervera-Deval
6,
José Rubio-Briones
7,
Jaime García-Rupérez
8 and
José Antonio López-Guerrero
1,2,9,*
1
Laboratory of Molecular Biology, Fundación Instituto Valenciano de Oncología, 46009 Valencia, Spain
2
IVO-CIPF Joint Research Unit of Cancer, Príncipe Felipe Research Center (CIPF), 46012 Valencia, Spain
3
Department of Medical Oncology, Fundación Instituto Valenciano de Oncología, 46009 Valencia, Spain
4
Unit of Gastroenterology, Fundación Instituto Valenciano de Oncología, 46009 Valencia, Spain
5
Department of Thoracic Surgery, Fundación Instituto Valenciano de Oncología, 46009 Valencia, Spain
6
Department of Radiology, Fundación Instituto Valenciano de Oncología, 46009 Valencia, Spain
7
Department of Urology, Fundación Instituto Valenciano de Oncología, 46009 Valencia, Spain
8
Nanophotonics Technology Center, Universitat Politècnica de València, 46022 Valencia, Spain
9
Department of Pathology, School of Medicine, Catholic University of Valencia ‘San Vicente Mártir’, 46001 Valencia, Spain
*
Author to whom correspondence should be addressed.
These authors contributed equally to this work.
Int. J. Mol. Sci. 2020, 21(8), 2783; https://doi.org/10.3390/ijms21082783
Submission received: 17 March 2020 / Revised: 9 April 2020 / Accepted: 15 April 2020 / Published: 16 April 2020
(This article belongs to the Special Issue MicroRNA Biology in Cancer Development)

Abstract

:
The purpose of this study is to clinically validate a series of circulating miRNAs that distinguish between the 4 most prevalent tumor types (lung cancer (LC); breast cancer (BC); colorectal cancer (CRC); and prostate cancer (PCa)) and healthy donors (HDs). A total of 18 miRNAs and 3 housekeeping miRNA genes were evaluated by qRT-PCR on RNA extracted from serum of cancer patients, 44 LC, 45 BC, 27 CRC, and 40 PCa, and on 45 HDs. The cancer detection performance of the miRNA expression levels was evaluated by studying the area under the curve (AUC) of receiver operating characteristic (ROC) curves at univariate and multivariate levels. miR-21 was significantly overexpressed in all cancer types compared with HDs, with accuracy of 67.5% (p = 0.001) for all 4 tumor types and of 80.8% (p < 0.0001) when PCa cases were removed from the analysis. For each tumor type, a panel of miRNAs was defined that provided cancer-detection accuracies of 91%, 94%, 89%, and 77%, respectively. In conclusion, we have described a series of circulating miRNAs that define different tumor types with a very high diagnostic performance. These panels of miRNAs would constitute the basis of different approaches of cancer-detection systems for which clinical utility should be validated in prospective cohorts.

1. Introduction

Nowadays, cancer is expected to rank as the leading cause of death in every country of the Western world in the 21st century. The Global Cancer Observatory (GLOBOCAN) 2018 estimated that there would be 18.1 million new cancer cases and 9.6 million cancer deaths worldwide in 2018. Globally, the incidence rate for all cancers combined was about 20% higher in men than in women, with the incidence rates varying across regions in both males and females, indicating that 1 in 8 men and 1 in 10 women will develop cancer along their life. For both sexes combined, lung cancer (LC) is the most commonly diagnosed cancer (11.6% of the total cases), followed by female breast cancer (BC) (11.6%), colorectal cancer (CRC) (10.2%), and prostate cancer (PCa) (7.1%) [1].
Despite the high mortality of this disease, it has been demonstrated that the chance of curing cancer is very high when identified early. In this sense, cancer screening programs (CSPs) play a critical role in identifying cancer before symptoms appear, and their impact on cancer-specific and overall survival has been well documented [2]. Many of these CSPs may involve analytical procedures such as blood or urine tests, other tests, or medical imaging that identifies individuals with a high probability of having cancer and whose diagnosis should be confirmed by means of a histopathological examination.
Many of these analytical tests are based on the identification of blood-based tumor biomarkers which constitute a readily available, inexpensive, and minimally invasively tool which also allows for repeated sampling [3].
Particularly, microRNAs (miRNAs) are 19–25 nucleotide noncoding RNA molecules that regulate a variety of cellular processes including cell differentiation, cell cycle progression, and apoptosis [4]. Some studies have reported that some circulating miRNAs in serum and plasma can be used as noninvasive biomarkers for defining different stages of disease, including cancer [5].
To take advantage of miRNAs as biomarkers for the early identification of cancer, the H2020 European project SAPHELY (Self-amplified photonic biosensing platform for microRNA-based early diagnosis of diseases) (https://saphely.eu/) is focused on developing a nanophotonic-based handheld point of care nanophotonic device for detecting specific circulating miRNAs for the four major cancer types: LC, BC, CRC, and PCa.
Hence, the purpose of this study is to clinically validate a series of circulating miRNAs that distinguish between the different tumor types and controls and that could constitute the basis of the SAPHELY detection system.

2. Results

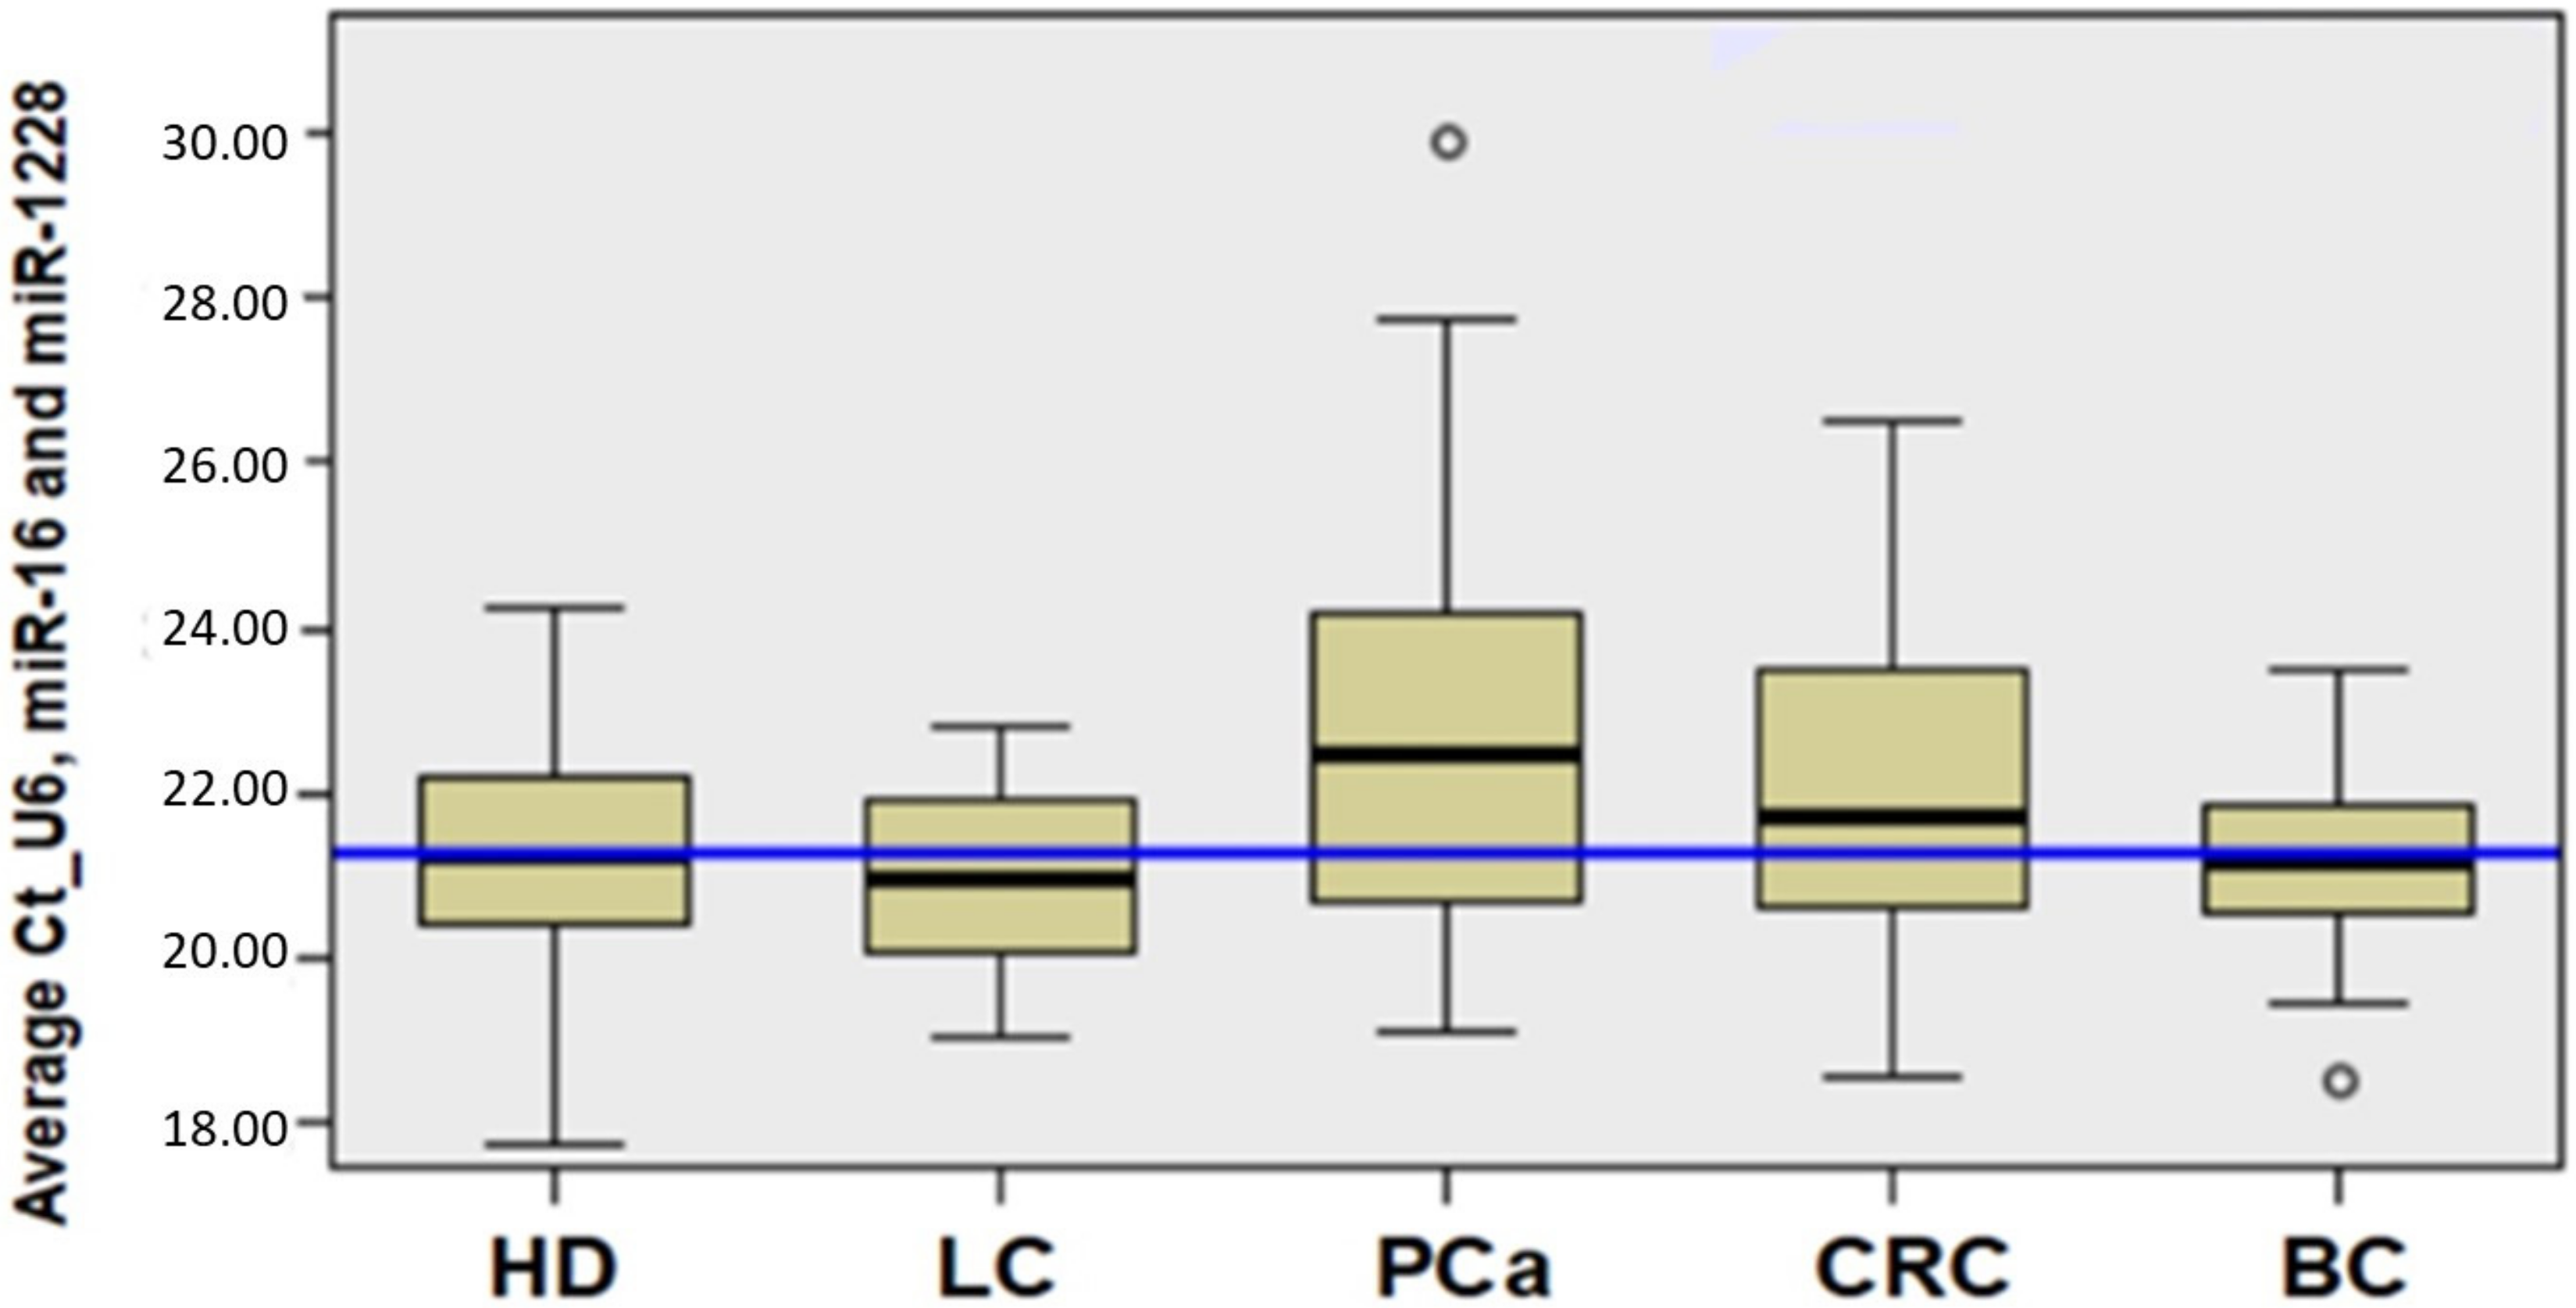
2.1. Average of Expression Levels of Housekeeping Genes U6snRNA, miRNA-16, and miRNA-1228 as Reference in the Serum of HDs and Cancer Patients

To quantify the expression of the selected circulating miRNAs, it was necessary to select a reference housekeeping miRNA or combination of miRNAs [6] with stable expression levels in the serum from both healthy donors (HDs) and cancer patients. Three housekeeping miRNAs were evaluated: U6snRNA, miR-16, and miR-1228 [7,8,9].
The average Ct value of each housekeeping miRNA or the mean Ct values of the combination of 2 or 3 of these miRNAs were evaluated to select the best combination of miRNAs that did not show differences between the groups under study. A nonparametric test for independent samples based on the median of the Ct values was used to demonstrate that no significant differences between groups were observed (Figure 1). This analysis shows that the Ct average of the three housekeeping genes constituted the best option for normalizing the circulating miRNAs expression levels.

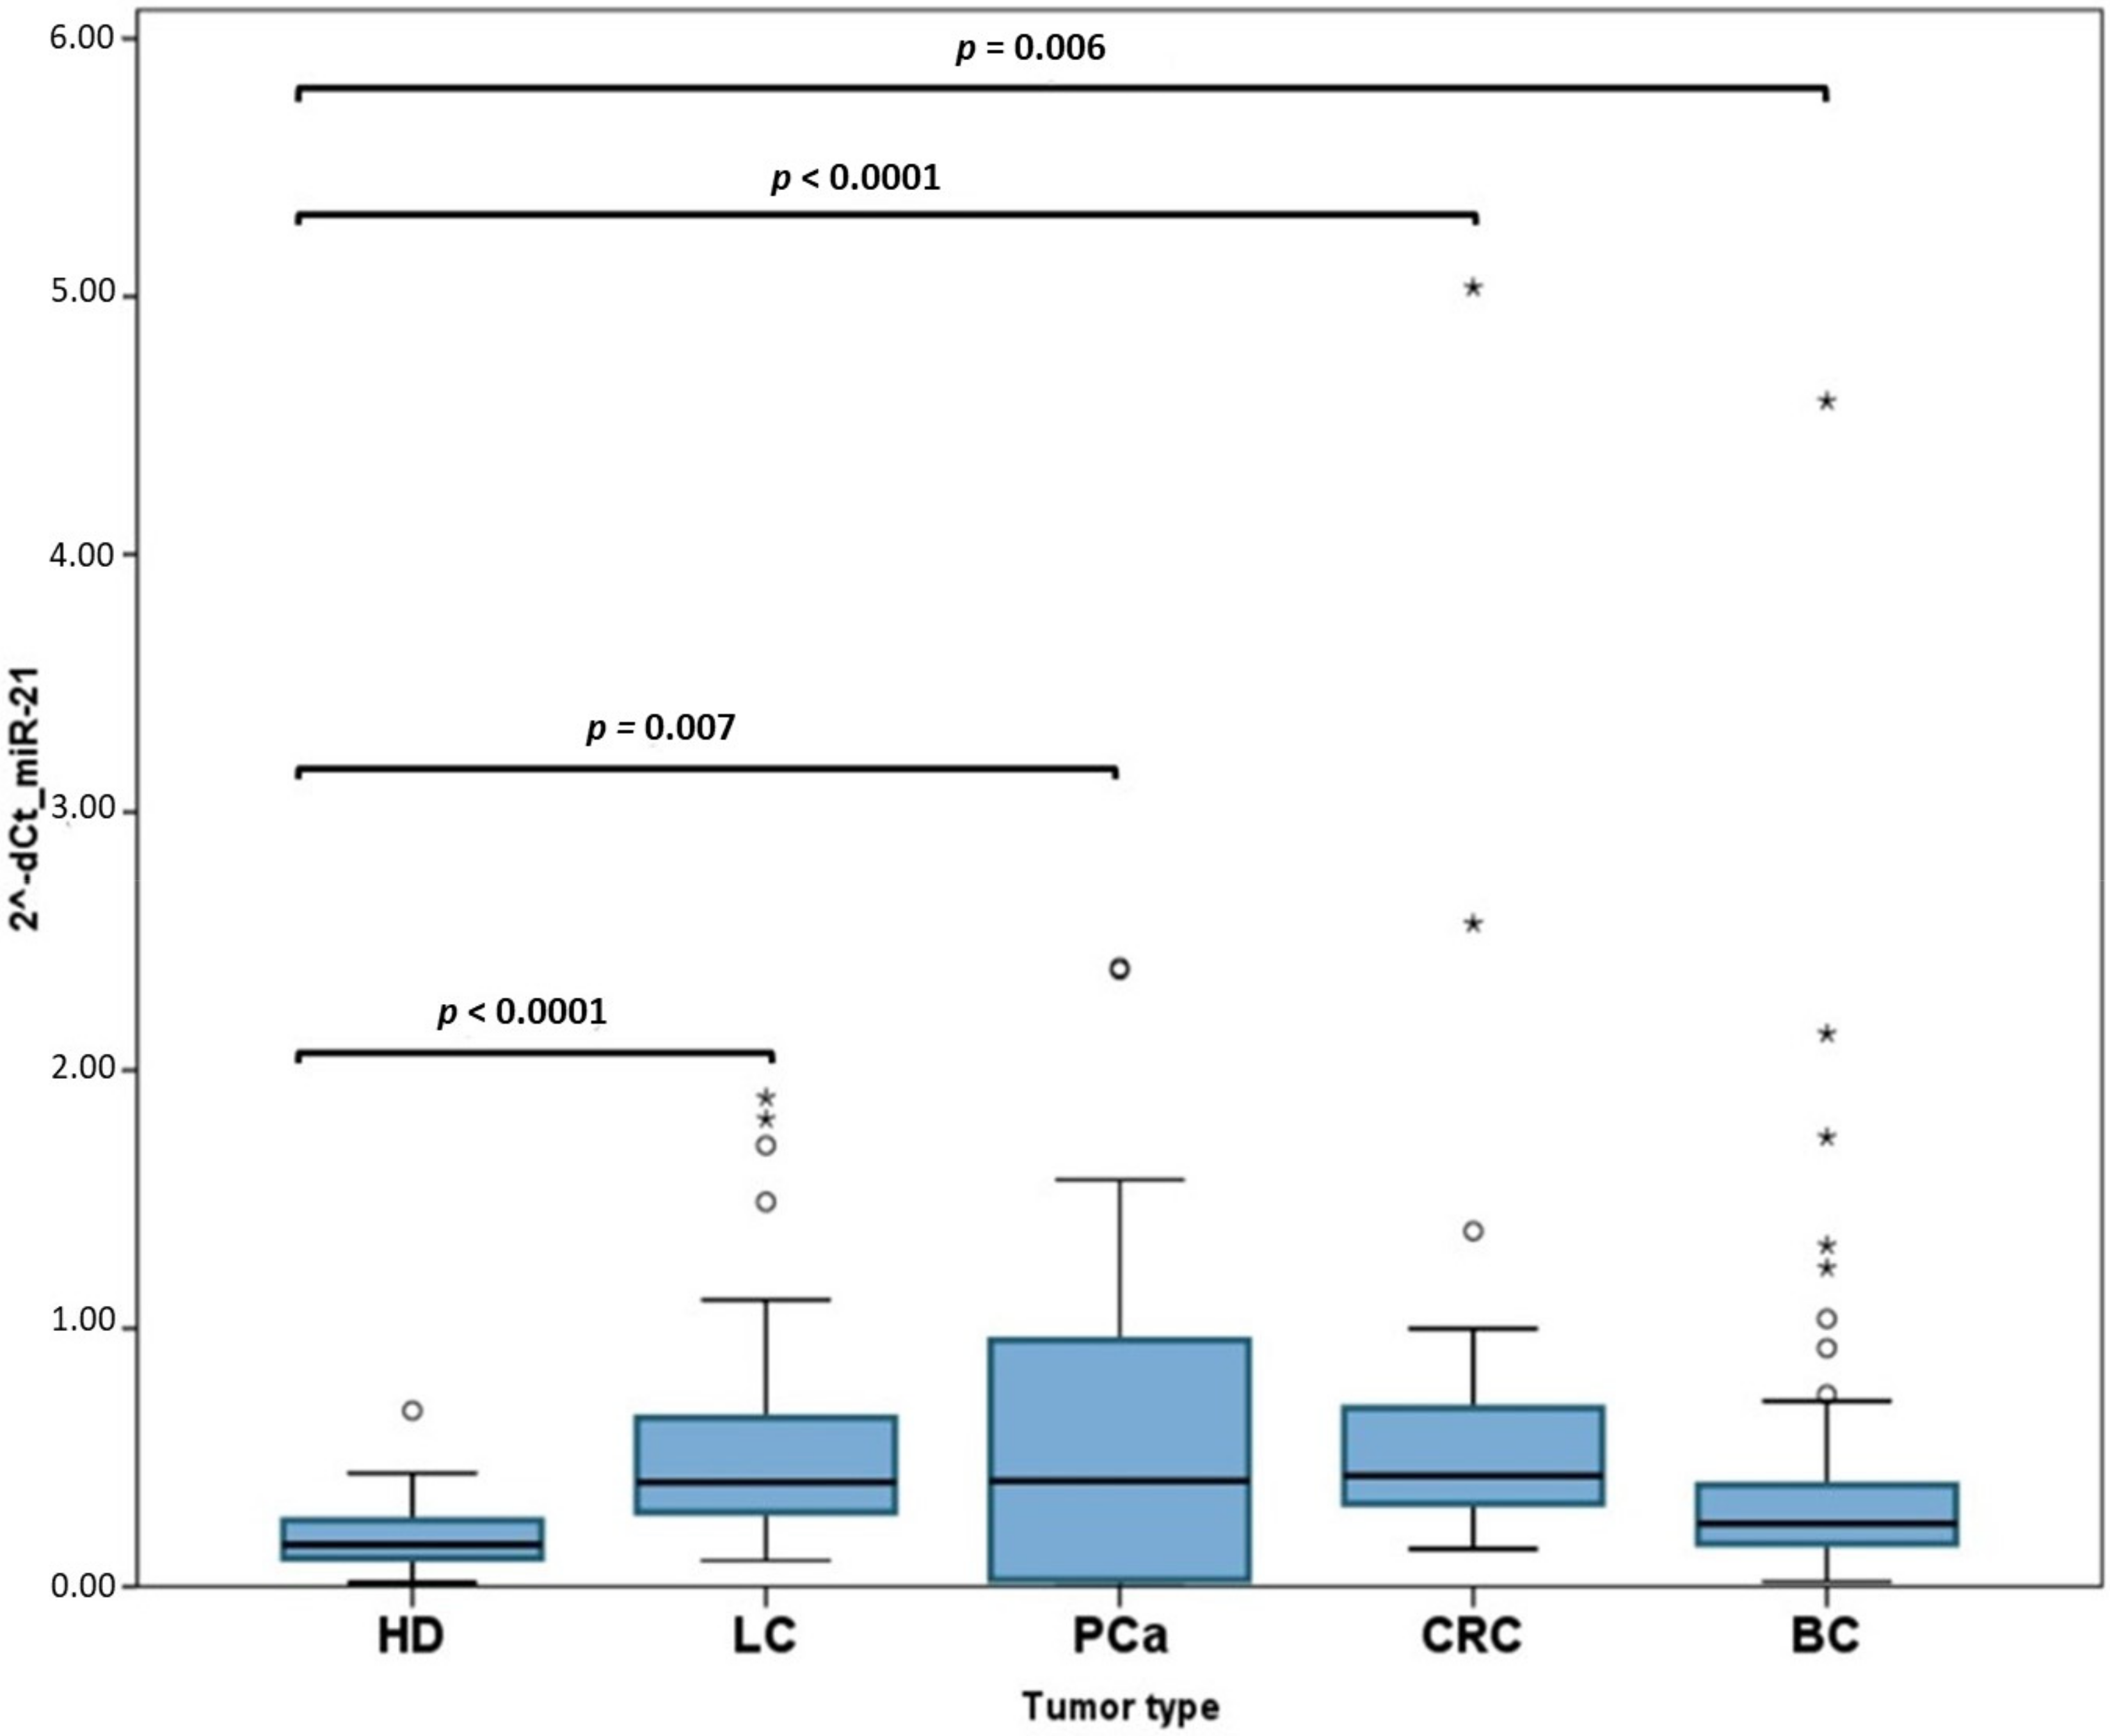
2.2. Analysis of miR-21

miR-21 was significantly overexpressed in all cancer types compared with HDs (Figure 2), suggesting that only this miRNA might be indicative for the presence of cancer. In order to analyze the diagnostic performance of circulating miRNA-21, a ROC curve was calculated, obtaining an AUC of 0.675 (95% CI: 0.578–0.736; p = 0.001) (Figure 3A). Interestingly, when PCa patients were removed from the analysis (because the dispersion of miR-21 expression in this cohort was very high), the diagnostic performance of miR-21 increased in almost 15%: AUC of 0.808 (95% CI: 0.738–0.878; p < 0.0001) (Figure 3B).

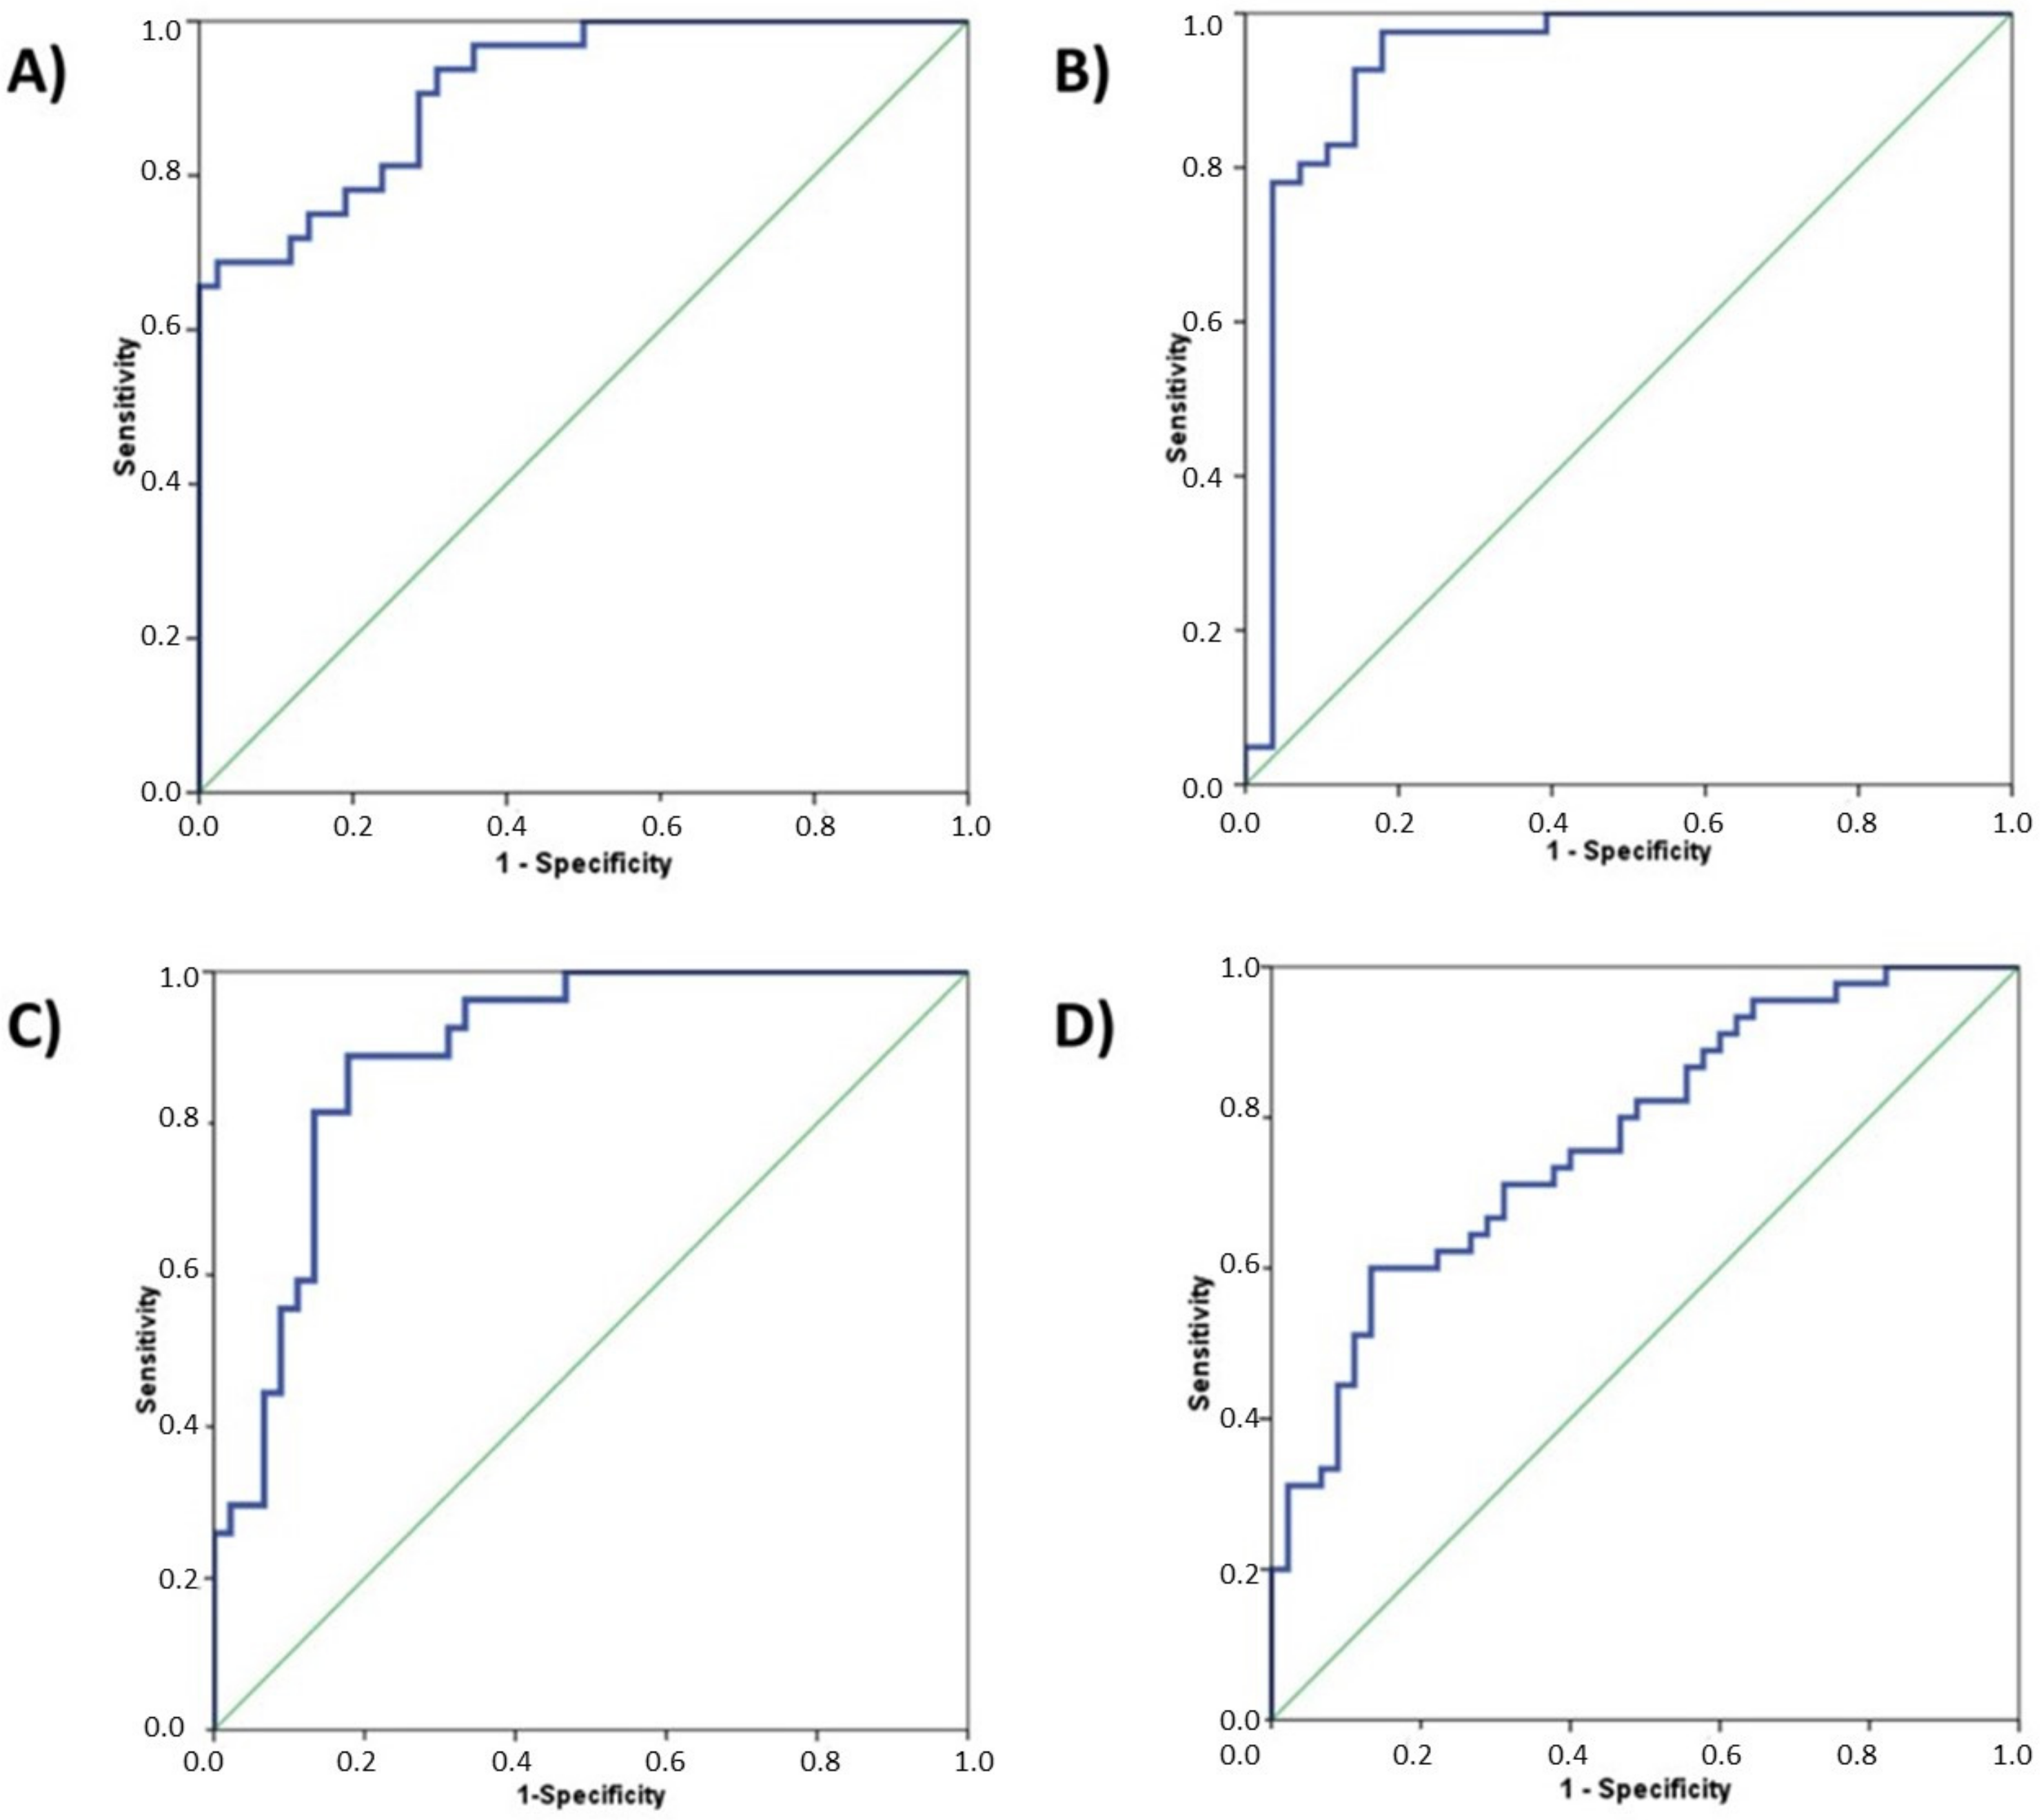
2.3. Definition of Circulating miRNA Panels to Identify Cancer Patients

As for miR-21, the diagnostic performance of the other circulating miRNAs was evaluated with ROC curves for each tumor type. The results are summarized in Table 1.
The analysis was performed separately for each tumor type considering those tumor-specific miRNAs (Table S1). For each miRNA, the AUC was calculated, indicating that not all selected miRNAs could be useful for distinguishing between cancer patients and HDs (Table 1). According to this analysis, the following set of miRNAs significantly identified specific cancer patients: LC (miR-21, miR-429, miR-200b, and miR-125b) (Figure 4A); PCa (miR-21, miR-141, miR-375, miR-125b, and miR-182) (Figure 4B); CRC (miR-21, miR-29a, miR-210, miR-200c, and miR-155) (Figure 4C); and BC (miR-21 and miR-205) (Figure 4D).

2.4. Multivariate Analysis

In order to adjust the weight of each miRNAs in detecting cancer, a Fisher linear discriminant analysis was performed for each tumor type using only those miRNAs that significantly identified cancer patients (those with an AUC > 0.5 and p-value < 0.05) (Table 1). ROC curves for these models showed that the combinations of the expression levels of circulating miRNAs improved the discriminant diagnostic capability of individual miRNAs (Table 2 and Figure 5). Therefore, the diagnostic accuracy in identifying cancer patients with these models are 77%, 89%, 91%, and 94% for BC, CRC, LC, and PCa, respectively.
In order to validate the power of the statistical model, a cross-validation consisting of 1000 iterations with replacement was performed for each tumor type. The strategy was to repeat cross-validation at intervals of 10 samples (i.e., 30, 40, 50, …, n with n being the sample size of each of the four datasets). Every subset is randomly resampled in each iteration up to 1000. These subsamples show that stabilization of the AUC along with standard deviation shrinkage is achieved before reaching the sample size studied in this work, showing an asymptotic pattern and suggesting that an increase of the number of cases for each tumor type would not significantly change the observed AUC (Figure S1).

2.5. Analysis of Variation of the Tumor-Selected Circulating-miRNA Depending on Tumor Stage

In order to demonstrate if the tumor-selected circulating-miRNAs are associated to tumor stages, a nonparametric test for independent samples was performed. The results showed a significant increase (p ≤ 0.001) in the probability of being classified as cancer cases as tumor stage rises, corroborating the performance of miRNAs selected as diagnostic and prognostic tools (Figure S2).
Moreover, a nonparametric test was also performed in PCa samples to analyze the probability of being classify as cancer cases based on the variation of the PCa-selected circulating-miRNA depending on Gleason Score (GS) and prostate specific antigen (PSA) values. In this case, despite the fact that the median values of the probabilities are higher in GS, ≥7, and serum PSA, ≥4.33 ng/mL, the differences were not statistically significant (p > 0.05) (Figure S3), mainly because of the disbalancing of the groups analyzed, with only 15% of cases belonging to advanced disease.

3. Discussion

Cancer represents the set of diseases with more incidences and mortality in Western countries, and its numbers are increasing every year with the consequent social and economic impacts [1]. For that reason, special efforts have been allocated to the design of efficient CSP for specific tumor types that impact overall survival [10,11,12,13]. Most of these CSP incorporate screening tests for selecting individuals with risk of having cancer to whom the standard diagnostic procedures are applied to confirm the disease. Unfortunately, most of these tests have demonstrated poor accuracy and efficacy, particularly among the most prevalent cancers [14]. The actual cancer-screening tests for the four most prevalent tumor types (CRC, LC, PCa, and BC) are mainly based on radiological images (Computed Axial Tomography (CAT), mammography, and multiparametric magnetic resonance for LC, BC, and PCa respectively), some biomarkers such as PSA in PCa or fecal occult blood for CRC, and other invasive interventions such as colonoscopy for CRC [11,12,13,14]. These cancer-screening tests are characterized by low sensitivities or specificities (PSA and fecal occult blood tests) or require specialized trained personnel (image related tests) that make them expensive and limit their use to specific populations and/or referral centers [14]. This is the reason by which blood biomarkers have been proposed as effective indicators to distinguish between cancer and normal conditions or among different cancer groups [15].
More than one decade ago, it was reported that miRNAs are also present in blood [16]. Circulating miRNAs were found to be remarkably stable even under conditions as harsh as boiling, low or high pH, long-time storage at room temperature, and multiple freeze-thaw cycles [5]. Furthermore, miRNAs also represent the status of the disease as they are associated with tumor biology and tumor behavior [17,18]. Thus far, distinctive patterns of circulating miRNAs have been found for different tumor types [19] including BC [20], PCa [21], LC [22], and CRC [23].
Taking all these premises into consideration, the H2020-SAPHELY project (https://saphely.eu) intends to break into the field of screening tests for early diagnosis of the four major cancer types, PCa, BC, LC, and CRC, by using a novel ultrahigh sensitivity nanophotonic-based sensing technique for the direct detection of circulating miRNA biomarkers through a combination of molecular beacon probes with an attached high index nanoparticle so that the hybridization events are translated into the displacement of these nanoparticles from the sensor surface [24,25]. The idea of the SAPHELY device because of the final cost of the test and the expected accuracy in cancer detection is that it could be useful in a cancer screening context. For an explanation of how the SAPHELY device would work, please visit the following URL: https://youtu.be/6ZAuSkfJrB8?list=PL8qM5Jl41EI7iW2a57QEyaCvRFHn-ix95.
With this study, we have evaluated, from the clinical point of view, a series of miRNAs that were already defined in independent studies (Table S2) and that, to some extent, were associated with diagnosis or tumor progression of patients with at least one of the four most prevalent types of tumors (Table S1). For LC and CRC, two sets of 7 miRNAs each were evaluated; 5 miRNAs were evaluated for PCa; and 3 were evaluated for BC. The expression levels of these miRNAs were analyzed by qRT-PCR and their diagnostic capacity by ROC curves using serum samples from cancer patients and HDs in order to define those miRNAs that finally would be incorporated within the SAPHELY detection system. Based on our results, only 12 miRNAs (miR-21, miR-429, miR-200b, miR-125b, miR-141, miR-375, miR-182, miR-29a, miR-210, miR-200c, miR-155, and miR-205) and three housekeeping genes (U6snRNA, miR-16, and miR-1228) would constitute the basis of the detection system of the SAPHELY device. Combinations of the expression levels of these miRNAs provides diagnosis accuracies of 77%, 89%, 91%, and 94% for BC, CRC, LC, and PCa, respectively (Figure 5 and Table 2).
Interestingly, of all validated miRNAs, miR-21 was overexpressed in all four cancer types, particularly in BC, CRC, and LC. In fact, the diagnostic accuracy for cancer of miR-21 was 67.5% when considering the four tumor types and it increased up to 80.8% when PCa patients were released from the analysis. Overall, miR-21 is considered to be a typical “onco-miR”, which acts by inhibiting the expression of phosphatases, which limit the activity of signaling pathways such as AKT and MAPK. miR-21 is associated with a wide variety of cancers including that of breast [26], ovaries [27], colorectal [28], lung, or prostate [29], among others. More recently, a 2014 meta-analysis of 36 studies evaluated circulating miR-21 as a biomarker of various carcinomas, finding that it has potential as a tool for early diagnosis [30], findings which are in accordance to those herein reported.
The LC miRNA panel is represented by miR-21, miR-429, miR-200b, and miR-125b; except for miR-21, the rest of miRNAs were discovered and validated in a previous study in which we collaborated with Reference [31]. This work defined a panel of 6 miRNAs with a diagnostic accuracy for LC of 89%, which is very close to the 91% described in our study.
We have defined BC detection with miR-21 and miR-205, achieving a 77% diagnostic precision. With this study, we have confirmed the diagnostic value of miR-205 defined by other authors that demonstrated the overexpression of this miRNA in serum of BC patients [32,33].
For PCa, the diagnostic accuracy defined by the miRNA panel (miR-21, miR-141, miR-375, miR-125b, and miR-182) was 94%, the highest of our series and similar to other clinico-molecular multi-biomarker panels focused on detection of high-grade PCa [34]. Whereas circulating miR-141, miR-375, and miR-125b were already described by other authors as potential diagnostic biomarkers [35,36], we have introduced miR-182 as a novel promising circulating miRNA. Overexpression of this miRNA was reported by our group as the strongest prognostic miRNA in PCa, and their expression was directly proportional to tumor stage and Gleason score [37]. Hence, with this study, we have demonstrated that circulating miR-182 (AUC: 0.895; 95% CI: 0.824–0.967; p < 0.0001) significantly increases the performance of the PCa miRNA panel.
Finally, CRC miRNA panel (miR-21, miR-29a, miR-210, miR-200c, and miR-155) achieves an 89% diagnostic performance. These miRNAs have been already described by other authors [4,38,39], and our study validates in an independent cohort of cases their findings.
Additionally, due the role of miRNA as key regulators of virtually every biological process, it is interesting to study the impact of miRNA in phenotypes by studying the role of its effector mRNAs. In this sense, there is a great corpus of evidence from both functional studies and computational predictions. This data is organized in public databases on the Internet along which one of the most important is miRBase [40].
An in silico analysis reveals a dense network of gene effectors of the miRNA in every one of the four tumor types studied. Gene Set Enrichment Analysis (GSEA) highlighted the three top overrepresented pathways. In all four datasets, the main Kyoto Encyclopedia of Genes and Genomes (KEGG) category is pathways related to cancer. In LC, this category is accompanied by ErbB signaling and PCa pathways, whereas PCa showed altered pancreatic and PCa pathways. CRC and finally the BC series have overrepresented pancreatic and PCa pathways. There is difficulty drawing direct conclusions of such a dense network of genes; thus, the network was previously pruned according the degree of the nodes in every one of the disease set. The top overrepresented KEGG pathways are closely related with cancer in all the cases with interesting potential mRNA biomarkers which deserve to be explored (Figure S4).
Moreover, we have demonstrated that the tumor-selected circulating-miRNA are associated to different tumor stages but not to GS and serum PSA values in the case of PCa. This observation gives robust evidence of circulating-miRNA utility as a diagnostic and prognostic tool in these four cancer types.
However, this present study has some limitations. In the first place, we only have analyzed some miRNAs considered tumor specific for each cancer type, but there are more miRNAs that have not been investigated that could be relevant for cancer diagnosis. Moreover, we need an amplification step in order to increase the miRNA concentration to being able to detect them, but the SAPHELY device is not be able to perform this step, a point that could be crucial for the success of the device. Finally, we have defined a panel for each cancer type, but they are not always represented, with all altered miRNAs in all cases hindering the disease identification.
Because of these limitations, this present study must be continued by analyzing more miRNAs that can be completely tumor-specific and by improving the detection system to offset the low concentration of miRNAs in bloodstream.

4. Patients and Methods

4.1. Ethics Statement

This study was approved by the Clinical Research Ethics Committee (CREC) of the Fundación Instituto Valenciano de Oncología of Valencia (FIVO) at the meeting celebrated on 30 December 2014. Written informed consent was obtained from each participant prior to sample collection.

4.2. Patients’ Characteristics

Patients with newly diagnosed LC, BC, CRC, and PCa were considered eligible for this study. Within the period from October 2011 to March 2017, a total of 156 cancer patients (44 LC, 40 PCa, 27 CRC, and 45 BC) was finally selected. Patients’ clinical and histopathological information are summarized in Table 3. Serum samples from 45 HDs with no history of cancer or other chronical disease prior the blood collection were also collected. These samples were included as a control group for the miRNA analyses.

4.3. MiRNAs Selection for Each Tumor Type

In view of the role of miRNAs as diagnostic biomarkers, a literature search was performed to identify those miRNA candidates to be implemented as biomarkers. A list of potential miRNAs was selected for each tumor type by applying a decision-making algorithm using PubMed as source of information. The search criteria used were (“microRNA” OR “miRNA” OR “miRNAs”) AND (“prostate cancer”/“breast cancer”/“lung cancer”/“colorectal cancer”) AND (“serum” OR “plasma”) AND (“diagnosis”). All the papers selected met the following criteria: expression of miRNAs in serum; papers written in English; and clinical setting: diagnosis, including control samples.
The results of the literature search are summarized in Table S2.

4.4. Blood Collection and RNA Extraction

Seven milliliters of peripheral blood from cancer patients and HDs were collected at the time of diagnosis in SARSTEDT Monovette Serum gel tubes (Sarstedt AG & Co, Nümbrecht, Germany) and left to clot at room temperature (RT) for 30 min. The serum was separated by centrifugation for 10 min 3000× g at RT and stored at FIVO Biobank at −80 °C in 1-mL aliquots until RNA could be extracted and purified.
Total RNA was isolated using the miRNeasy Serum/Plasma Kit (Qiagen N.V., Hilden, Germany) following the manufacturer’s instructions, starting with 200 µL of serum. The concentration of total RNA in each sample was measured using a NanoDrop 1000 spectrophotometer (Thermo Scientific, Wilmington, DE).

4.5. Conversion of total RNA into cDNA

One-hundred and fifty ng of total RNA were reverse-transcribed using the TaqMan MicroRNA Reverse Transcription kit (Applied Biosystems, Foster City, CA) in a total volume reaction of 15 µL containing 2 mM dNTPs, 3.3 U/mL MultiScribe reverse transcriptase, 1× reverse transcription buffer, 0.25 U/mL RNase inhibitor, and 0.02× of each specific miRNA primer (Table S1), that were pooled from a 5× solution to a working solution of 0.05× (TaqMan MicroRNA Assays, Applied Biosystems) and nuclease-free water. The reaction was performed using the Veriti Thermal Cycler (Applied Biosystems) at 16 °C for 30 min, 42 °C for 30 min, and 85 °C for 5 min.

4.6. cDNA Pre-Amplification

Five µL of cDNA was pre-amplified using the TaqMan PreAmp Master Mix (2×) according to the manufacturer’s instructions (Applied Biosystems). For this reaction, 5 µL of cDNA sample was added to a total volume of 25 µL containing 12.5 µL of TaqMan PreAmp Master Mix (2×), 7.25 µL of polled assay mix (0.2×), and nuclease-free water. The reaction was performed using a Veriti Thermal Cycler (Applied Biosystems) during 14 cycles at 95 °C for 10 min, 95 °C for 15 s, and 60 °C for 4 min.

4.7. Quantification of Circulating miRNAs by Quantitative Reverse Transcription-Polymerase Chain Reaction (qRT-PCR)

cDNA, previously pre-amplified, was diluted 1:10 in Tris-EDTA (TE) buffer 1× and added to a final qRT-PCR reaction volume of 20 µL, which contained TaqMan MicroRNA assay primers (Applied Biosystems) for each miRNA (Table S1), TaqMan Gene Expression Master Mix (2×) (Applied Biosystems), and nuclease-free water. The reaction was performed using ABI 7500 fast real-time PCR systems (Applied Biosystems) at 95 °C for 10 min and 40 cycles at 95 °C for 15 s and 60 °C for 60 s.
After validating the Ct mean of the housekeeping genes, U6snRNA, miR-16, and miR-1228, as reference miRNAs, the relative levels of each specific miRNA was calculated using the equation 2-∆Ct, where ∆Ct = mean CtmiRNA-mean Ct(miR-U6,16&1228), and Ct = threshold cycle.

4.8. Statistical Analysis

The differences in circulating miRNA levels and the ROC curves were evaluated using IBM SPSS Statistics V22.0 (SPSS, Chicago, IL). Kruskal-Wallis nonparametric test was used to perform a statistical analysis of serum miRNA levels; for post hoc pairwise comparison, U Mann-Whitney test was used. The median expression level of each miRNA between different groups was compared (cancer vs. HDs).
For the multivariate analysis, Fisher linear discriminant analysis was employed. In order to establish the feasibility of this kind of analysis, assumptions of the model in terms of inequality of covariances and variances were checked with M-Box and Lambda of Wilks tests, respectively. The obtained discriminant function was used to classify the samples as tumor or normal. Performances of univariate and multivariate analysis were studied with the AUC of ROC curves.

4.9. miRNA Target-Interactions Analysis

In this analysis, miRNet tool was used (url: https://www.mirnet.ca/miRNet/home.xhtml) [41].
Briefly, this resource implements algorithms for differential expression and mining in miRNA databases in order to create a graph representing the relationships between miRNAs and its targets. Networks can be manually amplified and pruned. Finally, it implements hypergeometric tests to perform a gene set enrichment analysis with KEGG pathways [42].

5. Conclusions

In conclusion, with this study, we have defined a series of circulating miRNAs that define different tumor types with a very high diagnostic performance. In addition, these miRNAs would constitute the basis of a multianalyte blood test through the SAPHELY detection system; however, their clinical utility should be demonstrated in a prospective study in the context of a CSP.

Supplementary Materials

Supplementary materials can be found at https://www.mdpi.com/1422-0067/21/8/2783/s1.

Author Contributions

B.P.-N., M.G.-F., J.G.-R. and J.A.L.-G. contributed to the study design. S.B.-T., F.M.d.J., C.M.-L., F.M.d.A., J.C.P., J.C.-D. and J.R.-B. contributed to the data acquisition. B.P.-N., M.G.-F., A.F.-S. and J.A.L.-G. contributed to data analysis and statistics. B.P.-N., M.G.-F., A.F.-S. and J.A.L.-G. contributed to manuscript preparation, editing, and reviewing. All authors have read and agreed to the published version of the manuscript.

Funding

This work was supported by grants PROMETEO 2016/103 from the Conselleria de Educación, Cultura y Deporte of Generalitat Valenciana; SAPHELY H2020-ICT-2014-1-644242 from the European Commission; and a PhD grant (APRO2019 to BPN) from the Spanish Association Against Cancer (AECC).

Acknowledgments

Authors thank Tania Mazcuñán Vitiello, Marta Ramírez Calvo, and Patricia Carretero Hinojosa for technical assistance. We also thank the Biobank of the Fundación Instituto Valenciano de Oncología for providing the biological samples for the analysis.

Conflicts of Interest

The authors declare no conflict of interest.

References

  1. Bray, F.; Ferlay, J.; Soerjomataram, I.; Siegel, R.L.; Torre, L.A.; Jemal, A. Global cancer statistics 2018: GLOBOCAN estimates of incidence and mortality worldwide for 36 cancers in 185 countries. CA Cancer J. Clin. 2018, 68, 394–424. [Google Scholar] [CrossRef] [PubMed] [Green Version]
  2. Duffy, S.W.; Tabar, L.; Olsen, A.H.; Vitak, B.; Allgood, P.C.; Chen, T.H.; Yen, A.M.; Smith, R.A. Absolute numbers of lives saved and overdiagnosis in breast cancer screening, from a randomized trial and from the Breast Screening Programme in England. J. Med. Screen. 2010, 17, 25–30. [Google Scholar] [CrossRef] [PubMed]
  3. Boussios, S.; Ozturk, M.A.; Moschetta, M.; Karathanasi, A.; Zakynthinakis-Kyriakou, N.; Katsanos, K.H.; Christodoulou, D.K.; Pavlidis, N. The Developing Story of Predictive Biomarkers in Colorectal Cancer. J. Pers. Med. 2019, 9, 12. [Google Scholar] [CrossRef] [PubMed] [Green Version]
  4. Huang, Z.; Huang, D.; Ni, S.; Peng, Z.; Sheng, W.; Du, X. Plasma microRNAs are promising novel biomarkers for early detection of colorectal cancer. Int J. Cancer 2010, 127, 118–126. [Google Scholar] [CrossRef]
  5. Chen, X.; Ba, Y.; Ma, L.; Cai, X.; Yin, Y.; Wang, K.; Guo, J.; Zhang, Y.; Chen, J.; Guo, X.; et al. Characterization of microRNAs in serum: A novel class of biomarkers for diagnosis of cancer and other diseases. Cell Res. 2008, 18, 997–1006. [Google Scholar] [CrossRef] [Green Version]
  6. Faraldi, M.; Gomarasca, M.; Sansoni, V.; Perego, S.; Banfi, G.; Lombardi, G. Normalization strategies differently affect circulating miRNA profile associated with the training status. Sci. Rep. 2019, 9, 1584. [Google Scholar] [CrossRef] [Green Version]
  7. Sanders, I.; Holdenrieder, S.; Walgenbach-Brünagel, G.; von Ruecker, A.; Kristiansen, G.; Müller, S.C.; Ellinger, J. Evaluation of reference genes for the analysis of serum miRNA in patients with prostate cancer, bladder cancer and renal cell carcinoma. Int. J. Urol. 2012, 19, 1017–1025. [Google Scholar] [CrossRef]
  8. Hu, J.; Wang, Z.; Liao, B.Y.; Yu, L.; Gao, X.; Lu, S.; Wang, S.; Dai, Z.; Zhang, X.; Chen, Q.; et al. Human miR-1228 as a stable endogenous control for the quantification of circulating microRNAs in cancer patients. Int. J. Cancer 2014, 135, 1187–1194. [Google Scholar] [CrossRef]
  9. Rinnerthaler, G.; Hackl, H.; Gampenrieder, S.P.; Hamacher, F.; Hufnagl, C.; Hauser-Kronberger, C.; Zehentmayr, F.; Fastner, G.; Sedlmayer, F.; Mlineritsch, B.; et al. miR-16-5p Is a Stably-Expressed Housekeeping MicroRNA in Breast Cancer Tissues from Primary Tumors and from Metastatic Sites. Int. J. Mol. Sci. 2016, 17, 156. [Google Scholar] [CrossRef]
  10. Vanderburgh, D. Breast cancer screening. Politics Life Sci. 2018, 37, 135–140. [Google Scholar] [CrossRef]
  11. Stewart, R.W.; Lizama, S.; Peairs, K.; Sateia, H.F.; Choi, Y. Screening for prostate cancer. Semin. Oncol. 2017, 44, 47–56. [Google Scholar] [CrossRef] [PubMed]
  12. Sateia, H.F.; Choi, Y.; Stewart, R.W.; Peairs, K.S. Screening for lung cancer. Semin. Oncol. 2017, 44, 74–82. [Google Scholar] [CrossRef] [PubMed]
  13. Choi, Y.; Sateia, H.F.; Peairs, K.S.; Stewart, R.W. Screening for colorectal cancer. Semin. Oncol. 2017, 44, 34–44. [Google Scholar] [CrossRef] [PubMed]
  14. Schiffman, J.D.; Fisher, P.G.; Gibbs, P. Early detection of cancer: Past, present, and future. Am. Soc. Clin. Oncol. Educ. Book 2015, 35, 57–65. [Google Scholar] [CrossRef] [Green Version]
  15. Song, T.; Liang, Y.; Cao, Z.; Du, W.; Li, Y. Computational Analysis of Specific MicroRNA Biomarkers for Noninvasive Early Cancer Detection. Biomed. Res. Int. 2017, 2017, 4680650. [Google Scholar] [CrossRef]
  16. Mitchell, P.S.; Parkin, R.K.; Kroh, E.M.; Fritz, B.R.; Wyman, S.K.; Pogosova-Agadjanyan, E.L.; Peterson, A.; Noteboom, J.; O’Briant, K.C.; Allen, A.; et al. Circulating microRNAs as stable blood-based markers for cancer detection. Proc. Natl. Acad. Sci. USA 2008, 105, 10513–10518. [Google Scholar] [CrossRef] [Green Version]
  17. Ryan, B.M.; Robles, A.I.; Harris, C.C. Genetic variation in microRNA networks: The implications for cancer research. Nat. Rev. Cancer 2010, 10, 389–402. [Google Scholar] [CrossRef]
  18. Calin, G.A.; Dumitru, C.D.; Shimizu, M.; Bichi, R.; Zupo, S.; Noch, E.; Aldler, H.; Rattan, S.; Keating, M.; Rai, K.; et al. Frequent deletions and down-regulation of micro- RNA genes miR15 and miR16 at 13q14 in chronic lymphocytic leukemia. Proc. Natl. Acad. Sci. USA 2002, 99, 15524–15529. [Google Scholar] [CrossRef] [Green Version]
  19. Esquela-Kerscher, A.; Slack, F.J. Oncomirs-microRNAs with a role in cancer. Nat. Rev. Cancer 2006, 6, 259–269. [Google Scholar] [CrossRef]
  20. Zhang, L.; Xu, Y.; Jin, X.; Wang, Z.; Wu, Y.; Zhao, D.; Chen, G.; Li, D.; Wang, X.; Cao, H.; et al. A circulating miRNA signature as a diagnostic biomarker for non-invasive early detection of breast cancer. Breast Cancer Res. Treat. 2015, 154, 423–434. [Google Scholar] [CrossRef]
  21. Wang, S.Y.; Shiboski, S.; Belair, C.D.; Cooperberg, M.R.; Simko, J.P.; Stoppler, H.; Cowan, J.; Carroll, P.R.; Blelloch, R. miR-19, miR-345, miR-519c-5p serum levels predict adverse pathology in prostate cancer patients eligible for active surveillance. PLoS ONE 2014, 9, e98597. [Google Scholar] [CrossRef] [PubMed]
  22. Nadal, E.; Truini, A.; Nakata, A.; Lin, J.; Reddy, R.M.; Chang, A.C.; Ramnath, N.; Gotoh, N.; Beer, D.G.; Chen, G. A Novel Serum 4-microRNA Signature for Lung Cancer Detection. Sci. Rep. 2015, 5, 12464. [Google Scholar] [CrossRef] [Green Version]
  23. Hofsli, E.; Sjursen, W.; Prestvik, W.S.; Johansen, J.; Rye, M.; Tranø, G.; Wasmuth, H.H.; Hatlevoll, I.; Thommesen, L. Identification of serum microRNA profiles in colon cancer. Br. J. Cancer 2013, 108, 1712–1719. [Google Scholar] [CrossRef] [PubMed] [Green Version]
  24. Ruiz-Tórtola, Á.; Prats-Quílez, F.; González-Lucas, D.; Bañuls, M.J.; Maquieira, Á.; Wheeler, G.; Dalmay, T.; Griol, A.; Hurtado, J.; Bohlmann, H.; et al. Experimental study of the evanescent-wave photonic sensors response in presence of molecular beacon conformational changes. J. Biophotonics 2018, 11, e201800030. [Google Scholar] [CrossRef] [PubMed]
  25. Ruiz-Tórtola, Á.; Prats-Quílez, F.; González-Lucas, D.; Bañuls, M.J.; Maquieira, Á.; Wheeler, G.; Dalmay, T.; Griol, A.; Hurtado, J.; García-Rupérez, J. High sensitivity and label-free oligonucleotides detection using photonic bandgap sensing structures biofunctionalized with molecular beacon probes. Biomed. Opt. Express 2018, 9, 1717–1727. [Google Scholar] [CrossRef] [Green Version]
  26. Iorio, M.V.; Ferracin, M.; Liu, C.G.; Veronese, A.; Spizzo, R.; Sabbioni, S.; Magri, E.; Pedriali, M.; Fabbri, M.; Campiglio, M.; et al. MicroRNA gene expression deregulation in human breast cancer. Cancer Res. 2005, 65, 7065–7070. [Google Scholar] [CrossRef] [Green Version]
  27. Iorio, M.V.; Visone, R.; Di Leva, G.; Donati, V.; Petrocca, F.; Casalini, P.; Taccioli, C.; Volinia, S.; Liu, C.G.; Alder, H.; et al. MicroRNA signatures in human ovarian cancer. Cancer Res. 2007, 67, 8699–8707. [Google Scholar] [CrossRef] [Green Version]
  28. Asangani, I.A.; Rasheed, S.A.; Nikolova, D.A.; Leupold, J.H.; Colburn, N.H.; Post, S.; Allgayer, H. MicroRNA-21 (miR-21) post-transcriptionally downregulates tumor suppressor Pdcd4 and stimulates invasion, intravasation and metastasis in colorectal cancer. Oncogene 2008, 27, 2128–2136. [Google Scholar] [CrossRef] [Green Version]
  29. Volinia, S.; Calin, G.A.; Liu, C.G.; Ambs, S.; Cimmino, A.; Petrocca, F.; Visone, R.; Iorio, M.; Roldo, C.; Ferracin, M.; et al. A microRNA expression signature of human solid tumors defines cancer gene targets. Proc. Natl. Acad. Sci. USA 2006, 103, 2257–2261. [Google Scholar] [CrossRef] [Green Version]
  30. Wu, K.; Li, L.; Li, S. Circulating microRNA-21 as a biomarker for the detection of various carcinomas: An updated meta-analysis based on 36 studies. Tumor Biol. 2015, 36, 1973–1981. [Google Scholar] [CrossRef]
  31. Halvorsen, A.R.; Bjaanæs, M.; LeBlanc, M.; Holm, A.M.; Bolstad, N.; Rubio, L.; Peñalver, J.C.; Cervera, J.; Mojarrieta, J.C.; López-Guerrero, J.A.; et al. A unique set of 6 circulating microRNAs for early detection of non-small cell lung cancer. Oncotarget 2016, 7, 37250–37259. [Google Scholar] [CrossRef] [PubMed] [Green Version]
  32. Shaker, O.; Maher, M.; Nassar, Y.; Morcos, G.; Gad, Z. Role of microRNAs -29b-2, -155, -197 and -205 as diagnostic biomarkers in serum of breast cancer females. Gene 2015, 560, 77–82. [Google Scholar] [CrossRef]
  33. Zhang, H.; Li, B.; Zhao, H.; Chang, J. The expression and clinical significance of serum miR-205 for breast cancer and its role in detection of human cancers. Int. J. Clin. Exp. Med. 2015, 8, 3034–3043. [Google Scholar]
  34. Sathianathen, N.J.; Kuntz, K.M.; Alarid-Escudero, F.; Lawrentschuk, N.L.; Bolton, D.M.; Murphy, D.G.; Weight, C.J.; Konety, B.R. Incorporating Biomarkers into the Primary Prostate Biopsy Setting: A Cost-Effectiveness Analysis. J. Urol. 2018, 20, 1215–1220. [Google Scholar] [CrossRef]
  35. Singh, P.K.; Preus, L.; Hu, Q.; Yan, L.; Long, M.D.; Morrison, C.D.; Nesline, M.; Johnson, C.S.; Koochekpour, S.; Kohli, M.; et al. Serum microRNA expression patterns that predict early treatment failure in prostate cancer patients. Oncotarget 2014, 5, 824–840. [Google Scholar] [CrossRef] [PubMed]
  36. Cheng, H.H.; Mitchell, P.S.; Kroh, E.M.; Dowell, A.E.; Chéry, L.; Siddiqui, J.; Nelson, P.S.; Vessella, R.L.; Knudsen, B.S.; Chinnaiyan, A.M.; et al. Circulating microRNA profiling identifies a subset of metastatic prostate cancer patients with evidence of cancer-associated hypoxia. PLoS ONE 2013, 8, e69239. [Google Scholar] [CrossRef] [Green Version]
  37. Casanova-Salas, I.; Rubio-Briones, J.; Calatrava, A.; Mancarella, C.; Masiá, E.; Casanova, J.; Fernández-Serra, A.; Rubio, L.; Ramírez-Backhaus, M.; Armiñán, A.; et al. Identification of miR-187 and miR-182 as biomarkers of early diagnosis and prognosis in patients with prostate cancer treated with radical prostatectomy. J. Urol. 2014, 192, 252–259. [Google Scholar] [CrossRef] [PubMed]
  38. Tang, W.; Zhu, Y.; Gao, J.; Fu, J.; Liu, C.; Liu, Y.; Song, C.; Zhu, S.; Leng, Y.; Wang, G.; et al. MicroRNA-29a promotes colorectal cancer metastasis by regulating matrix metalloproteinase 2 and E-cadherin via KLF4. Br. J. Cancer 2014, 110, 450–458. [Google Scholar] [CrossRef] [PubMed] [Green Version]
  39. Pu, X.X.; Huang, G.L.; Guo, H.Q.; Guo, C.C.; Li, H.; Ye, S.; Ling, S.; Jiang, L.; Tian, Y.; Lin, T.Y. Circulating miR-221 directly amplified from plasma is a potential diagnostic and prognostic marker of colorectal cancer and is correlated with p53 expression. J. Gastroenterol. Hepatol. 2010, 25, 1674–1680. [Google Scholar] [CrossRef]
  40. Kozomara, A.; Birgaoanu, M.; Griffiths-Jones, S. miRBase: From microRNA sequences to function. Nucleic Acids Res. 2019, 47, D155–D162. [Google Scholar] [CrossRef]
  41. Fan, Y.; Siklenka, K.; Arora, S.K.; Ribeiro, P.; Kimmins, S.; Xia, J. miRNet-dissecting miRNA-target interactions and functional associations through network-based visual analysis. Nucleic Acids Res. 2016, 44, W135–W141. [Google Scholar] [CrossRef] [PubMed]
  42. Tilford, C.A.; Siemers, N.O. Gene set enrichment analysis. Methods Mol. Biol. 2009, 563, 99–121. [Google Scholar] [PubMed]
Figure 1. Selection of housekeeping genes: According to the null hypothesis, the median value of Ct of housekeeping genes has nonsignificant differences (p = 0.165), and the mean of Ct of U6snRNA, miR-16, and miR-1228 was used as a reference. Test used: nonparametric test for independent samples. The median value for each group is defined by the bold, black line within the box.
Ijms 21 02783 g001
Figure 2. Levels of miR-21 expression in different tumor groups: All cancer groups show a significantly higher expression of miR-21 compared with healthy donors (HDs). It should be noted that prostate cancer (PCa) cases report the highest dispersion for miR-21 expression.
Ijms 21 02783 g002
Figure 3. Receiver operating characteristic (ROC) curves for miR-21. (A) ROC curve including the patients for the four cancer groups: Area Under the Curve (AUC) = 0.675 (95% CI: 0.578–0.736; p = 0.001). (B) ROC curve excluding the cohort of PCa patients: AUC = 0.808 (95% CI: 0.738–0.878; p < 0.0001). ROC curve calculated is represented with blue line and green line is used as a reference.
Ijms 21 02783 g003
Figure 4. ROC curves of the selected circulating miRNAs selected for each tumor type: (A) LC for miR-21, miR-205, miR-429, miR-200b, miR-203, miR-125b, and miR-34b; (B) PCa for miR-21, miR-141, miR-375, miR-125b, and miR-182; (C) CRC, for miR-21, miR-92a, miR-29a, miR-210, miR-221, miR-200c and miR-155; and (D) BC, for miR-21, miR-155, and miR-205.
Ijms 21 02783 g004
Figure 5. ROC curves of the combination of circulating miRNAs for each tumor type: (A) LC (miR-21, miR-429, miR-200b, and miR-125b); (B) PCa (miR-21, miR-141, miR-375, miR-125b, and miR-182); (C) CRC (miR-29a, miR-210, miR-200c, and miR-155); and (D) BC (miR-21 and miR-205). ROC curve calculated is represented with blue line and green line is used as a reference.
Ijms 21 02783 g005
Table 1. Results of the ROC curve analysis: Summary of the results for each of the selected miRNAs according to tumor types.
Tumor TypemiRNAAUCp-Value95% CI
LCmiR-210.8210.0000120.7200.923
miR-2050.5970.1850270.4580.737
miR-4290.7860.0000970.6700.902
miR-200b0.7050.0051860.5770.833
miR-2030.5870.2375710.4490.724
miR-125b0.8772.6858 × 10−70.7850.969
miR-340.6690.0209070.5340.805
PCamiR-210.9021.7668 × 10−80.8090.994
miR-1410.7530.0003940.6350.870
miR-3750.7200.0020740.5960.843
miR-125b0.8320.0000030.7340.930
miR-1820.8952.8917 × 10−80.8240.967
CRCmiR-210.9131.4479 × 10−80.8480.978
miR-92a0.8090.0000220.6940.924
miR-29a0.5790.2774410.4410.717
miR-2100.6330.0683600.4940.772
miR-2210.8821.5783 × 10−70.8040.960
miR-200c0.5470.5162380.4070.687
miR-1550.2020.0000420.0950.308
BCmiR-210.7710.0000100.6760.866
miR-1550.3240.0041210.2130.436
miR-2050.6490.0146430.5350.764
Lung Cancer (LC); Prostate Cancer (PCa); Colorectal Cancer (CRC); Breast Cancer (BC)
Table 2. Performance of a tetra-panel of circulating miRNAs in identifying cancer patients.
Tumor TypemiRNAsAUCp-Value95% CI
LCmiR-21
miR-429
miR-200b
miR-125b
0.9141.2217 × 10−90.8534590.975410
PCamiR-21
miR-141
miR-375
miR-125b
miR-182
0.9378.5464 × 10−100.8664591.000000
CRCmiR-21
miR-92a
miR-221
0.8913.1869 × 10-−8 0.8180950.964621
BCmiR-21
miR-205
0.7730.0000080.6779060.867773
Table 3. Clinical and histopathological characteristics of patients.
Tumor TypenMedian Age (years)
(Range)
Gender
(M, Males; F, Females) (%)
Diagnosis (n)Stage (n)
HDs4556.5
(50–73)
M, 29 (64%)
F, 16 (36%)
--
CRC2770.5
(43–86)
M, 18 (67%)
F, 9 (33%)
ADC (24)
SRCC (1)
Tubular ADC (1)
MC (1)
I-IIA (15)
IIIB-IV (12)
BC4557
(36–87)
F, 45 (100%)IDC (35)
ILC (5)
DC in situ (4)
PC (1)
0 (8)
IA (13)
IIA-IIB (22)
IIIA-IIIB (2)
PCa4066
(46–78)
M, 40 (100%)ADC (40)cT1c (35)
cT2a (5)
LC4461
(51–82)
M, 31 (70%)
F, 13 (30%)
ADC (33)
SCC (8)
SC (1)
NC (2)
IA-IB (28)
IIA-IIB (7)
IIIA-IV (9)
Adenocarcinoma: ADC; Signet ring cell carcinoma: SRCC; Tubular adenocarcinoma with high-grade dysplasia: Tubular ADC; Mucinous carcinoma: MC; Invasive ductal carcinoma: IDC; Invasive lobular carcinoma: ILC; Ductal carcinoma in situ: DC in situ; Papillary carcinoma: PC; Squamous cells carcinoma: SCC; Sarcomatoid carcinoma: SC; Neuroendocrine carcinoma: NC.

