Role of UDP-Sugar Receptor P2Y14 in Murine Osteoblasts

Abstract
1. Introduction
2. Results
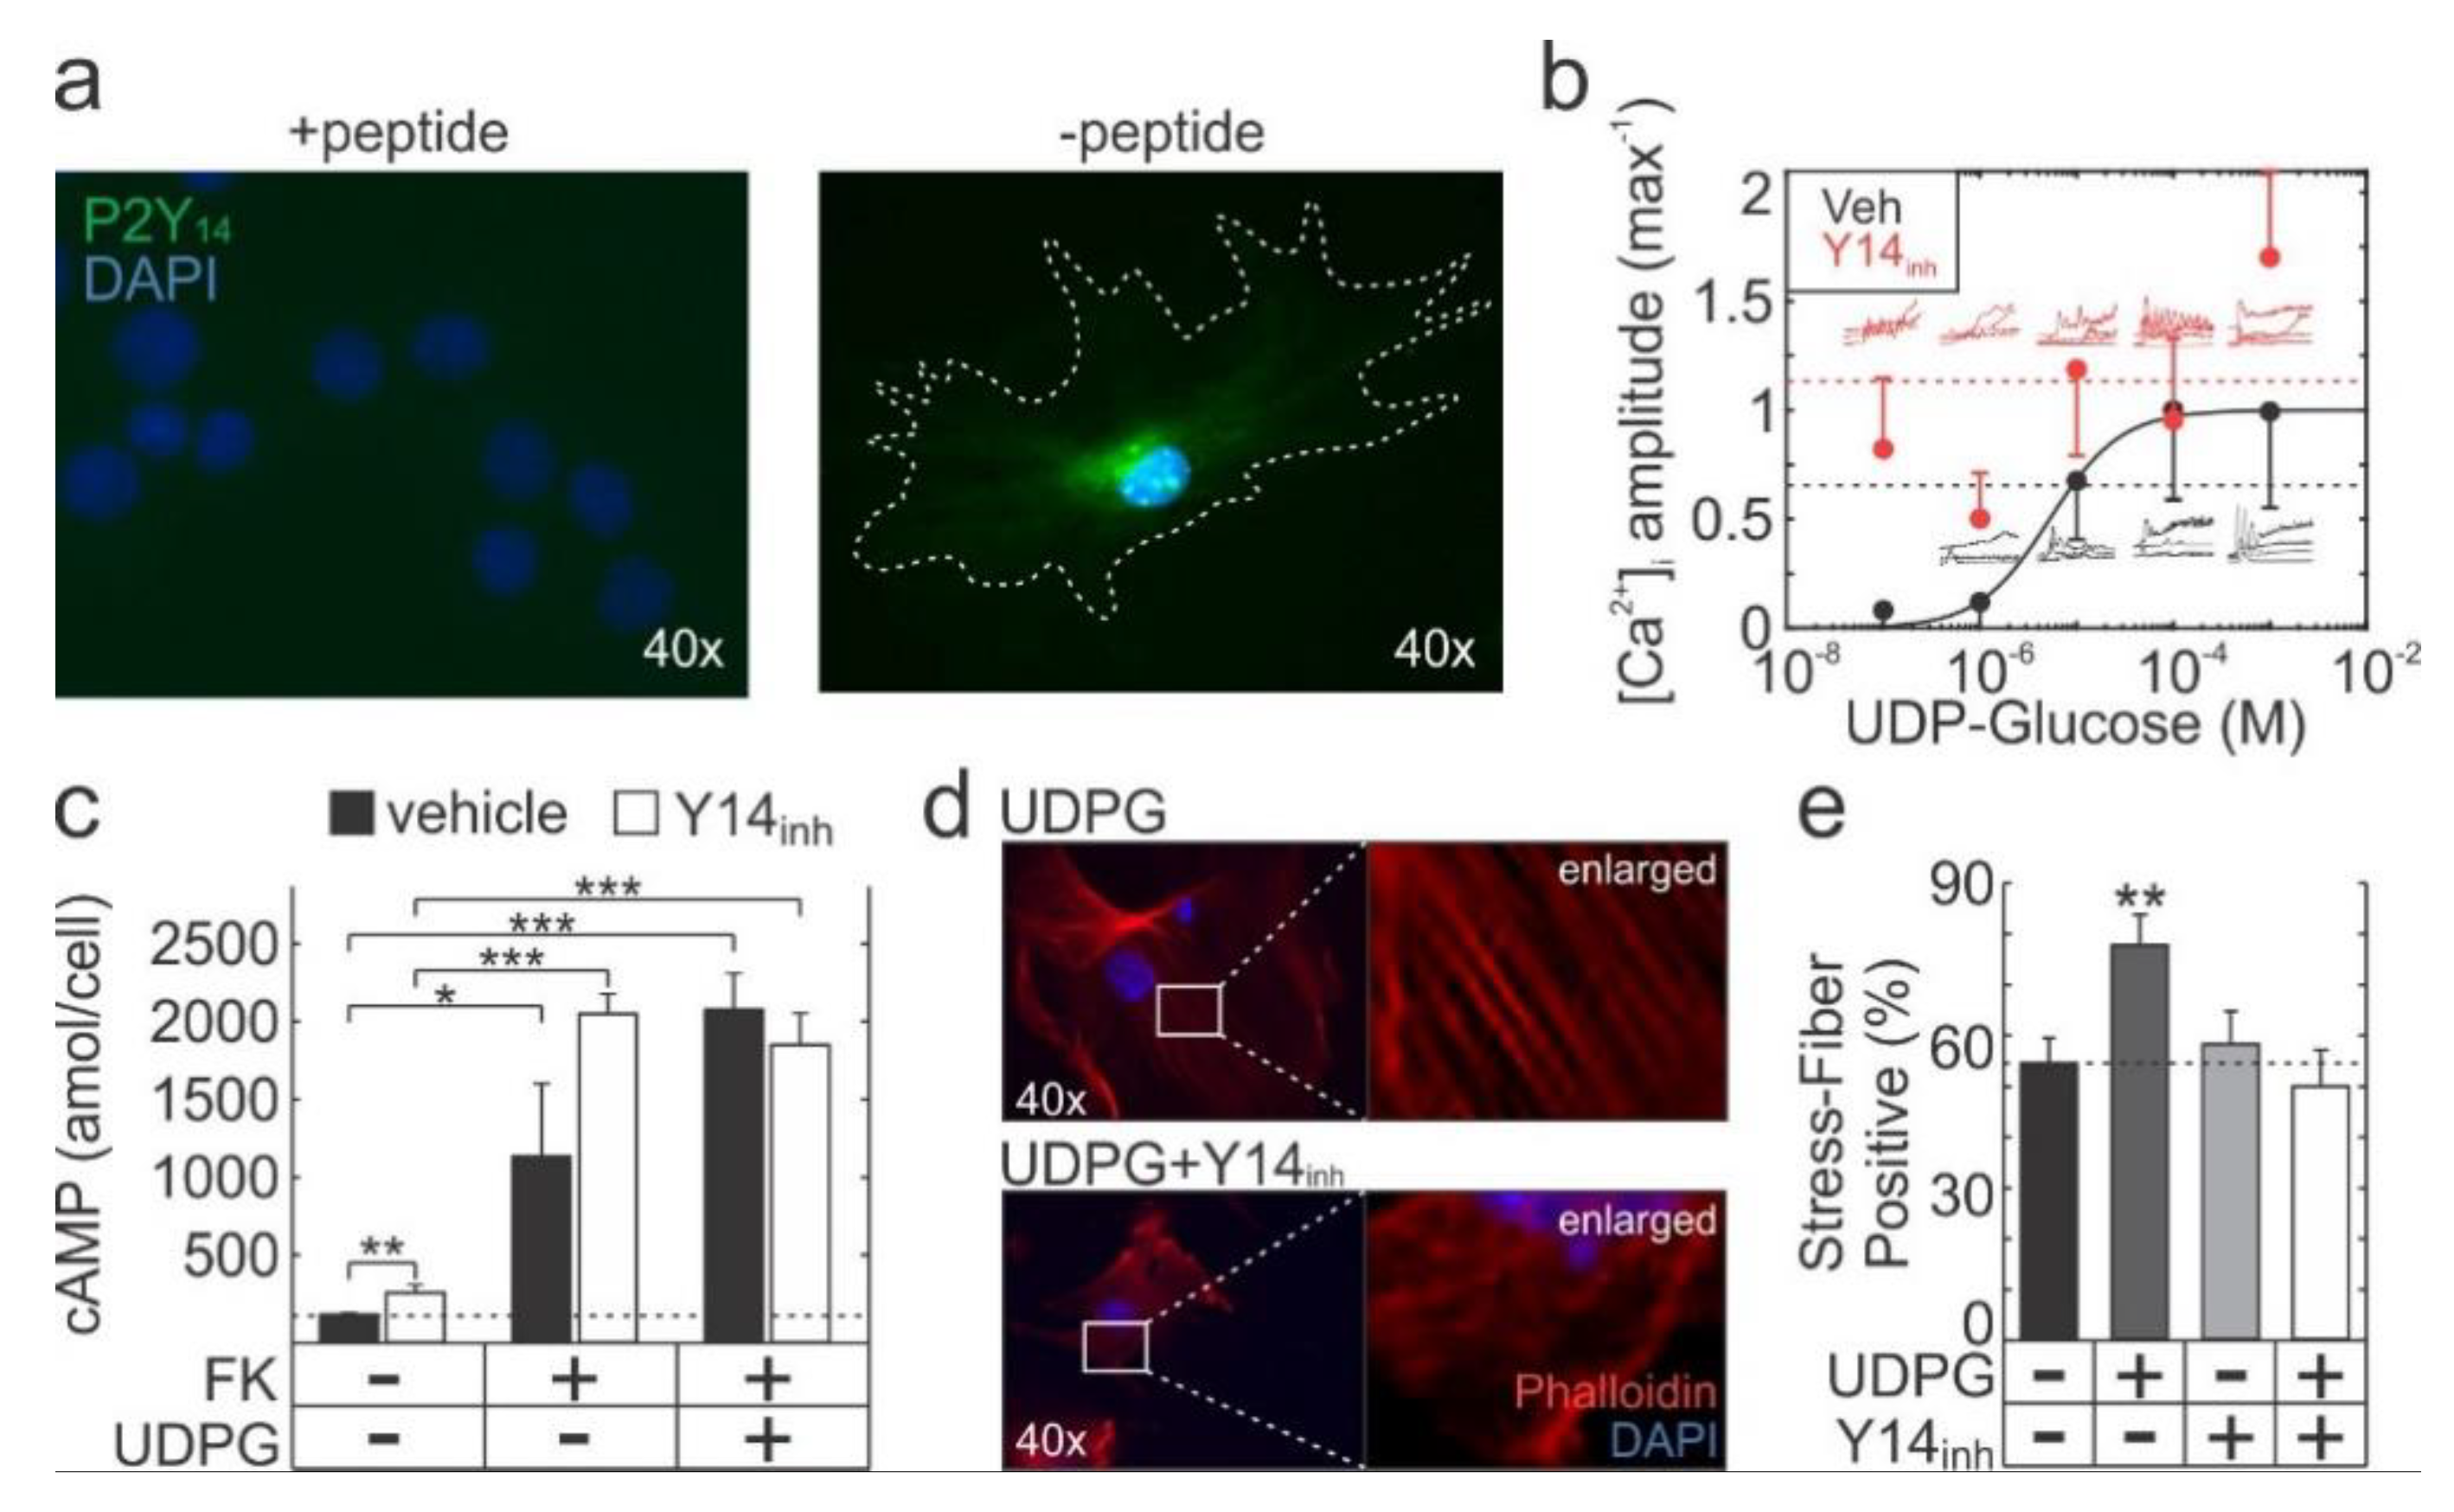
2.1. Functional P2Y14 is Expressed in Primary Murine Osteoblasts
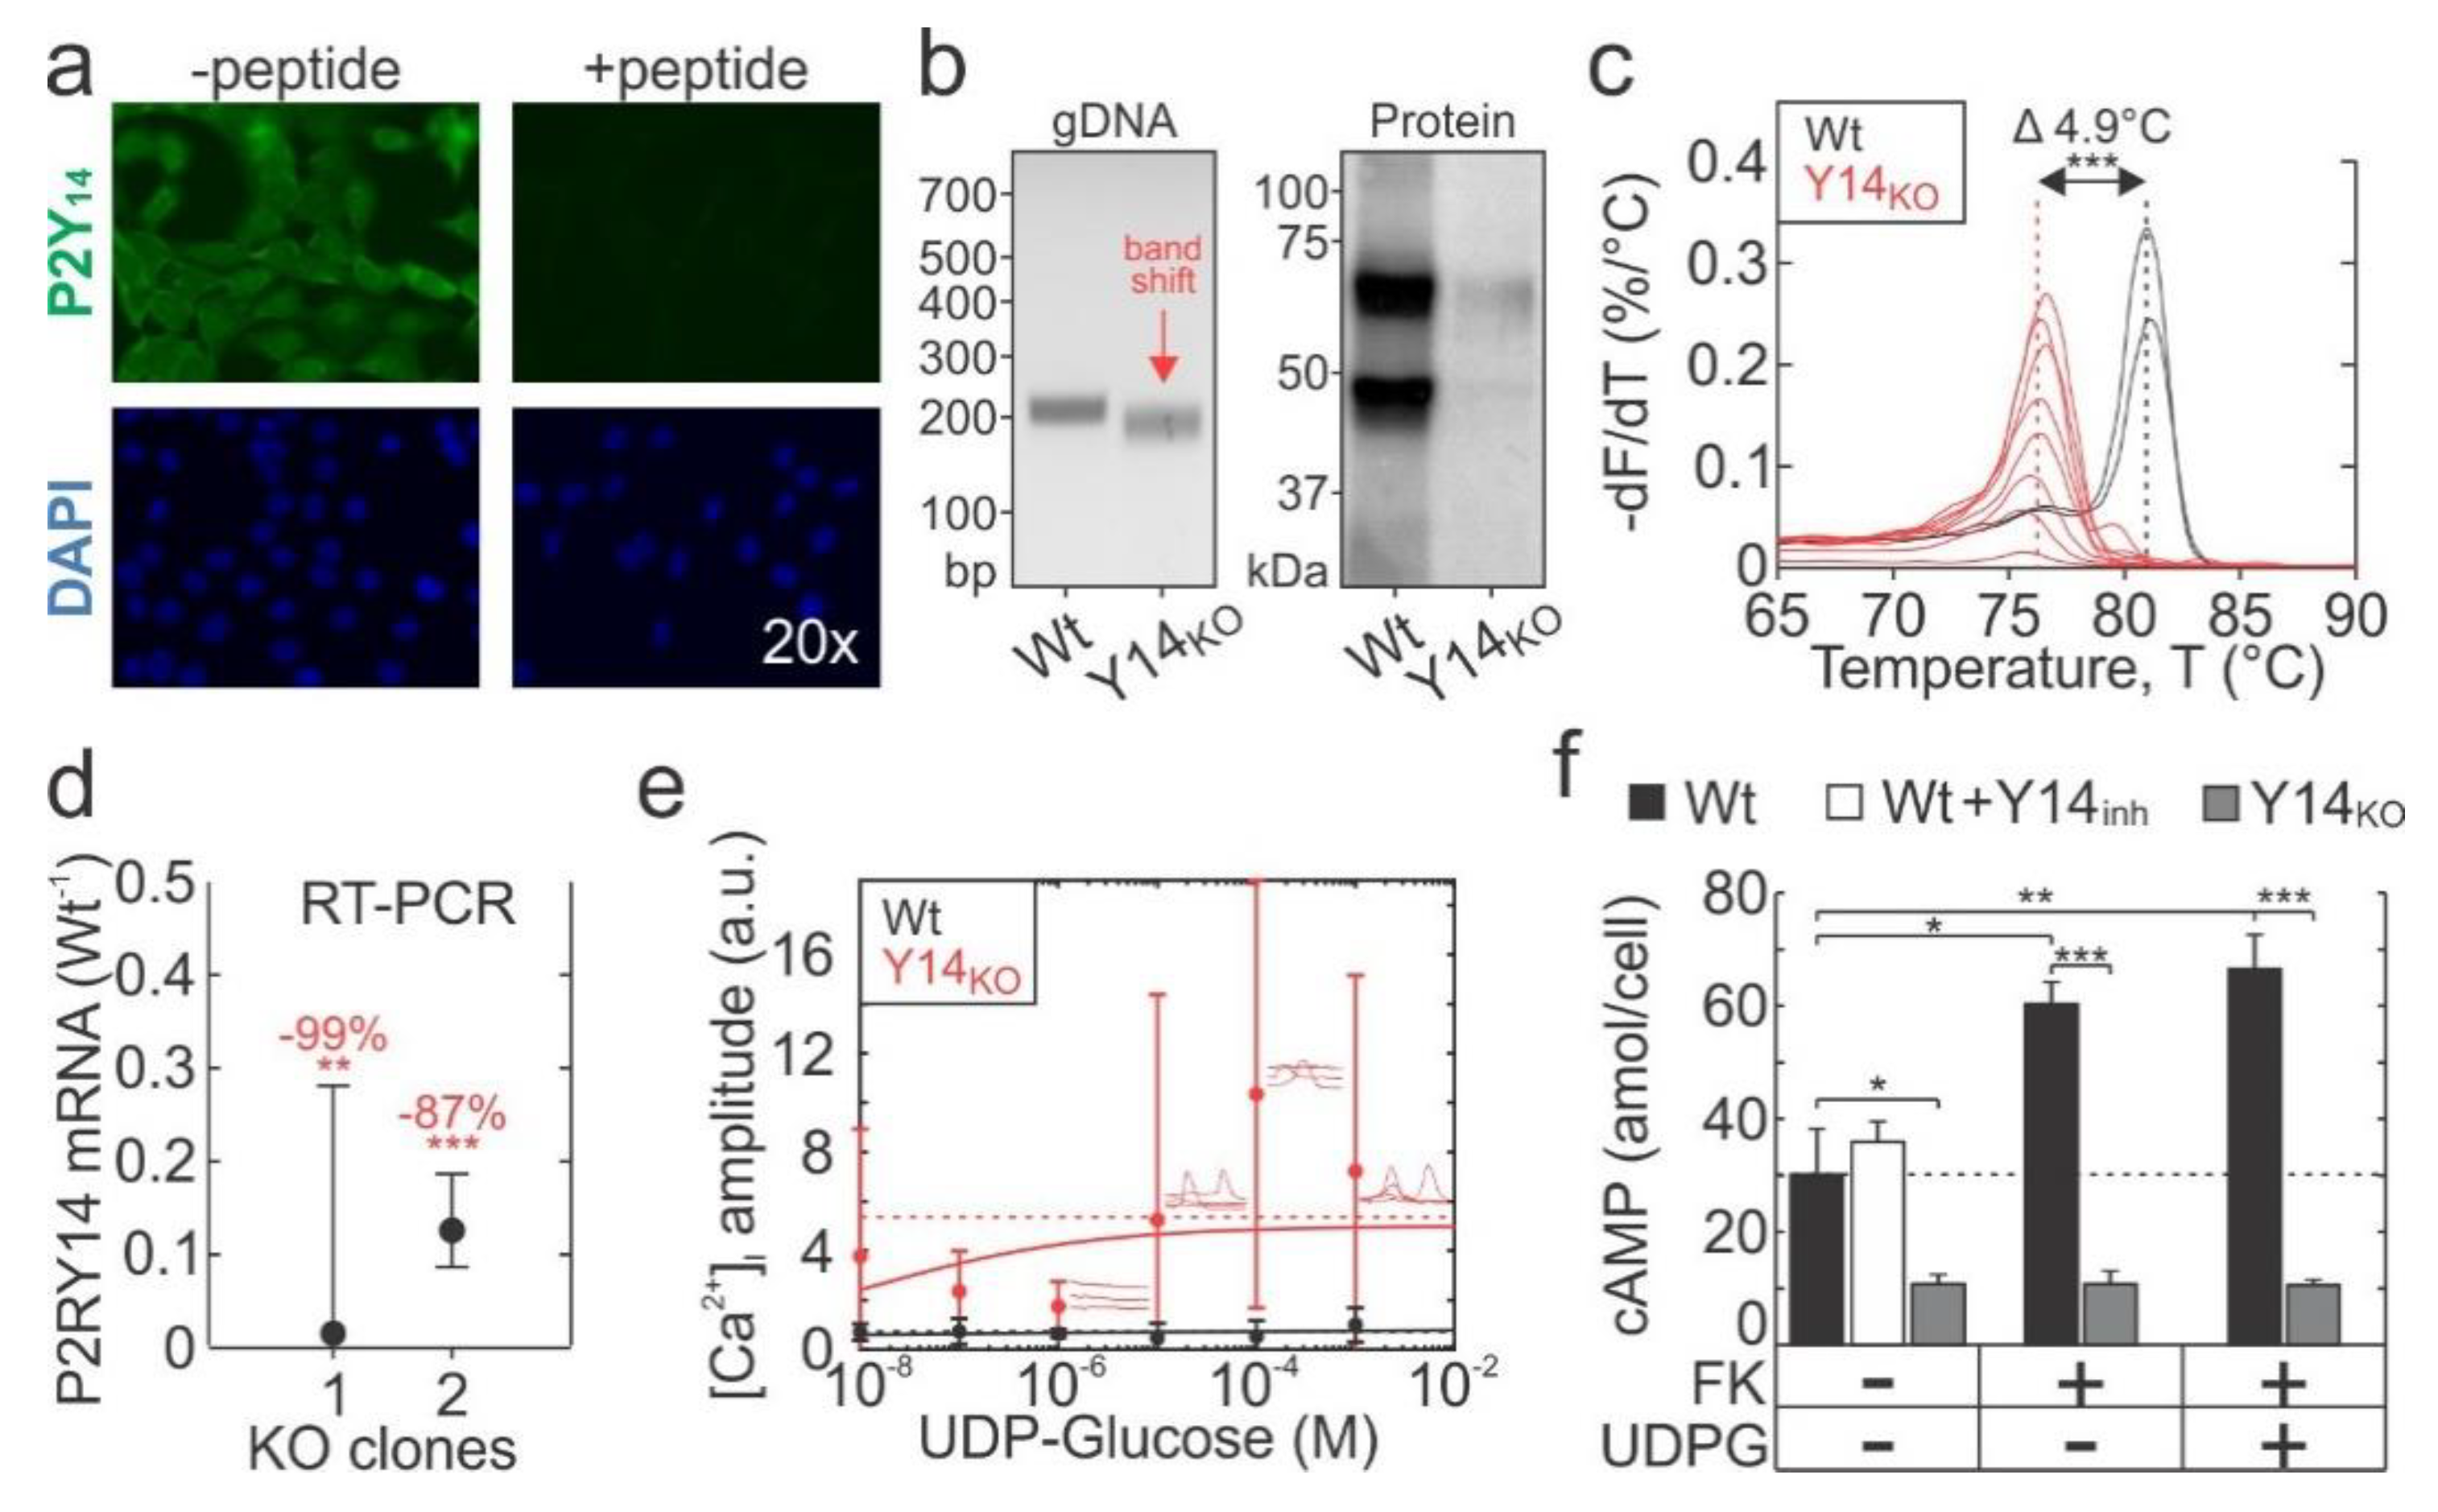
2.2. Generation of P2Y14 Knockout Cell-Line with CRISPR-Cas9
2.3. P2Y14 Negatively Modulates Mechanical and Purinergic Signalling in Osteoblasts
2.4. P2Y14 Signalling is Associated with Proliferation
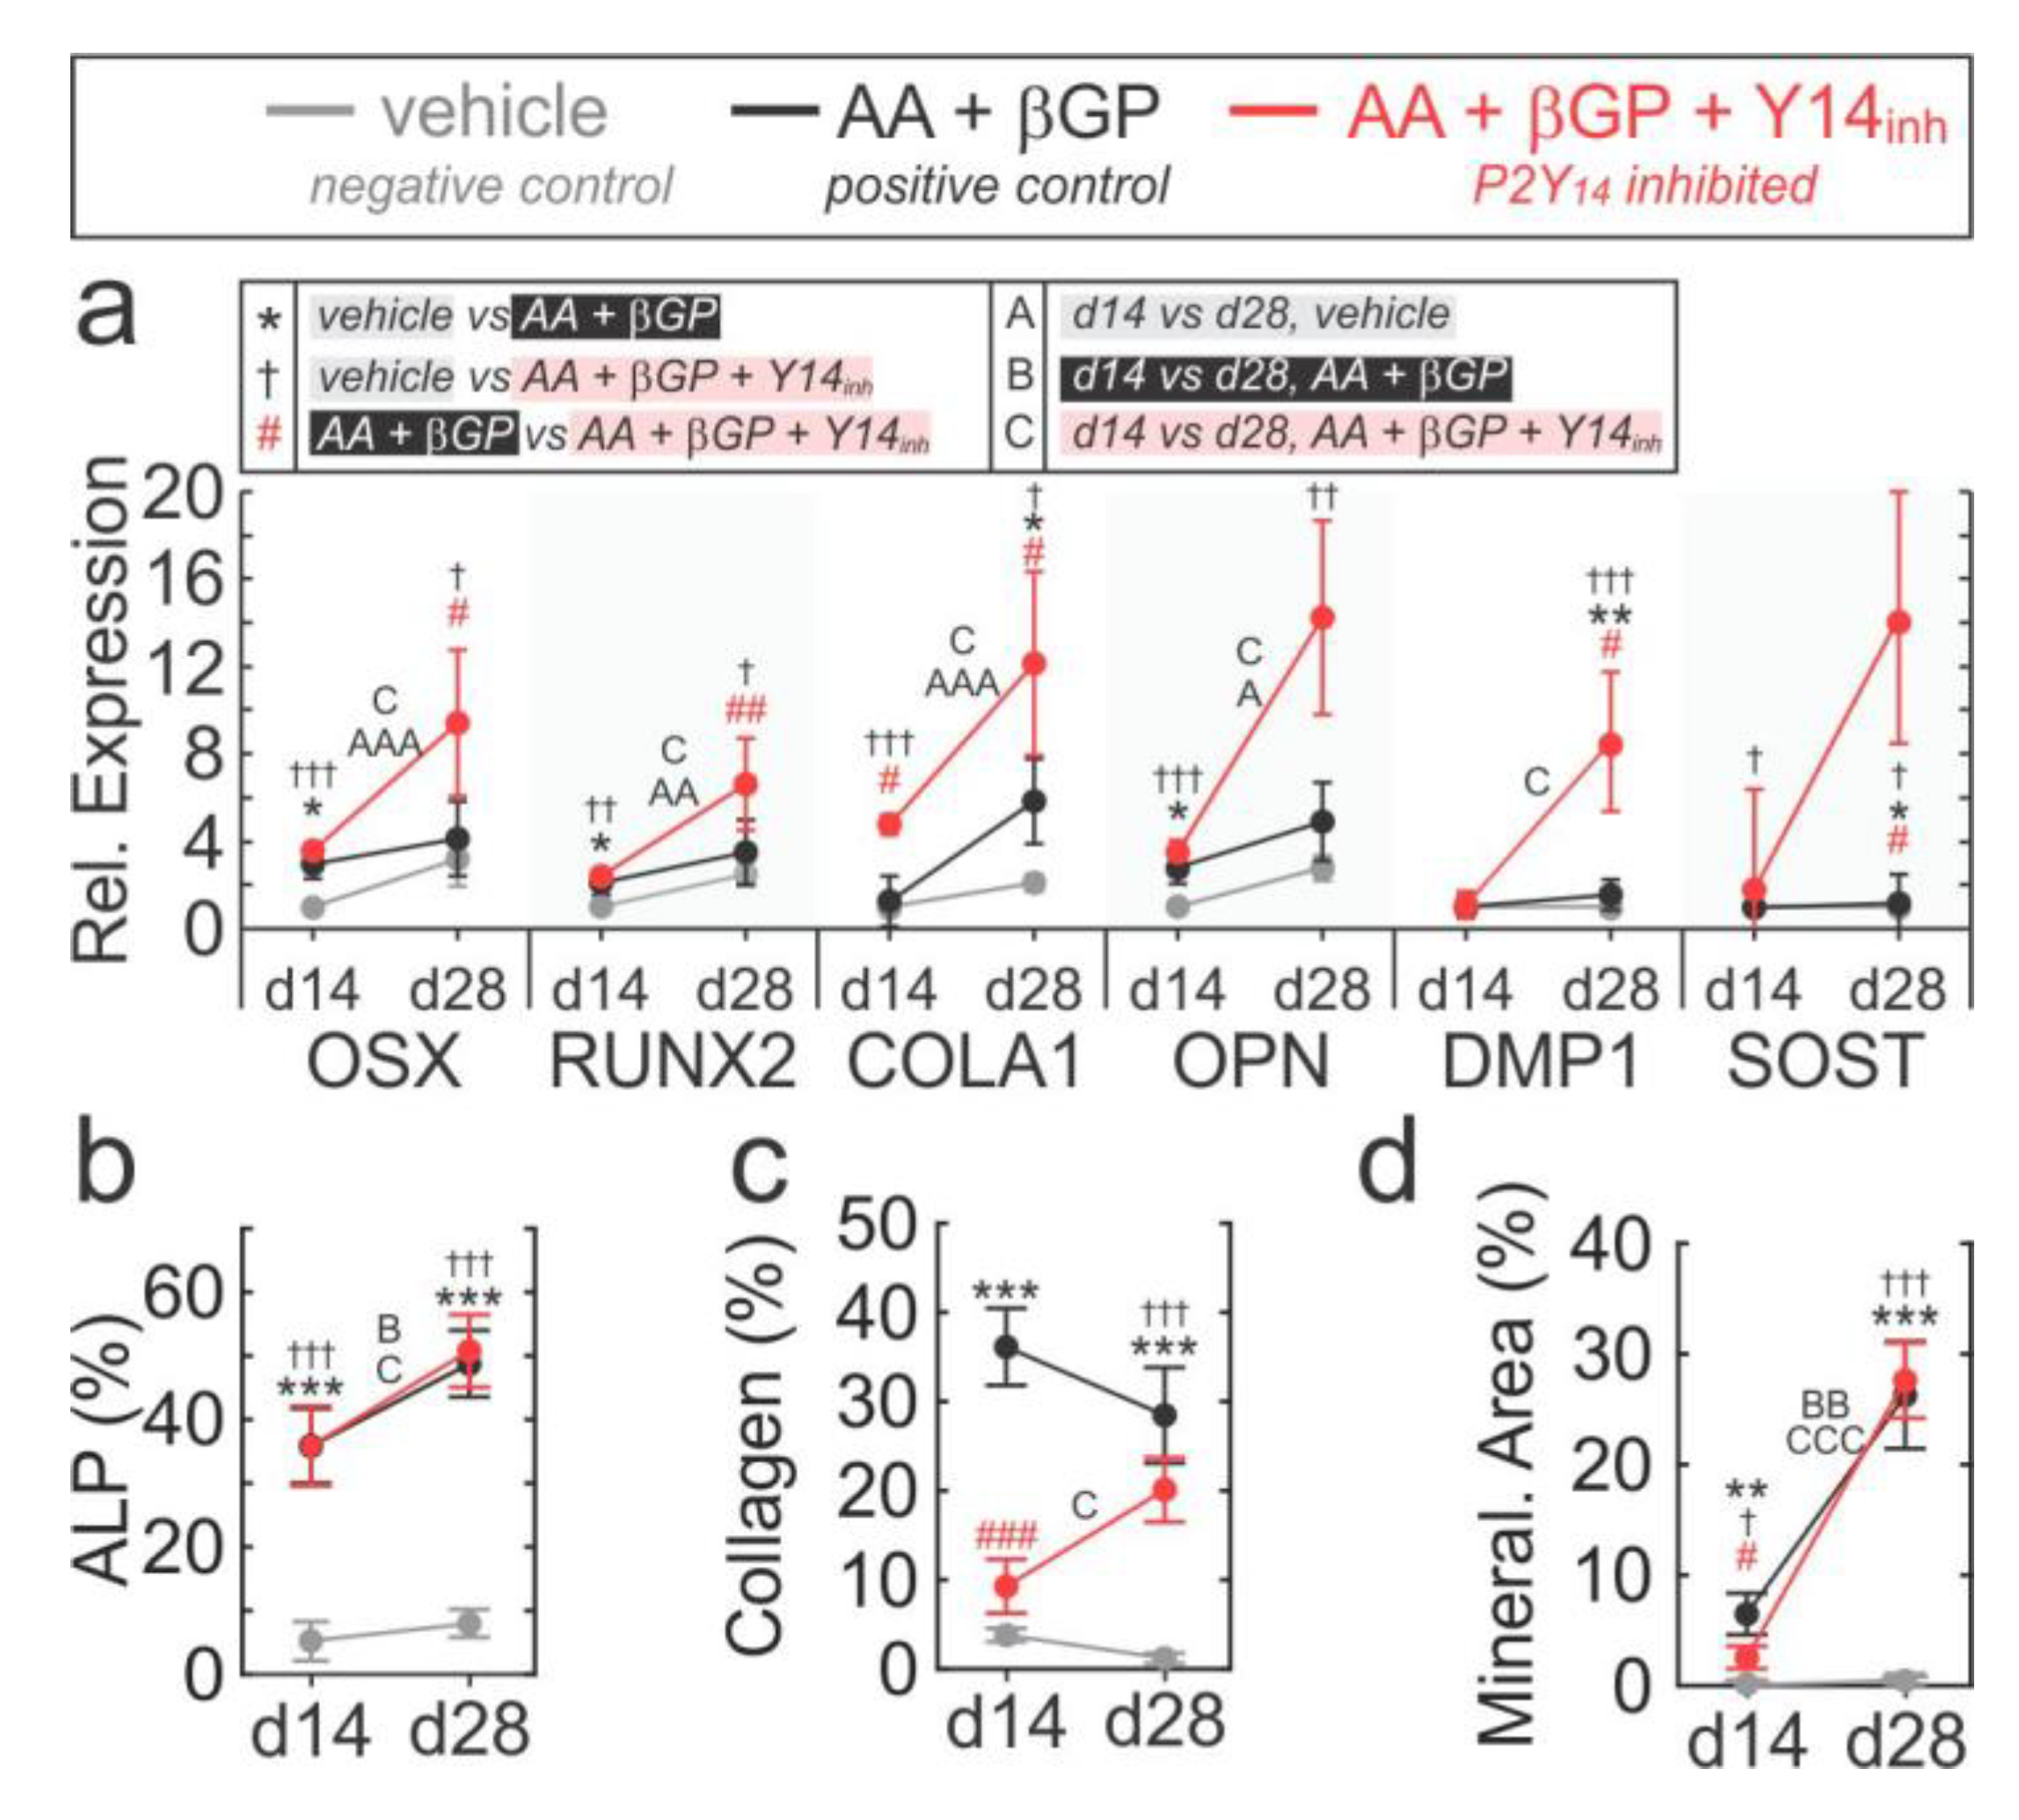
2.5. Role of P2Y14 in Osteogenic Differentiation
2.6. Skeletal Phenotype in P2ry14-/- Mice
3. Discussion
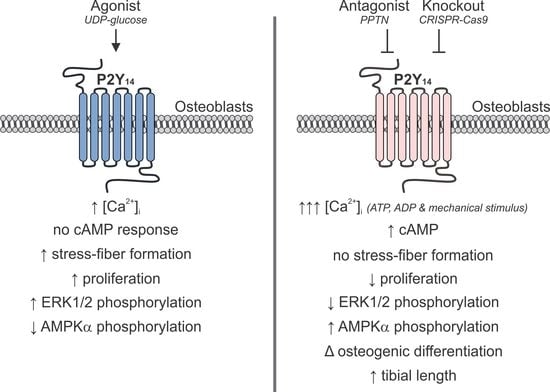
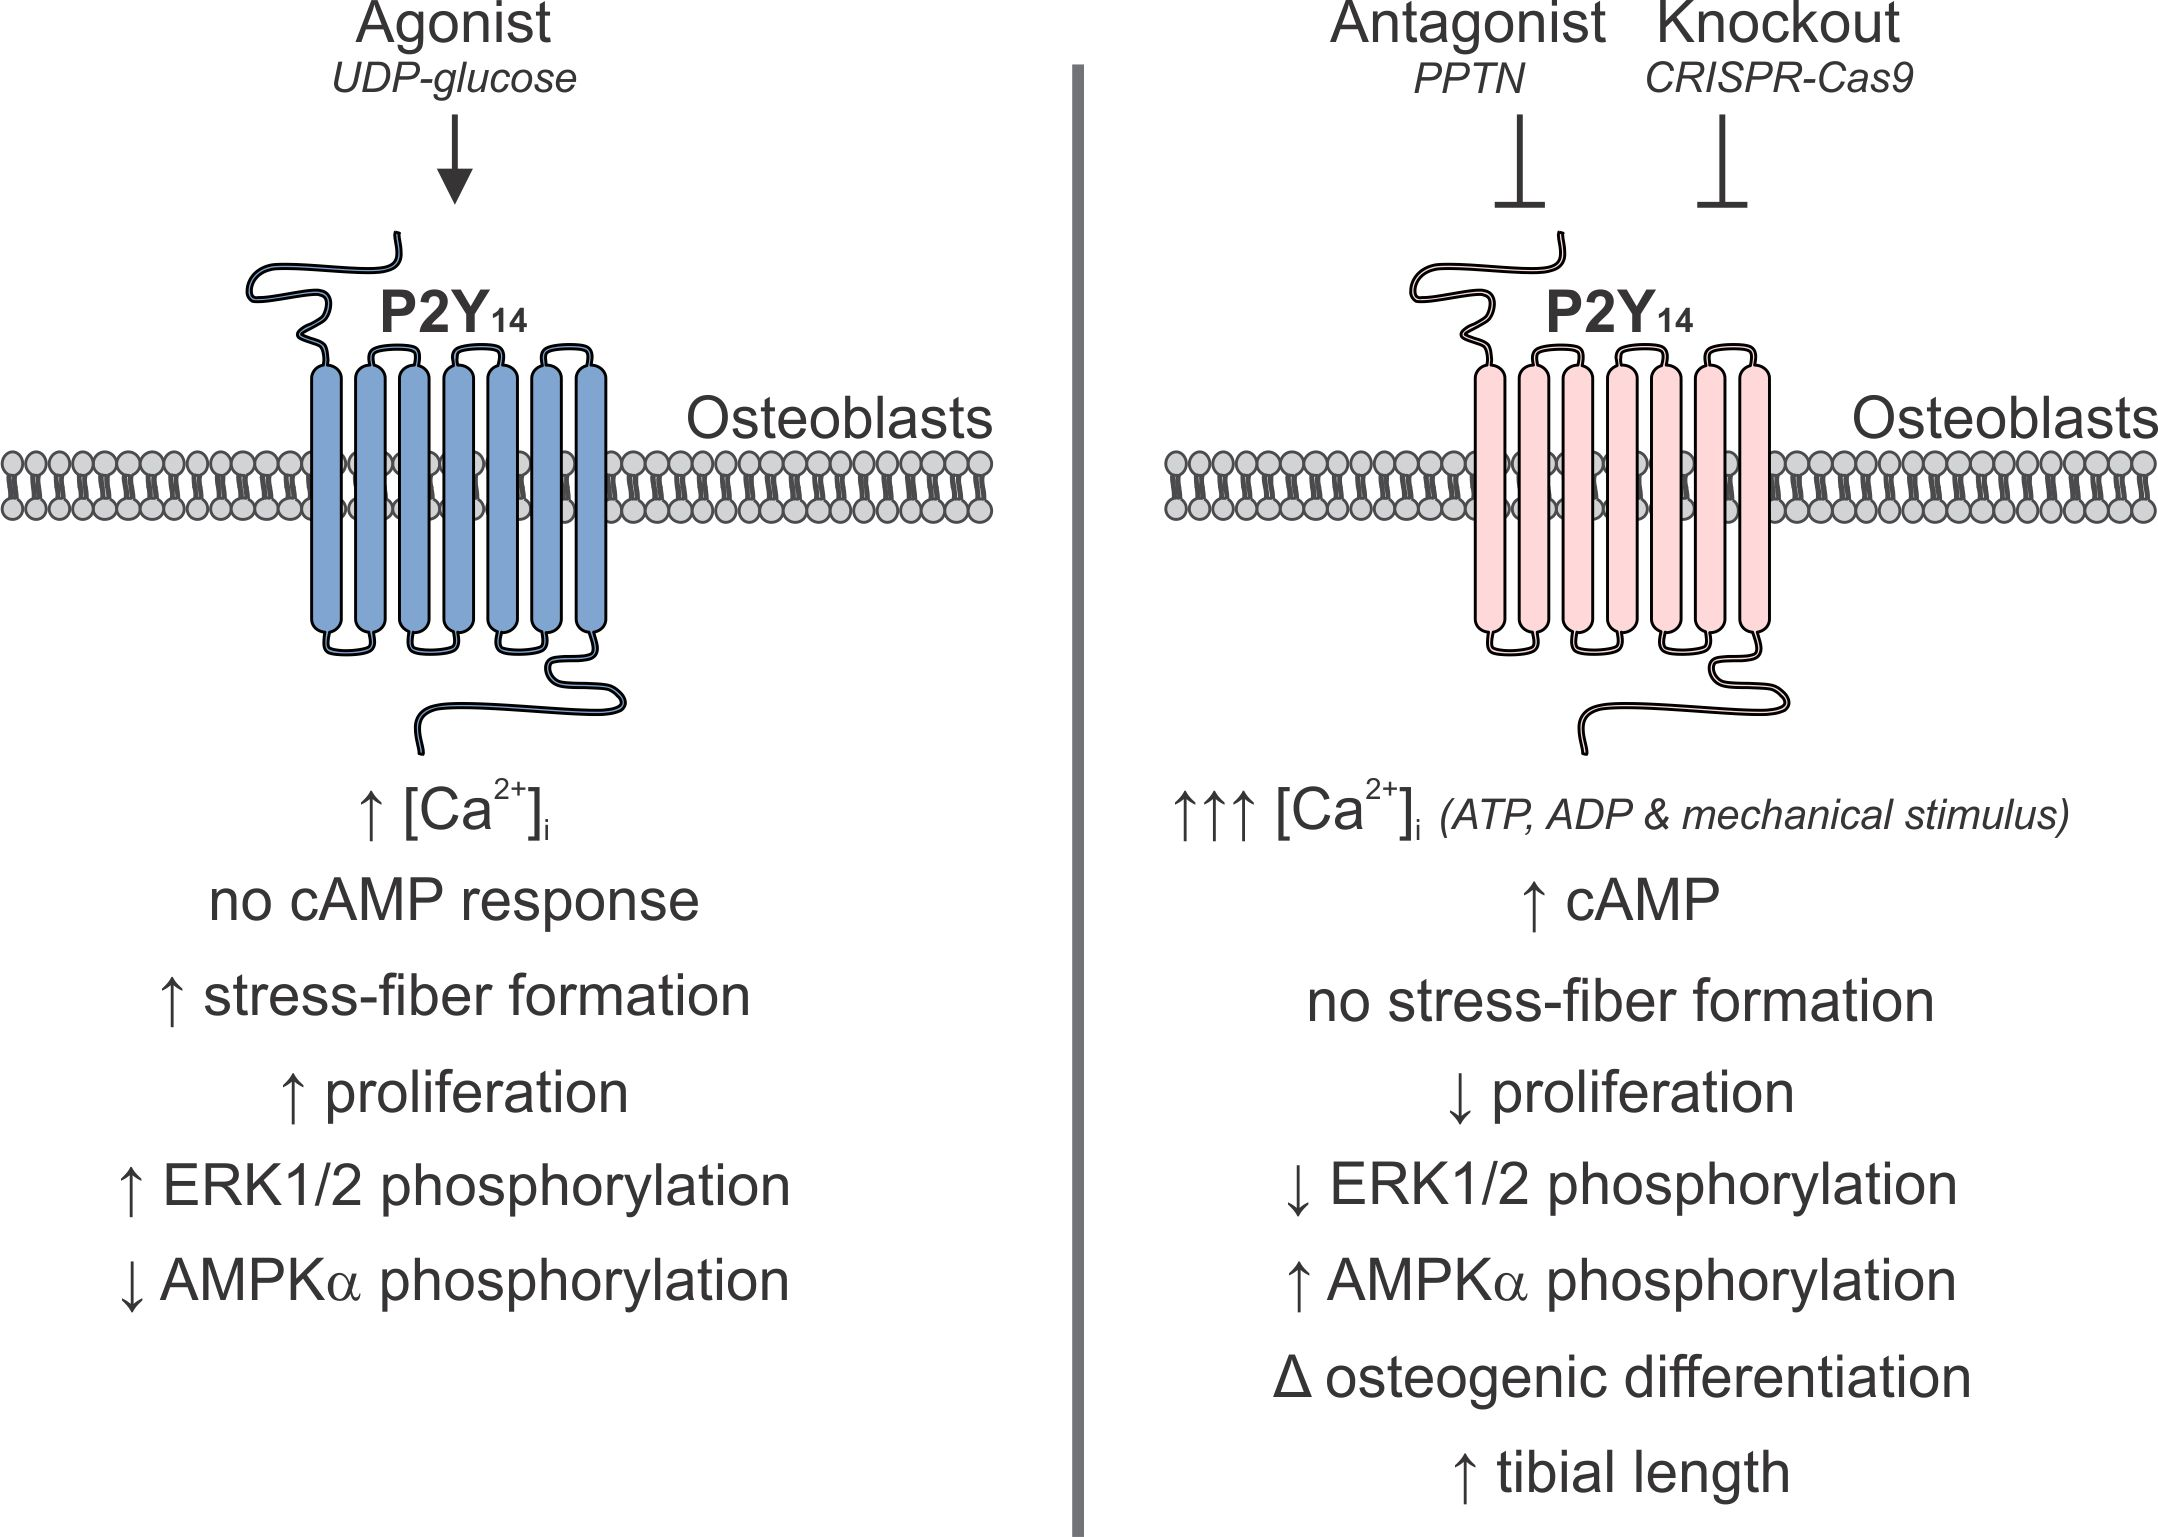
3.1. Overview
3.2. P2Y14 Signal Transduction
3.3. Modulation of Mechanical and Purinergic Signalling
3.4. Skeletal Phenotype
3.5. Study Limitations and Future Directions
3.6. Concluding Remarks
4. Materials and Methods
4.1. Software.
4.2. Reagents and Solutions.
4.3. Cell Culture.
4.4. Generation of P2Y14 Knockout Cell Line.
4.5. Pharmacological Inhibition of P2Y14
4.6. Quantitative Real-Time Polymerase Chain Reaction (qRT-PCR)
4.7. Fluorescent Microscopy
4.8. Intracellular Calcium Recordings and Analysis
4.9. Intracellular cAMP Assay
4.10. Immunoblotting
4.11. Mechanical-Stimulation
4.11.1. Mild Mechanical Stimulus
4.11.2. Severe Mechanical Stimulus
4.12. Proliferation Assays
4.13. Osteoblast Differentiation Assays
4.13.1. Alkaline Phosphatase (ALP) Staining
4.13.2. Collagen Deposit and Mineralized Nodule Staining
4.14. In vivo Knockout Phenotype
4.15. Rapid Review and Meta-Analysis
4.16. Statistical Analysis
Supplementary Materials
Author Contributions
Funding
Acknowledgments
Conflicts of Interest
References
- Abbracchio, M.P.; Burnstock, G.; Verkhratsky, A.; Zimmermann, H. Purinergic signalling in the nervous system: An overview. Trends Neurosci. 2009, 32, 19–29. [Google Scholar] [CrossRef] [PubMed]
- Takahashi, T.; Kimura, Y.; Niwa, K.; Ohmiya, Y.; Fujimura, T.; Yamasaki, K.; Aiba, S. In vivo imaging demonstrates ATP release from murine keratinocytes and its involvement in cutaneous inflammation after tape stripping. J. Invest. Derm. 2013, 133, 2407–2415. [Google Scholar] [CrossRef] [PubMed]
- Shiina, K.; Hayashida, K.I.; Ishikawa, K.; Kawatani, M. ATP release from bladder urothelium and serosa in a rat model of partial bladder outlet obstruction. Biomed. Res. 2016, 37, 299–304. [Google Scholar] [CrossRef] [PubMed]
- Berglund, E.; Berglund, D.; Akcakaya, P.; Ghaderi, M.; Dare, E.; Berggren, P.O.; Kohler, M.; Aspinwall, C.A.; Lui, W.O.; Zedenius, J.; et al. Evidence for Ca(2+)-regulated ATP release in gastrointestinal stromal tumors. Exp. Cell Res. 2013, 319, 1229–1238. [Google Scholar] [CrossRef]
- Crecelius, A.R.; Kirby, B.S.; Richards, J.C.; Garcia, L.J.; Voyles, W.F.; Larson, D.G.; Luckasen, G.J.; Dinenno, F.A. Mechanisms of ATP-mediated vasodilation in humans: Modest role for nitric oxide and vasodilating prostaglandins. Am. J. Physiol. Heart Circ. Physiol. 2011, 301, H1302–H1310. [Google Scholar] [CrossRef]
- Sinke, A.P.; Deen, P.M. The physiological implication of novel proteins in systemic osmoregulation. FASEB J. 2011, 25, 3279–3289. [Google Scholar] [CrossRef]
- Lazarowski, E.R.; Boucher, R.C. Purinergic receptors in airway epithelia. Curr. Opin. Pharm. 2009, 9, 262–267. [Google Scholar] [CrossRef]
- Orriss, I.R.; Burnstock, G.; Arnett, T.R. Purinergic signalling and bone remodelling. Curr. Opin. Pharm. 2010, 10, 322–330. [Google Scholar] [CrossRef]
- Chambers, J.K.; Macdonald, L.E.; Sarau, H.M.; Ames, R.S.; Freeman, K.; Foley, J.J.; Zhu, Y.; McLaughlin, M.M.; Murdock, P.; McMillan, L. A G protein-coupled receptor for UDP-glucose. J. Biol. Chem. 2000, 275, 10767–10771. [Google Scholar] [CrossRef]
- Lipmann, F. Metabolic generation and utilization of phosphate bond energy. Adv. Enzym. Relat. Areas Mol. Biol. 1941, 1, 99–162. [Google Scholar]
- Abeijon, C.; Hirschberg, C.B. Topography of glycosylation reactions in the endoplasmic reticulum. Trends Biochem. Sci. 1992, 17, 32–36. [Google Scholar] [CrossRef]
- Berninsone, P.; Hirschberg, C.B. Nucleotide sugars, nucleotide sulfate, and ATP transporters of the endoplasmic reticulum and Golgi apparatus. Ann. N. Y. Acad. Sci. 1998, 842, 91–99. [Google Scholar] [CrossRef] [PubMed]
- Ralevic, V. UDP-Glucose☆. In Reference Module in Biomedical Sciences; Elsevier: Amsterdam, The Netherlands, 2015. [Google Scholar]
- Lazarowski, E.R.; Harden, T.K. UDP-sugars as extracellular signaling molecules: Cellular and physiologic consequences of P2Y14 receptor activation. Mol. Pharmacol. 2015, 88, 151–160. [Google Scholar] [CrossRef] [PubMed]
- Lazarowski, E.R. Quantification of extracellular UDP-galactose. Anal. Biochem. 2010, 396, 23–29. [Google Scholar] [CrossRef]
- Sesma, J.I.; Esther, C.R., Jr.; Kreda, S.M.; Jones, L.; O’Neal, W.; Nishihara, S.; Nicholas, R.A.; Lazarowski, E.R. Endoplasmic reticulum/golgi nucleotide sugar transporters contribute to the cellular release of UDP-sugar signaling molecules. J. Biol. Chem. 2009, 284, 12572–12583. [Google Scholar] [CrossRef]
- Kreda, S.M.; Okada, S.F.; van Heusden, C.A.; O’Neal, W.; Gabriel, S.; Abdullah, L.; Davis, C.W.; Boucher, R.C.; Lazarowski, E.R. Coordinated release of nucleotides and mucin from human airway epithelial Calu-3 cells. J. Physiol. 2007, 584, 245–259. [Google Scholar] [CrossRef]
- Okada, S.F.; Zhang, L.; Kreda, S.M.; Abdullah, L.H.; Davis, C.W.; Pickles, R.J.; Lazarowski, E.R.; Boucher, R.C. Coupled nucleotide and mucin hypersecretion from goblet-cell metaplastic human airway epithelium. Am. J. Respir. Cell Mol. Biol. 2011, 45, 253–260. [Google Scholar] [CrossRef]
- Mikolajewicz, N.; Mohammed, A.; Morris, M.; Komarova, S.V. Mechanically stimulated ATP release from mammalian cells: Systematic review and meta-analysis. J. Cell Sci. 2018, 131, jcs223354. [Google Scholar] [CrossRef]
- Mikolajewicz, N.; Zimmermann, E.A.; Willie, B.M.; Komarova, S.V. Mechanically stimulated ATP release from murine bone cells is regulated by a balance of injury and repair. eLife 2018, 7, e37812. [Google Scholar] [CrossRef]
- Nakamura, E.; Uezono, Y.; Narusawa, K.; Shibuya, I.; Oishi, Y.; Tanaka, M.; Yanagihara, N.; Nakamura, T.; Izumi, F. ATP activates DNA synthesis by acting on P2X receptors in human osteoblast-like MG-63 cells. Am. J. Physiol. Cell Physiol. 2000, 279, C510–C519. [Google Scholar] [CrossRef]
- Rodrigues-Ribeiro, R.; Alvarenga, É.C.; Calio, M.L.; Paredes-Gamero, E.J.; Ferreira, A.T. Dual Role of P2 Receptors during Osteoblast Differentiation. Cell Biochem. Biophys. 2015, 71, 1225–1233. [Google Scholar] [CrossRef] [PubMed]
- Alvarenga, E.C.; Rodrigues, R.; Caricati-Neto, A.; Silva-Filho, F.C.; Paredes-Gamero, E.J.; Ferreira, A.T. Low-intensity pulsed ultrasound-dependent osteoblast proliferation occurs by via activation of the P2Y receptor: Role of the P2Y1 receptor. Bone 2010, 46, 355–362. [Google Scholar] [CrossRef] [PubMed]
- Bowler, W.B.; Dixon, C.J.; Halleux, C.; Maier, R.; Bilbe, G.; Fraser, W.D.; Gallagher, J.A.; Hipskind, R.A. Signaling in human osteoblasts by extracellular nucleotides. Their weak induction of the c-fos proto-oncogene via Ca2+ mobilization is strongly potentiated by a parathyroid hormone/cAMP-dependent protein kinase pathway independently of mitogen-activated protein kinase. J. Biol. Chem. 1999, 274, 14315–14324. [Google Scholar] [PubMed]
- Buckley, K.A.; Wagstaff, S.C.; McKay, G.; Gaw, A.; Hipskind, R.A.; Bilbe, G.; Gallagher, J.A.; Bowler, W.B. Parathyroid hormone potentiates nucleotide-induced [Ca2+]i release in rat osteoblasts independently of Gq activation or cyclic monophosphate accumulation. A mechanism for localizing systemic responses in bone. J. Biol. Chem. 2001, 276, 9565–9571. [Google Scholar] [CrossRef]
- Syberg, S.; Brandao-Burch, A.; Patel, J.J.; Hajjawi, M.; Arnett, T.R.; Schwarz, P.; Jorgensen, N.R.; Orriss, I.R. Clopidogrel (Plavix), a P2Y12 receptor antagonist, inhibits bone cell function in vitro and decreases trabecular bone in vivo. J. Bone Miner. Res. 2012, 27, 2373–2386. [Google Scholar] [CrossRef]
- Mediero, A.; Wilder, T.; Reddy, V.S.R.; Cheng, Q.; Tovar, N.; Coelho, P.G.; Witek, L.; Whatling, C.; Cronstein, B.N. Ticagrelor regulates osteoblast and osteoclast function and promotes bone formation in vivo via an adenosine-dependent mechanism. FASEB J. 2016, 30, 3887–3900. [Google Scholar] [CrossRef]
- Biver, G.; Wang, N.; Gartland, A.; Orriss, I.; Arnett, T.; Boeynaems, J.; Robaye, B. Role of the P2Y13 receptor in the differentiation of bone marrow stromal cells into osteoblasts and adipocytes. Stem Cells 2013, 31, 2747–2758. [Google Scholar] [CrossRef]
- Wang, N.; Robaye, B.; Agrawal, A.; Skerry, T.M.; Boeynaems, J.M.; Gartland, A. Reduced bone turnover in mice lacking the P2Y13 receptor of ADP. Mol. Endocrinol. 2012, 26, 142–152. [Google Scholar] [CrossRef]
- Morrison, M.; Turin, L.; King, B.; Burnstock, G.; Arnett, T. ATP is a potent stimulator of the activation and formation of rodent osteoclasts. J. Physiol. 1998, 511 Pt 2, 495–500. [Google Scholar] [CrossRef]
- Naemsch, L.N.; Weidema, A.F.; Sims, S.M.; Underhill, T.M.; Dixon, S.J. P2X(4) purinoceptors mediate an ATP-activated, non-selective cation current in rabbit osteoclasts. J. Cell Sci. 1999, 112 Pt 23, 4425–4435. [Google Scholar]
- Binderman, I.; Adut, M.; Zohar, R.; Bahar, H.; Faibish, D.; Yaffe, A. Alveolar bone resorption following coronal versus apical approach in a mucoperiosteal flap surgery procedure in the rat mandible. J. Periodontol. 2001, 72, 1348–1353. [Google Scholar] [CrossRef] [PubMed]
- Binderman, I.; Bahar, H.; Jacob-Hirsch, J.; Zeligson, S.; Amariglio, N.; Rechavi, G.; Shoham, S.; Yaffe, A. P2 × 4 is up-regulated in gingival fibroblasts after periodontal surgery. J. Dent. Res. 2007, 86, 181–185. [Google Scholar] [CrossRef] [PubMed]
- Kim, H.; Walsh, M.C.; Takegahara, N.; Middleton, S.A.; Shin, H.I.; Kim, J.; Choi, Y. The purinergic receptor P2 × 5 regulates inflammasome activity and hyper-multinucleation of murine osteoclasts. Sci. Rep. 2017, 7, 196. [Google Scholar] [CrossRef] [PubMed]
- Korcok, J.; Raimundo, L.N.; Ke, H.Z.; Sims, S.M.; Dixon, S.J. Extracellular nucleotides act through P2 × 7 receptors to activate NF-kappaB in osteoclasts. J. Bone Miner. Res. 2004, 19, 642–651. [Google Scholar] [CrossRef]
- Armstrong, S.; Pereverzev, A.; Dixon, S.J.; Sims, S.M. Activation of P2 × 7 receptors causes isoform-specific translocation of protein kinase C in osteoclasts. J. Cell Sci. 2009, 122, 136–144. [Google Scholar] [CrossRef]
- Agrawal, A.; Buckley, K.A.; Bowers, K.; Furber, M.; Gallagher, J.A.; Gartland, A.; Agrawal, A.; Buckley, K.A.; Bowers, K.; Furber, M.; et al. The effects of P2 × 7 receptor antagonists on the formation and function of human osteoclasts in vitro. Purinergic Signal. 2010, 6, 307–315. [Google Scholar] [CrossRef]
- Hazama, R.; Qu, X.; Yokoyama, K.; Tanaka, C.; Kinoshita, E.; He, J.; Takahashi, S.; Tohyama, K.; Yamamura, H.; Tohyama, Y.; et al. ATP-induced osteoclast function: The formation of sealing-zone like structure and the secretion of lytic granules via microtubule-deacetylation under the control of Syk. Genes Cells 2009, 14, 871–884. [Google Scholar] [CrossRef]
- Orriss, I.; Knight, G.; Burnstock, G.; Arnett, T. P2X (2) but not P2X (3) receptor knockout mice demonstrate increased bone mass and weight. Available online: https://www.ncbi.nlm.nih.gov/pubmed/16616882 (accessed on 20 March 2020).
- Orriss, I.; Syberg, S.; Wang, N.; Robaye, B.; Gartland, A.; Jorgensen, N.; Arnett, T.; Boeynaems, J. Bone phenotypes of P2 receptor knockout mice. Front. Biosci. 2011, 3, 1038–1046. [Google Scholar] [CrossRef]
- Orriss, I.; Guneri, D.; Hajjawi, M.; Shaw, K.; Patel, J.; Arnett, T. Activation of the P2Y2 receptor regulates bone cell function by enhancing ATP release. J. Endocrinol. 2017, 233, 341–356. [Google Scholar] [CrossRef]
- Su, X.; Floyd, D.H.; Hughes, A.; Xiang, J.; Schneider, J.G.; Uluckan, O.; Heller, E.; Deng, H.; Zou, W.; Craft, C.S.; et al. The ADP receptor P2RY12 regulates osteoclast function and pathologic bone remodeling. J. Clin. Investig. 2012, 122, 3579–3592. [Google Scholar] [CrossRef]
- Ke, H.Z.; Qi, H.; Weidema, A.F.; Zhang, Q.; Panupinthu, N.; Crawford, D.T.; Grasser, W.A.; Paralkar, V.M.; Li, M.; Audoly, L.P.; et al. Deletion of the P2 × 7 nucleotide receptor reveals its regulatory roles in bone formation and resorption. Mol. Endocrinol. 2003, 17, 1356–1367. [Google Scholar] [CrossRef] [PubMed]
- Wang, N.; Rumney, R.M.; Yang, L.; Robaye, B.; Boeynaems, J.M.; Skerry, T.M.; Gartland, A. The P2Y13 receptor regulates extracellular ATP metabolism and the osteogenic response to mechanical loading. J. Bone Miner. Res. 2013, 28, 1446–1456. [Google Scholar] [CrossRef] [PubMed]
- Wang, N.; Robaye, B.; Gossiel, F.; Boeynaems, J.M.; Gartland, A. The P2Y13 receptor regulates phosphate metabolism and FGF-23 secretion with effects on skeletal development. FASEB J. 2014, 28, 2249–2259. [Google Scholar] [CrossRef] [PubMed]
- Li, J.; Liu, D.; Ke, H.Z.; Duncan, R.L.; Turner, C.H. The P2 × 7 nucleotide receptor mediates skeletal mechanotransduction. J. Biol. Chem. 2005, 280, 42952–42959. [Google Scholar] [CrossRef]
- Schulz, A.; Schoneberg, T. The structural evolution of a P2Y-like G-protein-coupled receptor. J. Biol. Chem. 2003, 278, 35531–35541. [Google Scholar] [CrossRef]
- Costanzi, S.; Mamedova, L.; Gao, Z.-G.; Jacobson, K.A. Architecture of P2Y nucleotide receptors: Structural comparison based on sequence analysis, mutagenesis, and homology modeling. J. Med. Chem. 2004, 47, 5393–5404. [Google Scholar] [CrossRef]
- Barrett, M.O.; Sesma, J.I.; Ball, C.B.; Jayasekara, P.S.; Jacobson, K.A.; Lazarowski, E.R.; Harden, T.K. A selective high-affinity antagonist of the P2Y14 receptor inhibits UDP-glucose–stimulated chemotaxis of human neutrophils. Mol. Pharmacol. 2013, 84, 41–49. [Google Scholar] [CrossRef]
- Ali, S.; Turner, J.; Fountain, S.J. P2Y(2) and P2Y(6) receptor activation elicits intracellular calcium responses in human adipose-derived mesenchymal stromal cells. Purinergic Signal. 2018, 14, 371–384. [Google Scholar] [CrossRef]
- Kotova, P.D.; Bystrova, M.F.; Rogachevskaja, O.A.; Khokhlov, A.A.; Sysoeva, V.Y.; Tkachuk, V.A.; Kolesnikov, S.S. Coupling of P2Y receptors to Ca2+ mobilization in mesenchymal stromal cells from the human adipose tissue. Cell Calcium 2018, 71, 1–14. [Google Scholar] [CrossRef]
- Zippel, N.; Limbach, C.A.; Ratajski, N.; Urban, C.; Luparello, C.; Pansky, A.; Kassack, M.U.; Tobiasch, E. Purinergic receptors influence the differentiation of human mesenchymal stem cells. Stem Cells Dev. 2011, 21, 884–900. [Google Scholar] [CrossRef]
- Moore, D.J.; Murdock, P.R.; Watson, J.M.; Faull, R.L.; Waldvogel, H.J.; Szekeres, P.G.; Wilson, S.; Freeman, K.B.; Emson, P.C. GPR105, a novel Gi/o-coupled UDP-glucose receptor expressed on brain glia and peripheral immune cells, is regulated by immunologic challenge: Possible role in neuroimmune function. Mol. Brain Res. 2003, 118, 10–23. [Google Scholar] [CrossRef]
- Paic, F.; Igwe, J.C.; Nori, R.; Kronenberg, M.S.; Franceschetti, T.; Harrington, P.; Kuo, L.; Shin, D.-G.; Rowe, D.W.; Harris, S.E.; et al. Identification of differentially expressed genes between osteoblasts and osteocytes. Bone 2009, 45, 682–692. [Google Scholar] [CrossRef] [PubMed]
- Orriss, I.R.; Key, M.L.; Brandao-Burch, A.; Patel, J.J.; Burnstock, G.; Arnett, T.R. The regulation of osteoblast function and bone mineralisation by extracellular nucleotides: The role of p2x receptors. Bone 2012, 51, 389–400. [Google Scholar] [CrossRef] [PubMed]
- Cho, J.; Yusuf, R.; Kook, S.; Attar, E.; Lee, D.; Park, B.; Cheng, T.; Scadden, D.T.; Lee, B.C. Purinergic P2Y(1)(4) receptor modulates stress-induced hematopoietic stem/progenitor cell senescence. J. Clin. Investig. 2014, 124, 3159–3171. [Google Scholar] [CrossRef]
- Lee, S.A.; Park, J.H.; Lee, S.Y. Selective induction of P2Y14 receptor by RANKL promotes osteoclast formation. Mol. Cells 2013, 36, 273–277. [Google Scholar] [CrossRef]
- Lee, B.C.; Cheng, T.; Adams, G.B.; Attar, E.C.; Miura, N.; Lee, S.B.; Saito, Y.; Olszak, I.; Dombkowski, D.; Olson, D.P.; et al. P2Y-like receptor, GPR105 (P2Y14), identifies and mediates chemotaxis of bone-marrow hematopoietic stem cells. Genes Dev. 2003, 17, 1592–1604. [Google Scholar] [CrossRef]
- Mikolajewicz, N.; Sehayek, S.; Wiseman, P.W.; Komarova, S.V. Transmission of Mechanical Information by Purinergic Signaling. Biophys. J. 2019, 116, 2009–2022. [Google Scholar] [CrossRef]
- Shah, M.; Kola, B.; Bataveljic, A.; Arnett, T.R.; Viollet, B.; Saxon, L.; Korbonits, M.; Chenu, C. AMP-activated protein kinase (AMPK) activation regulates in vitro bone formation and bone mass. Bone 2010, 47, 309–319. [Google Scholar] [CrossRef]
- Fricks, I.P.; Maddileti, S.; Carter, R.L.; Lazarowski, E.R.; Nicholas, R.A.; Jacobson, K.A.; Harden, T.K. UDP is a competitive antagonist at the human P2Y14 receptor. J. Pharmacol. Exp. Ther. 2008, 325, 588–594. [Google Scholar] [CrossRef]
- Scrivens, M.; Dickenson, J.M. Functional expression of the P2Y14 receptor in human neutrophils. Eur. J. Pharmacol. 2006, 543, 166–173. [Google Scholar] [CrossRef]
- Krzemiński, P.; Pomorski, P.; Barańska, J. The P2Y14 receptor activity in glioma C6 cells. Eur. J. Pharmacol. 2008, 594, 49–54. [Google Scholar] [CrossRef] [PubMed]
- Skelton, L.; Cooper, M.; Murphy, M.; Platt, A. Human Immature Monocyte-Derived Dendritic Cells Express the G Protein-Coupled Receptor GPR105 (KIAA0001, P2Y14) and Increase Intracellular Calcium in Response to its Agonist, Uridine Diphosphoglucose. J. Immunol. 2003, 171, 1941–1949. [Google Scholar] [CrossRef] [PubMed]
- Gao, Z.-G.; Ding, Y.; Jacobson, K.A. UDP-glucose acting at P2Y14 receptors is a mediator of mast cell degranulation. Biochem. Pharm. 2010, 79, 873–879. [Google Scholar] [CrossRef] [PubMed]
- Fricks, I.P.; Carter, R.L.; Lazarowski, E.R.; Harden, T.K. Gi-dependent cell signaling responses of the human P2Y14 receptor in model cell systems. J. Pharm. Exp. Ther. 2009, 330, 162–168. [Google Scholar] [CrossRef]
- Scrivens, M.; Dickenson, J.M. Pharmacological effects mediated by UDP-glucose that are independent of P2Y14 receptor expression. Pharmacol. Res. 2005, 51, 533–538. [Google Scholar] [CrossRef]
- Scrivens, M.; Dickenson, J.M. Functional expression of the P2Y14 receptor in murine T-lymphocytes. Br. J. Pharmacol. 2005, 146, 435–444. [Google Scholar] [CrossRef]
- Brautigam, V.M.; Dubyak, G.R.; Crain, J.M.; Watters, J.J. The inflammatory effects of UDP-glucose in N9 microglia are not mediated by P2Y14 receptor activation. Purinergic Signal. 2008, 4, 73–78. [Google Scholar] [CrossRef]
- Kinoshita, M.; Nasu-Tada, K.; Fujishita, K.; Sato, K.; Koizumi, S. Secretion of matrix metalloproteinase-9 from astrocytes by inhibition of tonic P2Y 14-receptor-mediated signal (s). Cell. Mol. Neurobiol. 2013, 33, 47–58. [Google Scholar] [CrossRef]
- Sesma, J.I.; Kreda, S.M.; Steinckwich-Besancon, N.; Dang, H.; García-Mata, R.; Harden, T.K.; Lazarowski, E.R. The UDP-sugar-sensing P2Y14 receptor promotes Rho-mediated signaling and chemotaxis in human neutrophils. Am. J. Physiol. -Cell Physiol. 2012, 303, C490–C498. [Google Scholar] [CrossRef]
- Lin, J.; Liu, F.; Zhang, Y.Y.; Song, N.; Liu, M.K.; Fang, X.Y.; Liao, D.Q.; Zhou, C.; Wang, H.; Shen, J.F. P2Y14 receptor is functionally expressed in satellite glial cells and mediates interleukin-1beta and chemokine CCL2 secretion. J. Cell Physiol. 2019, 234, 21199–21210. [Google Scholar] [CrossRef]
- Kook, S.; Cho, J.; Lee, S.B.; Lee, B.-C. The nucleotide sugar UDP-glucose mobilizes long-term repopulating primitive hematopoietic cells. J. Clin. Investig. 2013, 123, 3420–3435. [Google Scholar] [CrossRef] [PubMed]
- Hayakawa, K.; Tatsumi, H.; Sokabe, M. Actin stress fibers transmit and focus force to activate mechanosensitive channels. J. Cell Sci. 2008, 121, 496–503. [Google Scholar] [CrossRef] [PubMed]
- Echarri, A.; Del Pozo, M.A. Caveolae–mechanosensitive membrane invaginations linked to actin filaments. J. Cell Sci. 2015, 128, 2747–2758. [Google Scholar] [CrossRef] [PubMed]
- Harris, A.R.; Jreij, P.; Fletcher, D.A. Mechanotransduction by the actin cytoskeleton: Converting mechanical stimuli into biochemical signals. Annu. Rev. Biophys. 2018, 47, 617–631. [Google Scholar] [CrossRef]
- Ran, F.A.; Hsu, P.D.; Lin, C.-Y.; Gootenberg, J.S.; Konermann, S.; Trevino, A.E.; Scott, D.A.; Inoue, A.; Matoba, S.; Zhang, Y.; et al. Double nicking by RNA-guided CRISPR Cas9 for enhanced genome editing specificity. Cell 2013, 154, 1380–1389. [Google Scholar] [CrossRef] [PubMed]
- Lu, R.; Zhang, Z.; Jiang, C. Recent progress on the discovery of P2Y14 receptor antagonists. Eur. J. Med. Chem. 2019, 175, 34–39. [Google Scholar] [CrossRef] [PubMed]
- Thomas, H.R.; Percival, S.M.; Yoder, B.K.; Parant, J.M. High-throughput genome editing and phenotyping facilitated by high resolution melting curve analysis. PLoS ONE 2014, 9, e114632. [Google Scholar] [CrossRef]
- Prager-Khoutorsky, M.; Lichtenstein, A.; Krishnan, R.; Rajendran, K.; Mayo, A.; Kam, Z.; Geiger, B.; Bershadsky, A.D. Fibroblast polarization is a matrix-rigidity-dependent process controlled by focal adhesion mechanosensing. Nat. Cell Biol. 2011, 13, 1457. [Google Scholar] [CrossRef]
- Mackay, L.; Mikolajewicz, N.; Komarova, S.V.; Khadra, A. Systematic Characterization of Dynamic Parameters of Intracellular Calcium Signals. Front. Physiol. 2016, 7, 525. [Google Scholar] [CrossRef]
- Kowal, J.M.; Yegutkin, G.G.; Novak, I. ATP release, generation and hydrolysis in exocrine pancreatic duct cells. Purinergic Signal. 2015, 11, 533–550. [Google Scholar] [CrossRef]
- Yang, Y.; Balcarcel, R.R. 24-well plate spectrophotometric assay for preliminary screening of metabolic activity. Assay Drug Dev. Technol. 2003, 1, 461–468. [Google Scholar] [CrossRef] [PubMed]
- Ruifrok, A.C.; Johnston, D.A. Quantification of histochemical staining by color deconvolution. Anal. Quant. Cytol. Histol. 2001, 23, 291–299. [Google Scholar] [PubMed]
- Dickinson, M.E.; Flenniken, A.M.; Ji, X.; Teboul, L.; Wong, M.D.; White, J.K.; Meehan, T.F.; Weninger, W.J.; Westerberg, H.; Adissu, H. High-throughput discovery of novel developmental phenotypes. Nature 2016, 537, 508. [Google Scholar] [CrossRef] [PubMed]


| Study | Sample | Species | Method | +/- |
|---|---|---|---|---|
| Mesenchymal stem cells (MSC) | ||||
| Ali 2018 [50] | Adipose-derived MSC | Human | RT-PCR | + |
| Kotova 2018 [51] | Adipose-derived MSC | Human | RT-PCR | + |
| Zippel 2012 [52] | Adipose-derived MSC | Human | RT-PCR | + |
| Dental-follicle MSC-like cells | Human | RT-PCR | + | |
| Osteoblasts | ||||
| Moore 2003 [53] | HOS osteosarcoma cell line | Human | RT-PCR | + |
| MG63 osteosarcoma cell line | Human | RT-PCR | - | |
| SAOS2 osteosarcoma cell line | Human | RT-PCR | - | |
| Paic 2009 [54] | Primary calvarial osteoblasts | Mouse (CD-1) | RT-PCR | + |
| Orriss 2012 [55] | Primary calvarial osteoblasts | Rat (Sprague-Dawley) | RT-PCR | + |
| Zippel 2012 [52] | Osteoblasts differentiated from adipose-derived MSC | Human | RT-PCR | + |
| Osteoblasts differentiated from dental follicle cells | Human | RT-PCR | + | |
| Mikolajewicz 2020 (current study) | C2C12-BMP2 osteoblast cell line | Mouse (C3H) | IF, RT-PCR, WB | + |
| Primary compact bone-derived osteoblasts | Mouse (C57BL/6) | IF | + | |
| Osteocytes | ||||
| Chambers 2000 [9] | Bone tissue | Human | RT-PCR | - |
| Paic 2009 [54] | Primary calvarial osteocytes | Mouse (CD-1) | RT-PCR | + |
| Hematopoietic bone-marrow cells | ||||
| Chambers 2000 [9] | Bone marrow cells | Human | RT-PCR | + |
| Cho 2014 [56] | Bone-marrow-derived hematopoietic stem cells | Human | RT-PCR | + |
| FC | + | |||
| Lee 2013 [57] | Bone-marrow derived monocytes/macrophages | Mouse (C57BL/6) | RT-PCR | + |
| WB | + | |||
| Lee 2003 [58] | Fetal bone marrow cells | Human | RT-PCR | + |
| FC | + | |||
| Osteoclasts | ||||
| Lee 2013 [57] | Primary osteoclasts | Mouse (C57BL/6) | RT-PCR | + |
| WB | + | |||
© 2020 by the authors. Licensee MDPI, Basel, Switzerland. This article is an open access article distributed under the terms and conditions of the Creative Commons Attribution (CC BY) license (http://creativecommons.org/licenses/by/4.0/).
Share and Cite
Mikolajewicz, N.; Komarova, S.V. Role of UDP-Sugar Receptor P2Y14 in Murine Osteoblasts. Int. J. Mol. Sci. 2020, 21, 2747. https://doi.org/10.3390/ijms21082747
Mikolajewicz N, Komarova SV. Role of UDP-Sugar Receptor P2Y14 in Murine Osteoblasts. International Journal of Molecular Sciences. 2020; 21(8):2747. https://doi.org/10.3390/ijms21082747
Chicago/Turabian StyleMikolajewicz, Nicholas, and Svetlana V. Komarova. 2020. "Role of UDP-Sugar Receptor P2Y14 in Murine Osteoblasts" International Journal of Molecular Sciences 21, no. 8: 2747. https://doi.org/10.3390/ijms21082747
APA StyleMikolajewicz, N., & Komarova, S. V. (2020). Role of UDP-Sugar Receptor P2Y14 in Murine Osteoblasts. International Journal of Molecular Sciences, 21(8), 2747. https://doi.org/10.3390/ijms21082747