Using Phosphatidylinositol Phosphorylation as Markers for Hyperglycemic Related Breast Cancer


Abstract
1. Introduction
2. Results
2.1. Hormone Positive Breast Cancer PI Trends
2.1.1. ER+/PR+ Breast Cancer PI Trends from Lipid Spot Blot Analysis
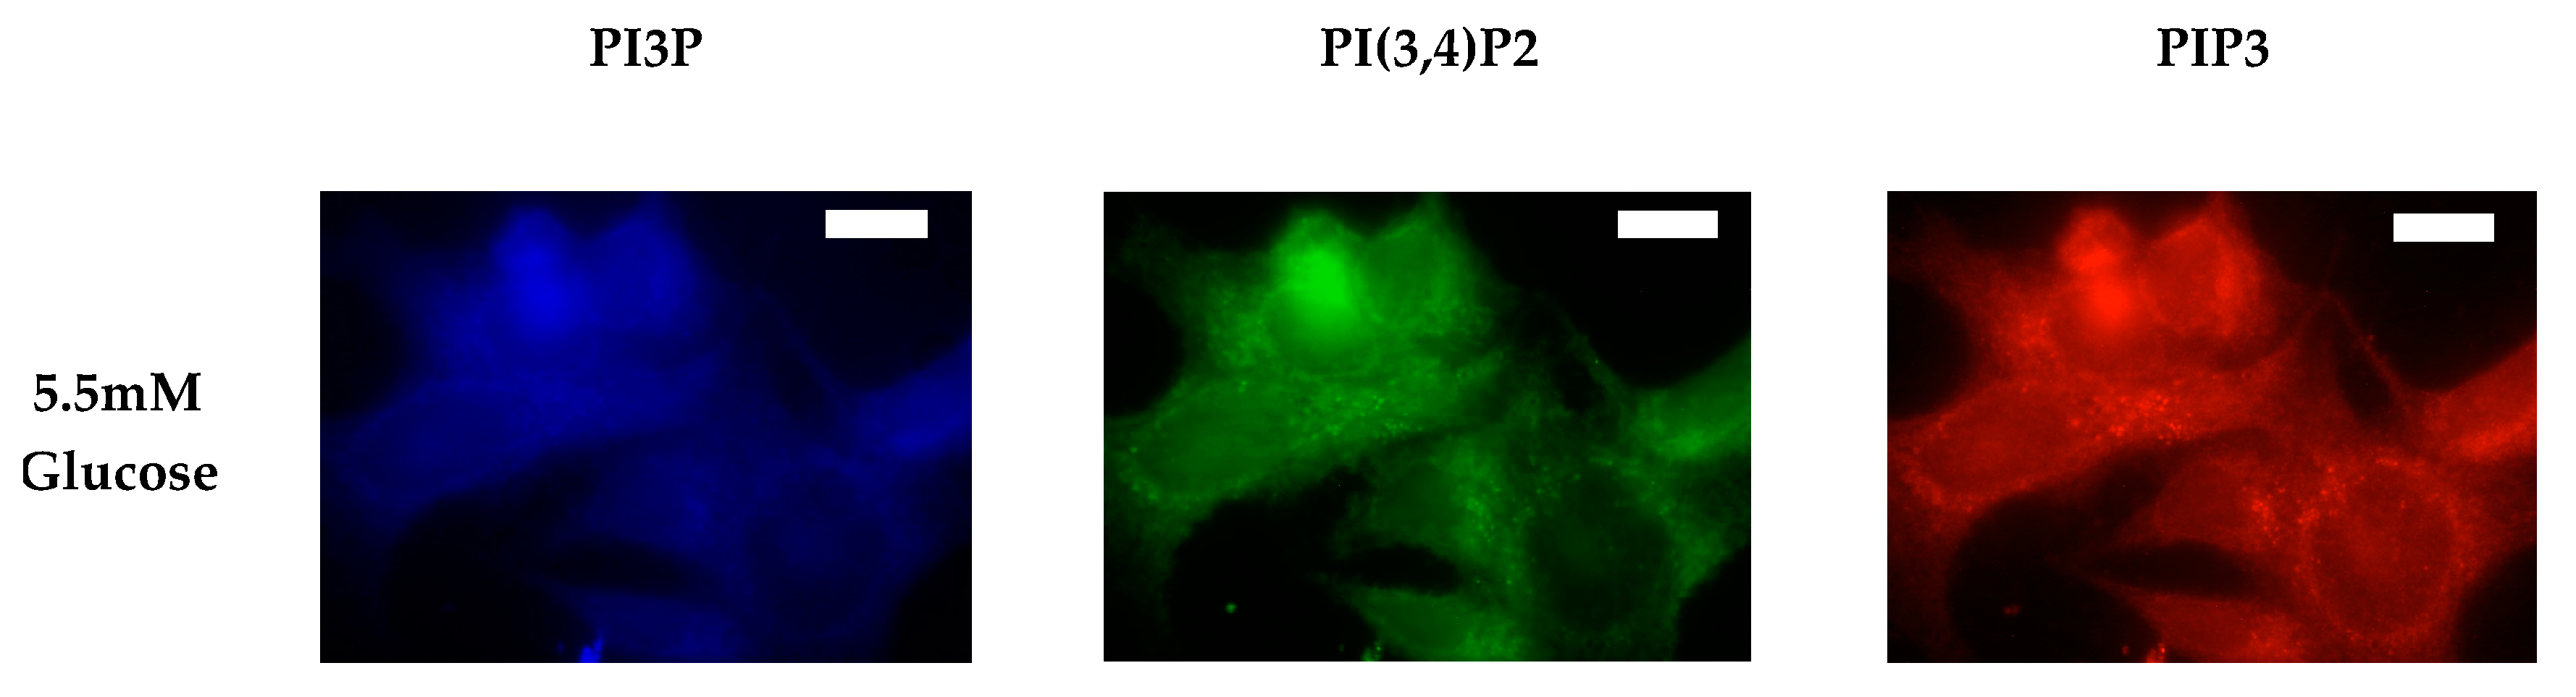
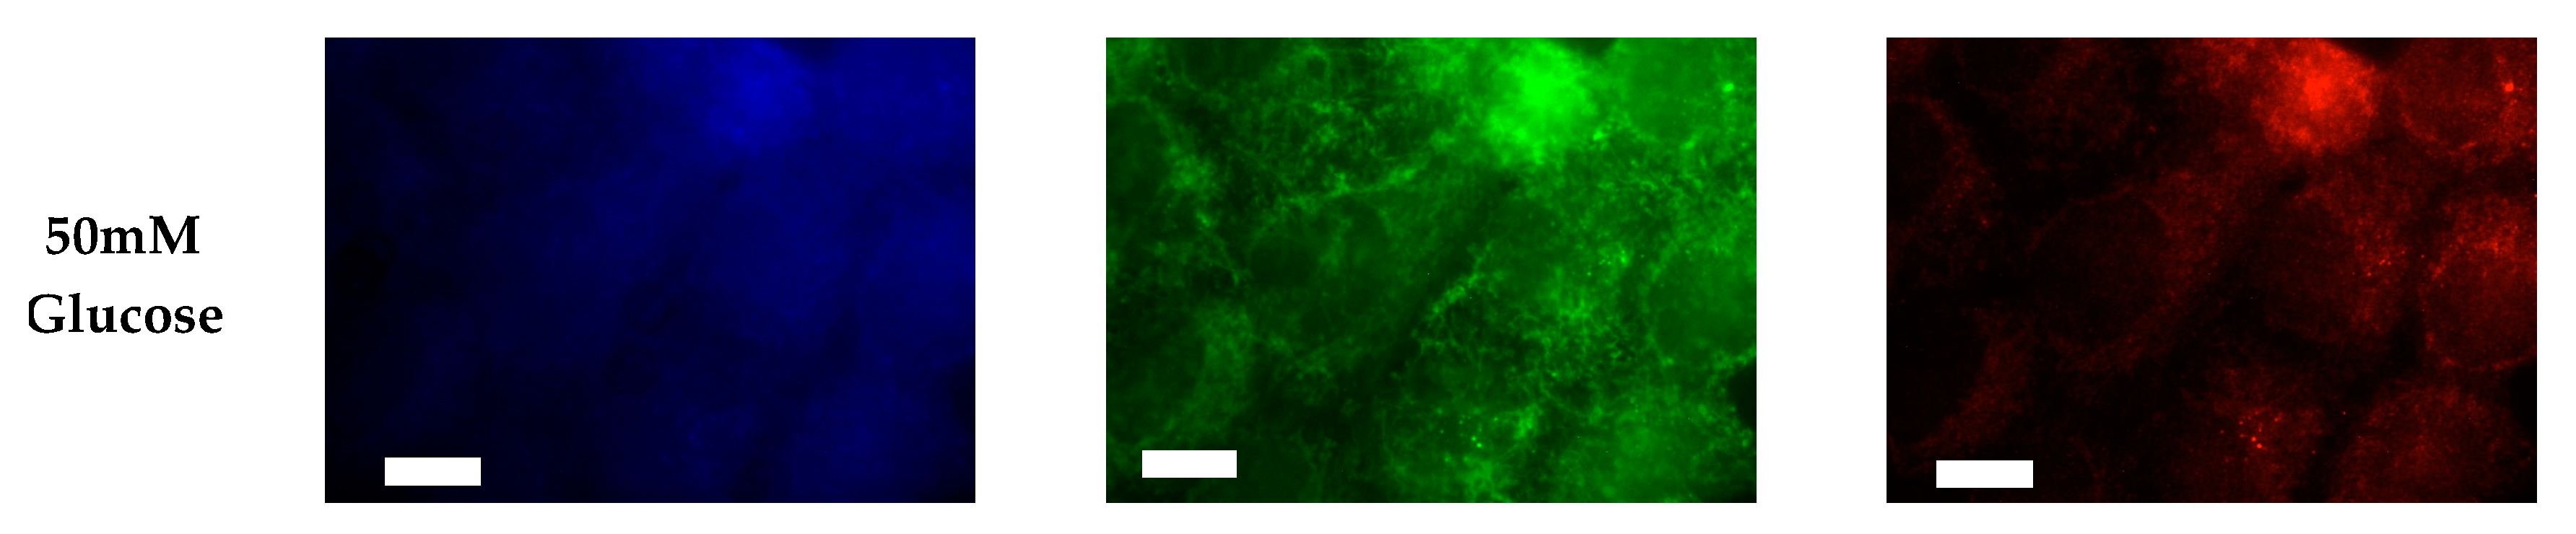
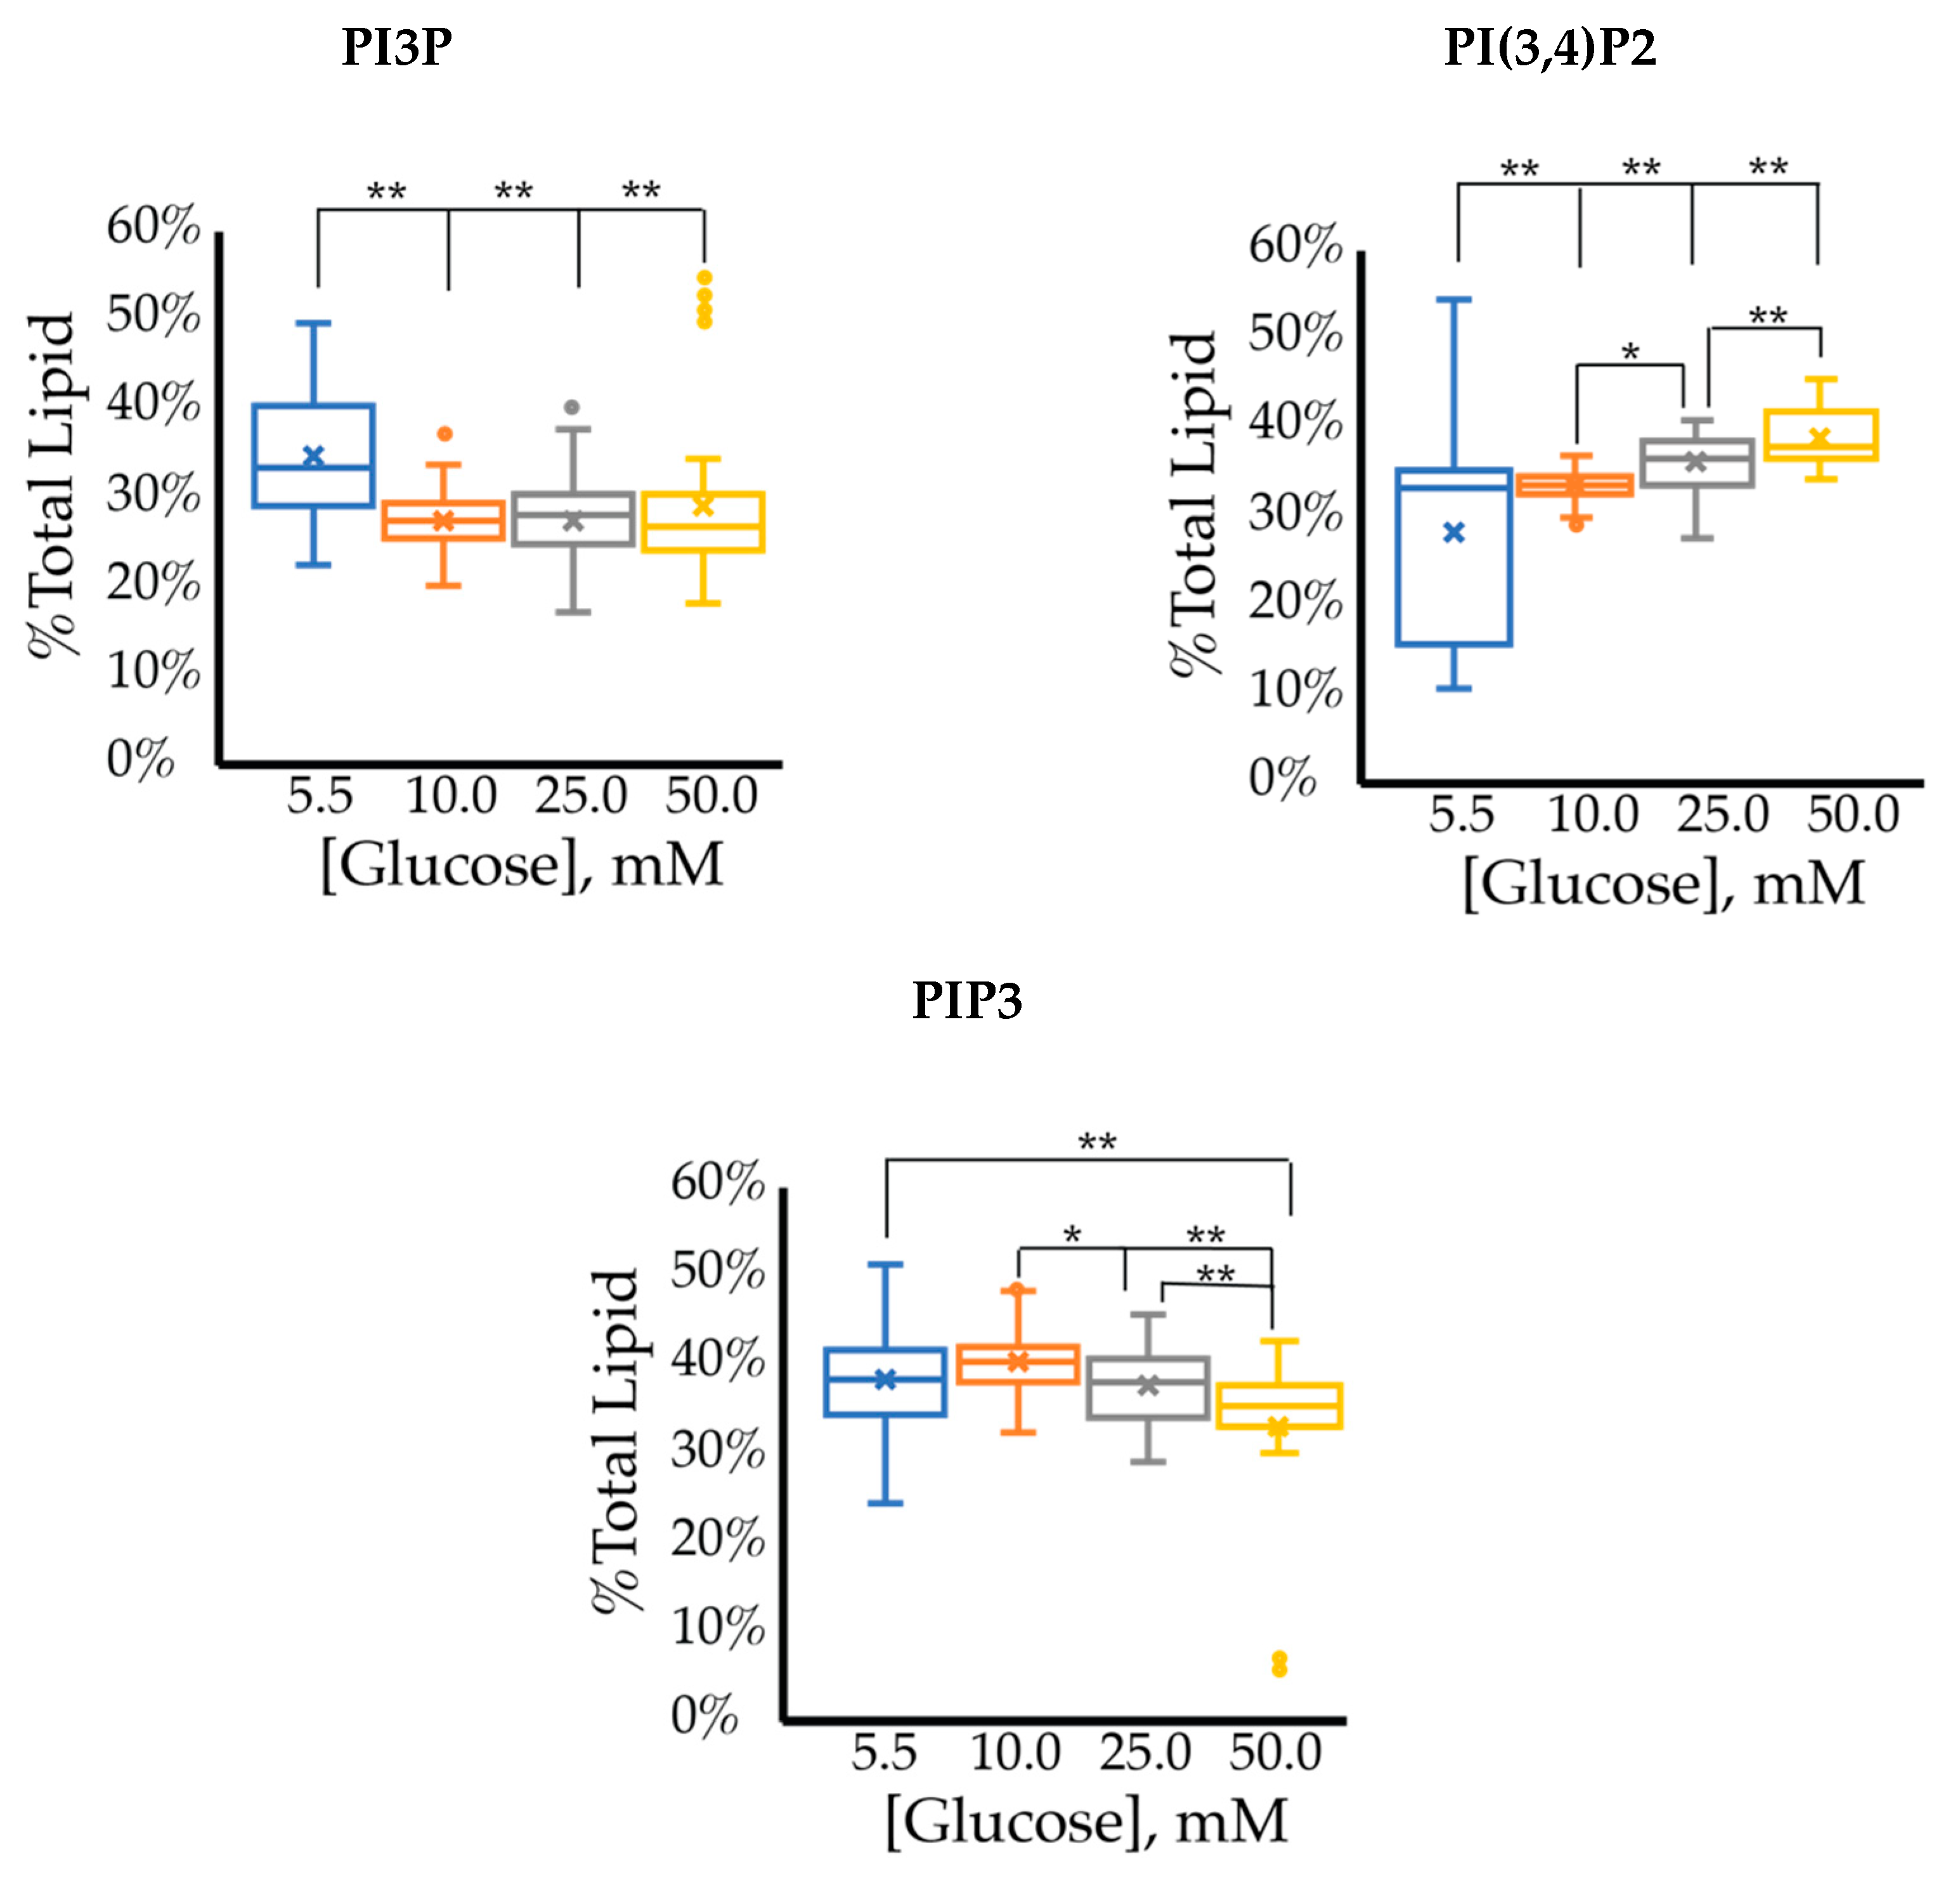
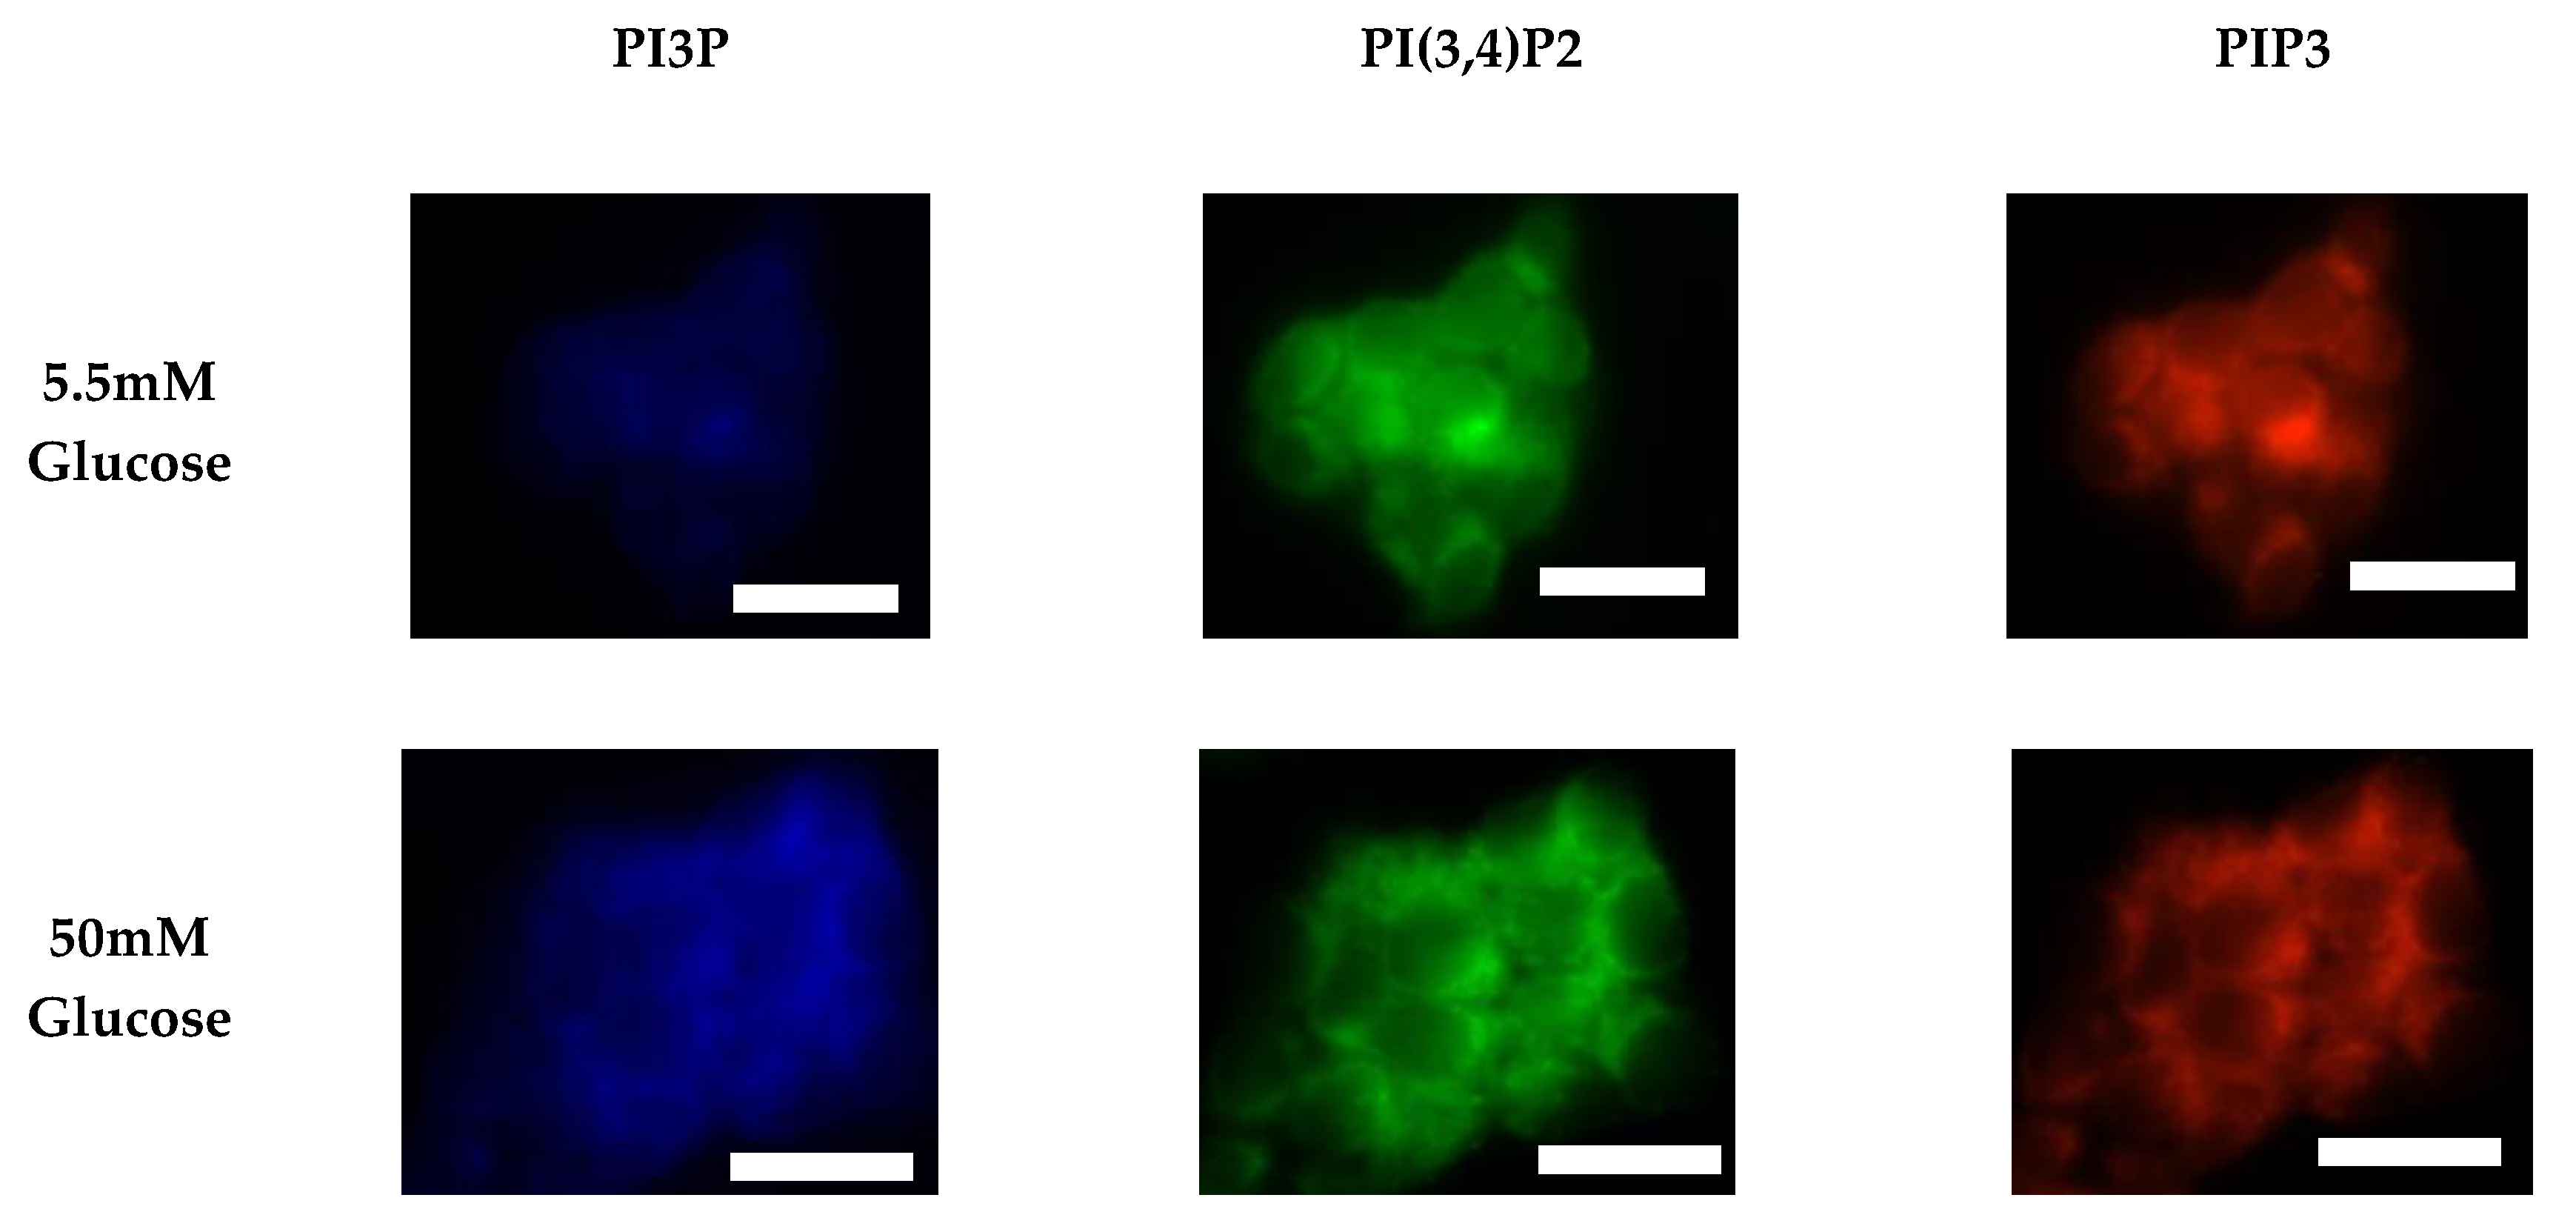
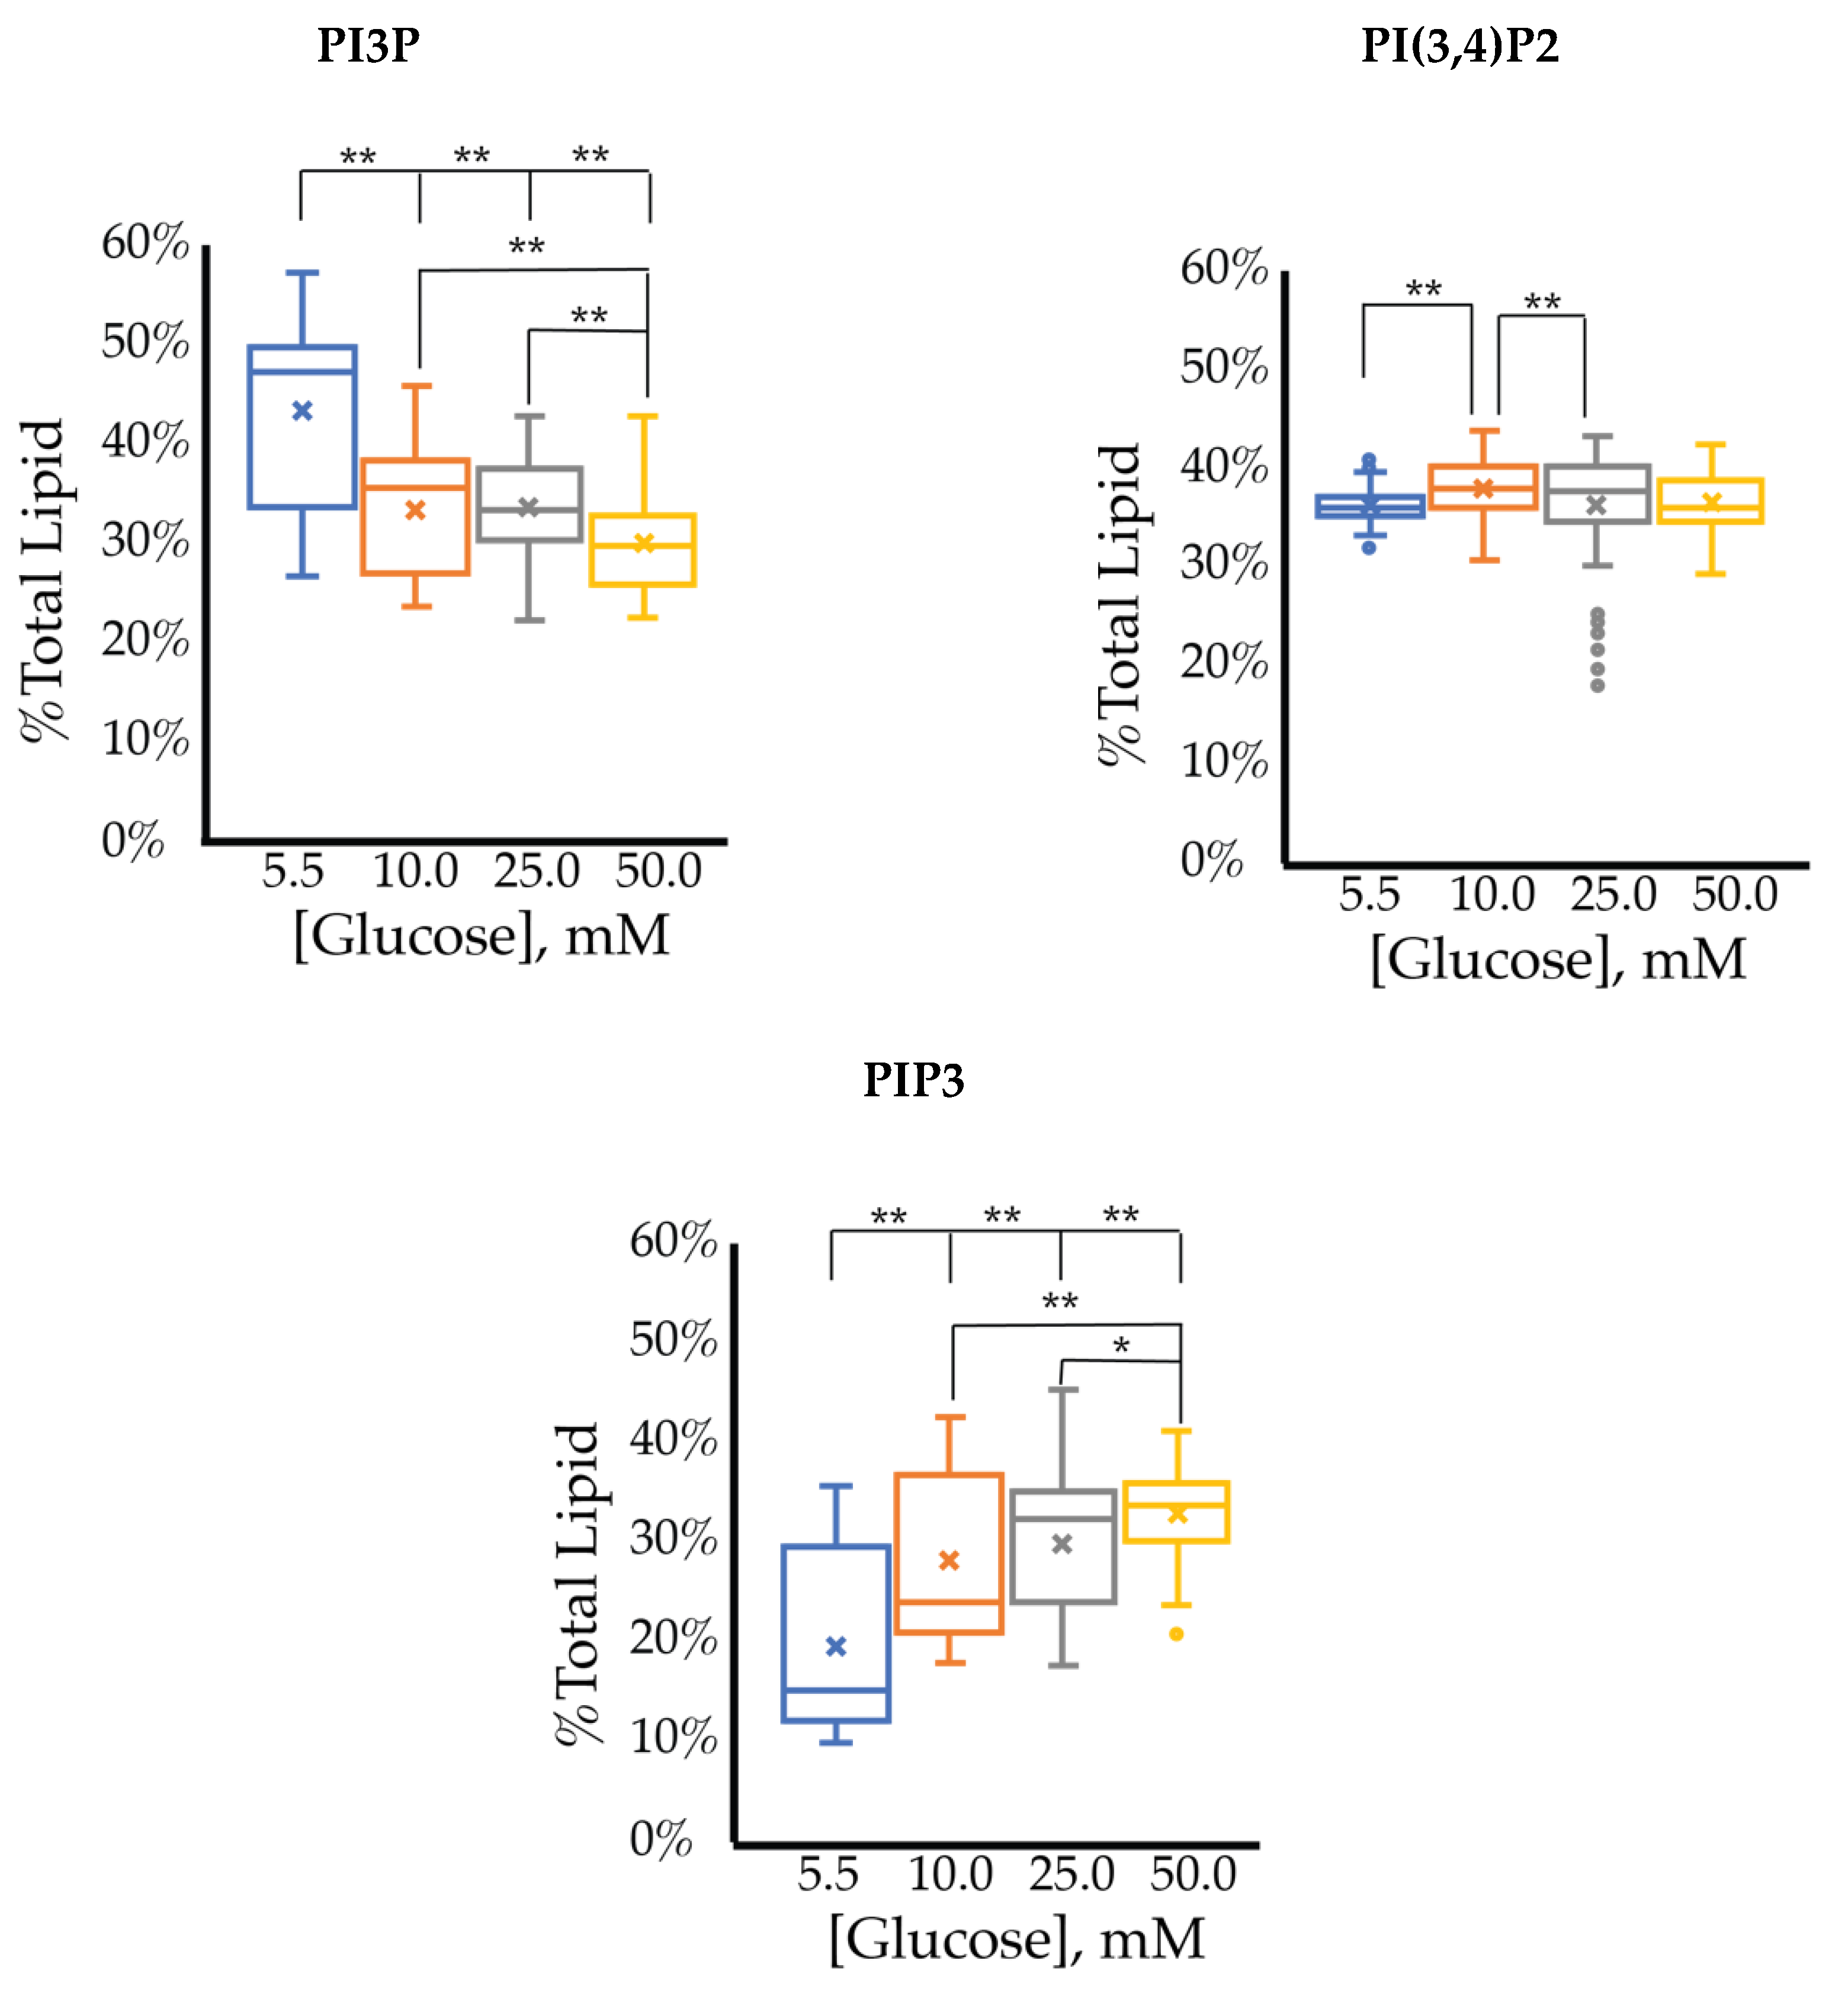
2.1.2. ER+/PR+ Breast Cancer PI Trends from Fixed Cell Fluorescence Analysis
2.2. HER2+ Breast Cancer PI Trends
2.2.1. HER2+ Breast Cancer PI Trends from Lipid Spot Blot Analysis
2.2.2. HER2+ Breast Cancer PI Trends from Fixed Cell Fluorescence Analysis
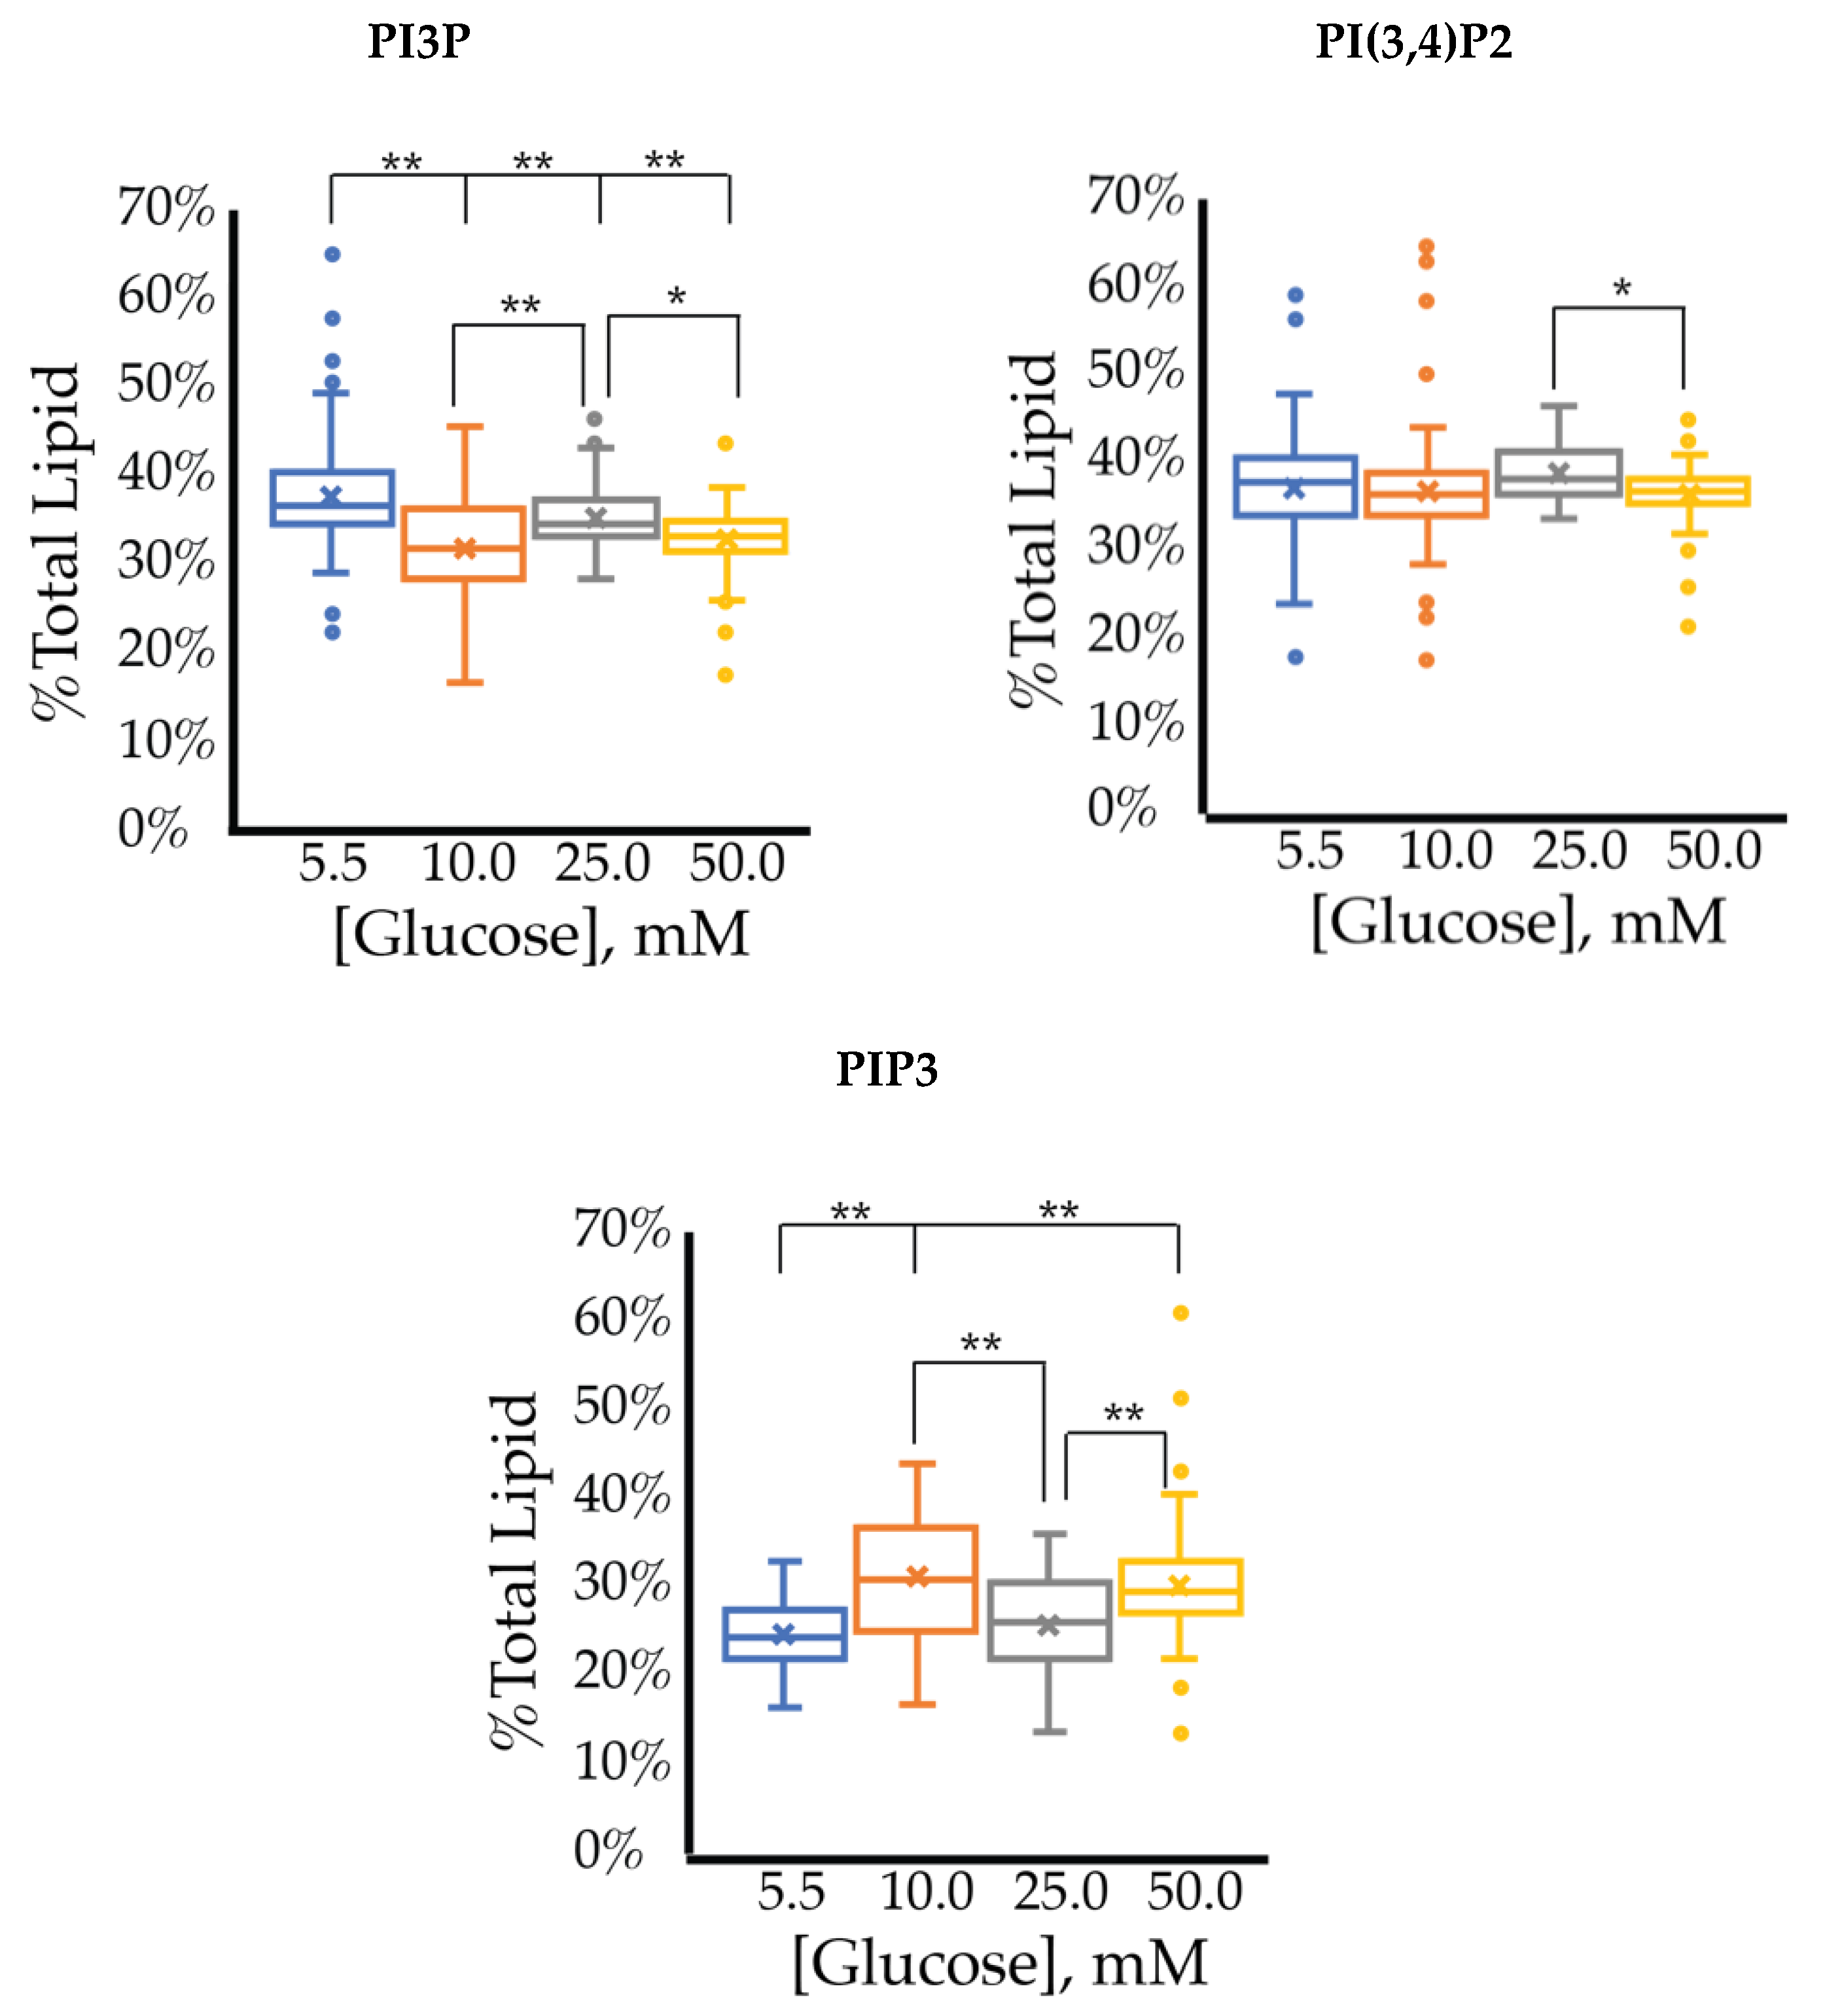
2.3. Triple Negative Breast Cancer (TNBC) PI Trends
2.3.1. Triple Negative Breast Cancer PI Trends from Lipid Spot Blot Analysis
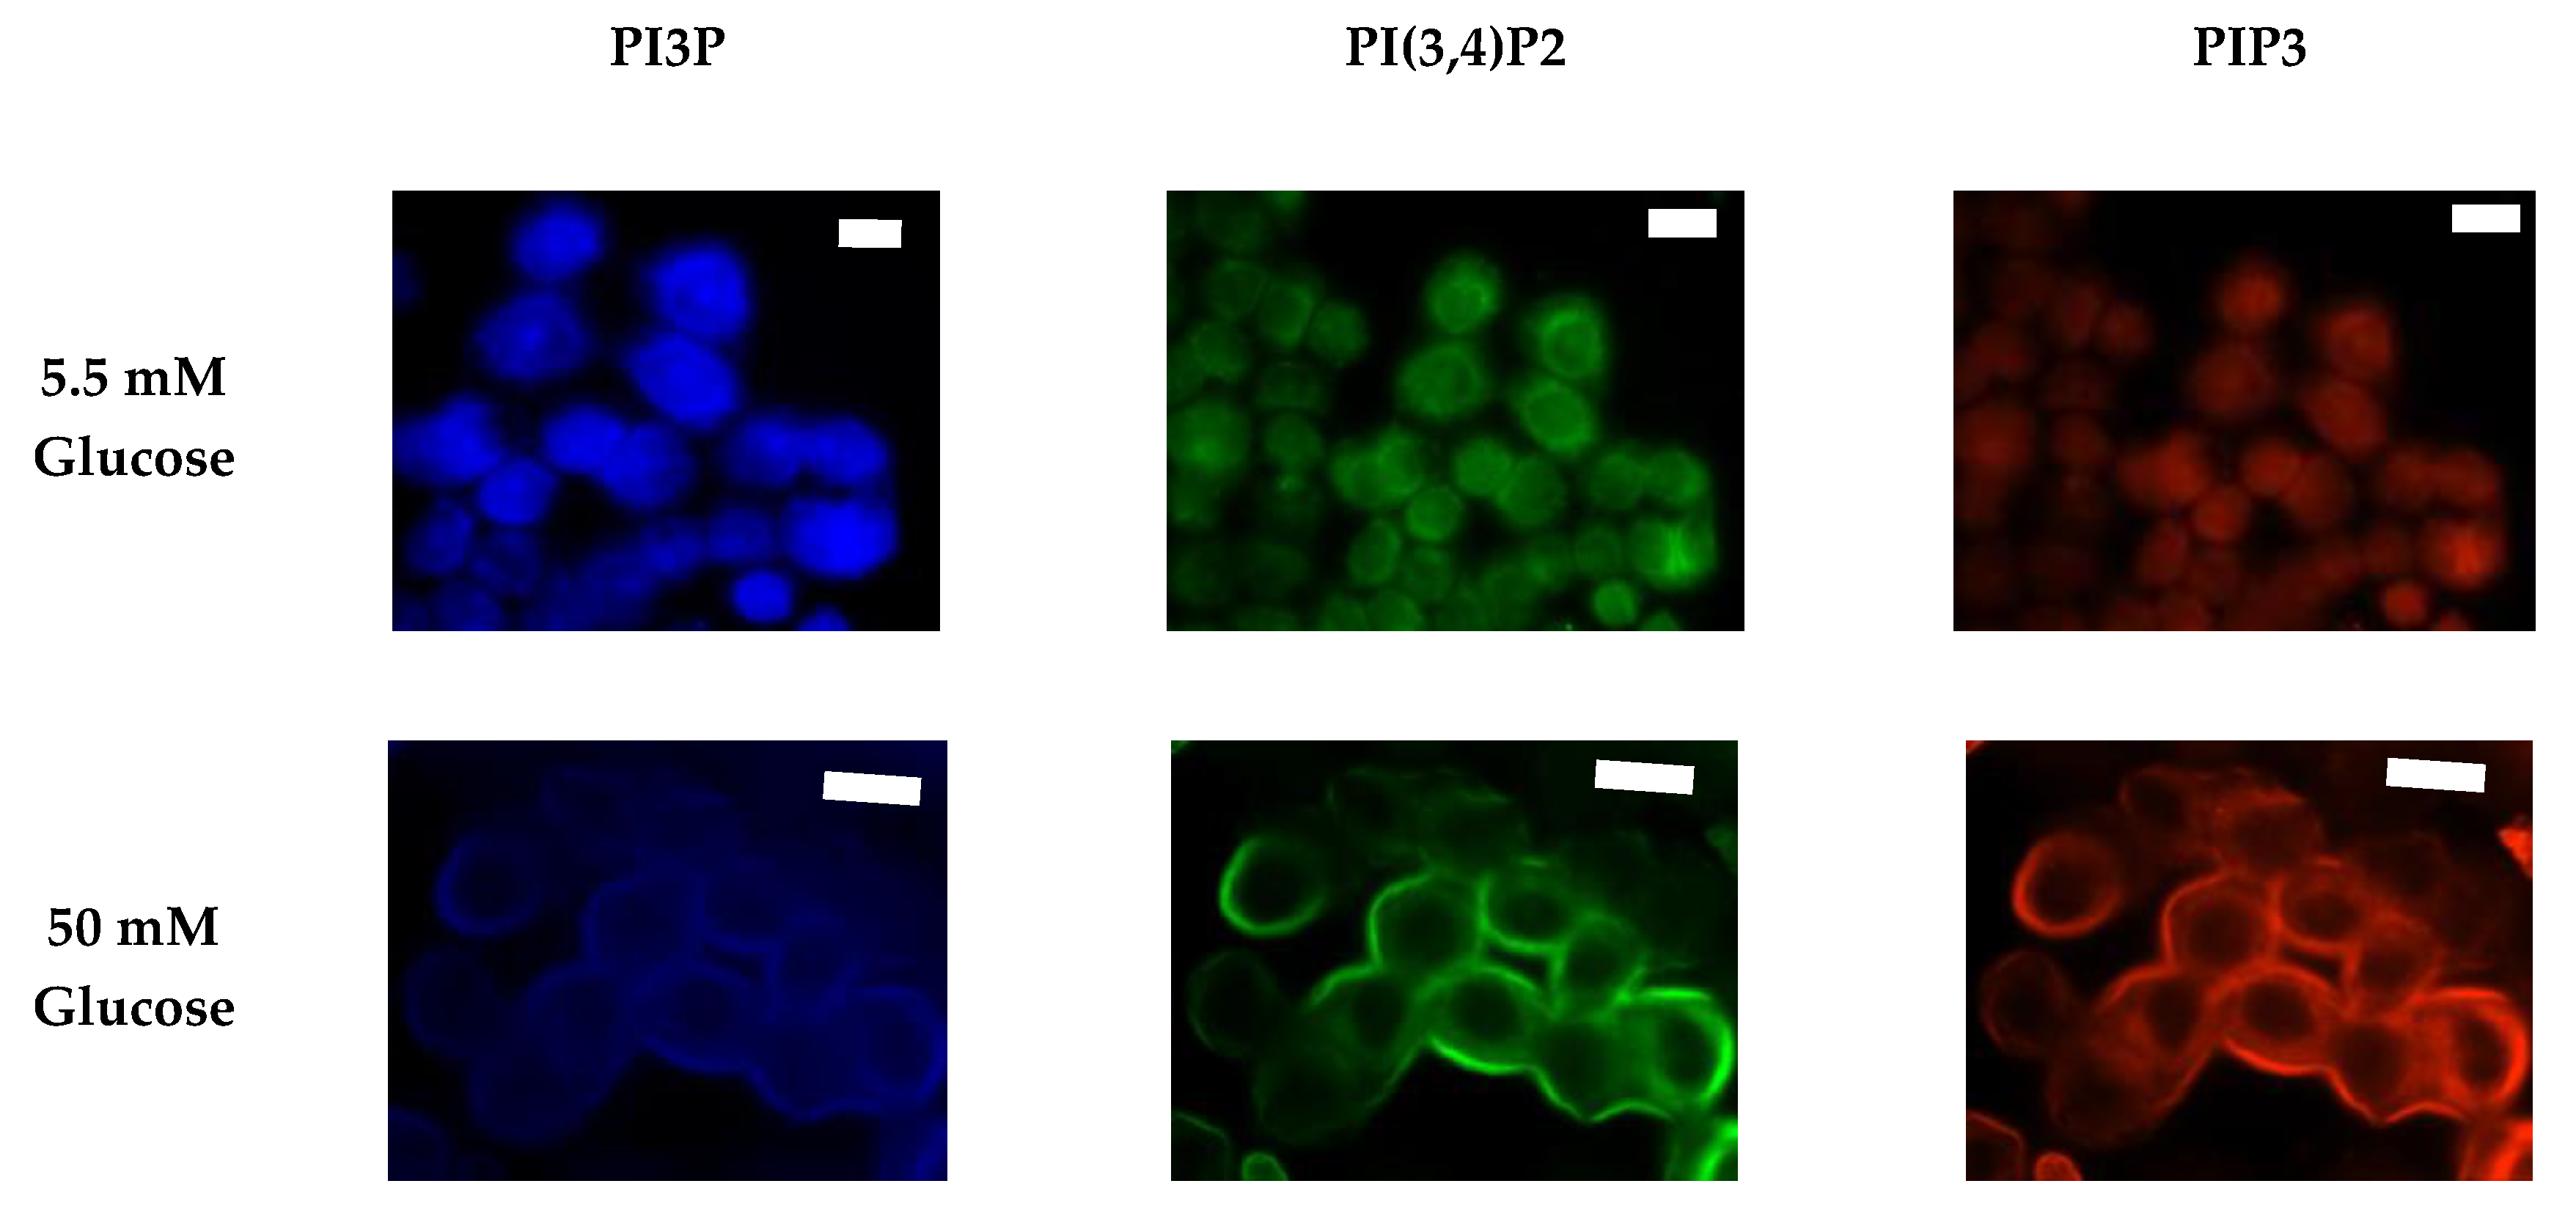
2.3.2. Triple Negative Breast Cancer PI Trends from Fixed Cell Fluorescence Analysis
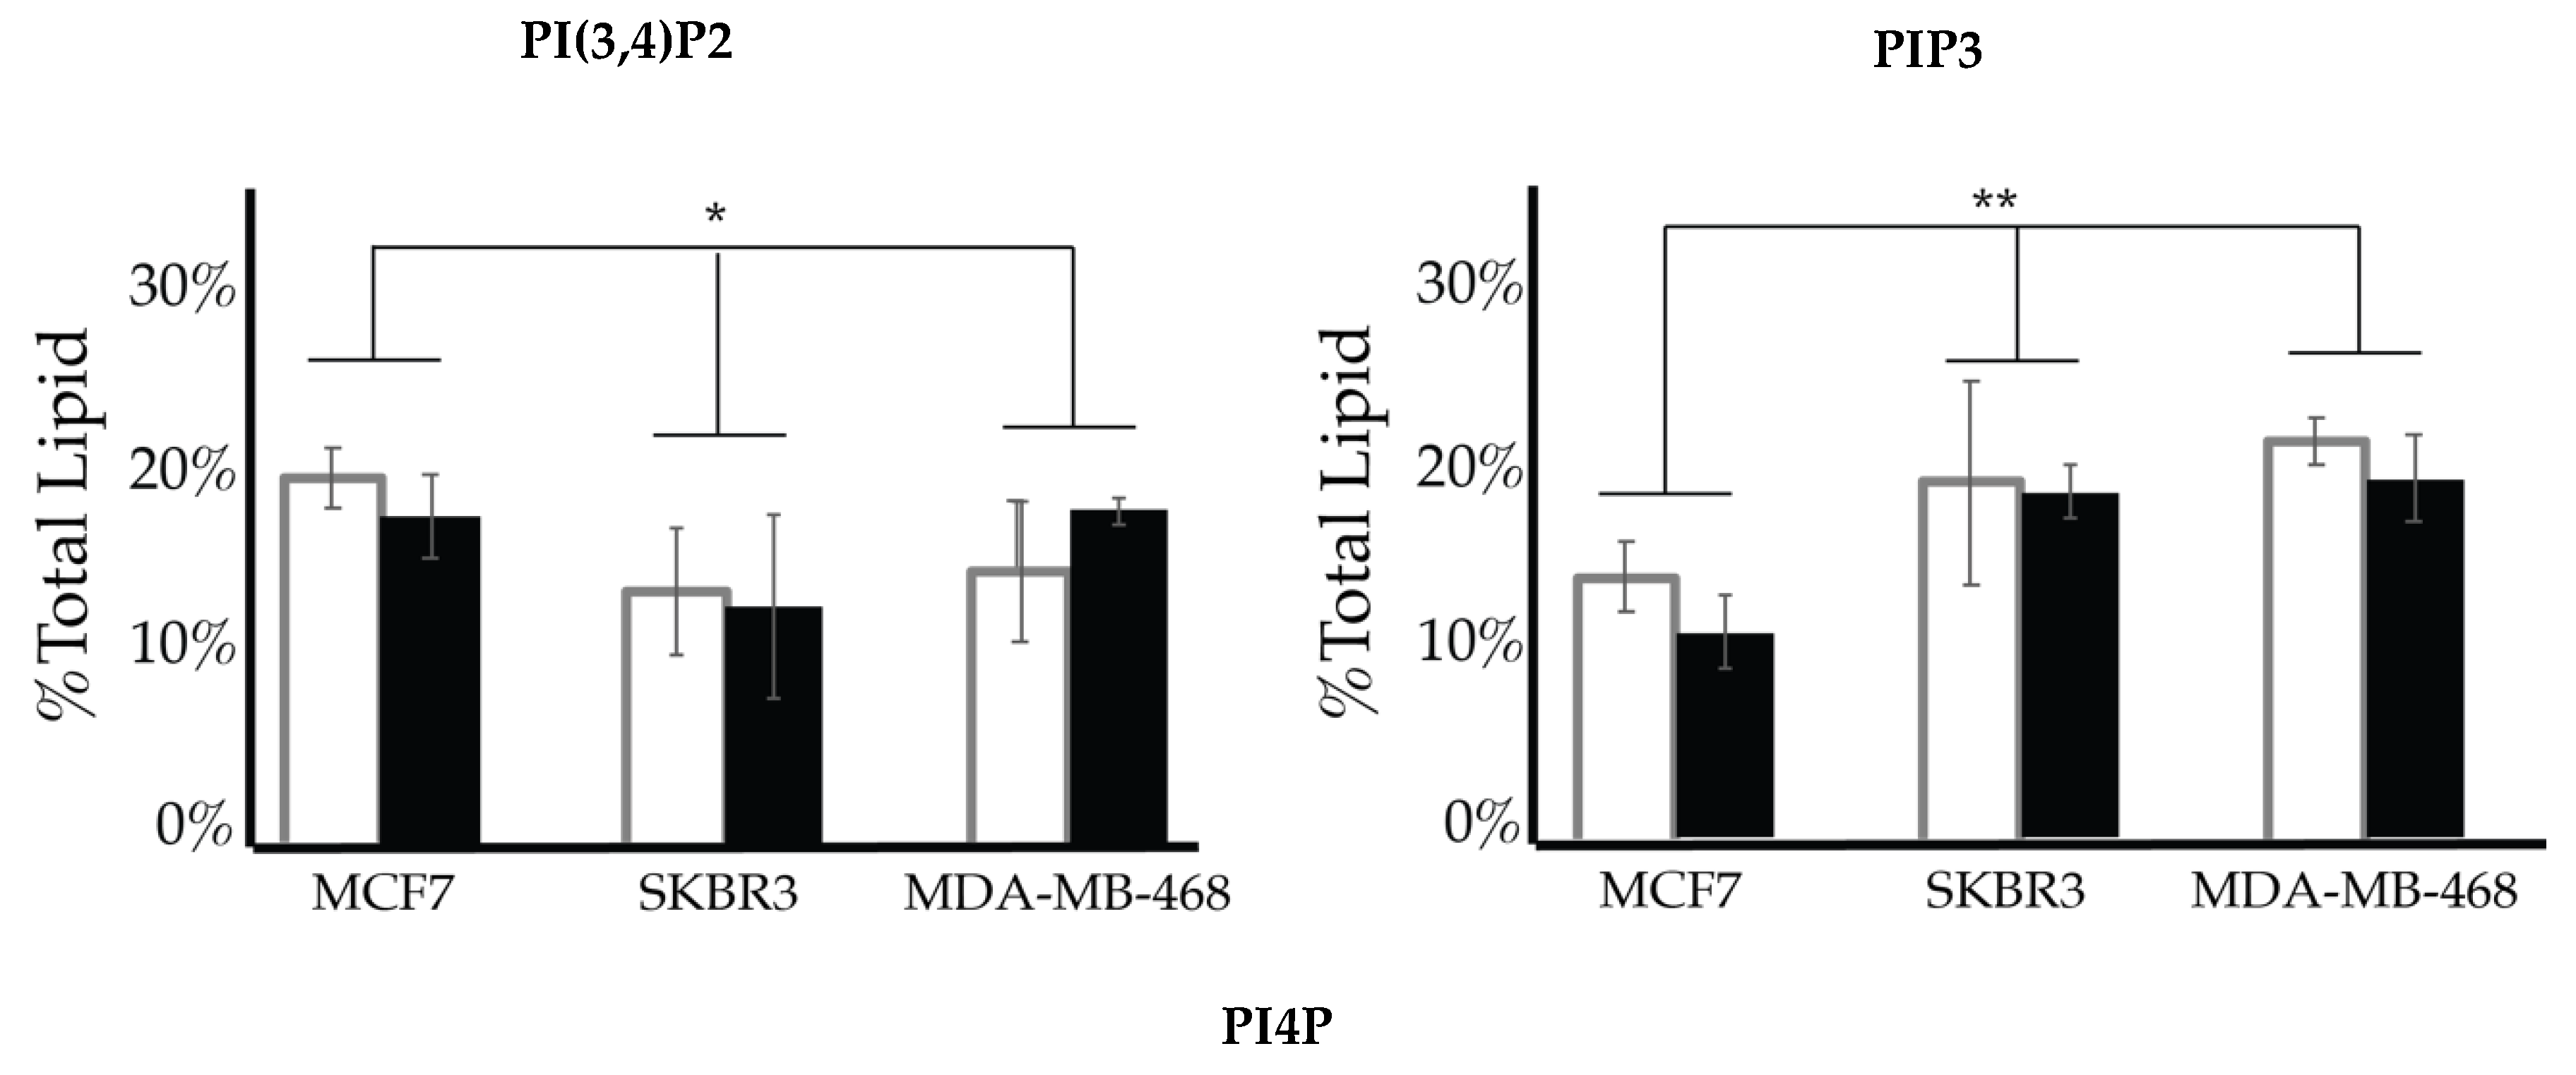
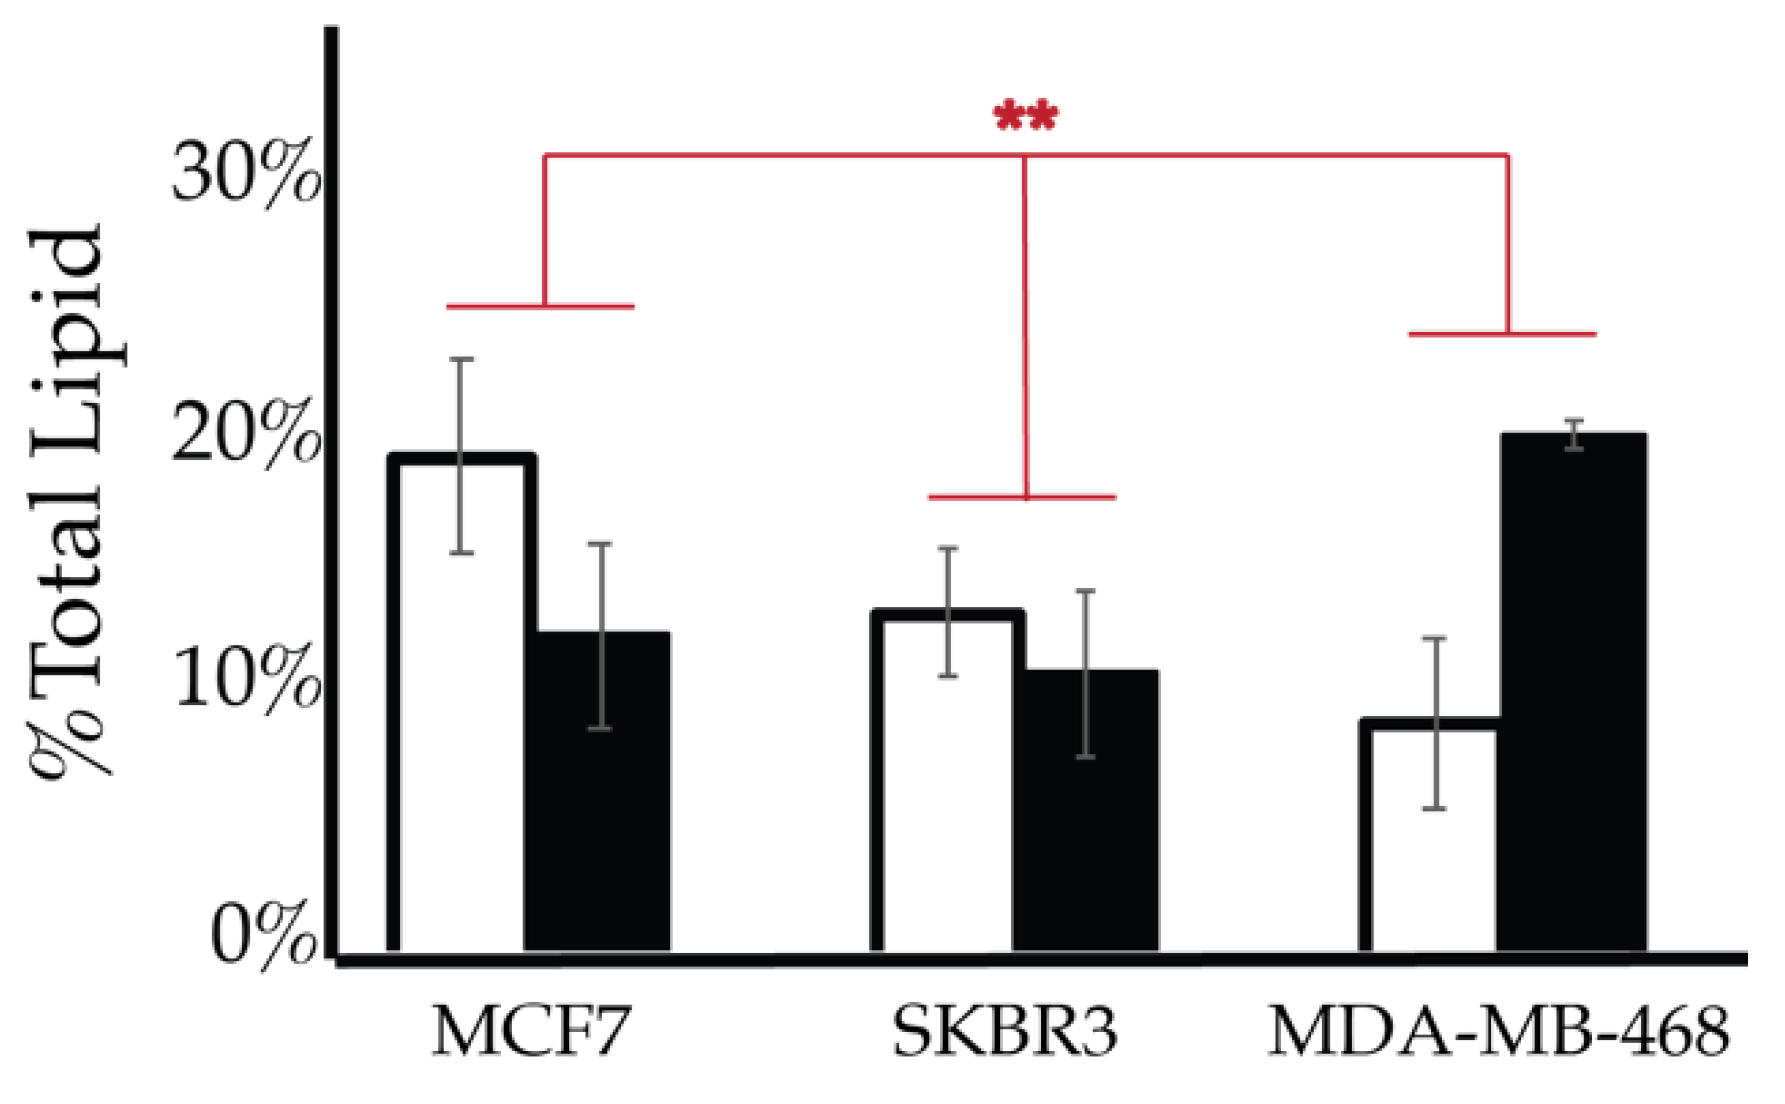
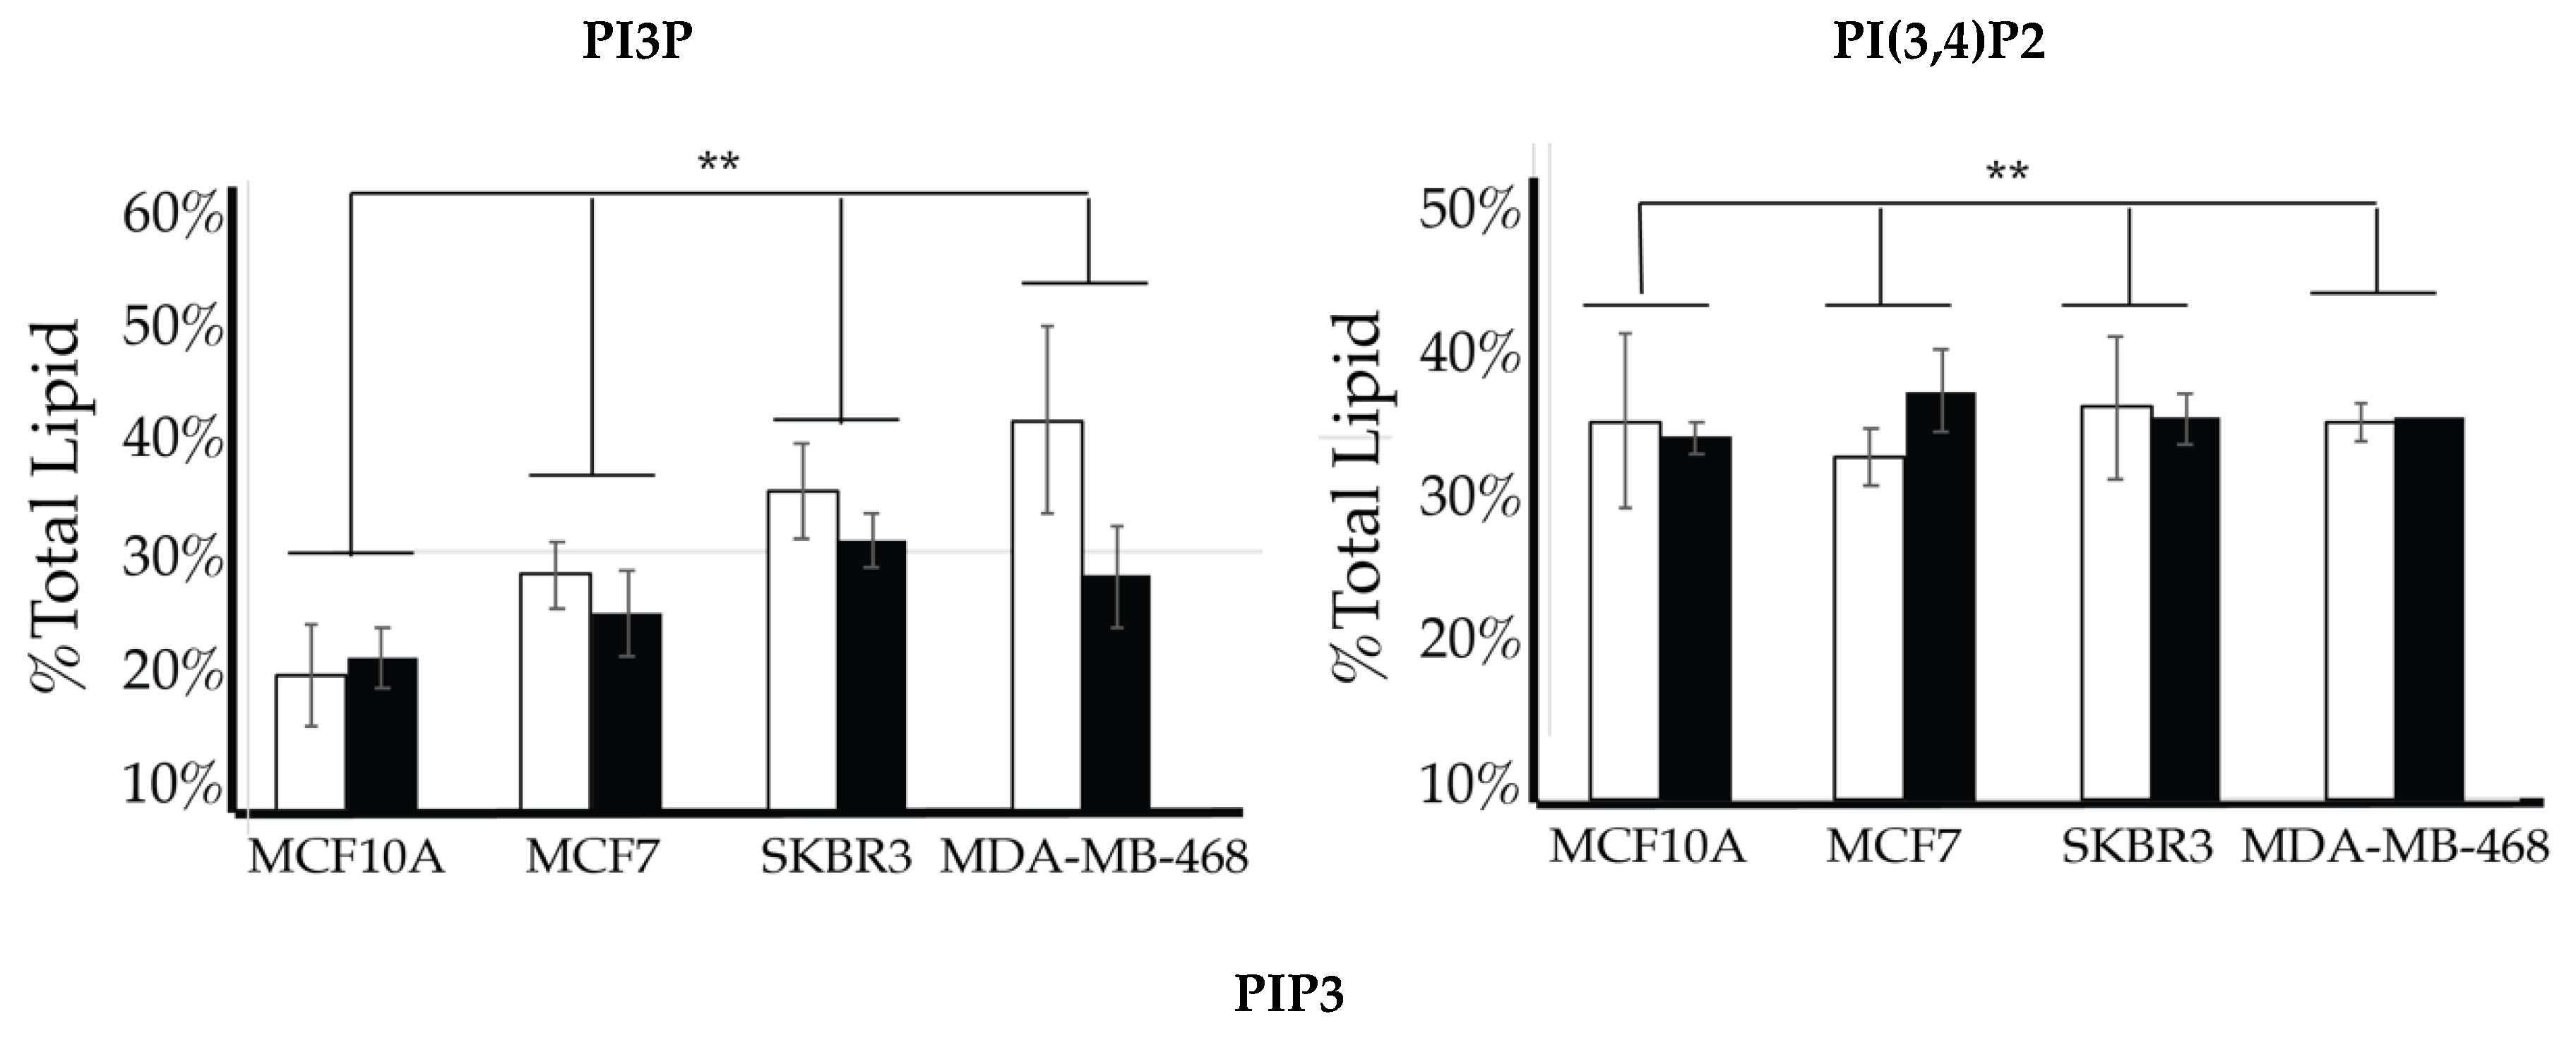
2.4. Comparison of Cell Lines
3. Discussion
4. Materials and Methods
4.1. Materials
4.2. Methods
4.2.1. Mammalian Cell Culture
4.2.2. Fixed Cell Imaging
4.2.3. Spot Blot Assay
4.2.4. Statistical Analysis
Author Contributions
Funding
Acknowledgments
Conflicts of Interest
Abbreviations
| MDPI | Multidisciplinary Digital Publishing Institute |
| DOAJ | Directory of open access journals |
| TLA | Three letter acronym |
| EGFR | Epidermal growth factor receptor |
| ER | Estrogen receptor |
| PR | Progesterone receptor |
| HR | Hormone receptor |
| HER | Human epidermal growth factor receptor |
| IDC | Invasive ductal carcinoma |
| PI | Phosphatidylinositol |
| PI3P | Phosphatidylinositol 3-phosphate |
| PI4P | Phosphatidylinositol 4-phosphate |
| PI5P | Phosphatidylinositol 5-phosphate |
| PI(3,4)P2 | Phosphatidylinositol 3,4-bisphosphate |
| PI(3,5)P2 | Phosphatidylinositol 3,5-bisphosphate |
| PI(4,5)P2 | Phosphatidylinositol 4,5-bisphosphate |
| PIP3 | Phosphatidylinositol 3,4,5-triphosphate |
| TNBC | Triple negative breast cancer |
References
- Siegel, R.L.; Miller, K.D.; Jemal, A. Cancer statistics, 2020. CA Cancer J. Clin. 2020, 70, 7–30. [Google Scholar] [CrossRef] [PubMed]
- Watkins, E.J. Overview of breast cancer. J. Am. Acad. Physician Assist. 2019, 32, 13–17. [Google Scholar] [CrossRef]
- Arcidiacono, B.; Iiritano, S.; Nocera, A.; Possidente, K.; Nevolo, M.T.; Ventura, V.; Foti, D.; Chiefari, E.; Brunetti, A. Insulin Resistance and Cancer Risk: An Overview of the Pathogenetic Mechanisms. Exp. Diabetes Res. 2012, 2012, 1–12. [Google Scholar] [CrossRef] [PubMed]
- Boyle, P.; Koechlin, A.; Robertson, C.; Valentini, F.; Coppens, K.; Fairley, L.-L.; Boniol, M.; Zheng, T.; Zhang, Y.; Pasterk, M.; et al. Diabetes and breast cancer risk: A meta-analysis. Br. J. Cancer 2012, 107, 1608–1617. [Google Scholar] [CrossRef] [PubMed]
- Vigneri, P.; Frasca, F.; Sciacca, L.; Pandini, G.; Vigneri, R. Diabetes and cancer. Endocrine-Relat. Cancer 2009, 16, 1103–1123. [Google Scholar] [CrossRef] [PubMed]
- Giovannucci, E.; Harlan, D.M.; Archer, M.C.; Bergenstal, R.M.; Gapstur, S.M.; Habel, L.A.; Pollak, M.; Regensteiner, J.G.; Yee, D. Diabetes and Cancer: A Consensus Report. CA A Cancer J. Clin. 2010, 60, 207–221. [Google Scholar]
- Peairs, K.S.; Barone, B.B.; Snyder, C.F.; Yeh, H.-C.; Stein, K.B.; Derr, R.L.; Brancati, F.L.; Wolff, A.C. Diabetes Mellitus and Breast Cancer Outcomes: A Systematic Review and Meta-Analysis. J. Clin. Oncol. 2011, 29, 40–46. [Google Scholar] [CrossRef]
- Cidado, J.; Park, B.H. Targeting the PI3K/Akt/mTOR pathway for breast cancer therapy. J. Mammary Gland. Biol. Neoplasia 2012, 17, 205–216. [Google Scholar] [CrossRef]
- Rose, D.P.; Vona-Davis, L. The cellular and molecular mechanisms by which insulin influences breast cancer risk and progression. Endocrine-Relat. Cancer 2012, 19, R225–R241. [Google Scholar] [CrossRef]
- Bronsveld, H.K.; Jensen, V.; Vahl, P.; De Bruin, M.L.; Cornelissen, S.; Sanders, J.; Auvinen, A.; Haukka, J.; Andersen, M.; Vestergaard, P.; et al. Diabetes and Breast Cancer Subtypes. PLoS ONE 2017, 12, e0170084. [Google Scholar] [CrossRef]
- Macheda, M.; Rogers, S.; Best, J.D. Molecular and cellular regulation of glucose transporter (GLUT) proteins in cancer. J. Cell. Physiol. 2004, 202, 654–662. [Google Scholar] [CrossRef]
- Gallagher, E.J.; Fierz, Y.; Vijayakumar, A.; Haddad, N.; Yakar, S.; Gallagher, E.J. Inhibiting PI3K reduces mammary tumor growth and induces hyperglycemia in a mouse model of insulin resistance and hyperinsulinemia. Oncogene 2011, 31, 3213–3222. [Google Scholar] [CrossRef] [PubMed]
- Novosyadlyy, R.; Lann, D.E.; Vijayakumar, A.; Rowzee, A.; Lazzarino, D.A.; Fierz, Y.; Carboni, J.M.; Gottardis, M.M.; Pennisi, P.; Molinolo, A.A.; et al. Insulin-mediated acceleration of breast cancer development and progression in a nonobese model of type 2 diabetes. Cancer Res. 2010, 70, 741–751. [Google Scholar] [CrossRef] [PubMed]
- Saal, L.H. PIK3CA Mutations Correlate with Hormone Receptors, Node Metastasis, and ERBB2, and Are Mutually Exclusive with PTEN Loss in Human Breast Carcinoma. Cancer Res. 2005, 65, 2554–2559. [Google Scholar] [CrossRef] [PubMed]
- Bachman, K.E.; Argani, P.; Samuels, Y.; Silliman, N.; Ptak, J.; Szabo, S.; Konishi, H.; Karakas, B.; Blair, B.G.; Lin, C.; et al. The PIK3CA gene is mutated with high frequency in human breast cancers. Cancer Biol. Ther. 2004, 3, 772–775. [Google Scholar] [CrossRef] [PubMed]
- Samuels, Y. High Frequency of Mutations of the PIK3CA Gene in Human Cancers. Science 2004, 304, 554. [Google Scholar] [CrossRef]
- Epstein, T.; Xu, L.; Gillies, R.; Gatenby, R. Separation of metabolic supply and demand: Aerobic glycolysis as a normal physiological response to fluctuating energetic demands in the membrane. Cancer Metab. 2014, 2, 7. [Google Scholar] [CrossRef]
- Lunt, S.Y.; Heiden, M.G.V. Aerobic Glycolysis: Meeting the Metabolic Requirements of Cell Proliferation. Annu. Rev. Cell Dev. Biol. 2011, 27, 441–464. [Google Scholar] [CrossRef]
- Levine, A.; Puzio-Kuter, A.M. The Control of the Metabolic Switch in Cancers by Oncogenes and Tumor Suppressor Genes. Science 2010, 330, 1340–1344. [Google Scholar] [CrossRef]
- Semplice, M.; Veglio, A.; Naldi, G.; Serini, G.; Gamba, A.A. A Bistable Model of Cell Polarity. PLoS ONE 2012, 7, e30977. [Google Scholar] [CrossRef]
- Lupyan, D.; Mezei, M.; Logothetis, D.E.; Osman, R. A Molecular Dynamics Investigation of Lipid Bilayer Perturbation by PIP2. Biophys. J. 2010, 98, 240–247. [Google Scholar] [CrossRef] [PubMed]
- Hermelink, A.; Brezesinski, G. Do unsaturated phosphoinositides mix with ordered phosphadidylcholine model membranes? J. Lipid Res. 2008, 49, 1918–1925. [Google Scholar] [CrossRef] [PubMed]
- McLaughlin, S.; Murray, D. Plasma membrane phosphoinositide organization by protein electrostatics. Nature 2005, 438, 605–611. [Google Scholar] [CrossRef] [PubMed]
- Gassama-Diagne, A.; Yu, W.; Ter Beest, M.; Martin-Belmonte, F.; Kierbel, A.; Engel, J.; Mostov, K.E. Phosphatidylinositol-3,4,5-trisphosphate regulates the formation of the basolateral plasma membrane in epithelial cells. Nature 2006, 8, 963–970. [Google Scholar] [CrossRef] [PubMed]
- Rodriguez-Boulan, E.; Macara, I.G. Organization and execution of the epithelial polarity programme. Nat. Rev. Mol. Cell Biol. 2014, 15, 225–242. [Google Scholar] [CrossRef] [PubMed]
- Manna, P.; Jain, S.K. Phosphatidylinositol-3,4,5-triphosphate and cellular signaling: Implications for obesity and diabetes. Cell. Physiol. Biochem. 2015, 35, 1253–1275. [Google Scholar] [CrossRef]
- Burke, J.E. Structural Basis for Regulation of Phosphoinositide Kinases and Their Involvement in Human Disease. Mol. Cell 2018, 71, 653–673. [Google Scholar] [CrossRef]
- Bridges, D.; Saltiel, A.R. Phosphoinositides: Key modulators of energy metabolism. Biochim. Biophys. Acta (BBA) Bioenergy 2014, 1851, 857–866. [Google Scholar] [CrossRef]
- Cauvin, C.; Echard, A. Phosphoinositides: Lipids with informative heads and mastermind functions in cell division. Biochim. Biophys. Acta (BBA) Mol. Cell Biol. Lipids 2015, 1851, 832–843. [Google Scholar] [CrossRef]
- Cockcroft, S.; De Matteis, M. Inositol lipids as spatial regulators of membrane traffic. J. Membr. Biol. 2001, 180, 187–194. [Google Scholar] [CrossRef]
- Redfern, D.A.; Gericke, A. pH-dependent domain formation in phosphatidylinositol polyphosphate/phosphatidylcholine mixed vesicles. J. Lipid Res. 2004, 46, 504–515. [Google Scholar] [CrossRef] [PubMed]
- Kimble-Hill, A.; Petrache, H.I.; Seifert, S.; Firestone, M.A. Reorganization of Ternary Lipid Mixtures of Nonphosphorylated Phosphatidylinositol Interacting with Angiomotin. J. Phys. Chem. B 2018, 122, 8404–8415. [Google Scholar] [CrossRef] [PubMed]
- Rostoker, R.; Abelson, S.; Bitton-Worms, K.; Genkin, I.; Ben-Shmuel, S.; Dakwar, M.; Orr, Z.S.; Caspi, A.; Tzukerman, M.; Gallagher, E.J. Highly specific role of the insulin receptor in breast cancer progression. Endocrine-Relat. Cancer 2015, 22, 145–157. [Google Scholar] [CrossRef] [PubMed]
- Fierz, Y.; Novosyadlyy, R.; Vijayakumar, A.; Yakar, S.; Gallagher, E.J. Mammalian target of rapamycin inhibition abrogates insulin-mediated mammary tumor progression in type 2 diabetes. Endocrine-Relat. Cancer 2010, 17, 941–951. [Google Scholar] [CrossRef] [PubMed]
- Kim, H.J.; Kwon, H.; Lee, J.W.; Kim, H.J.; Lee, S.B.; Park, H.; Sohn, G.; Lee, Y.; Koh, B.S.; Yu, J.-H.; et al. Metformin increases survival in hormone receptor-positive, HER2-positive breast cancer patients with diabetes. Breast Cancer Res. 2015, 17, 64. [Google Scholar] [CrossRef] [PubMed]
- Ferroni, P.; Riondino, S.; Buonomo, O.; Palmirotta, R.; Guadagni, F.; Roselli, M. Type 2 Diabetes and Breast Cancer: The Interplay between Impaired Glucose Metabolism and Oxidant Stress. Oxidative Med. Cell. Longev. 2015, 2015, 1–10. [Google Scholar] [CrossRef]
- Marone, R.; Cmiljanovic, V.; Giese, B.; Wymann, M.P. Targeting phosphoinositide 3-kinase—Moving towards therapy. Biochim. et Biophys. Acta (BBA) Proteins Proteom. 2008, 1784, 159–185. [Google Scholar] [CrossRef]
- Bowers, L.W.; Rossi, E.L.; O’Flanagan, C.H.; Degraffenried, L.A.; Hursting, S.D.; O’Flanagan, C.H. The Role of the Insulin/IGF System in Cancer: Lessons Learned from Clinical Trials and the Energy Balance-Cancer Link. Front. Endocrinol. 2015, 6, 77. [Google Scholar] [CrossRef]
- Memon, A.A.; Bennet, L.; Zöller, B.; Wang, X.; Palmer, K.; Sundquist, K.; Sundquist, J. Circulating human epidermal growth factor receptor 2 (HER2) is associated with hyperglycaemia and insulin resistance循环中的人类表皮生长因子受体2 (HER2) 与高血糖以及胰岛素抵抗有关. J. Diabetes 2015, 7, 369–377. [Google Scholar] [CrossRef]
- Kang, C.; Gallagher, E.J.; Gallagher, E.J. Diabetes, Obesity, and Breast Cancer. Endocrinology 2018, 159, 3801–3812. [Google Scholar] [CrossRef]
- Mukohara, T. PI3K mutations in breast cancer: Prognostic and therapeutic implications. Breast Cancer Targets Ther. 2015, 7, 111–123. [Google Scholar] [CrossRef] [PubMed]
- Chen, Y.; Wang, B.-C.; Xiao, Y. PI3K: A potential therapeutic target for cancer. J. Cell. Physiol. 2012, 227, 2818–2821. [Google Scholar] [CrossRef] [PubMed]
- Leevers, S.J.; Vanhaesebroeck, B.; Waterfield, M.D. Signalling through phosphoinositide 3-kinases: The lipids take centre stage. Curr. Opin. Cell Biol. 1999, 11, 219–225. [Google Scholar] [CrossRef]
- Lien, E.C.; Dibble, C.; Toker, A. PI3K signaling in cancer: Beyond AKT. Curr. Opin. Cell Biol. 2017, 45, 62–71. [Google Scholar] [CrossRef]
- Chu, K.M.E.; Minogue, S.; Hsuan, J.; Waugh, M. Differential effects of the phosphatidylinositol 4-kinases, PI4KIIα and PI4KIIIβ, on Akt activation and apoptosis. Cell Death Dis. 2010, 1, e106. [Google Scholar] [CrossRef]
- Morrow, A.A.; Alipour, M.A.; Bridges, D.; Yao, Z.; Saltiel, A.R.; Lee, J.M. The Lipid Kinase PI4KIII? Is Highly Expressed in Breast Tumors and Activates Akt in Cooperation with Rab11a. Mol. Cancer Res. 2014, 12, 1492–1508. [Google Scholar] [CrossRef]
- Pinke, D.E.; Lee, J.M. The lipid kinase PI4KIIIβ and the eEF1A2 oncogene co-operate to disrupt three-dimensional in vitro acinar morphogenesis. Exp. Cell Res. 2011, 317, 2503–2511. [Google Scholar] [CrossRef]
- Yamaguchi, H.; Takeo, Y.; Yoshida, S.; Kouchi, Z.; Nakamura, Y.; Fukami, K. Lipid Rafts and Caveolin-1 Are Required for Invadopodia Formation and Extracellular Matrix Degradation by Human Breast Cancer Cells. Cancer Res. 2009, 69, 8594–8602. [Google Scholar] [CrossRef]
- Kim, J.; Jahng, W.J.; Di Vizio, L.; Lee, J.S.; Jhaveri, R.; Rubin, M.A.; Shisheva, A.; Freeman, M.R. The phosphoinositide kinase PIKfyve mediates epidermal growth factor receptor trafficking to the nucleus. Cancer Res. 2007, 67, 9229–9237. [Google Scholar] [CrossRef]
- Wang, Z.; Zhang, M.; Shan, R.; Wang, Y.; Chen, J.; Huang, J.; Sun, L.; Zhou, W. MTMR3 is upregulated in patients with breast cancer and regulates proliferation, cell cycle progression and autophagy in breast cancer cells. Oncol. Rep. 2019, 42, 1915–1923. [Google Scholar] [CrossRef]
- Tokuda, E.; Itoh, T.; Hasegawa, J.; Ijuin, T.; Takeuchi, Y.; Irino, Y.; Fukumoto, M.; Takenawa, T. Phosphatidylinositol 4-Phosphate in the Golgi Apparatus Regulates Cell-Cell Adhesion and Invasive Cell Migration in Human Breast Cancer. Cancer Res. 2014, 74, 3054–3066. [Google Scholar] [CrossRef] [PubMed]
- Ikonomov, O.C.; Filios, C.; Sbrissa, D.; Chen, X.; Shisheva, A. The PIKfyve-ArPIKfyve-Sac3 triad in human breast cancer: Functional link between elevated Sac3 phosphatase and enhanced proliferation of triple negative cell lines. Biochem. Biophys. Res. Commun. 2013, 440, 342–347. [Google Scholar] [CrossRef] [PubMed][Green Version]
- Papa, A.; Pandolfi, P. The PTEN-PI3K Axis in Cancer. Biomolecules 2019, 9, 153. [Google Scholar] [CrossRef] [PubMed]
- Erneux, C.; Ghosh, S.; Ramos, A.R.; Edimo, W.E. New Functions of the Inositol Polyphosphate 5-Phosphatases in Cancer. Curr. Pharm. Des. 2016, 22, 2309–2314. [Google Scholar] [CrossRef]
- Dória, M.L.; Cotrim, C.Z.; Simões, C.M.O.; Macedo, B.; Domingues, P.; Helguero, L. Lipidomic analysis of phospholipids from human mammary epithelial and breast cancer cell lines. J. Cell. Physiol. 2012, 228, 457–468. [Google Scholar] [CrossRef]
- Kim, H.-Y.; Lee, K.-M.; Kim, S.-H.; Kwon, Y.-J.; Chun, Y.-J.; Choi, H.-K. Comparative metabolic and lipidomic profiling of human breast cancer cells with different metastatic potentials. Oncotarget 2016, 7, 67111–67128. [Google Scholar] [CrossRef]
- Yang, L.; Cui, X.; Zhang, N.; Li, M.; Bai, Y.; Han, X.; Shi, Y.; Liu, H. Comprehensive lipid profiling of plasma in patients with benign breast tumor and breast cancer reveals novel biomarkers. Anal. Bioanal. Chem. 2015, 407, 5065–5077. [Google Scholar] [CrossRef]
- Cífková, E.; Holčapek, M.; Lísa, M.; Vrana, D.; Gatek, J.; Melichar, B. Determination of lipidomic differences between human breast cancer and surrounding normal tissues using HILIC-HPLC/ESI-MS and multivariate data analysis. Anal. Bioanal. Chem. 2014, 407, 991–1002. [Google Scholar] [CrossRef]
- Kawashima, M.; Iwamoto, N.; Kawaguchi-Sakita, N.; Sugimoto, M.; Ueno, T.; Mikami, Y.; Terasawa, K.; Sato, T.-A.; Tanaka, K.; Shimizu, K.; et al. High-resolution imaging mass spectrometry reveals detailed spatial distribution of phosphatidylinositols in human breast cancer. Cancer Sci. 2013, 104, 1372–1379. [Google Scholar] [CrossRef]
- Goto, T.; Terada, N.; Inoue, T.; Nakayama, K.; Okada, Y.; Yoshikawa, T.; Miyazaki, Y.; Uegaki, M.; Sumiyoshi, S.; Kobayashi, T.; et al. The Expression Profile of Phosphatidylinositol in High Spatial Resolution Imaging Mass Spectrometry as a Potential Biomarker for Prostate Cancer. PLoS ONE 2014, 9, e90242. [Google Scholar] [CrossRef]
- Eberlin, L.S.; Dill, A.L.; Golby, A.J.; Ligon, K.L.; Wiseman, J.M.; Cooks, R.G.; Agar, N.Y.R. Discrimination of Human Astrocytoma Subtypes by Lipid Analysis Using Desorption Electrospray Ionization Imaging Mass Spectrometry. Angew. Chem. Int. Ed. 2010, 49, 5953–5956. [Google Scholar] [CrossRef] [PubMed]
- Vasudevan, K.M.; Barbie, D.A.; Davies, M.A.; Rabinovsky, R.; McNear, C.J.; Kim, J.J.; Hennessy, B.T.; Tseng, H.; Pochanard, P.; Kim, S.Y.; et al. AKT-Independent Signaling Downstream of Oncogenic PIK3CA Mutations in Human Cancer. Cancer Cell 2009, 16, 21–32. [Google Scholar] [CrossRef] [PubMed]
- Isakoff, S.J.; Engelman, J.A.; Irie, H.Y.; Luo, J.; Brachmann, S.M.; Pearline, R.V.; Cantley, L.C.; Brugge, J.S. Breast Cancer–AssociatedPIK3CAMutations Are Oncogenic in Mammary Epithelial Cells. Cancer Res. 2005, 65, 10992–11000. [Google Scholar] [CrossRef] [PubMed]
- Williamson, R.M.; Jackson, J.H. Common evolutionary origin of the ilvGMEDA attenuation locus and tRNA(1Leu) in Escherichia coli. J. Bacteriol. 1987, 169, 2893–2895. [Google Scholar] [CrossRef]
- Hollestelle, A.; Elstrodt, F.; Nagel, J.H.; Kallemeijn, W.W.; Schutte, M. Phosphatidylinositol-3-OH Kinase or RAS Pathway Mutations in Human Breast Cancer Cell Lines. Mol. Cancer Res. 2007, 5, 195–201. [Google Scholar] [CrossRef] [PubMed]
- Stemke-Hale, K.; Gonzalez-Angulo, A.M.; Lluch, A.; Neve, R.M.; Kuo, W.-L.; Davies, M.; Carey, M.; Hu, Z.; Guan, Y.; Sahin, A.; et al. An integrative genomic and proteomic analysis of PIK3CA, PTEN, and AKT mutations in breast cancer. Cancer Res. 2008, 68, 6084–6091. [Google Scholar] [CrossRef] [PubMed]
- Wu, K.; Fan, J.; Zhang, L.; Ning, Z.; Zeng, J.; Zhou, J.; Li, L.; Chen, Y.; Zhang, T.; Wang, X.; et al. PI3K/Akt to GSK3β/β-catenin signaling cascade coordinates cell colonization for bladder cancer bone metastasis through regulating ZEB1 transcription. Cell. Signal. 2012, 24, 2273–2282. [Google Scholar] [CrossRef]
- Fedele, C.G.; Ooms, L.M.; Ho, M.; Vieusseux, J.; O’Toole, S.A.; Millar, E.; Knowles, E.L.; Sriratana, A.; Gurung, R.; Baglietto, L.; et al. Inositol polyphosphate 4-phosphatase II regulates PI3K/Akt signaling and is lost in human basal-like breast cancers. Proc. Natl. Acad. Sci. USA 2010, 107, 22231–22236. [Google Scholar] [CrossRef]
- Vasan, N.; Toska, E.; Scaltriti, M. Overview of the relevance of PI3K pathway in HR-positive breast cancer. Ann. Oncol. 2019, 30, x3–x11. [Google Scholar] [CrossRef]
- Serra, V.; Scaltriti, M.; Prudkin, L.; Eichhorn, P.J.A.; Ibrahim, Y.H.; Chandarlapaty, S.; Markman, B.; Rodriguez, O.; Guzmán, M.; Rodriguez, S.; et al. PI3K inhibition results in enhanced HER signaling and acquired ERK dependency in HER2-overexpressing breast cancer. Oncogene 2011, 30, 2547–2557. [Google Scholar] [CrossRef]
- Thapa, N.; Tan, X.; Choi, S.; Lambert, P.F.; Rapraeger, A.C.; Anderson, R.A. The Hidden Conundrum of Phosphoinositide Signaling in Cancer. Trends Cancer 2016, 2, 378–390. [Google Scholar] [CrossRef] [PubMed]
- Emerling, B.M.; Hurov, J.B.; Poulogiannis, G.; Tsukazawa, K.S.; Choo-Wing, R.; Wulf, G.M.; Bell, E.L.; Shim, H.-S.; Lamia, K.A.; Rameh, L.E.; et al. Depletion of a putatively druggable class of phosphatidylinositol kinases inhibits growth of p53-null tumors. Cell 2013, 155, 844–857. [Google Scholar] [CrossRef] [PubMed]
- Rs, W.A.; Sm, E.; Hs, S.; Wahdan-Alaswad, R.; Edgerton, S.; Salem, H.; Thor, A. Metformin Targets Glucose Metabolism in Triple Negative Breast Cancer. J. Oncol. Transl. Res. 2018, 4, 1–6. [Google Scholar]
- Liu, Y.; Sun, R.; Wan, W.; Wang, J.; Oppenheim, J.J.; Chen, L.; Zhang, N. The involvement of lipid rafts in epidermal growth factor-induced chemotaxis of breast cancer cells. Mol. Membr. Biol. 2007, 24, 91–101. [Google Scholar] [CrossRef] [PubMed]
- Liao, W.-S.; Ho, Y.; Lin, Y.-W.; Raj, E.N.; Liu, K.-K.; Chen, C.; Zhou, X.-Z.; Lu, K.-P.; Chao, J. Targeting EGFR of triple-negative breast cancer enhances the therapeutic efficacy of paclitaxel- and cetuximab-conjugated nanodiamond nanocomposite. Acta Biomater. 2019, 86, 395–405. [Google Scholar] [CrossRef]
- Costa, R.L.B.; Han, H.S.; Gradishar, W.J. Targeting the PI3K/AKT/mTOR pathway in triple-negative breast cancer: A review. Breast Cancer Res. Treat. 2018, 169, 397–406. [Google Scholar] [CrossRef]
- Faes, S.; Dormond, O. PI3K and AKT: Unfaithful Partners in Cancer. Int. J. Mol. Sci. 2015, 16, 21138–21152. [Google Scholar] [CrossRef]
- Bertucci, M.C.; Mitchell, C.A. Phosphoinositide 3-kinase and INPP4B in human breast cancer: Phosphoinositide 3-kinase and INPP4B in human breast cancer. Ann. N. Y. Acad. Sci. 2013, 1280, 1–5. [Google Scholar] [CrossRef]
- Liu, J.C.; Voisin, V.; Wang, S.; Wang, D.-Y.; Jones, R.; Datti, A.; Uehling, D.; Al-Awar, R.; Egan, S.A.; Bader, G.D.; et al. Combined deletion of P ten and p53 in mammary epithelium accelerates triple-negative breast cancer with dependency on e EF 2 K. EMBO Mol. Med. 2014, 6, 1542–1560. [Google Scholar] [CrossRef]
- Ikonomov, O.C.; Sbrissa, D.; Fenner, H.; Shisheva, A. PIKfyve-ArPIKfyve-Sac3 Core Complex. J. Biol. Chem. 2009, 284, 35794–35806. [Google Scholar] [CrossRef]
- Samuels, Y.; Ericson, K. Oncogenic PI3K and its role in cancer. Curr. Opin. Oncol. 2006, 18, 77–82. [Google Scholar] [CrossRef] [PubMed]
- Engelman, J.A.; Luo, J.; Cantley, L.C. The evolution of phosphatidylinositol 3-kinases as regulators of growth and metabolism. Nat. Rev. Genet. 2006, 7, 606–619. [Google Scholar] [CrossRef] [PubMed]
- Backer, J.M. The regulation and function of Class III PI3Ks: Novel roles for Vps34. Biochem. J. 2008, 410, 1–17. [Google Scholar] [CrossRef] [PubMed]
- Carracedo, A.; Pandolfi, P.P. The PTEN–PI3K pathway: Of feedbacks and cross-talks. Oncogene 2008, 27, 5527–5541. [Google Scholar] [CrossRef] [PubMed]
- Vanhaesebroeck, B.; Waterfield, M. Signaling by Distinct Classes of Phosphoinositide 3-Kinases. Exp. Cell Res. 1999, 253, 239–254. [Google Scholar] [CrossRef]
- Fruman, D.A.; Meyers, R.E.; Cantley, L.C. Phosphoinositide Kinases. Annu. Rev. Biochem. 1998, 67, 481–507. [Google Scholar] [CrossRef] [PubMed]
- Wang, Y.J.; Wang, J.; Sun, H.Q.; Martínez, M.; Sun, Y.X.; Macia, E.; Kirchhausen, T.; Albanesi, J.P.; Roth, M.G.; Yin, H. Phosphatidylinositol 4 Phosphate Regulates Targeting of Clathrin Adaptor AP-1 Complexes to the Golgi. Cell 2003, 114, 299–310. [Google Scholar] [CrossRef]
- De Matteis, M.A.; Godi, A.; Corda, D. Phosphoinositides and the golgi complex. Curr. Opin. Cell Biol. 2002, 14, 434–447. [Google Scholar] [CrossRef]
- De Matteis, M.A.; Wilson, C.; D’Angelo, G. Phosphatidylinositol-4-phosphate: The Golgi and beyond. BioEssays 2013, 35, 612–622. [Google Scholar] [CrossRef] [PubMed]
- Waugh, M. The Great Escape: How phosphatidylinositol 4-kinases and PI4P promote vesicle exit from the Golgi (and drive cancer). Biochem. J. 2019, 476, 2321–2346. [Google Scholar] [CrossRef]
- Fukumoto, M.; Ijuin, T.; Takenawa, T. PI(3,4)P2 plays critical roles in the regulation of focal adhesion dynamics of MDA-MB-231 breast cancer cells. Cancer Sci. 2017, 108, 941–951. [Google Scholar] [CrossRef] [PubMed]
- Li, H.; Marshall, A. Phosphatidylinositol (3,4) bisphosphate-specific phosphatases and effector proteins: A distinct branch of PI3K signaling. Cell. Signal. 2015, 27, 1789–1798. [Google Scholar] [CrossRef] [PubMed]
- Endris, V.; Haussmann, L.; Buss, E.; Bacon, C.; Bartsch, D.; Rappold, G.A. SrGAP3 interacts with lamellipodin at the cell membrane and regulates Rac-dependent cellular protrusions. J. Cell Sci. 2011, 124, 3941–3955. [Google Scholar] [CrossRef] [PubMed]
- Sengelaub, C.A.; Navrazhina, K.; Ross, J.B.; Halberg, N.; Tavazoie, S.F. PTPRN 2 and PLC β1 promote metastatic breast cancer cell migration through PI (4,5)P 2 -dependent actin remodeling. EMBO J. 2015, 35, 62–76. [Google Scholar] [CrossRef]
- Cremona, O.; De Camilli, P. Phosphoinositides in membrane traffic at the synapse. J. Cell Sci. 2001, 114, 1041–1052. [Google Scholar] [PubMed]
- Brown, F.D.; Rozelle, A.L.; Yin, H.L.; Balla, T.; Donaldson, J.G. Phosphatidylinositol 4,5-bisphosphate and Arf6-regulated membrane traffic. J. Cell Biol. 2001, 154, 1007–1018. [Google Scholar] [CrossRef]
- Rozelle, A.L.; Machesky, L.M.; Yamamoto, M.; Driessens, M.H.E.; Insall, R.H.; Roth, M.G.; Luby-Phelps, K.; Marriott, G.; Hall, A.; Yin, H.L. Phosphatidylinositol 4,5-bisphosphate induces actin-based movement of raft-enriched vesicles through WASP-Arp2/3. Curr. Biol. 2000, 10, 311–320. [Google Scholar] [CrossRef]
- Sun, Y.; Thapa, N.; Hedman, A.C.; Anderson, R.A. Phosphatidylinositol 4,5-bisphosphate: Targeted production and signaling. BioEssays 2013, 35, 513–522. [Google Scholar] [CrossRef]
- Sohn, M.; Korzeniowski, M.; Zewe, J.P.; Wills, R.C.; Hammond, G.R.V.; Humpolickova, J.; Vrzal, L.; Chalupska, D.; Veverka, V.; Fairn, G.D.; et al. PI(4,5)P2 controls plasma membrane PI4P and PS levels via ORP5/8 recruitment to ER–PM contact sites. J. Cell Biol. 2018, 217, 1797–1813. [Google Scholar] [CrossRef]
- Hong, N.H.; Qi, A.; Weaver, A.M. PI(3,5)P2 controls endosomal branched actin dynamics by regulating cortactin–actin interactions. J. Cell Biol. 2015, 210, 753–769. [Google Scholar] [CrossRef]
- Martin-Belmonte, F.; Mostov, K.E. Phosphoinositides Control Epithelial Development. Cell Cycle 2007, 6, 1957–1961. [Google Scholar] [CrossRef] [PubMed]
- Martin-Belmonte, F.; Gassama, A.; Datta, A.; Yu, W.; Rescher, U.; Gerke, V.; Mostov, K. PTEN-Mediated Apical Segregation of Phosphoinositides Controls Epithelial Morphogenesis through Cdc42. Cell 2007, 128, 383–397. [Google Scholar] [CrossRef] [PubMed]
- Giepmans, B.N.G.; Van Ijzendoorn, S.C. Epithelial cell–cell junctions and plasma membrane domains. Biochim. et Biophys. Acta (BBA) Biomembr. 2009, 1788, 820–831. [Google Scholar] [CrossRef] [PubMed]
- Tuma, P.L.; Nyasae, L.K.; Backer, J.M.; Hubbard, A.L. Vps34p differentially regulates endocytosis from the apical and basolateral domains in polarized hepatic cells. J. Cell Biol. 2001, 154, 1197–1208. [Google Scholar] [CrossRef]
- Dai, X.; Cheng, H.; Bai, Z.; Li, J. Breast Cancer Cell Line Classification and Its Relevance with Breast Tumor Subtyping. J. Cancer 2017, 8, 3131–3141. [Google Scholar] [CrossRef]
- Michels, K.B.; Solomon, C.G.; Hu, F.B.; Rosner, B.; Hankinson, S.E.; Colditz, G.A.; Manson, J.E. Type 2 Diabetes and Subsequent Incidence of Breast Cancer in the Nurses’ Health Study. Diabetes Care 2003, 26, 1752–1758. [Google Scholar] [CrossRef]
- Hanker, A.; Pfefferle, A.D.; Balko, J.M.; Kuba, M.G.; Young, C.D.; Sánchez, V.; Sutton, C.R.; Cheng, H.; Perou, C.M.; Zhao, J.J.; et al. Mutant PIK3CA accelerates HER2-driven transgenic mammary tumors and induces resistance to combinations of anti-HER2 therapies. Proc. Natl. Acad. Sci. USA 2013, 110, 14372–14377. [Google Scholar] [CrossRef]
- Gandalovičová, A.; Vomastek, T.; Rosel, D.; Brábek, J. Cell polarity signaling in the plasticity of cancer cell invasiveness. Oncotarget 2016, 7, 25022–25049. [Google Scholar] [CrossRef]
- He, X.; Esteva, F.J.; Ensor, J.; Hortobagyi, G.N.; Lee, M.-H.; Yeung, S.-C.J. Metformin and thiazolidinediones are associated with improved breast cancer-specific survival of diabetic women with HER2+ breast cancer. Ann. Oncol. 2012, 23, 1771–1780. [Google Scholar] [CrossRef]
- Goel, S.; E Krop, I. PIK3CA mutations in HER2-positive breast cancer: An ongoing conundrum. Ann. Oncol. 2016, 27, 1368–1372. [Google Scholar] [CrossRef]
- Rugo, H.S.; Brufsky, A.M.; Yood, M.U.; Tripathy, D.; Kaufman, P.A.; Mayer, M.; Yoo, B.; Abidoye, O.O.; Yardley, D.A. Racial disparities in treatment patterns and clinical outcomes in patients with HER2-positive metastatic breast cancer. Breast Cancer Res. Treat. 2013, 141, 461–470. [Google Scholar] [CrossRef] [PubMed]
- Bauer, K.; Brown, M.; Cress, R.D.; Parise, C.A.; Caggiano, V. Descriptive analysis of estrogen receptor (ER)-negative, progesterone receptor (PR)-negative, and HER2-negative invasive breast cancer, the so-called triple-negative phenotype. Cancer 2007, 109, 1721–1728. [Google Scholar] [CrossRef] [PubMed]
- Parise, C.A.; Bauer, K.; Caggiano, V. Variation in breast cancer subtypes with age and race/ethnicity. Crit. Rev. Oncol. 2010, 76, 44–52. [Google Scholar] [CrossRef] [PubMed]
- Amirikia, K.C.; Mills, P.; Bush, J.; Newman, L.A. Higher population-based incidence rates of triple-negative breast cancer among young African-American women. Cancer 2011, 117, 2747–2753. [Google Scholar] [CrossRef]
- Comen, E.; Davids, M.; Kirchhoff, T.; Hudis, C.; Offit, K.; Robson, M. Relative contributions of BRCA1 and BRCA2 mutations to “triple-negative” breast cancer in Ashkenazi Women. Breast Cancer Res. Treat. 2011, 129, 185–190. [Google Scholar] [CrossRef]
- Stevens, K.N.; Vachon, C.M.; Couch, F.J. Genetic susceptibility to triple-negative breast cancer. Cancer Res. 2013, 73, 2025–2030. [Google Scholar] [CrossRef]
- Hall, L.; Donovan, E.; Araya, M.; Idowa, E.; Jiminez-Segovia, I.; Folck, A.; Wells, C.D.; Kimble-Hill, A. Identification of Specific Lysines and Arginines That Mediate Angiomotin Membrane Association. ACS Omega 2019, 4, 6726–6736. [Google Scholar] [CrossRef]
- Adler, J.J.; Heller, B.L.; Bringman, L.R.; Ranahan, W.P.; Cocklin, R.R.; Goebl, M.G.; Oh, M.; Lim, H.-S.; Ingham, R.J.; Wells, C.D. Amot130 Adapts Atrophin-1 Interacting Protein 4 to Inhibit Yes-associated Protein Signaling and Cell Growth. J. Biol. Chem. 2013, 288, 15181–15193. [Google Scholar] [CrossRef]
- Adler, J.J.; Johnson, D.E.; Heller, B.L.; Bringman, L.R.; Ranahan, W.P.; Conwell, M.D.; Sun, Y.; Hudmon, A.; Wells, C.D. Serum deprivation inhibits the transcriptional co-activator YAP and cell growth via phosphorylation of the 130-kDa isoform of Angiomotin by the LATS1/2 protein kinases. Proc. Natl. Acad. Sci. USA 2013, 110, 17368–17373. [Google Scholar] [CrossRef]
- Ranahan, W.P.; Han, Z.; Smith-Kinnaman, W.; Nabinger, S.C.; Heller, B.; Herbert, B.-S.; Chan, R.; Wells, C.D. The adaptor protein AMOT promotes the proliferation of mammary epithelial cells via the prolonged activation of the extracellular signal-regulated kinases. Cancer Res. 2011, 71, 2203–2211. [Google Scholar] [CrossRef]
- Drabovich, A.P.; Pavlou, M.P.; Dimitromanolakis, A.; Diamandis, E.P. Quantitative Analysis of Energy Metabolic Pathways in MCF-7 Breast Cancer Cells by Selected Reaction Monitoring Assay. Mol. Cell. Proteom. 2012, 11, 422–434. [Google Scholar] [CrossRef] [PubMed]
- Dai, X.; She, P.; Chi, F.; Feng, Y.; Liu, H.; Jin, D.; Zhao, Y.; Guo, X.; Jiang, D.; Guan, K.-L. Phosphorylation of angiomotin by Lats1/2 kinases inhibits F-actin binding, cell migration, and angiogenesis. J. Biol. Chem. 2013, 288, 34041–34051. [Google Scholar] [CrossRef] [PubMed]


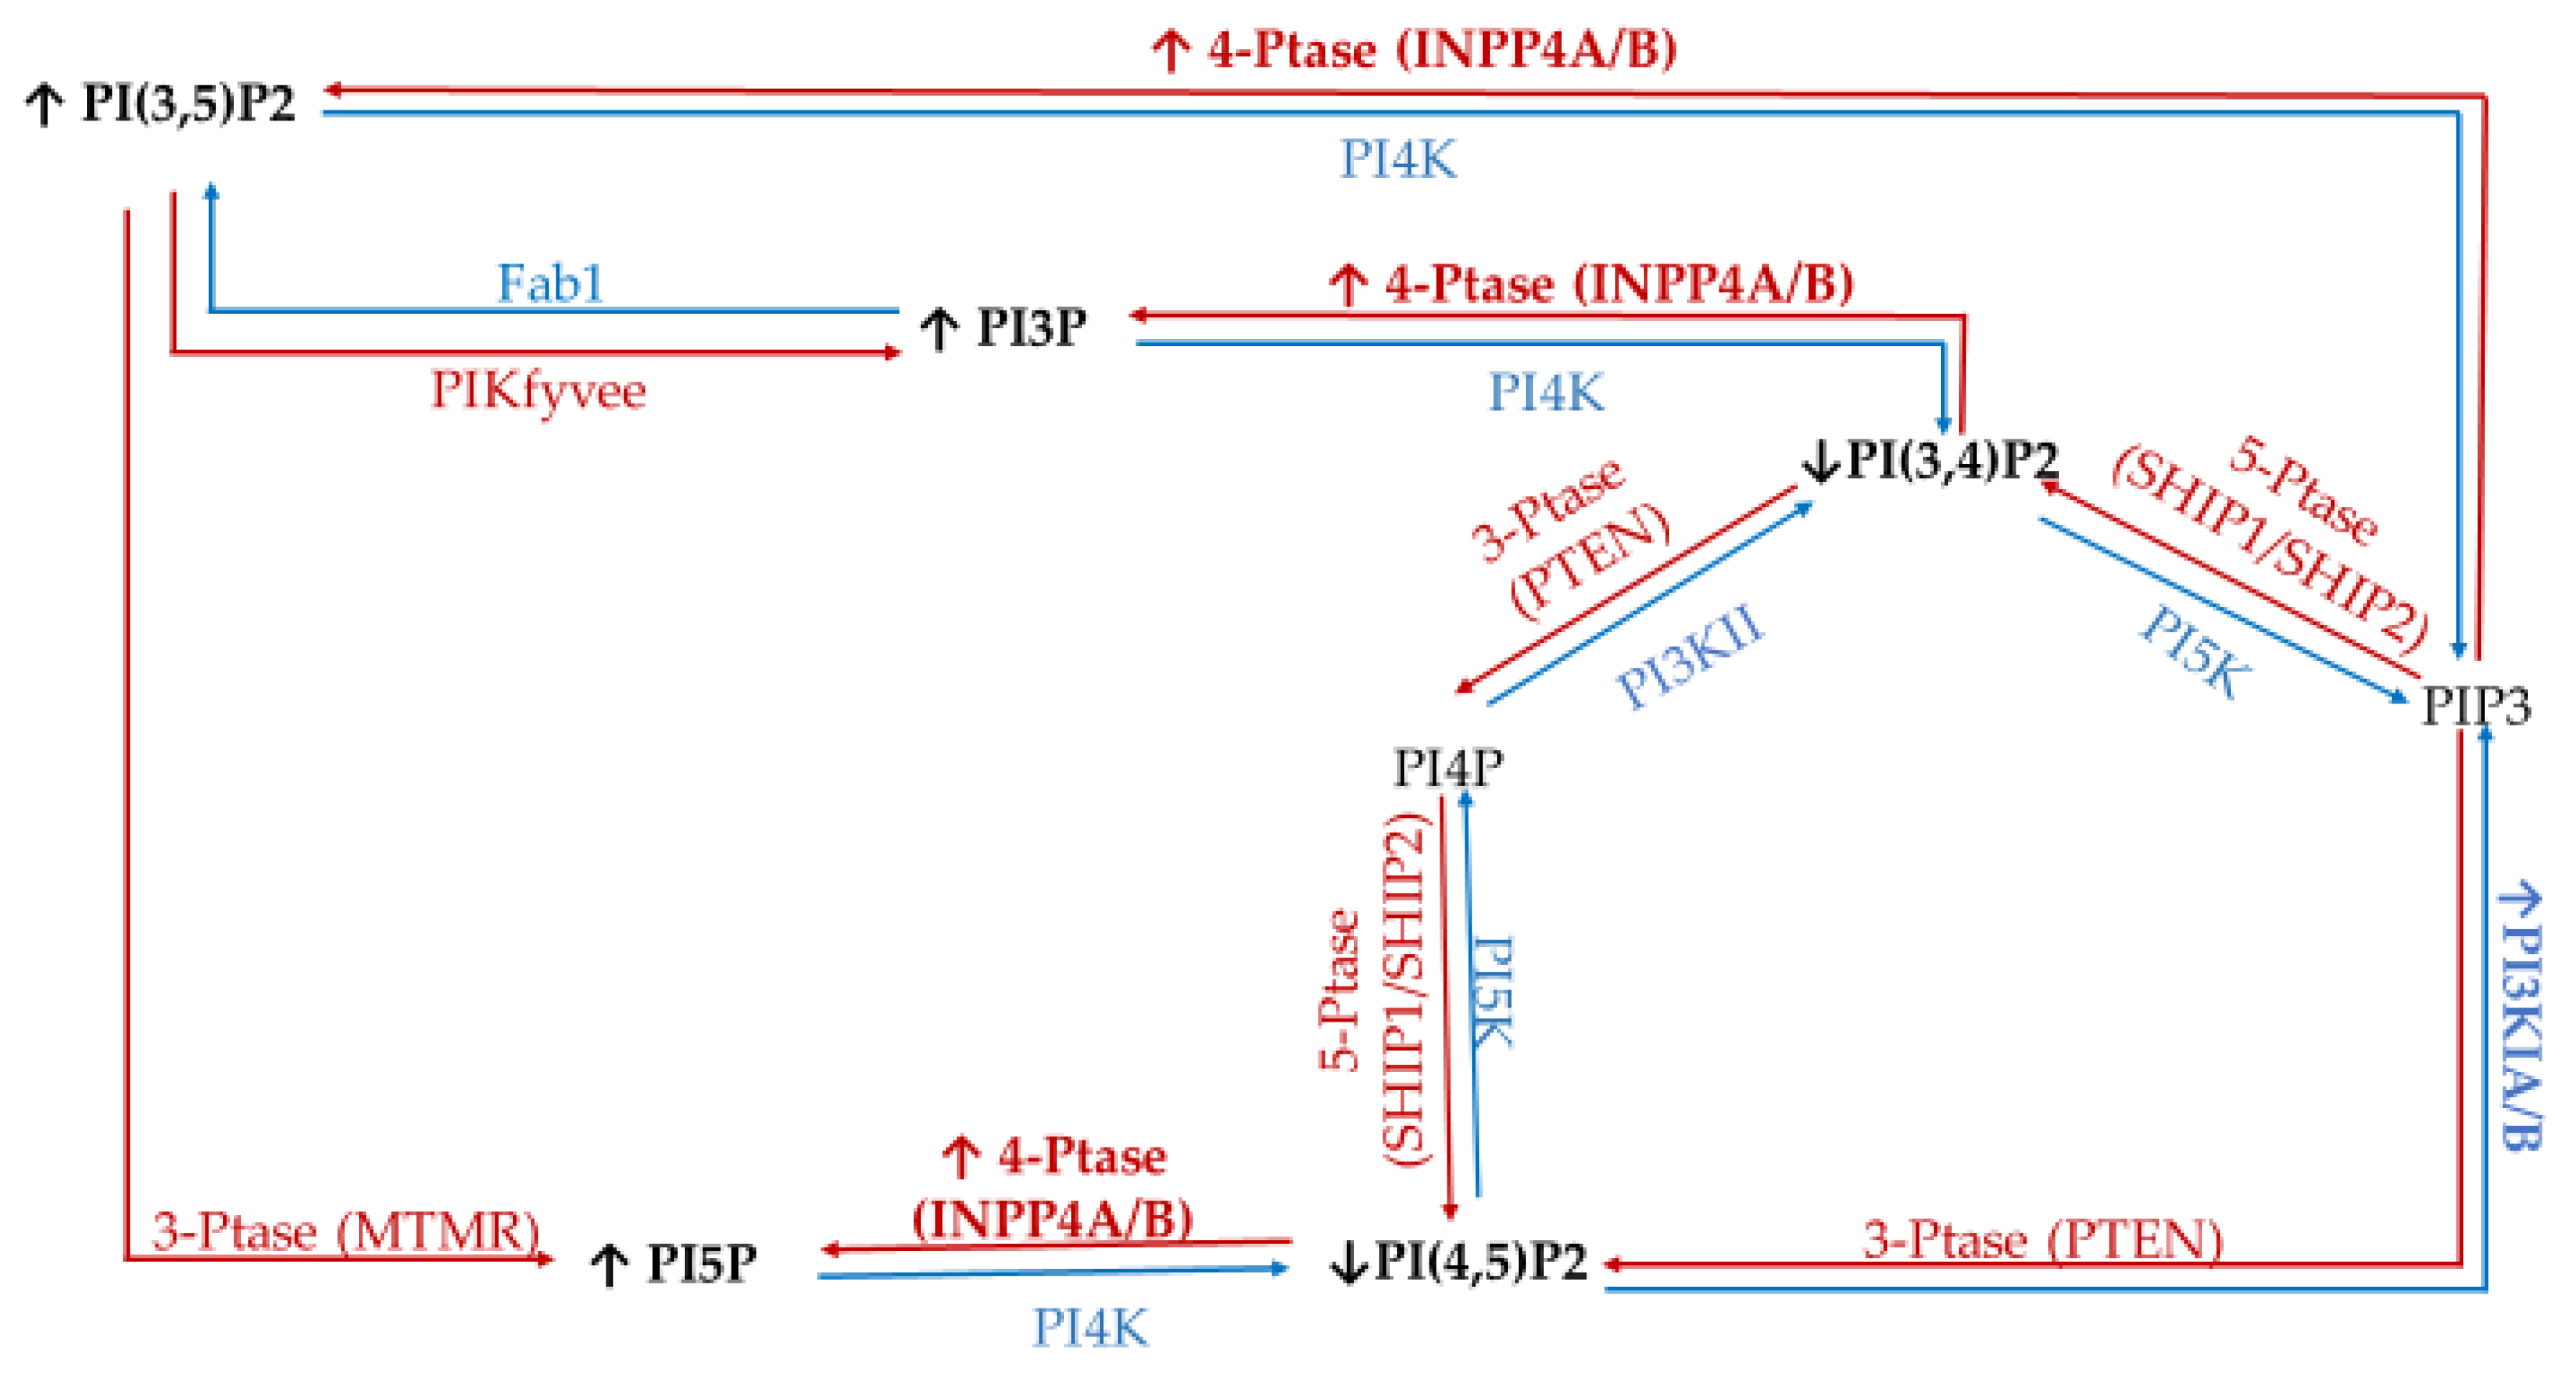
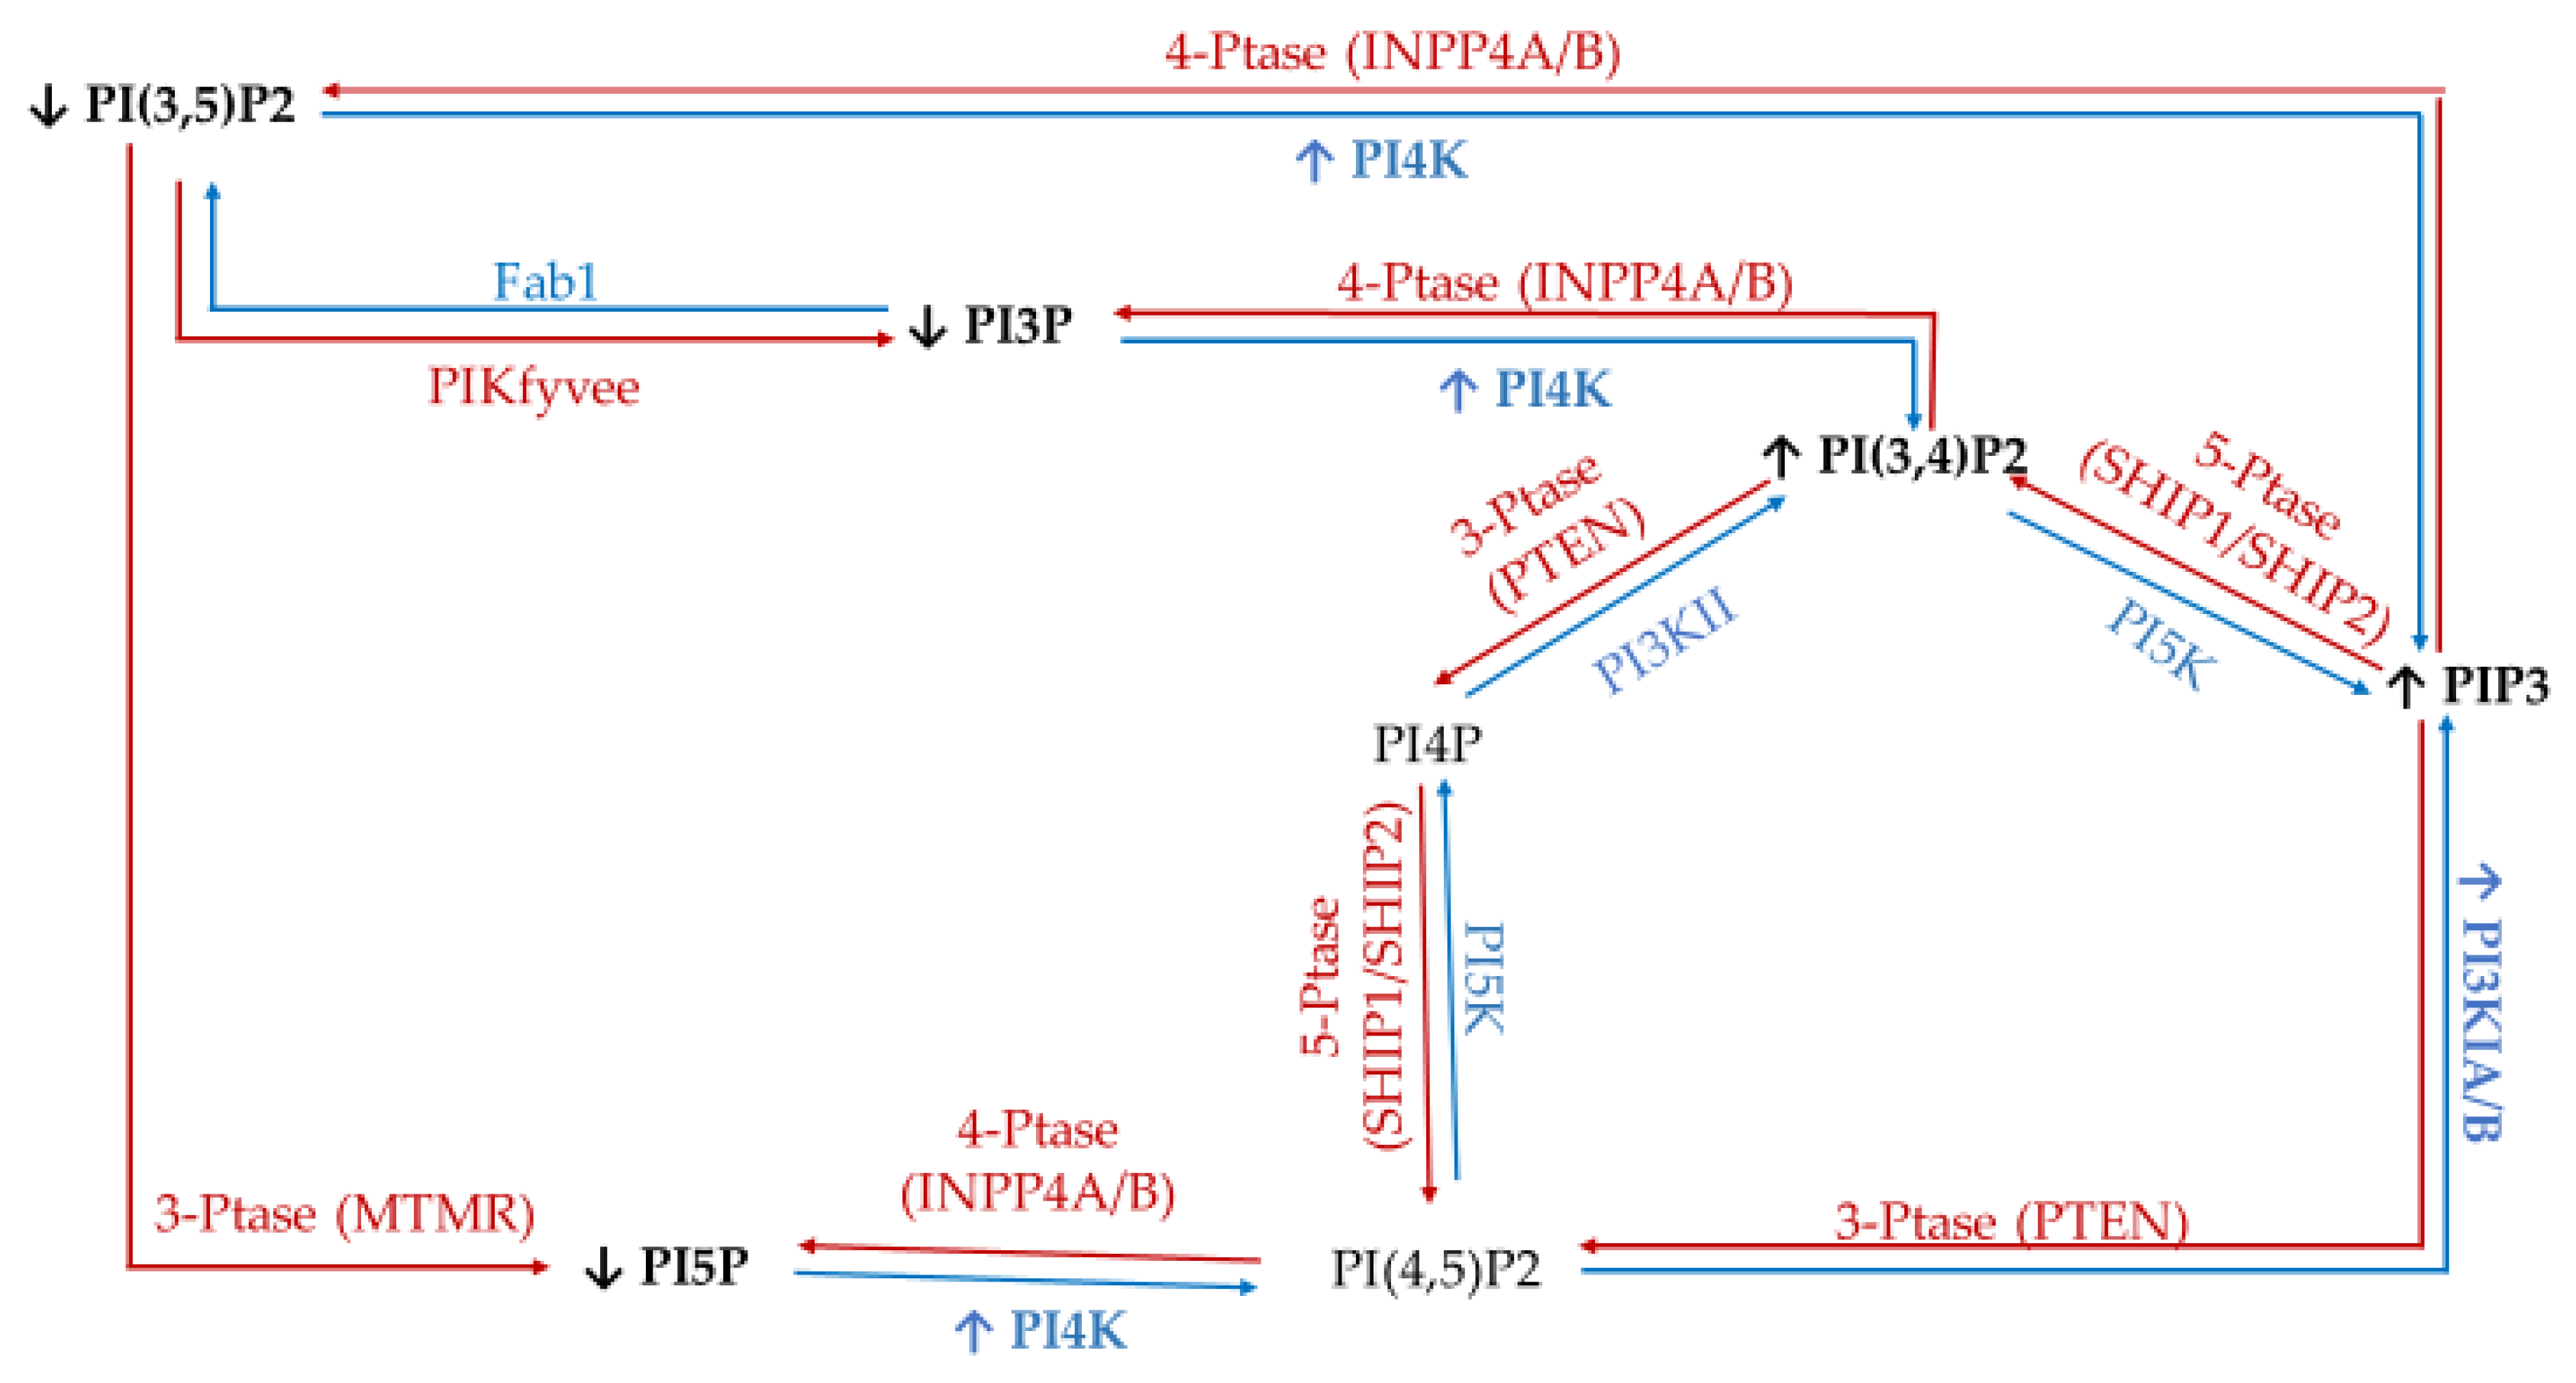
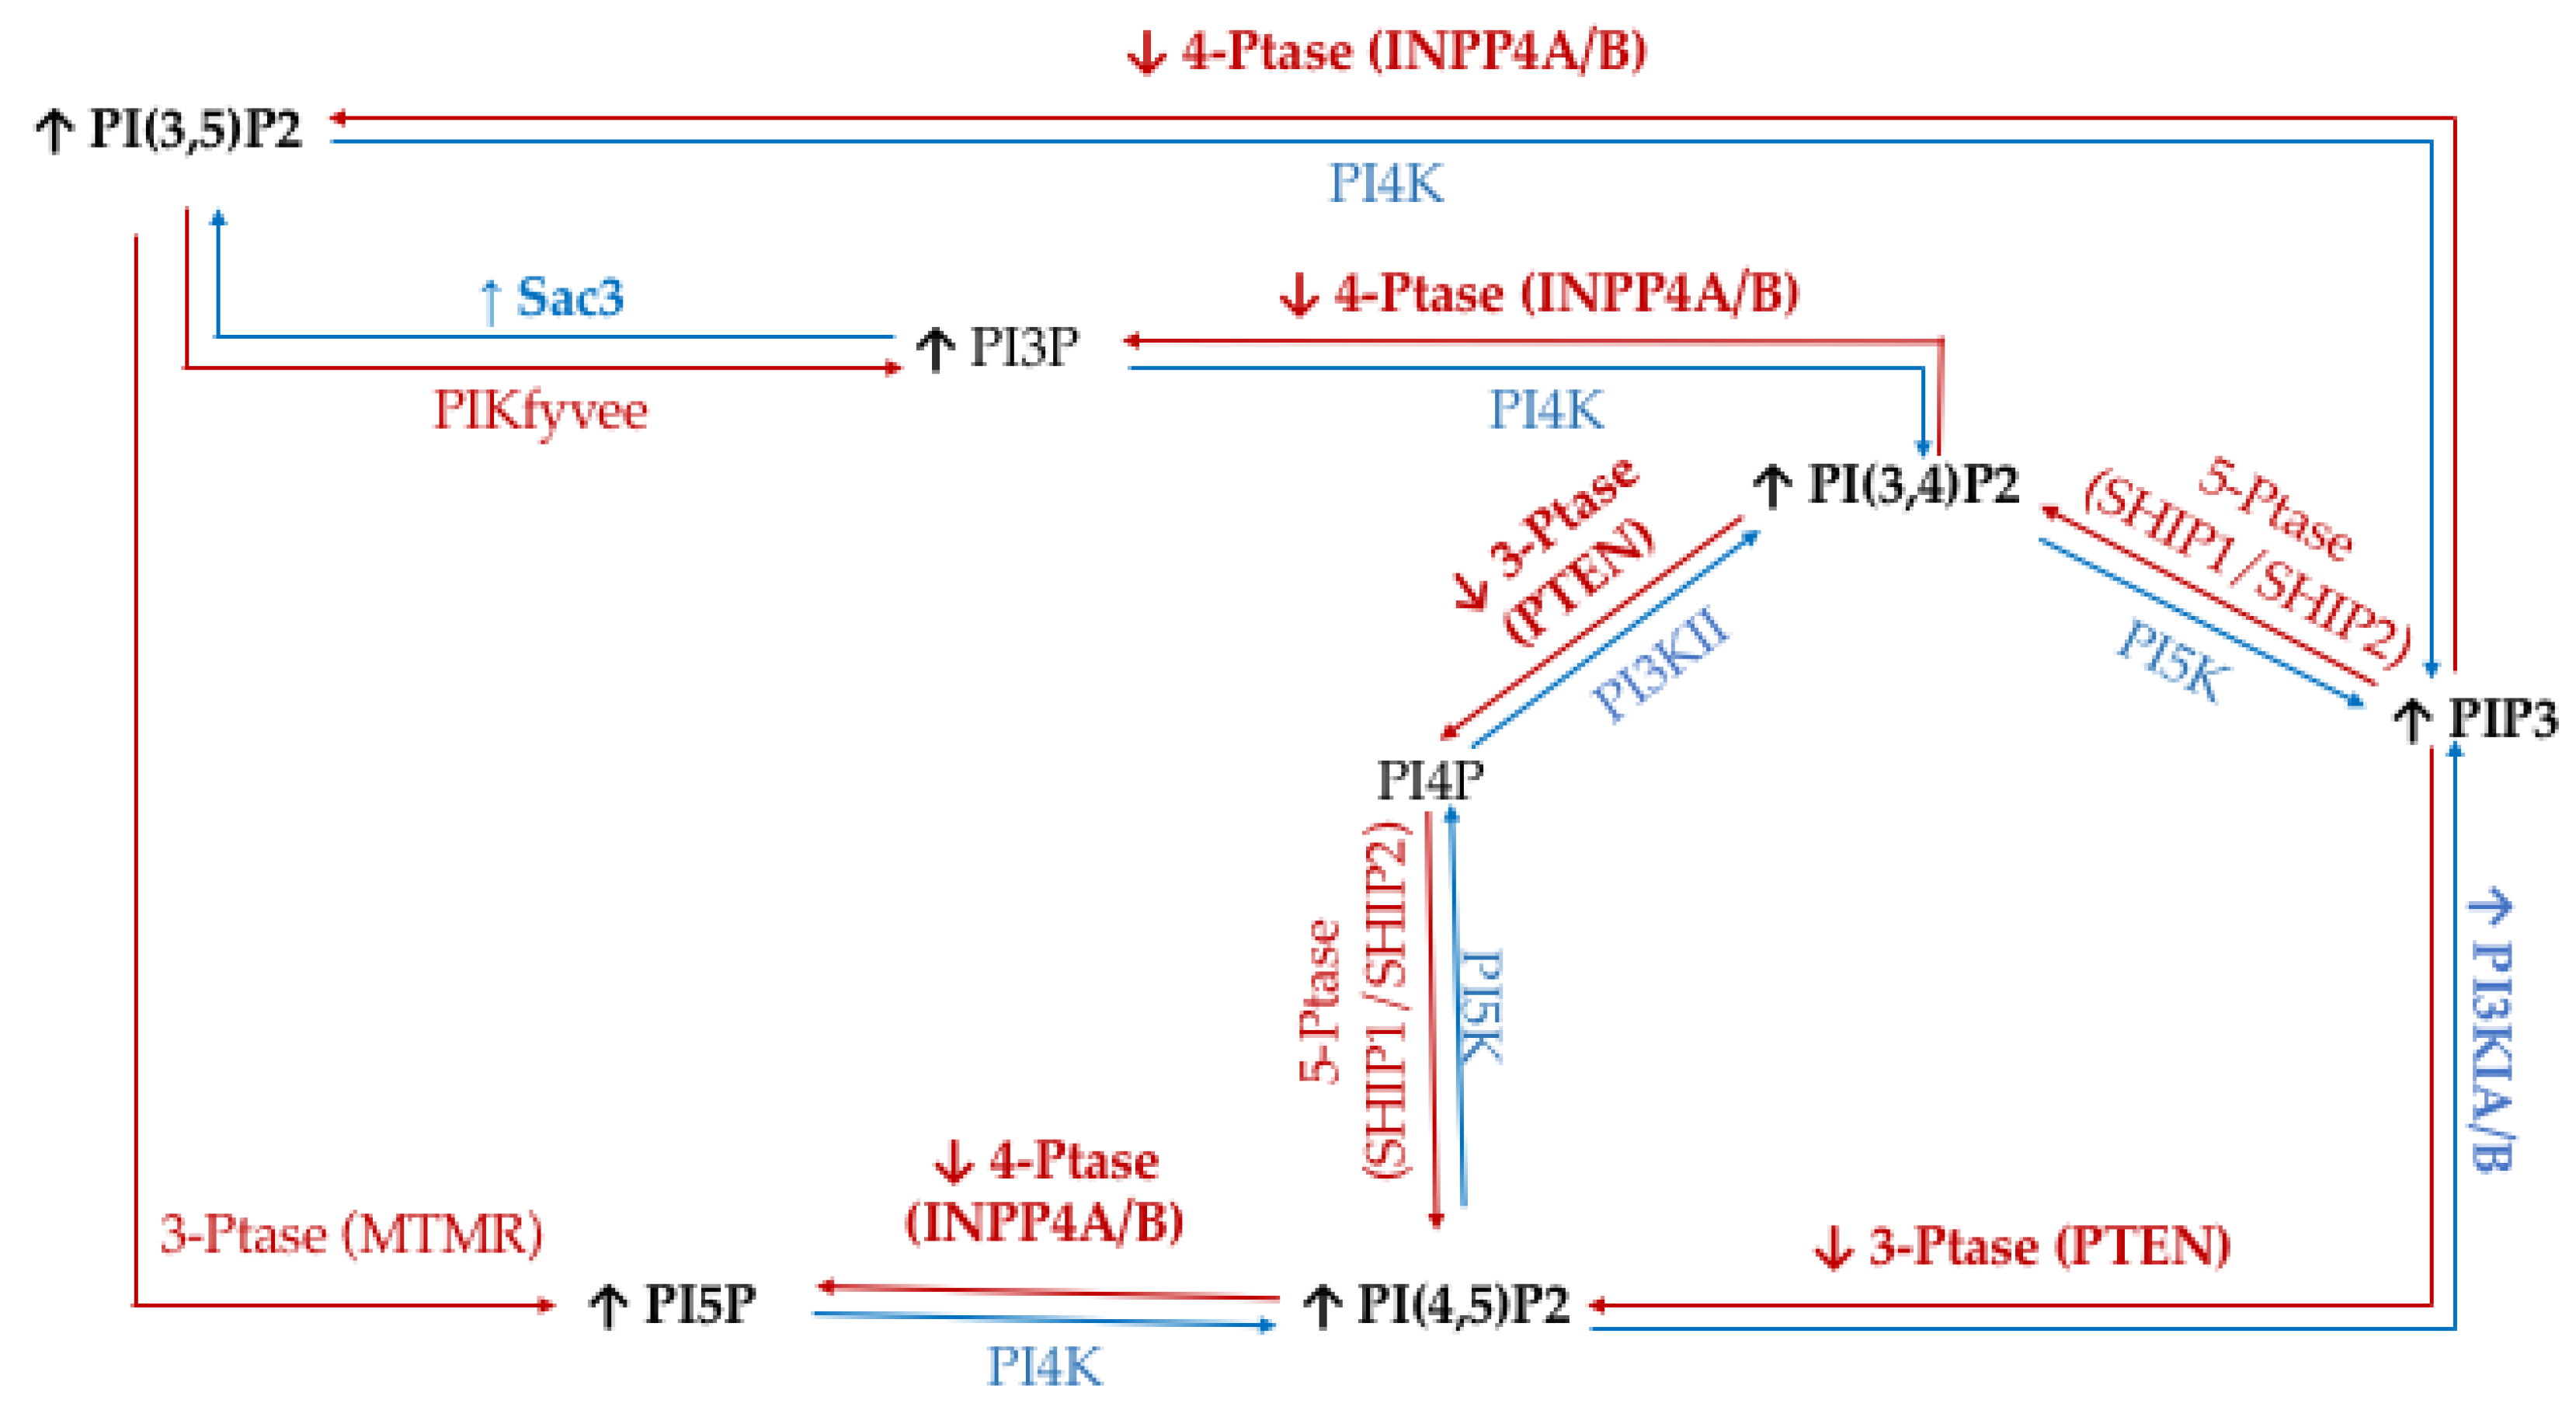
| Enzyme Type | Enzyme | Target | Product | Modulation of Function Found in Specific Cancers |
|---|---|---|---|---|
| Kinases | Class I PI3Ks | PI | PI3P (disfavored in vivo) | Amplification in 10% of breast cancer cases (increased activity) [41] mutated in ~40% of all breast cancers [42]. |
| PI4P | PI3,4P (disfavored in vivo) | |||
| PI(4,5)P2 | PIP3 (in vivo) | |||
| Class II and III PI3K (e.g., hVps34) | PI | PI3P | Involved in Golgi vesicular transport and lysosomes [43]. Produces endosomal PI3P. Promotes cell proliferation signaling [44]. | |
| PI4P | PI(3,4)P2 | |||
| type II/III family PI 4-kinases (PI4K) | PI | PI4P | Loss of PI4KIIα/β linked to triple negative breast cancer (TNBC) apoptosis [45]. PI4KIIIβ overexpression promotes proliferation signaling [46] and causes disruption of normal mammary duct formation [47]. | |
| PI 5-kinase (PI5K) | PI4P | PI(4,5)P2 | PIP5KI important for invadopodia formation [48] | |
| PIKfyve | PI | PI5P | Regulate the cell cycle via epidermal [49] growth factor receptor (EGFR), positive regulator of GLUT4 [28] trafficking. | |
| PI3P | PI(3,5)P2 | |||
| Phosphatases | Myotubularin family of phosphatases (e.g., MTMRs) | PI3P | PI | MTMR3 highly expressed in TNBC, promotes aggression [50]. |
| Sac1 | PI4P | PI | Knock-down induces epithelial to mesenchymal cell transition [51]. | |
| 3′-phosphatases (e.g., PTEN) | PI(3,4)P2 | PI4P | Mutated (loss of function) in late-stage tumors, tumor-suppressor [43,52,53]. | |
| PI(3,5)P2 | PI5P | |||
| PIP3 | PI(4,5)P2 | |||
| 4′-phosphatases (e.g., INPP4A and INPP4B) | PI(3,4)P2 | PI3P | Tumor suppressor in breast cancer [28]. | |
| PI(4,5)P2 | PI5P | |||
| PIP3 | PI(3,5)P2 | |||
| 5′-phosphatases (e.g., Synaptojanin-2, SHIP, OCRL, Sac3) Class I PI3Ks | PI(3,5)P2 | PI3P | Sac3 overexpressed in TNBC [53]. SHIP1/2 necessary for breast cancer invasion and metastasis [54]. Amplification in 10% of breast cancer cases (increased activity) [41] mutated in ~40% of all breast cancers [42]. | |
| PI(4,5)P2 | PI4P | |||
| PIP3 | PI(3,4)P2 |
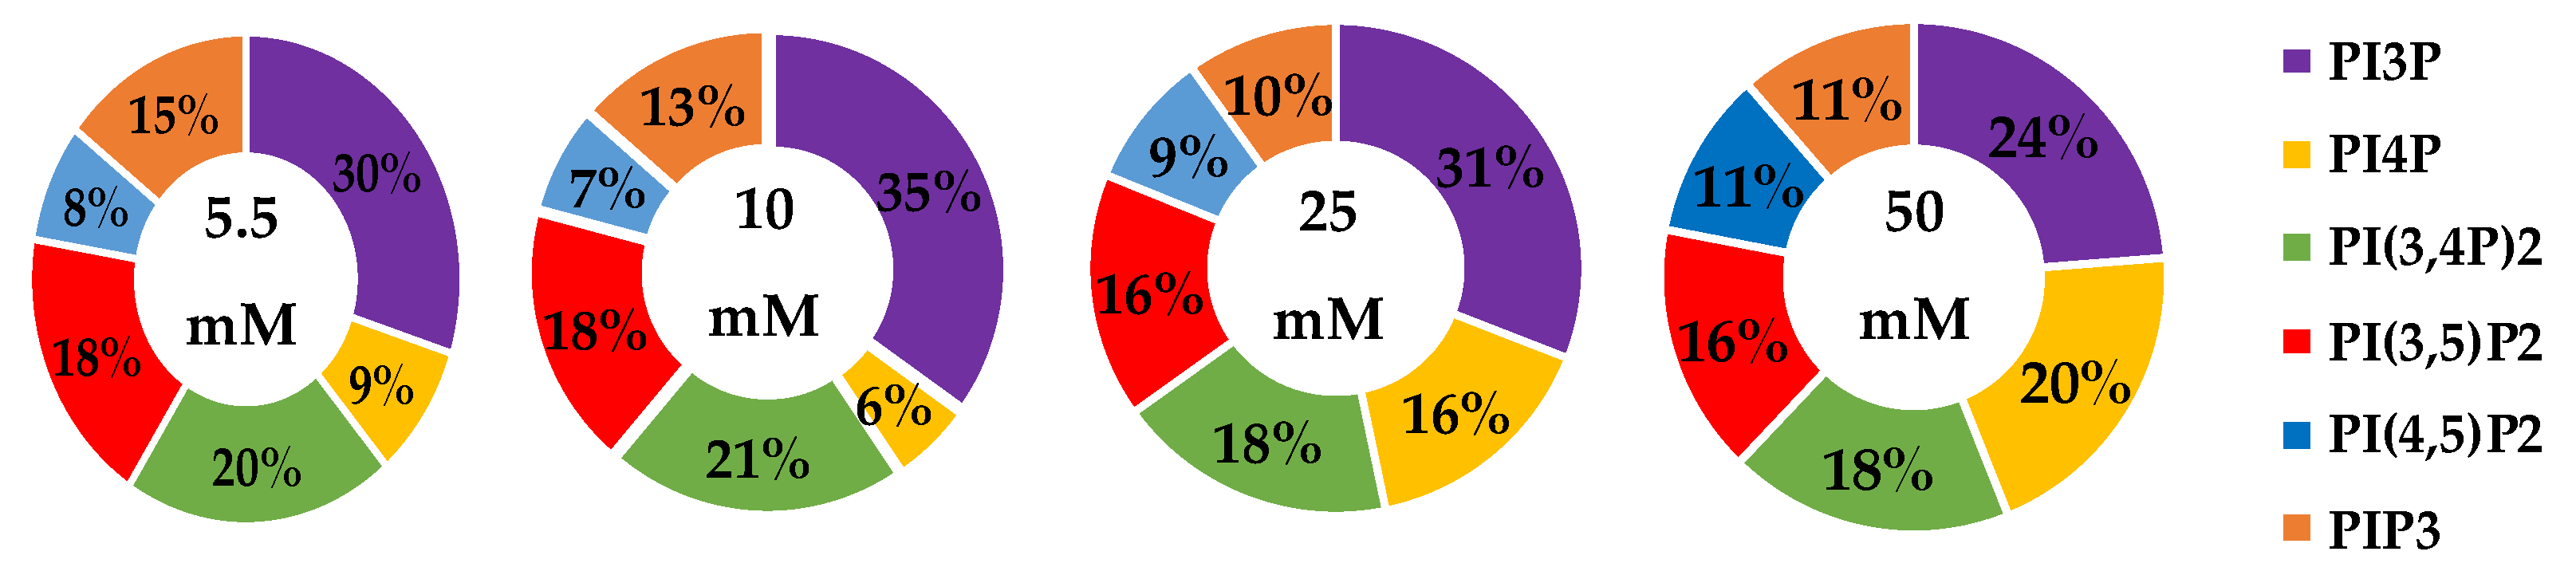
| Serum Glucose Concentration | PI3P | PI4P | PI(3,4)P2 | PI(3,5)P2 | PI(4,5)P2 | PIP3 | |
|---|---|---|---|---|---|---|---|
| 5.5 mM | Average % | 30 | 9 | 20 | 19 | 8 | 15 |
| Std. Error | 5 | 3 | 1 | 1 | 4 | 1 | |
| 10 mM | Average % | 35 | 6 | 21 | 18 | 7 | 14 |
| Std. Error | 5 | 3 | 1 | 1 | 4 | 1 | |
| Fold Change | 1 | 1 | 1 | 1 | 1 | 1 | |
| 25 mM | Average % | 31 | 16 * | 18 | 16 | 9 | 10 |
| Std. Error | 5 | 3 | 1 | 1 | 4 | 1 | |
| Fold Change | 1 | 2 | 1 | 1 | 1 | 1 | |
| 50 mM | Average % | 24 | 20 * | 18 | 16 | 11 | 11 |
| Std. Error | 5 | 3 | 1 | 1 | 4 | 1 | |
| Fold Change | 1 | 2 | 1 | 1 | 1 | 1 |
| Serum Glucose Concentrations | Fold Change | Ratio of PI3P:PI(3,4)P2:PIP3Expression | ||
|---|---|---|---|---|
| PI3P | PI(3,4)P2 | PIP3 | ||
| 5.5 mM | - | - | - | 1:1.11:1.17 |
| 10 mM | 0.80 ** | 1.2 ** | 1.1 | 1:1.20:1.40 |
| 25 mM | 0.79 ** | 1.3 ** | 0.98 | 1:1.30:1.30 |
| 50 mM | 0.85 ** | 1.4 ** | 0.86 ** | 1:1.42:1.27 |
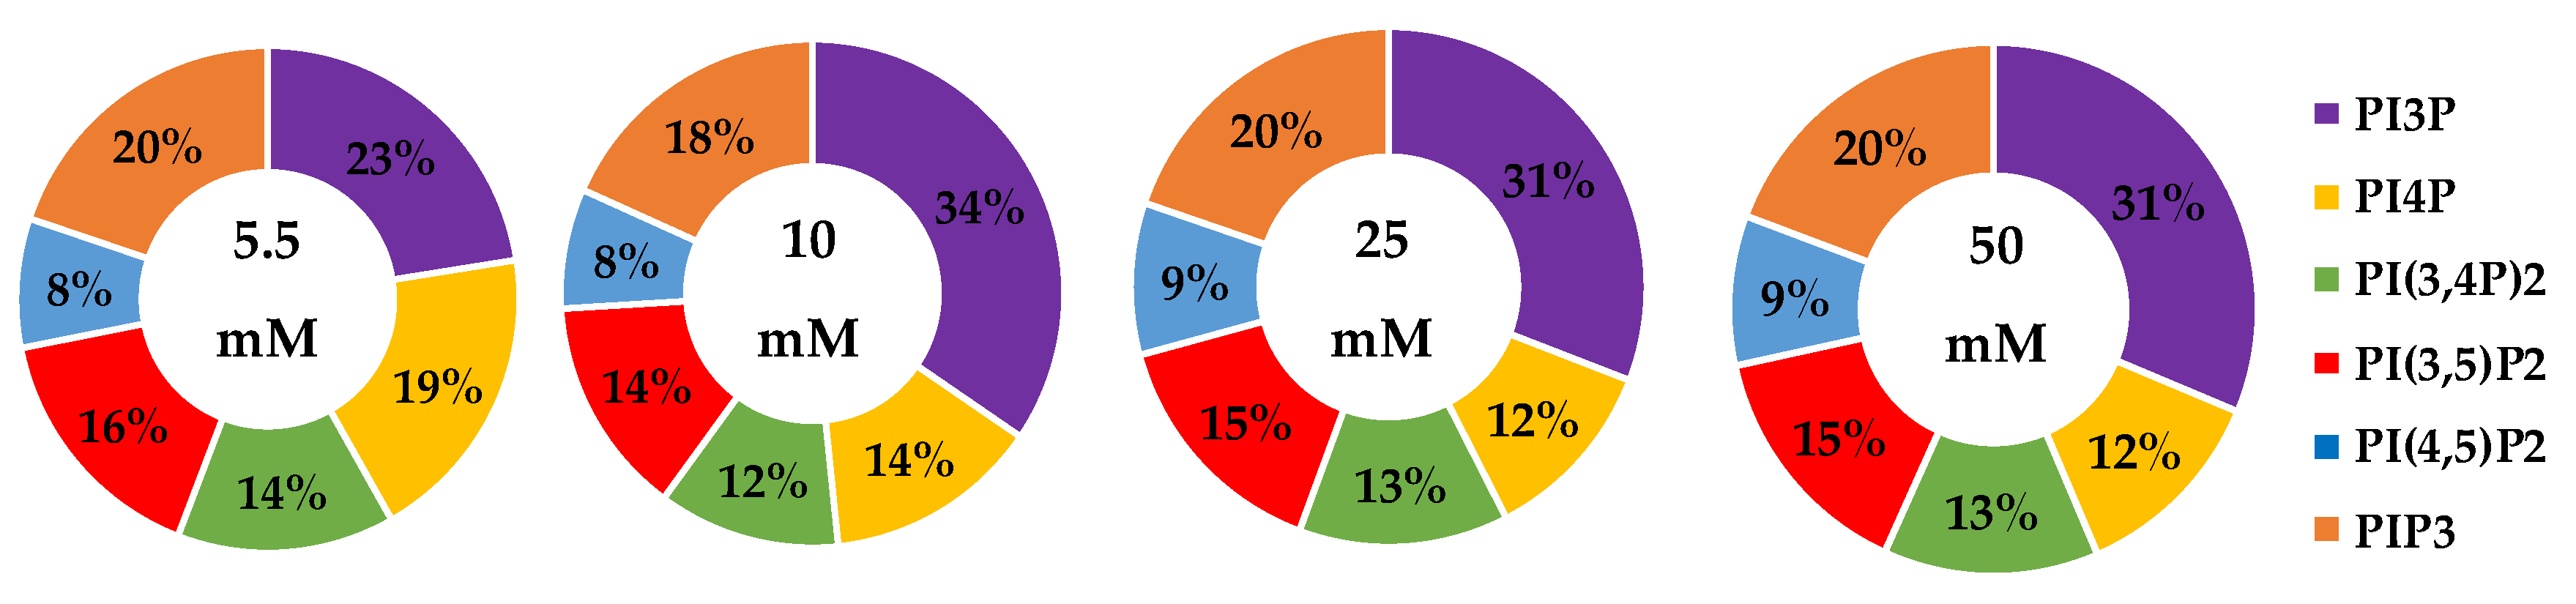
| Serum Glucose Concentration | PI3P | PI4P | PI(3,4)P2 | PI(3,5)P2 | PI(4,5)P2 | PIP3 | |
|---|---|---|---|---|---|---|---|
| 5.5 mM | Average % | 23 | 19 | 14 | 16 | 8 | 20 |
| Std Error | 4 | 1 | 2 | 2 | 1 | 3 | |
| 10 mM | Average % | 35 | 14 * | 12 | 14 | 8 | 18 |
| Std Error | 4 | 1 | 2 | 2 | 1 | 3 | |
| Fold Change | 2 | 1 | 1 | 1 | 1 | 1 | |
| 25 mM | Average % | 31 | 12 * | 13 | 15 | 9 | 20 |
| Std Error | 4 | 1 | 2 | 2 | 1 | 3 | |
| Fold Change | 1 | 1 | 1 | 1 | 1 | 1 | |
| 50 mM | Average % | 31 | 12 | 13 | 15 | 9 | 19 |
| Std Error | 4 | 1 | 2 | 2 | 1 | 3 | |
| Fold Change | 1 | 1 | 1 | 1 | 1 | 1 |
| Serum Glucose Concentrations | Fold Change | Ratio of PI3P:PI(3,4)P2:PIP3 Expression | ||
|---|---|---|---|---|
| PI3P | PI(3,4)P2 | PIP3 | ||
| 5.5 mM | - | - | - | 1:0.98:0.65 |
| 10 mM | 0.84 ** | 0.99 | 1.25 ** | 1:1.10:0.97 |
| 25 mM | 0.93 ** | 1.04 | 1.04 | 1:1.10:0.73 |
| 50 mM | 0.87 ** | 0.98 | 1.22 ** | 1:1.10:0.92 |
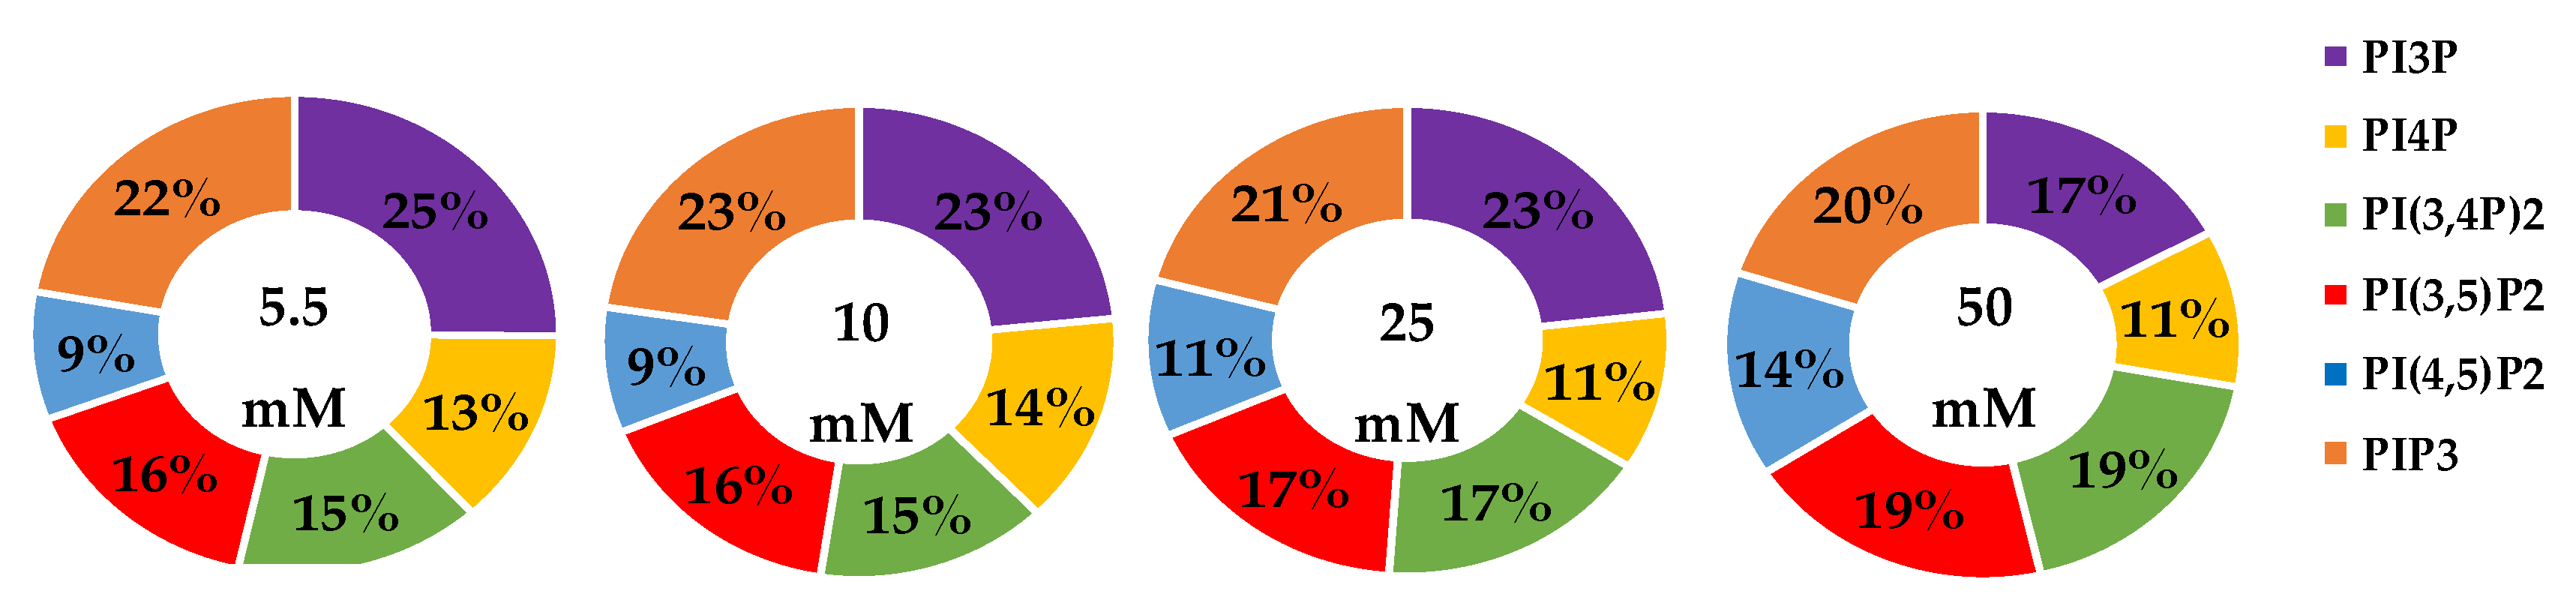
| Serum Glucose Concentration | PI3P | PI4P | PI(3,4)P2 | PI(3,5)P2 | PI(4,5)P2 | PIP3 | |
|---|---|---|---|---|---|---|---|
| 5.5 mM | Average % | 25 | 13 | 15 | 16 | 9 | 22 |
| Std Error | 3 | 2 | 2 | 1 | 3 | 1 | |
| 10 mM | Average % | 23 | 14 | 15 | 16 | 9 | 23 |
| Std Error | 3 | 2 | 2 | 1 | 3 | 1 | |
| Fold Change | 1 | 1 | 1 | 1 | 1 | 1 | |
| 25 mM | Average % | 23 | 11 | 17 | 17 | 11 | 21 |
| Std Error | 3 | 2 | 2 | 1 | 3 | 1 | |
| Fold Change | 1 | 1 | 1 | 1 | 1 | 1 | |
| 50 mM | Average % | 17 | 11 | 19 | 19 | 14 | 20 |
| Std Error | 3 | 2 | 2 | 1 | 3 | 1 | |
| Fold Change | 1 | 1 | 1 | 1 | 2 | 1 |
| Serum Glucose Concentrations | Fold Change | Ratio of PI3P:PI(3,4)P2:PIP3 Expression | ||
|---|---|---|---|---|
| PI3P | PI(3,4)P2 | PIP3 | ||
| 5.5 mM | - | - | - | 1:0.73:0.30 |
| 10 mM | 0.76 ** | 1.09 ** | 1.62 ** | 1:1.05:0.65 |
| 25 mM | 0.71 ** | 1.07 | 1.79 ** | 1:1.09:0.75 |
| 50 mM | 0.61 ** | 1.02 | 2.23 ** | 1:1.21:1.09 |
| Lipid | Cellular Localization | Attributed Process |
|---|---|---|
| PI3P | Apical membranes and microdomains of early endosome [43,81,82,83,84,85,86] | Proliferation |
| PI4P | Golgi apparatus [51,87,88,89,90] | Motility |
| PI(3,4)P2 | Plasma membrane apical membrane focal adhesions [91,92,93] | Motility |
| PI(4,5)P2 | Plasma Membrane apical polarity complexes, Invadopodia [30,87,88,94,95,96,97,98,99] | Motility |
| PI(3,5)P2 | Cytoplasm [100] | Motility |
| PIP3 | Cytoplasm and basolateral membranes [27,101,102,103] | Proliferation and motility |
© 2020 by the authors. Licensee MDPI, Basel, Switzerland. This article is an open access article distributed under the terms and conditions of the Creative Commons Attribution (CC BY) license (http://creativecommons.org/licenses/by/4.0/).
Share and Cite
Devanathan, N.; Jones, S.; Kaur, G.; Kimble-Hill, A.C. Using Phosphatidylinositol Phosphorylation as Markers for Hyperglycemic Related Breast Cancer. Int. J. Mol. Sci. 2020, 21, 2320. https://doi.org/10.3390/ijms21072320
Devanathan N, Jones S, Kaur G, Kimble-Hill AC. Using Phosphatidylinositol Phosphorylation as Markers for Hyperglycemic Related Breast Cancer. International Journal of Molecular Sciences. 2020; 21(7):2320. https://doi.org/10.3390/ijms21072320
Chicago/Turabian StyleDevanathan, Nirupama, Sandra Jones, Gursimran Kaur, and Ann C. Kimble-Hill. 2020. "Using Phosphatidylinositol Phosphorylation as Markers for Hyperglycemic Related Breast Cancer" International Journal of Molecular Sciences 21, no. 7: 2320. https://doi.org/10.3390/ijms21072320
APA StyleDevanathan, N., Jones, S., Kaur, G., & Kimble-Hill, A. C. (2020). Using Phosphatidylinositol Phosphorylation as Markers for Hyperglycemic Related Breast Cancer. International Journal of Molecular Sciences, 21(7), 2320. https://doi.org/10.3390/ijms21072320