Abstract
Nitrogen (N) is essential for plant growth and crop productivity. Organic N is a major form of remobilized N in plants’ response to N limitation. It is necessary to understand the regulatory role of N limitation adaption (NLA) in organic N remobilization for this adaptive response. Transcriptional and proteomic analyses were integrated to investigate differential responses of wild-type (WT) and nla mutant plants to N limitation and to identify the core organic N transporters targeted by NLA. Under N limitation, the nla mutant presented an early senescence with faster chlorophyll loss and less anthocyanin accumulation than the WT, and more N was transported out of the aging leaves in the form of amino acids. High-throughput transcriptomic and proteomic analyses revealed that N limitation repressed genes involved in photosynthesis and protein synthesis, and promoted proteolysis; these changes were higher in the nla mutant than in the WT. Both transcriptional and proteomic profiling demonstrated that LHT1, responsible for amino acid remobilization, were only significantly upregulated in the nla mutant under N limitation. These findings indicate that NLA might target LHT1 and regulate organic N remobilization, thereby improving our understanding of the regulatory role of NLA on N remobilization under N limitation.
1. Introduction
Nitrogen (N) is a macronutrient essential for plant growth and seed yield. To achieve a high seed yield, a large quantity of chemical N fertilizers is applied to crop fields. China is the largest N-consuming country in the world, accounting for up to one-third of the world’s N consumption [1]. However, the average N use efficiency (NUE) in China is approximately 30%, which is considerably less than that in other developed countries [2]. Excessive N application results in numerous environmental problems, including ecosystem saturation, global warming, and water pollution [3]. Exploiting the maximum potential of chemical fertilizers by improving the NUE is important for sustainable agriculture and environmental protection [4,5]. In order to adapt to variations in N availability in soils, plants have evolved multiple strategies, which include different N uptake systems and N remobilization.
Nitrate (NO3−) is the main N source for upland plants, and it also functions as a signal molecule [6]. Four NO3− transporters, namely NO3− transporter 1 and 2 (NRT1 and NRT2), chloride channel (CLC), and slow-type anion channel (SLAC1/SLAH), have been reported to be responsible for NO3− uptake and remobilization [7]. Once absorbed by the roots, NO3− can be either stored in the root vacuole or assimilated into amino acids via the nitrate reductase (NR)-glutamine synthetase (GS)/glutamate synthase (GOGAT) pathway; however, most NO3− can be loaded into xylem vessels and transported to the shoot, and this process is essential for plant growth [8]. NO3− remobilization in plants involves both short- and long-distance distribution. The CLC gene family regulates short-distance NO3− distribution between the cytoplasm and vacuole. In Arabidopsis thaliana, AtCLCa was initially identified as a 2NO3−/1H+ antiporter and the NO3− content was reduced by approximately 50% in the Atclca mutant [9], although NUE was shown to increase significantly in the Atclca-2 mutant compared with the wild-type (WT) plants [8,10]. Long-distance NO3− distribution is coordinated and regulated by members of the NRT1 gene family, and, in A. thaliana, AtNRT1.5/AtNPF7.3, which is mainly expressed in root pericycle cells near the xylem, is responsible for NO3− loading. Consistently, less NO3− was detected in the xylem sap and shoot of the nrt1.5 mutant [11]. In contrast to AtNRT1.5/AtNPF7.3, AtNRT1.8/AtNPF7.2, which is mainly expressed in xylem parenchyma cells in the vasculature, participates in NO3− unloading; accordingly, a higher NO3− shoot/root (S/R) ratio was observed in the nrt1.8 mutant [12]. Thus, AtNRT1.5 and AtNRT1.8 control the proportion of NO3− distributed to the shoot and play important roles in improving the NUE of plants [8]. The gene pair AtNRT1.7/AtNPF2.13 is expressed in parenchyma cells of leaf phloem, and it regulates NO3− remobilization from old to young leaves [13].
The N limitation adaption (NLA) protein, a RING-type E3 ubiquitin ligase, regulates proteolysis, and it is essential for maintaining nutrient homeostasis in plants [14,15]. This protein was first isolated from an A. thaliana mutant that failed to develop essential adaptive responses to N limitation [16]. Additionally, NLA is involved in the accumulation of salicylic acid and responsible for immune responses [17]. It plays an important role in the regulation of inorganic phosphate (Pi) homeostasis, but not N homeostasis, as early senescence in nla mutants was caused by Pi toxicity [18]. However, Liu et al. [19] observed that the 15NO3− isotope spotted on old leaves preferentially accumulated in the youngest leaves of the nla mutant. Under N-limited conditions, NLA transcripts remained unchanged; however, the NLA protein abundance substantially decreased after N limitation, indicating that regulation occurs mainly at the translational level. It was also found that NRT1.7 can be degraded by NLA, which regulates NO3− remobilization from sources to sinks via the ubiquitin-mediated post-translational regulatory pathway [19]. Moreover, the genes involved in proteolysis, N transportation, and anthocyanin synthesis were upregulated in the nla mutant [20]. However, the fundamental function of NLA in the regulation of N homeostasis requires further investigation.
Although NO3− remobilization regulated by the miR827-NLA-NRT1.7 pathway certainly contributes to the source to sink distribution, NO3− generally remains at a low level (relative to the total N) in plants [21]. Up to 75% of the absorbed N is stored in chloroplastic proteins and in ribulose-1,5-bisphosphate carboxylase/oxygenase [22]. Although proteolysis and amino acid remobilization are likely to be predominant in N remobilization [7,22], it remains unclear which amino acid transporters can be poly-ubiquitinated by NLA. It has been shown that NLA interacts with ORE1 (ANAC092) in the nucleus and regulates its stability through poly-ubiquitination, which determines leaf senescence during N deficiency [23]. These findings suggest that the ubiquitination degradation substrate of NLA is not specific [19].
In the present study, we (i) examined the different physiological responses of WT and nla mutant plants to N limitation, (ii) conducted transcriptional and proteomic profiling to reveal the molecular strategies of N limitation adaptation, and (iii) proposed a core targeting substrate for NLA, which is involved in the efficient remobilization of organic N nutrients. Thus, the present results will provide baseline information on efficient N remobilization from sources to sinks in response to N limitation that can be used for the genetic improvement of NUE in plants.
2. Results
2.1. Differential Physiological Responses of the WT and nla Mutant Plants to N Limitation
We investigated the physiological responses of the WT and nla mutant plants grown hydroponically under high (HN, 4.5 mM) and low (LN, 0.30 mM) NO3− conditions. After 10 d of growth under HN, the plants were transferred to the LN for 3 d. Under N-sufficient conditions, the WT and nla mutant performed similarly, showing similar chlorophyll and anthocyanin content (Figure 1A–C). Nitrogen limitation resulted in decreased chlorophyll content and induced anthocyanin accumulation in both WT and nla mutant (Figure 1B,C). However, compared with the WT, the nla mutant showed lower chlorophyll and anthocyanin content (Figure 1B,C) and presented hypersensitivity to N limitation (Figure 1A). Although the nla mutant displayed an early senescence phenotype induced by N limitation, the total N absorbed by these plants was not significantly different from that absorbed by the WT under both HN and LN conditions (Figure 1D).
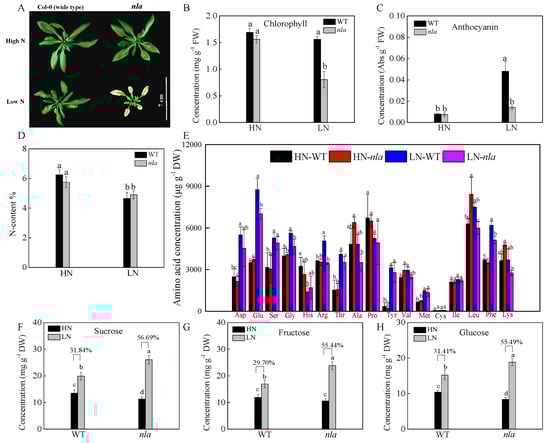
Figure 1.
Physiological responses to N limitation in the wild-type (WT) and N limitation adaption (nla) mutant. The WT and nla mutant plants were grown hydroponically under 4.5 mM NO3− (HN) for 10 d and then exposed to 0.3 mM NO3− (LN) for 3 d, the rosette leaves were sampled for the following assays. (A) The phenotype of the WT and nla under HN and LN conditions, bar scale = 7 cm, (B) leaf chlorophyll concentration, (C) leaf anthocyanin concentration, (D) N content (N%) of the whole plants, (E) amino acid concentration in the leaves, (F–H) concentrations of sucrose (F), fructose (G), and glucose (H) in leaves. The presented data are the means ± SE of three independent biological replicates. The different letters at the top of the histogram bars denote significant differences at p < 0.05.
To survive under N-limited conditions, plants tend to remobilize N from old leaves to young organs [24]. We further investigated the content of 17 amino acids in the WT and nla mutant plants under the two contrast N conditions. Under the N-sufficient conditions, no significant difference was observed between the WT and nla mutant, but N limitation increased amino acids in both the WT and nla mutant, probably via the induction of protein degradation. Moreover, the WT plants had more amino acids in the rosette leaves than the nla mutant plants (Figure 1E). Low N availability restricted amino acid biosynthesis, which resulted in an increase in organic acids available for sugar synthesis [25,26]. Sucrose, fructose, and glucose accumulated considerably in the WT under N-limited conditions, increasing by 31.84%, 29.70%, and 31.41%, respectively (Figure 1F–H). However, when compared with WT, sucrose, fructose, and glucose in the nla mutant increased by 56.69%, 55.44%, and 55.49% under N-limited conditions, respectively. The nla mutant accumulated more sugar than the WT under N limitation, which might be due to lower N availability initially. These data suggested that the nla mutant was more sensitive to N limitation, as indicated by early leaf senescence.
2.2. Transcriptional Profiling Reveals Different Responses to N Limitation between the WT and nla Mutant Plants
The nla mutant showed greater hypersensitivity to N limitation than the WT (Figure 1). To further examine this discrepancy, we compared the transcript abundance of the N limitation-repressed genes involved in photosynthesis, protein synthesis, and degradation [20]. Nitrogen limitation repressed all genes involved in photosynthesis in both WT and nla mutant, and 10 consistently repressed genes are listed in Table 1. Compared with N-sufficient conditions, the expression of these 10 genes decreased by 1.9- to 3.74-fold and 2.75- to 8.01-fold in the WT and nla mutant under N-limited conditions, respectively (Table 1). Nitrogen is a critical component for protein synthesis, and protein synthesis will likely be constrained by N limitation [24]. Indeed, N limitation decreased the expression of all genes involved in protein synthesis in both WT and nla mutant [20]; 16 consistently repressed genes are listed in Table 1. Compared with N-sufficient conditions, the expression of these 16 genes decreased by 1.99- to 4.87-fold and 3.16- to 7.45-fold in the WT and nla mutant under N-limited conditions, respectively (Table 1).

Table 1.
Genes involved in photosynthesis, protein synthesis and degradation in the WT and nla mutant under N-limited conditions a.
To survive under N-limited conditions, plants tend to degrade proteins in mature leaves and export the resulting amino acids to young organs [24]. We compared the fold-change in proteolytic-associated genes induced by N limitation in both WT and nla mutant; our results revealed changes that ranged from 2.20- to 13.36-fold in the nla mutant, which was considerably higher than that in the WT (2.04- to 7.48-fold). Moreover, compared with N-sufficient conditions, nine genes responsible for N uptake and transport were significantly upregulated by 2.07- to 18.65-fold in the nla mutant under N limited conditions, but showed no significant change in the WT (Table 2). Specifically, AtLHT1 and AtLHT7, responsible for lysine and histidine transport, were significantly upregulated by more than 15-fold. Additionally, AtCAT1, a cationic amino acid transporter, was upregulated by 6.21-fold, and AtPUT2/AtPQR2, belonging to the amino acid permease family, was upregulated by 2.93-fold. The expression of AtAAP4 and AtAAP1 was upregulated by 2-fold. In addition to the genes involved in amino acid transport, AtAMT1.1 and AtAMT2, responsible for N uptake, were significantly upregulated in the nla mutant under N limited conditions. These data suggested that the mutation in NLA results in severe protein degradation and rapid N remobilization under N-limited conditions, which led, partially, to the early senescence of the nla mutant.
Table 2.
Comparison of the genes involved in N metabolism and transport, senescence, and anthocyanin synthesis in the WT and nla mutant under N-limited conditions a.
Previous studies have demonstrated that N limitation induces anthocyanin over-accumulation [20]. Many genes, including PAL, CHS, F3R, DFR, CL3, and ANS, regulate anthocyanin formation, and most of them were upregulated by N limitation in both WT and nla mutant plants (Table 2). Additionally, MYB, a transcription factor, is reported to play a negative role in the regulation of anthocyanin synthesis under N limitation [27,28,29]. The changes in the expression of four MYB transcription factors between the two N conditions were investigated. MYB90 was upregulated by 29.11- and 35.98-fold in the WT and nla mutant, respectively; N limitation specifically induced MYB2 by 24.55-fold in the nla mutant, whereas the expression of MYB75 and MYB32 was upregulated in the WT under N-limited conditions. Despite the significant upregulation of the genes responsible for anthocyanin production, the nla mutant failed to accumulate anthocyanin and acclimate to N limitation, presenting early leaf senescence (Figure 1). The transcriptomic profiling showed that senescence-associated genes were significantly upregulated in the nla mutant (Table 2).
2.3. iTRAQ Data Analysis and Protein Identification in the nla Mutant and WT under N-Sufficient and N-Limited Conditions
The NLA protein is a RING-type E3 ubiquitin-ligase responsible for proteolysis [14,15]. To further investigate protein changes in the nla mutant under N limitation, proteomic sequencing based on the iTRAQ technology was performed. A total of 237,353 spectra, 38,790 peptides, and 30,329 unique peptides were identified (Figure S1A). Furthermore, 6513 proteins were detected by at least one unique peptide (Figure S1A). The molecular weight of the identified proteins ranged from 1.74 to 609.09 kDa (Figure S1B), where proteins of 20–30 and 30–40 kDa were the most abundant, followed by proteins of 40–50, 10–20, and 50–60 kDa (Figure S1B). The protein number decreased with the coverage of the molecular weight. The isoelectric points of the identified proteins were 5–10 (Figure S1C). Most of the identified proteins contained less than 10 peptides, and fewer proteins were detected as the number of peptides increased (Figure S1D). To evaluate the reliability of the protein quantification data, the peptide ion scores were calculated. Over 78% of the identified proteins had a score of more than 20 points and the median score was greater than 33, which indicated that the iTRAQ data were reliable (Figure S2).
To investigate the proteins responsive to N limitation, we performed a volcano plot analysis (Figure 2) using the fold-change and p-values from pairwise comparisons between the nla mutant and WT under N-limited conditions. The black dots indicate the proteins with no significant change, the red dots represent the DEPs with a fold-change of >1.5 and p < 0.05, and the green dots represent the DEPs with a fold-change of <0.7 and p < 0.05. Under N-sufficient conditions, most proteins showed no significant change between the nla mutant and WT, and only 11 proteins were identified as DEPs. Among them, two DEPs were significantly upregulated whereas nine DEPs were significantly downregulated (Figure 2A). However, 618 proteins exhibited significant changes in the nla mutant under N-limited conditions when compared with the WT (Figure 2B), suggesting that N limitation significantly altered protein expression in the nla mutant. Specifically, 347 proteins were significantly upregulated and 271 were downregulated in the nla mutant compared with the WT under N-limited conditions (Figure 2B).
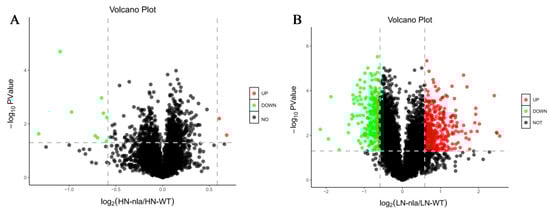
Figure 2.
Differentially expressed proteins (DEPs) of nla vs. WT under N-sufficient and N-limited conditions. (A) DEPs of nla vs. WT plants under N-sufficient conditions. (B) DEPs of nla vs. WT plants under N-limited conditions. The circles in the volcano plot represent the DEPs, the black ones indicate the DEPs with no significance, the red ones indicate significantly upregulated DEPs, and the green ones indicate significantly downregulated DEPs. The dash line indicate the fold change equal to 1.5.
2.4. Functional Analysis of the DEPs in Response to N Limitation
The 618 DEPs were classified into three major categories based on gene ontology (GO) enrichment analysis, namely, biological process, molecular function, and cellular component (Figure 3A). In the biological process category, the response to biotic stimulus process was the most represented term with 34 DEPs, followed by the response to other organism process (42.06%) and response to external biotic stimulus (Figure 3A). In addition, there were 30 and 27 DEPs enriched in the photosynthesis and defense response to other organism process, respectively. Structural molecule activity and structural constituent of ribosome were the two most enriched terms under the molecular function category, with 785 (45.48%) and 778 (45.08%) DEPs, respectively (Figure 3A). In the cellular component category, most DEPs were involved in thylakoid, ribosome, photosynthetic membrane, thylakoid part (30.48%), and thylakoid membrane (Figure 3A).
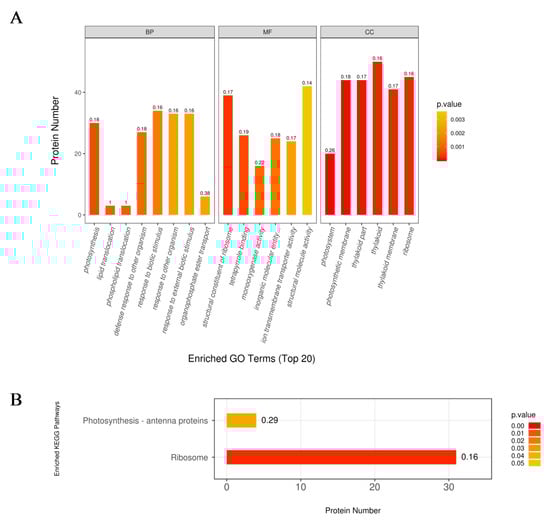
Figure 3.
The gene ontology (GO) (A) and Kyoto Encyclopedia of Genes and Genomes (KEGG) (B) enrichment analysis of the upregulated proteins in the nla vs. WT comparisn under the N-limited conditions. The numbers above the bar-plot are rich factors, which represent the proportion of the DEPs relative to the total proteins identified in the specific pathway.
To further investigate key metabolic pathways that the DEPs expressed under N limitation are involved in, the Kyoto Encyclopedia of Genes and Genomes (KEGG) pathway enrichment analysis was performed with the 816 DEPs expressed under N-limited conditions. The results showed that the 618 DEPs were enriched in 73 metabolic pathways. Additionally, two pathways were highly enriched, the ribosome pathway was the most represented with approximately 31 DEPs (Figure 3B), and followed by photosynthesis antenna with four DEPs (Figure 3B).
2.5. N Limitation Represses Proteins Responsible for Photosynthesis and Protein Synthesis and Induced Proteins Related to Proteolysis and N Transport
Transcriptional analysis has revealed that N limitation repressed the genes involving in photosynthesis, protein synthesis, but induced the genes involved in protein degradation and N transport. We also investigated the response of these proteins responding to N limitation. As shown in Table 3, the DEPs involving in photosynthesis were downregulated by 1.51- to 2.46-fold under N limitation. Moreover, two DEPs contributing to chlorophyll biosynthesis were significantly repressed by N limitation, suggesting that N limitation severely affected the function of these proteins in photosynthesis (Table 3). Moreover, the DEPs related to protein synthesis and folding were downregulated by 1.51- to 1.90-fold under N limitation. Additionally, proteolysis-associated proteins were significantly upregulated, whereas the proteins involved in the ubiquitination pathway were repressed, likely due to the mutation in NLA (Table 4). The proteomic sequencing results showed that the nitrate transporters NRT1 and NAR2.1/NRT3.1 were upregulated by 1.81- and 2.85-fold, respectively, under N limitation. Two key enzymes, nitrate reductase and nitrite reductase, were significantly upregulated by N limitation, whereas GS, GDH1, and GDH2 were downregulated (Table 4). Additionally, LHT1, responsible for amino acid transport, was upregulated by 2.09-fold under N limitation (Table 4).
Table 3.
Differentially expressed proteins involving photosynthesis and chlorophyll biosynthesis and organization pathways in the nla vs. WT comparison under N limited conditions a.
Table 4.
Differentially expressed proteins involving in protein synthesis, protein degradation, and N metabolism and transport in the nla vs. WT comparison under N limited conditions a.
2.6. LHT1, Responsible for Amino Acid Transport, Was the Sole Gene Identified Both in Transcriptional and Proteomic Profiling
Both the transcriptional and proteomic analysis revealed that N limitation repressed the genes responsible for photosynthesis and protein synthesis and induced genes related to proteolysis and N transport (Table 1, Table 2, Table 3 and Table 4). In order to further investigate the identical genes identified both in transcriptional and proteomic analysis under N limitation, we listed the consistent genes in Table 5. The results showed that there were 49 genes identified both in transcriptional and proteomic analysis, which can be classified into four categories: (i) the genes both upregulated in transcriptome and proteomics analysis, (ii) the genes both downregulated in transcriptome and proteomics analysis, (iii) the genes upregulated in transcriptome but downregulated in proteomics analysis, and (iv) the genes downregulated in transcriptome but upregulated in proteomics analysis. The four categories accounted for 57.14%, 34.69%, 6.12%, and 2.04% of the total genes, respectively (Table 5). The fold change of nine proteins were significantly upregulated by more than 2-fold. When investigating the fold changes of the nine genes in the transcriptional data, we observed that the fold changes of AT2G43510, At4g16260, AT5G40780, and AT1G02920 were significantly upregulated by 10-fold. Among the four genes, we observed that LHT1 (AT5G40780) was the sole gene that was responsible for amino acid transport identified in transcriptional and proteomic profiling.
Table 5.
The identical members from transcriptional and proteome analysis.
2.7. Transcriptional Expression Patterns of Genes Regulated by NLA under N Limitation
The nla mutant was more sensitive to N limitation than the WT, showing an early senescence phenotype (Figure 1). It is reported that RNS3, SAG29, and VIN2 play important roles in the regulation of leaf senescence [30,31,32]. Moreover, ORE1 is reported to act downstream of NLA, contributing to the regulation of leaf senescence [23]. To reveal further differences in the expression of the genes encoding these proteins between the WT and nla mutant, we conducted the transcriptional analysis. The expression of these genes was considerably increased in the nla mutant under N limitation only (Figure 4A). In addition, N limitation significantly induced the expression of genes involved in anthocyanin production (Table 2). The expression of MYB2, MYB75, and MYB90 was upregulated in both WT and nla mutant under N limitation; however, the transcripts of these genes were considerably higher in the nla mutant (Figure 4B). NRT1.7 can be degraded by NLA and mediates NO3− remobilization from the sinks to source tissues [19]. Under N limitation, the relative expression of NRT1.7 significantly increased in the nla mutant (Figure 4C). Moreover, the transcriptomic and proteomic profiling analyses revealed that LHT1 was significantly upregulated in the nla mutant under N limitation (Table 2 and Table 4). We also observed that the relative expression of LHT1 considerably increased in the nla mutant under N limitation (Figure 4C), suggesting that LHT1 might be targeted by NLA and mediate N remobilization.
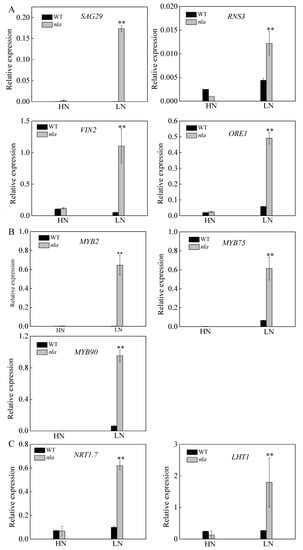
Figure 4.
Relative expression of the genes involved in leaf senescence, MYB family, and N transport in the WT and nla mutant responding to N limitation. Relative expression levels of senescence-associated genes (A), MYB transcription factors (B), genes involved in N transport (C), as revealed by the q-PCR assays. For the N-limited treatment, the Arabidopsis seedlings were first grown under 4.5 mM NO3− for 10 d, and then transferred to a solution containing 0.3 mM NO3− for 3 d. Bars indicate the standard deviation (SD) of three biological replicates, **p < 0.01.
3. Discussion
3.1. Differential Physiological and Molecular Responses of WT and nla Mutant Plants under N Limitation
N availability plays an important role in the regulation of plant growth and productivity. Under N limitation in the soil, plants evolve adaptive responses to cope with the fluctuating environment [33]. Physiological adaptive responses to N limitation include the reduction of plant growth and photosynthesis (Figure 1A,B). Approximately 80% of the total leaf N is stored in the chloroplasts mainly in the form of proteins, which are an important N pool for N remobilization [34]. The chlorophyll content was decreased both in the WT and nla mutant plants while acclimating to N limitation (Figure 1B). Moreover, all of the genes involved in chlorophyll formation and photosynthesis were downregulated by N limitation [20], the fold-change of which was higher in the nla mutant (Table 1 and Table 3), indicating it was more sensitive to N limitation. Furthermore, N limitation induced anthocyanin accumulation, which acts as a light-protecting pigment for N-deficient plants, preventing photo inhibition damage caused by N limitation [35,36]. While the WT plants accumulated a large quantity of anthocyanin under N limitation, the nla mutant lacked this adaptive response (Figure 1C). Transcription profiling analysis revealed that genes responsible for anthocyanin synthesis were upregulated under N limitation in both the WT and the nla mutant (Table 2), although there were few changes in anthocyanin accumulation in the nla mutant under N limitation (Figure 1C). The MYB transcription factors, particularly MYB75 and MYB90, play a positive role in the regulation of anthocyanin synthesis [27,28,29], which were markedly induced by N limitation in the WT, while MYB90 was upregulated in the nla mutant (Table 2). MYB2, a transcriptional repressor, functions in the negative regulation of anthocyanin biosynthesis [37] and it increased approximately 24-fold under N limitation in the nla mutant (Table 2). The relative expression level of MYB2 also increased markedly in the nla mutant under N limitation (Figure 4B). Thus, MYB2 might be targeted by NLA and play a key role in the regulation of anthocyanin biosynthesis in response to N limitation.
Despite of the lack of anthocyanin accumulation under N limitation, the nla mutant showed early senescence of the rosette leaves compared with the WT (Figure 1A). Leaf senescence is a genetically programmed developmental process that is regulated by the senescence-associated genes [38]. Several senescence-associated genes were upregulated in the nla mutant under N limitation only (Table 2), which was consistent with the q-PCR results (Figure 4A). Moreover, leaf senescence is associated with protein degradation, which is an adaptive response to N limitation [21]. Genes and enzymes involved in protein degradation were upregulated by N limitation in the WT and nla mutant, leading to an increase in the free amino acid content (Figure 1E). However, the fold change of these genes was much higher in the nla mutant (Table 2 and Table 4), indicating that more sequestered N was released from source tissues via protease activities during leaf senescence in the nla mutant. However, the nla mutant had a lower amino acid content than the WT under N limitation, which might be due to the excessive remobilization of the amino acid. Transcriptomic data revealed that six genes coding for amino acid transporters were markedly increased in the nla mutant (Table 2). These data suggested excessive proteolysis and N remobilization in the nla mutant, leading to its early senescence.
3.2. Amino Acid Transporters May Be Involved in Efficient N Remobilization Mediated by NLA
N is an essential plant macronutrient and its starvation induces early leaf senescence [39,40,41]. The NLA protein is an E3 ubiquitin ligase and the nla mutant was hypersensitive to N starvation. In a previous study, most of the 15NO3− spotted in old leaves was preferentially allocated to the youngest leaves [19]. Moreover, NLA degrades NRT1.7 through the ubiquitin-mediated post-translational regulatory pathway and facilitates the remobilization of NO3− from source to sink when adapting to limited N supply [19]. Our results also demonstrated that the expression of NRT1.7 was significantly higher in the nla mutant under N limitation (Figure 4C). The increase in NRT1.7 expression would enhance NO3− remobilization from sources to sinks as an adaptive response to N limitation. However, the majority of N nutrients are exported from source leaves as amino acids instead of NO3− during leaf senescence [7,21,38].
In A. thaliana, over 100 putative amino acid transporters have been identified in the amino acid-polyamine-choline (APC) transporter superfamily and as members of the usually multiple acids move in and out transporters (UmamiT) family [42,43]. Three families, including the amino acid permeases (AAPs), lysine/histidine-like transporters (LHTs), and proline and glycine betaine transporters (ProTs), belong to the APC group [7]. Several genes encoding amino acid transporters, including LHT1, LHT7, CAT1, PUT2, AAP4, and AAP1, were significantly upregulated in the nla mutant (Table 2), which resulted in lower amino acid content in the rosette leaf of the nla mutant under N limitation compared to that of the WT (Figure 1E). Additionally, the proteomic data revealed that LHT1 was significantly upregulated in the nla mutant in response to N limitation (Table 4). There were 49 identical genes observed both in transcriptional and proteomic analysis, and most of the genes showed the same expression patterns (Table 5). However, 6.12% of the total genes were upregulated in the transcriptome data whereas downregulated in the proteomics data. This might result from transcriptional and post-transcriptional regulation, such as alternative splicing and miRNA regulation [44,45,46]. On the other hand, about 2.63% of the total genes were downregulated in transcriptome but upregulated in proteomics analysis, which was putatively due to the translation control mechanism [47]. Among the 49 identical genes, LHT1 was the sole gene that was responsible for amino acid transport. Under N-limited condition, LHT1 was upregulated by 18.65- and 2.09-fold in the transcriptional and proteomic analysis, respectively (Table 5). LHT1 belongs to the LHTs family and it is expressed in both the rhizodermis and mesophyll of A. thaliana [48]. In addition, LHT1 imports neutral and acidic amino acids into the root and mediates amino acid transportation into leaf cells [48,49,50,51]. We further characterized its expression level in the nla mutant; similar to NRT1.7, the expression level of LHT1 was significantly higher in the nla mutant than in the WT under N limitation (Figure 4C). Therefore, NLA might target the amino acid transporters, particularly LHT1, to regulate organic N remobilization under N limitation. As an E3 ubiquitin ligase, NLA regulates the protein stability of NRT1.7 and ORE1 during acclimation to N deficiency [19,23].
Based on the results obtained in the present study, we propose the following model: miR827 suppresses the expression of NLA under N limitation; conversely, NRT1.7 is induced to promote NO3− remobilization from source tissues to sinks, while some amino acid transporters, particularly LHT1, are upregulated to enhance organic N remobilization from sources to sinks, thereby leading to the predominant N remobilization during adaptation to N limitation. Moreover, ORE1, a transcription factor gene acting downstream of NLA, might transcriptionally regulate amino acid transporters and contribute to the adaptive responses in plants under N deficiency (Figure 5). Together, our results provide comprehensive insights into the regulation of amino acid transporters by NLA and their contributions to organic N remobilization from sources to sinks in plants under N limitation.
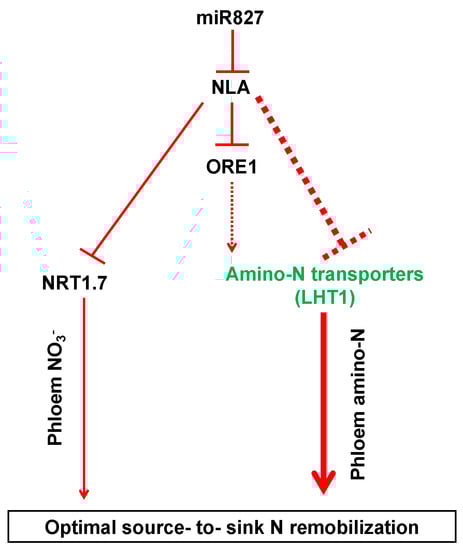
Figure 5.
A proposed model for the adaptive strategies regulated by NLA responsive to N limitation. The dashed lines indicate potential or indirect regulation. The thicker the lines, the more important the pathway.
4. Materials and Methods
4.1. Plant Materials and Growth Conditions
Arabidopsis thaliana ecotype Columbia (Col-0) was used as the control for the nla mutant. The nla mutant was provided by Dr. Wenxue Li (National Key Facility for Crop Gene Resources and Genetic Improvement, Institute of Crop Science, Chinese Academy of Agricultural Sciences, Beijing, China). The nla mutant was first screened and identified by Peng et al. [16]. The plant seeds were sown in a matrix containing vermiculite and perlite at a ratio of 3:2. After germination, the seedlings were transplanted into plastic boxes (5 L) with nutrient solution as described by Han et al. [8] and the nutrient solution (pH 5.7) was replenished every 5 d. The plants were hydroponically grown in an incubator according to a completely randomized block design with three biological replicates. The culture regime was set as follows: 70% humidity, 300–320 μmol m−2 s−1 illumination with a 16-h light/8-h dark cycle, and the temperature was set to 22 °C.
4.2. Determination of Chlorophyll, Anthocyanin, and N Content
After 10 d of hydroponic growth under 4.5 mM NO3−, the Col-0 and nla mutant plants were transferred to a nutrient solution with 0.3 mM NO3− to simulate N-limited condition, and the rosette leaf and root were sampled individually 3 d later. Chlorophyll was extracted from A. thaliana leaf samples (0.15 g) by placing them in a tube with 10 mL of 1:1 absolute ethanol:acetone for 24 h; the absorbance of the solution was measured at 663, 645, and 652 nm. Leaf anthocyanin content was determined in the Col-0 and nla mutant according to the method described by Mancinelli et al. [52]. For N content determination, both shoot and root were oven dried at 105 °C for 30 min, and then at 65 °C until they reached a constant weight. Nitrogen content was determined using the Kjeldahl method [53].
4.3. Free Amino Acid Determination
The content of free amino acids was determined as described previously [54], with slight modifications. Specifically, approximately 0.1 g of leaf sample was added into a tube containing 1 mL of 80% ethanol, and the tube was placed in a water bath for 20 min at 80 °C. This procedure was repeated twice, and the extract was placed in an oven at 80 °C until the ethanol was completely evaporated. Then, 1.0 mL of 5.0 M NaOH was added to dissolve the sediment, which was then centrifuged at 12,000× g for 15 min. The resulting supernatant was collected and filtered through a membrane (2 mL); each filtrate (0.8 mL) was analyzed by high-performance liquid chromatography (HPLC) in the L-8800 HITACHI amino acid analyzer.
4.4. Determination of Sucrose, Fructose, and Glucose Content
The content of sucrose, fructose, and glucose was measured as described previously [55], with slight modifications. Leaf samples (1.0 g) were ground to powder with liquid N, and 5 mL of 80% ethanol was then added before placing the samples in a water bath for 30 min at 80 °C. This procedure was repeated twice, and the samples were centrifuged at 12,000× g for 20 min. The extracts were placed in an oven at 90 °C until the ethanol completely evaporated. Double distilled water (5 mL) was added to dissolve the sediment, and the resulting supernatant was collected and filtered through a membrane (0.45 μm) and analyzed by HPLC using the L-8800 HITACHI amino acid analyzer.
4.5. Transcriptional Responses of nla to N Limitation
To identify genome-wide mRNA transcriptomic responses of the nla mutant and Col-0 (WT) plants to N limitation, we retrieved the RNA-sequencing data reported by Peng et al. [20]. The plants were initially grown in nutrient-free soil, and then supplied with a nutrient solution containing 3 mM (low nitrogen, LN) or 10 mM (high nitrogen, HN) KNO3 once a week for 4 weeks. After 17, 21, and 25 d post-germination, the total RNA was extracted from the 5th–8th rosette leaves and used in the cDNA synthesis microarray hybridization analysis, as described in Zhu et al. [56]. We used the microarray data to compare the molecular responses induced by N limitation between the WT and nla mutant plants.
4.6. Protein Extraction, Digestion, and Isobaric Tags for Relative and Absolute Quantitation (iTRAQ) Labeling
Protein extraction was performed as previously described [57,58]. Briefly, plant samples were homogenized to fine powder in liquid N, and 0.1 g of each sample was then transferred into a 2-mL Eppendorf tube with three biological replicates. Each sample was homogenized with 4% (w/v) SDS, 100 mM Tris-HCl (pH 7.6), and 0.1 M DTT. The SDS-Tris-HCl-DTT (SDT) method was conducted for protein extraction and the bicinchoninic acid (BCA) method was used to quantify the protein [59]. Filter-aided sample preparation (FASP) was conducted to digest the protein as described previously [59]. Trypsin solution was added to the protein samples at a 50:1 ratio (w/w), and then digested at 37 °C overnight. The digested products were desalted on C18 Cartridges (EmporeTM SPE Cartridges C18, Sigma, St. Louis, MI, USA), and then lyophilized and redissolved with 40 μL of dissolution buffer. Finally, the peptide content was determined by ultra-violet light spectral density at 280 nm. The peptides (100 μL) were collected from each sample for iTRAQ labelling by AB SCIEX nanoLC-MS/MS (Triple TOF 6600) [60].
4.7. Peptide Fractionation with Strong Cation Exchange (SCX) Chromatography
The iTRAQ-labelled peptides were mixed and fractionated using the AKTA Purifier 100 system as described previously [57,58], with minor modifications. Specifically, buffer solution A (10 mM KH2PO4 in 25% of ACN, pH 3.0) was added to the mixture and eluted at a flow rate of 1 mL/min with 0% buffer solution B (0.5 M KCl, 10 mM KH2PO4 in 25% of ACN, pH 3.0) for 25 min; then, 0–8% buffer solution B was eluted from 25 to 32 min, 10–20% buffer solution B from 32 to 42 min, 20–45% buffer solution B from 42 to 47 min, 45–100% buffer solution B from 47 to 52 min, and 100% buffer solution B from 52 to 60 min. Buffer solution B was reset to 0% at 60 min. The elution was monitored by absorbance at 214 nm, and fractions were collected once every minute, and then desalted on C18 Cartridges (EmporeTM SPE Cartridges C18, Sigma, St. Louis, MI, USA).
4.8. Liquid Chromatography-Tandem Mass Spectrometry (LC-MS/MS) Data Analysis, Protein Identification, and Quantification
Each sample was separated using the Easy nLC HPLC system as described previously [57,58]. The peptide mixture was loaded onto a sample column equilibrated with 0.1% buffer A (formic acid), and then separated through the analytical column (Thermo Scientific Easy Column) at a flow rate of 300 μL/min.
The MS/MS analysis was performed using the Q-Exactive mass spectrometer in the positive ion mode. The scanned area was set at m/z 300–1800, the automatic gain control target was set to 3 × 10⁶, the maximum injection time was 50 ms, and the dynamic exclusion duration was 60 s. Twenty MS2 scans were obtained after every scan. The MS2 activation type was set as HCD spectra with a resolution of 17,500 at m/z 200 and an isolation width at m/z 2. The normalized collision energy was 30 eV and the underfill ratio was defined as 0.1%. The instrument was run with the peptide recognition mode enabled [57,58]. Finally, the RAW file from the MS analysis was loaded to Mascot 2.2 (Matrix Science, London, UK; version 2.2) and Proteome Discoverer 4.1 (Thermo Electron, San Jose, CA, USA) for protein identification and quantification, based on the sesame protein database (assembly S_indicum_v1.0, 35,410 protein sequences, https://www.ncbi.nlm.nih.gov/genome/?term=sesamum), using the search parameters described previously [61]. The significance level was defined as p < 0.05 for identifying differentially expressed proteins (DEPs) for further analyses [62,63].
4.9. Gene Ontology (GO) Annotation
The DEP sequences were retrieved in batches from the UniProtKB database in FASTA format. The retrieved sequences were locally searched against the SwissProt database using the National Center for Biotechnology Information basic local alignment search tool (BLAST)+ client software (ncbi-blast-2.2.28+-win32.exe) to search for homologous sequences for the transfer of the functional annotations to the studied sequences. The top 10 blast hits with E-values less than 1 × 10⁻³ for each queried sequence were retrieved and loaded into Blast2GO 3.3.5 (http://www.geneontology.org) for GO mapping and annotation [64]. An annotation configuration with an E-value filter of 1 × 10⁻⁶, default gradual EC weights, a GO weight of 5, and an annotation cut-off of 75 were chosen. Unannotated sequences were then annotated with more permissive parameters. The sequences without BLAST hits and unannotated sequences were then used for an analysis with InterProScan against the EBI databases to retrieve functional annotations of protein motifs and merge the InterProScan GO terms with the annotation set [65].
4.10. Kyoto Encyclopedia of Genes and Genomes (KEGG) Pathway Annotation
The FASTA sequences of the DEPs were blasted against the online KEGG database (http://geneontology.org/) to retrieve their KEGG orthology entries (KOs). These were mapped to the KEGG pathways [66] and were extracted for further analyses.
4.11. Functional Enrichment Analysis
To further explore the function of the DEPs on cell physiological processes and to identify the relationships between the DEPs, an enrichment analysis was performed. The GO enrichment (including biological process, molecular function, and cellular component) and KEGG pathway enrichment analyses were applied based on Fisher’s exact test, considering all quantified protein annotations as the background dataset. Benjamini–Hochberg correction for multiple testings was further applied to adjust the derived p-values. Only the functional categories and pathways with p-values under 0.05 were considered significant.
4.12. Quantitative Real-Time PCR (q-PCR) Assays
After treatment of the RNA samples with RNase-free DNase I, the total RNA was used as the template for cDNA synthesis using the PrimeScript™ RT reagent Kit with gDNA Eraser (Perfect Real Time) (TaKaRa, Shiga, Japan). The q-PCR assays for the detection of relative gene expression were performed using SYBR Premix Ex Taq II (Tli RNaseH Plus) (TaKaRa, Shiga, Japan) with the Applied Biosystems StepOne Plus Real-time PCR System (Thermo Fisher Scientific). The thermal cycle conditions were as follows: 95 °C for 3 min, followed by 40 cycles at 95 °C for 10 s and 60 °C for 30 s. A melting curve analysis was conducted to ensure primer specificity as follows: 95 °C for 15 s, 60 °C for 1 min, 60–95 °C for 15 s (+0.3 °C per cycle). The expression data were normalized using the public reference gene AtActin2 [67] and the relative gene expression was calculated using the 2−ΔΔCT method [68]. The gene-specific primers for the q-PCR assays are listed in Table S1.
4.13. Statistical Analyses
Significant differences (p-value < 0.05) were determined using the one-way analysis of variance, followed by Tukey’s honestly significant difference (HSD) multiple comparison tests, using Statistical Package for the Social Sciences 17.0 (SPSS, Chicago, IL, USA).
5. Conclusions
In this study, we investigated the physiological differences in the WT and nla mutant in response to N limitation, and they were further investigated by integrated transcriptional and proteomic profiling analyses. The early-senescence of the nla mutant resulted from excess N remobilization. It has been reported that NLA targets NRT1.7 and regulates NO3− remobilization under N-limited conditions. Here, we found that NLA might target LHT1 and regulate organic N remobilization from source to sink under N limitation.
Supplementary Materials
Supplementary Materials can be found at https://www.mdpi.com/1422-0067/21/6/2171/s1. Table S1. Primers of the genes targeted in the q-PCR assays. Figure S1. Identification and analysis of proteome in WT and the nla mutant. Figure S2. Peptide ion score distribution of the detected peptides.
Author Contributions
Q.L., Y.-p.H. and Z.-h.Z. designed the experiments; Q.L. and T.-j.T. performed the experiments; Q.L., T.Z., Y.-p.H. and Z.-h.Z. analyzed the data; and Q.L., Y.-p.H. and Z.-h.Z. wrote the manuscript. H.-x.S., Y.-p.H. and Z.-h.Z. edited the manuscript. All authors read and approved the final manuscript.
Funding
This study was financially supported by the National Key Research and Development Program of China (2017YFD0200100; 2017YFD0200103); the National Natural Science Foundation of China (Grant No. 31101596, 31372130); Hunan Provincial Recruitment Program of Foreign Experts; and the National Oilseed Rape Production Technology System of China; “2011 Plan” supported by The Chinese Ministry of Education; Double First-Class Construction Project of Hunan Agricultural University (kxk201801005).
Acknowledgments
We thank Wenxue Li from National Key Facility for Crop Gene Resources and Genetic Improvement, Institute of Crop Science, Chinese Academy of Agricultural Sciences, Beijing, China for providing the nla mutant.
Conflicts of Interest
The authors declare no conflict of interest.
Abbreviations
| CLC | Chloride channel |
| DEP | Differentially expressed protein |
| GO | Gene Ontology |
| GOGAT | Glutamine synthetase/glutamate synthase |
| KEGG | Kyoto Encyclopedia of Genes and Genomes |
| KO | KEGG orthology |
| NLA | N limitation adaption |
| NO3− | Nitrate |
| NT | Nitrate reductase |
| NRT | NO3− transporter |
| NUE | N use efficiency |
| Pi | Inorganic phosphate |
| q-PCR | Quantitative real-time PCR |
| WT | Wild-type |
References
- Xu, G.H. The basic and applied researches for improving crop nutrient use efficiency. Plant Physiol. J. 2016, 52, 1761–1763. [Google Scholar]
- Jin, J.Y. Changes in the efficiency of fertilizer use in China. J. Sci. Food Agr. 2012, 92, 1006–1009. [Google Scholar] [CrossRef]
- Masclaux-Daubresse, C.; Daniel-Vedele, F.; Dechorgnat, J.; Chardon, F.; Gaufichon, L.; Suzuki, A. Nitrogen uptake, assimilation and remobilization in plants: Challenges for sustainable and productive agriculture. Ann. Bot. 2010, 105, 1141–1157. [Google Scholar] [CrossRef]
- Schroeder, J.I.; Delhaize, E.; Frommer, W.B.; Guerinot, M.L.; Harrison, M.J.; Herrera-Estrella, L.; Horie, T.; Kochian, L.V.; Munns, R.; Nishizawa, N.K.; et al. Using membrane transporters to improve crops for sustainable food production. Nature 2013, 497, 60–66. [Google Scholar] [CrossRef] [PubMed]
- Wang, G.; Ding, G.; Li, L.; Cai, H.; Ye, X.; Zou, J.; Xu, F. Identification and characterization of improved nitrogen efficiency in interspecific hybridized new-type Brassica napus. Ann. Bot. 2014, 114, 549–559. [Google Scholar] [CrossRef] [PubMed]
- Kant, S. Understanding nitrate uptake, signaling and remobilization for improving plant nitrogen use efficiency. Semin. Cell Dev. Biol. 2018, 74, 89–96. [Google Scholar] [CrossRef]
- Tegeder, M.; Masclaux-Daubresse, C. Source and sink mechanisms of nitrogen transport and use. New Phytol. 2018, 217, 35–53. [Google Scholar] [CrossRef]
- Han, Y.L.; Song, H.X.; Liao, Q.; Yu, Y.; Jian, S.F.; Lepo, J.E.; Liu, Q.; Rong, X.M.; Tian, C.; Zeng, J.; et al. Nitrogen use efficiency is mediated by vacuolar nitrate sequestration capacity in roots of Brassica napus. Plant Physiol. 2016, 170, 1377. [Google Scholar] [CrossRef]
- De Angeli, A.; Monachello, D.; Ephritikhine, G.; Frachisse, J.M.; Thomine, S.; Gambale, F.; Barbier-Brygoo, H. The nitrate/proton antiporter AtCLCa mediates nitrate accumulation in plant vacuoles. Nature 2006, 442, 939–942. [Google Scholar] [CrossRef]
- Liao, Q.; Zhou, T.; Yao, J.Y.; Han, Q.F.; Song, H.X.; Guan, C.Y.; Hua, Y.P.; Zhang, Z.H. Genome-scale characterization of the vacuole nitrate transporter Chloride Channel (CLC) genes and their transcriptional responses to diverse nutrient stresses in allotetraploid rapeseed. PLoS ONE 2018, 13, 1–26. [Google Scholar] [CrossRef]
- Lin, S.H.; Kuo, H.-F.; Canivenc, G.; Lin, C.S.; Lepetit, M.; Hsu, P.-K.; Tillard, P.; Lin, H.-L.; Wang, Y.-Y.; Tsai, C.-B.; et al. Mutation of the Arabidopsis NRT1.5 Nitrate Transporter Causes Defective Root-to-Shoot Nitrate Transport. Plant Cell Online 2008, 20, 2514–2528. [Google Scholar] [CrossRef] [PubMed]
- Li, J.Y.; Fu, Y.L.; Pike, S.M.; Bao, J.; Tian, W.; Zhang, Y.; Chen, C.Z.; Zhang, Y.; Li, H.-M.; Huang, J.; et al. The Arabidopsis Nitrate Transporter NRT1.8 Functions in Nitrate Removal from the Xylem Sap and Mediates Cadmium Tolerance. Plant Cell Online 2010, 22, 1633–1646. [Google Scholar] [CrossRef] [PubMed]
- Fan, K.; Zhang, Q.; Liu, M.; Ma, L.; Shi, Y.; Ruan, J. Metabolomic and transcriptional analyses reveal the mechanism of C, N allocation from source leaf to flower in tea plant (Camellia sinensis. L). J. Plant Physiol. 2019, 232, 200–208. [Google Scholar] [CrossRef] [PubMed]
- Shin, L.J.; Lo, J.C.; Chen, G.H.; Callis, J.; Fu, H.; Yeh, K.C. IRT1 DEGRADATION FACTOR1, a RING E3 Ubiquitin Ligase, Regulates the Degradation of IRON-REGULATED TRANSPORTER1 in Arabidopsis. Plant Cell 2013, 25, 3039–3051. [Google Scholar] [CrossRef] [PubMed]
- Rodríguez-Celma, J.; Chou, H.; Kobayashi, T.; Long, T.A.; Balk, J. Hemerythrin E3 Ubiquitin Ligases as Negative Regulators of Iron Homeostasis in Plants. Front. Plant Sci. 2019, 10, 1–7. [Google Scholar] [CrossRef] [PubMed]
- Peng, M.; Hannam, C.; Gu, H.; Bi, Y.M.; Rothstein, S.J. A mutation in NLA, which encodes a RING-type ubiquitin ligase, disrupts the adaptability of Arabidopsis to nitrogen limitation. Plant J. 2007, 50, 320–337. [Google Scholar] [CrossRef] [PubMed]
- Yaeno, T.; Iba, K. BAH1/NLA, a RING-Type Ubiquitin E3 Ligase, Regulates the Accumulation of Salicylic Acid and Immune Responses to Pseudomonas syringae DC3000. Plant Physiol. 2008, 148, 1032–1041. [Google Scholar] [CrossRef]
- Kant, S.; Bi, Y.M.; Rothstein, S.J. Understanding plant response to nitrogen limitation for the improvement of crop nitrogen use efficiency. J. Exp. Bot. 2011, 62, 1499–1509. [Google Scholar] [CrossRef]
- Liu, W.; Sun, Q.; Wang, K.; Du, Q.; Li, W.X. Nitrogen Limitation Adaptation (NLA) is involved in source-to-sink remobilization of nitrate by mediating the degradation of NRT1.7 in Arabidopsis. New Phytol. 2017, 214, 734–744. [Google Scholar] [CrossRef]
- Peng, M.; Bi, Y.M.; Zhu, T.; Rothstein, S.J. Genome-wide analysis of Arabidopsis responsive transcriptome to nitrogen limitation and its regulation by the ubiquitin ligase gene NLA. Plant Mol. Biol. 2007, 65, 775–797. [Google Scholar] [CrossRef]
- Havé, M.; Marmagne, A.; Chardon, F.; Masclaux-Daubresse, C. Nitrogen remobilization during leaf senescence: Lessons from Arabidopsis to crops. J. Exp. Bot. 2017, 68, 2513–2529. [Google Scholar] [PubMed]
- Evans, J.R.; Clarke, V.C. The nitrogen cost of photosynthesis. J. Exp. Bot. 2018, 70, 7–15. [Google Scholar] [CrossRef] [PubMed]
- Park, B.S.; Yao, T.; Seo, J.S.; Wong, E.C.C.; Mitsuda, N.; Huang, C.H.; Chua, N.H. Arabidopsis NITROGEN LIMITATION ADAPTATION regulates ORE1 homeostasis during senescence induced by nitrogen deficiency. Nat. Plants 2018, 4, 898–903. [Google Scholar] [CrossRef] [PubMed]
- Kant, S.; Peng, M.; Rothstein, S.J. Genetic regulation by NLA and microRNA827 for maintaining nitrate-dependent phosphate homeostasis in Arabidopsis. PLoS Genet. 2011, 7. [Google Scholar] [CrossRef]
- Diaz, C. Characterization of Markers to Determine the Extent and Variability of Leaf Senescence in Arabidopsis. A Metabolic Profiling Approach. Plant Physiol. 2005, 138, 898–908. [Google Scholar] [CrossRef]
- Wingler, A.; Purdy, S.; MacLean, J.A.; Pourtau, N. The role of sugars in integrating environmental signals during the regulation of leaf senescence. J. Exp. Bot. 2006, 57, 391–399. [Google Scholar] [CrossRef]
- Maier, A.; Schrader, A.; Kokkelink, L.; Falke, C.; Welter, B.; Iniesto, E.; Rubio, V.; Uhrig, J.F.; Hülskamp, M.; Hoecker, U. Light and the E3 ubiquitin ligase COP1/SPA control the protein stability of the MYB transcription factors PAP1 and PAP2 involved in anthocyanin accumulation in Arabidopsis. Plant J. 2013, 74, 638–651. [Google Scholar] [CrossRef]
- Girondé, A.; Etienne, P.; Trouverie, J.; Bouchereau, A.; Le Cahérec, F.; Leport, L.; Orsel, M.; Niogret, M.F.; Nesi, N.; Carole, D.; et al. The contrasting N management of two oilseed rape genotypes reveals the mechanisms of proteolysis associated with leaf N remobilization and the respective contributions of leaves and stems to N storage and remobilization during seed filling. BMC Plant Biol. 2015, 15. [Google Scholar] [CrossRef]
- Wang, X.-F.; An, J.-P.; Liu, X.; Su, L.; You, C.-X.; Hao, Y.-J. The Nitrate-Responsive Protein MdBT2 Regulates Anthocyanin Biosynthesis by Interacting with the MdMYB1 Transcription Factor. Plant Physiol. 2018, 178, 890–906. [Google Scholar] [CrossRef]
- Shimizu, T.; Inoue, T.; Shiraishi, H. A senescence-associated S-like RNase in the multicellular green alga Volvox carteri. Gene 2001, 274, 227–235. [Google Scholar] [CrossRef]
- Seo, P.J.; Park, J.M.; Kang, S.K.; Kim, S.G.; Park, C.M. An Arabidopsis senescence-associated protein SAG29 regulates cell viability under high salinity. Planta 2011, 233, 189–200. [Google Scholar] [CrossRef] [PubMed]
- Deng, S.; Mai, Y.; Niu, J. Fruit characteristics, soluble sugar compositions and transcriptome analysis during the development of Citrus maxima “seedless” and identification of SUS and INV genes involved in sucrose degradation. Gene 2019, 689, 131–140. [Google Scholar] [CrossRef] [PubMed]
- Kiba, T.; Krapp, A. Plant nitrogen acquisition under low availability: Regulation of uptake and root architecture. Plant Cell Physiol. 2016, 57, 707–714. [Google Scholar] [CrossRef] [PubMed]
- Adam, Z.; Adamska, I.; Nakabayashi, K.; Ostersetzer, O.; Haussuhl, K.; Manuell, A.; Zheng, B.; Vallon, O.; Rodermel, S.R.; Shinozaki, K.; et al. Chloroplast and Mitochondrial Proteases in Arabidopsis. A Proposed Nomenclature. Plant Physiol. 2001, 125, 1912–1918. [Google Scholar] [CrossRef] [PubMed]
- Bongue-Bartelsman, M.; Phillips, D.A. Nitrogen stress regulates gene expression of enzymes in the flflavonoid biosynthetic pathway of tomato. Plant Physiol. Bioch. 1995, 33, 539–546. [Google Scholar]
- Chalker-Scott, L. Environmental significance of anthocyanins in plant stress responses. Photochem. Photobiol. 1999, 70, 1–9. [Google Scholar] [CrossRef]
- Jun, J.H.; Liu, C.; Xiao, X.; Dixon, R.A. The Transcriptional Repressor MYB2 Regulates Both Spatial and Temporal Patterns of Proanthocyandin and Anthocyanin Pigmentation in Medicago truncatula. Plant Cell 2015, 27, 2860–2879. [Google Scholar]
- Avice, J.C.; Etienne, P. Leaf senescence and nitrogen remobilization efficiency in oilseed rape (Brassica napus L.). J. Exp. Bot. 2014, 65, 3813–3824. [Google Scholar] [CrossRef]
- Schulte, auf’m, Erley, G.; Begum, N.; Worku, M.; Bänzige, M.; Walter, J. Leaf senescence induced by nitrogen defciency as indicator of genotypic diferences in nitrogen efciency in tropical maize. J. Plant Nutr. Soil Sci. 2007, 170, 106–114. [Google Scholar] [CrossRef]
- Agüera, E.; Cabello, P.; de la Haba, P. Induction of leaf senescence by low nitrogen nutrition in sunflower (Helianthus annuus) plants. Physiol. Plant. 2010, 138, 256–267. [Google Scholar] [CrossRef]
- Meng, S.; Peng, J.S.; He, Y.N.; Zhang, G.B.; Yi, H.Y.; Fu, Y.L.; Gong, J.M. Arabidopsis NRT1.5 Mediates the Suppression of Nitrate Starvation-Induced Leaf Senescence by Modulating Foliar Potassium Level. Mol. Plant 2016, 9, 461–470. [Google Scholar] [CrossRef] [PubMed]
- Rentsch, D.; Schmidt, S.; Tegeder, M. Transporters for uptake and allocation of organic nitrogen compounds in plants. FEBS Lett. 2007, 581, 2281–2289. [Google Scholar] [CrossRef] [PubMed]
- Perchlik, M.; Foster, J.; Tegeder, M. Different and overlapping functions of Arabidopsis LHT6 and AAP1 transporters in root amino acid uptake. J. Exp. Bot. 2014, 65, 5193–5204. [Google Scholar] [CrossRef] [PubMed]
- Jacquot, A.; Li, Z.; Gojon, A.; Schulze, W.; Lejay, L. Post-translational regulation of nitrogen transporters in plants and microorganisms. J. Exp. Bot. 2017, 68, 2567–2580. [Google Scholar] [CrossRef] [PubMed]
- Megha, S.; Basu, U.; Kav, N.N.V. Regulation of low temperature stress in plants by microRNAs. Plant Cell Environ. 2018, 41, 1–15. [Google Scholar] [CrossRef] [PubMed]
- Nimeth, B.A.; Riegler, S.; Kalyna, M. Alternative Splicing and DNA Damage Response in Plants. Front. Plant Sci. 2020, 11, 91. [Google Scholar] [CrossRef] [PubMed]
- Casas-Vila, N.; Bluhm, A.; Sayols, S.; Dinges, N.; Dejung, M.; Altenhein, T.; Kappei, D.; Altenhein, B.; Roignant, J.Y.; Butter, F. The developmental proteome of Drosophila melanogaster. Genome Res. 2017, 27, 1273–1285. [Google Scholar] [CrossRef]
- Hirner, A.; Ladwig, F.; Stransky, H.; Okumoto, S.; Keinath, M.; Harms, A. Arabidopsis LHT1 Is a High-Affinity Transporter for Cellular Amino Acid Uptake in Both Root Epidermis and Leaf Mesophyll. Plant Cell. 2016, 18, 1931–1946. [Google Scholar] [CrossRef]
- Chen, L.S.; Bush, D.R. LHT1, a lysine- and histidine-specific amino acid transporter in Arabidopsis. Plant Physiol. 1997, 115, 1127–1134. [Google Scholar] [CrossRef]
- Svennerstam, H.; Ganeteg, U.; Bellini, C.; Näsholm, T. Comprehensive screening of Arabidopsis mutants suggests the lysine histidine transporter 1 to be involved in plant uptake of amino acids. Plant Physiol. 2007, 143, 1853–1860. [Google Scholar] [CrossRef]
- Ganeteg, U.; Ahmad, I.; Jämtgård, S.; Aguetoni-Cambui, C.; Inselsbacher, E.; Svennerstam, H. Amino acid transporter mutants of Arabidopsis provides evidence that a non-mycorrhizal plant acquires organic nitrogen from agricultural soil. Plant Cell Environ. 2017, 40, 413–423. [Google Scholar] [CrossRef] [PubMed]
- Mancinelli, A.A.L.; Yang, C.H.; Lindquist, P.; Anderson, O.R. Photocontrol of Anthocyanin Synthesis: III. the Action of Streptomycin on the Synthesis of Chlorophyll and Anthocyanin. Plant Physiol. 1975, 55, 251–257. [Google Scholar] [CrossRef] [PubMed]
- Shi, W.M.; Xu, W.F.; Li, S.M.; Zhao, X.Q.; Dong, G.Q. Responses of two rice cultivars differing in seedling-stage nitrogen use efficiency to growth under low-nitrogen conditions. Plant Soil 2010, 326, 291–302. [Google Scholar] [CrossRef]
- Lu, K.; Wu, B.; Wang, J.; Zhu, W.; Nie, H.; Qian, J.; Huang, W.; Fang, Z. Blocking amino acid transporter OsAAP3 improves grain yield by promoting outgrowth buds and increasing tiller number in rice. Plant Biotechnol. J. 2018, 16, 1710–1722. [Google Scholar] [CrossRef] [PubMed]
- Zhang, H.; Zhang, S.; Qin, G.; Wang, L.; Wu, T.; Qi, K.; Zhang, S. Molecular cloning and expression analysis of a gene for sucrose transporter from pear (Pyrus bretschneideri Rehd.) fruit. Plant Physiol. Biochem. 2013, 73, 63–69. [Google Scholar] [CrossRef] [PubMed]
- Zhu, T.; Budworth, P.; Han, B.; Brown, D.; Chang, H.S.; Zou, G.Z. Toward elucidating the global gene expression patterns of developing Arabidopsis: Parallel analysis of 8 300 genes by a high-density oligonucleotide probe array. Plant Physiol. Biochem. 2001, 39, 221–242. [Google Scholar] [CrossRef]
- Hu, X.; Li, N.; Wu, L.; Li, C.; Li, C.; Zhang, L.; Liu, T.; Wang, W. Quantitative iTRAQ-based proteomic analysis of phosphoproteins and ABA-regulated phosphoproteins in maize leaves under osmotic stress. Sci. Rep. 2015, 5, 1–26. [Google Scholar] [CrossRef]
- Zhao, Y.; Wang, Y.; Yang, H.; Wang, W.; Wu, J.; Hu, X. Quantitative Proteomic Analyses Identify ABA-Related Proteins and Signal Pathways in Maize Leaves under Drought Conditions. Front. Plant Sci. 2016, 7. [Google Scholar] [CrossRef]
- Wiśniewski, J.R.; Zougman, A.; Nagaraj, N.; Mann, M. Universal sample preparation method for proteome analysis. Nat. Methods 2009, 6, 359–362. [Google Scholar] [CrossRef]
- Ross, P.L.; Huang, Y.N.; Marchese, J.N.; Williamson, B.; Parker, K.; Hattan, S.; Khainovski, N.; Pillai, S.; Dey, S.; Daniels, S.; et al. Multiplexed protein quantitation in Saccharomyces cerevisiae using amine-reactive isobaric tagging reagents. Mol. Cell. Proteom. 2004, 3, 1154–1169. [Google Scholar] [CrossRef]
- Ji, W.; Cong, R.; Li, S.; Li, R.; Qin, Z.; Li, Y.; Zhou, X.; Chen, S.; Li, J. Comparative Proteomic Analysis of Soybean Leaves and Roots by iTRAQ Provides Insights into Response Mechanisms to Short-Term Salt Stress. Front. Plant Sci. 2016, 7, 1–15. [Google Scholar] [CrossRef] [PubMed]
- Chu, P.; Yan, G.X.; Yang, Q.; Zhai, L.N.; Zhang, C.; Zhang, F.Q.; Guan, R.Z. ITRAQ-based quantitative proteomics analysis of Brassica napus leaves reveals pathways associated with chlorophyll deficiency. J. Proteom. 2015, 113, 244–259. [Google Scholar] [CrossRef] [PubMed]
- Chen, Y.; Fu, X.; Mei, X.; Zhou, Y.; Cheng, S.; Zeng, L.; Dong, F.; Yang, Z. Proteolysis of chloroplast proteins is responsible for accumulation of free amino acids in dark-treated tea (Camellia sinensis) leaves. J. Proteom. 2017, 157, 10–17. [Google Scholar] [CrossRef] [PubMed]
- Götz, S.; García-Gómez, J.M.; Terol, J.; Williams, T.D.; Nagaraj, S.H.; Nueda, M.J.; Robles, M.; Talón, M.; Dopazo, J.; Conesa, A. High-throughput functional annotation and data mining with the Blast2GO suite. Nucleic Acids Res. 2008, 36, 3420–3435. [Google Scholar] [CrossRef]
- Quevillon, E.; Silventoinen, V.; Pillai, S.; Harte, N.; Mulder, N.; Apweiler, R.; Lopez, R. InterProScan: Protein domains identifier. Nucleic Acids Res. 2005, 33, 116–120. [Google Scholar] [CrossRef]
- Moriya, Y.; Itoh, M.; Okuda, S.; Yoshizawa, A.C.; Kanehisa, M. KAAS: An automatic genome annotation and pathway reconstruction server. Nucleic Acids Res. 2007, 35, W182–W185. [Google Scholar] [CrossRef]
- Luo, J.S.; Yang, Y.; Gu, T.; Wu, Z.; Zhang, Z. The Arabidopsis defensin gene AtPDF2.5 mediates cadmium tolerance and accumulation. Plant Cell Environ. 2019, 42, 2681–2695. [Google Scholar] [CrossRef]
- Livak, K.J.; Schmittgen, T.D. Analysis of relative gene expression data using real-time quantitative PCR and the 2-ΔΔCT method. Methods 2001, 25, 402–408. [Google Scholar] [CrossRef]


© 2020 by the authors. Licensee MDPI, Basel, Switzerland. This article is an open access article distributed under the terms and conditions of the Creative Commons Attribution (CC BY) license (http://creativecommons.org/licenses/by/4.0/).