Article

Dissecting the Genetic Architecture of Aphanomyces Root Rot Resistance in Lentil by QTL Mapping and Genome-Wide Association Study

1
Department of Horticulture, Washington State University, Pullman, WA 99164, USA
2
Department of Biological Systems Engineering, Washington State University, Pullman, WA 99164, USA
3
USDA-ARS Plant Germplasm Introduction and Testing Unit, Washington State University, Pullman, WA 99164, USA
4
USDA-ARS Grain Legume Genetics and Physiology Research Unit, Prosser, WA 99350, USA
5
Department of Crop and Soil Sciences, Washington State University, Pullman, WA 99164, USA
6
Breeder Seed Production Center, Bangladesh Agricultural Research Institute, Debiganj-5020, Panchagarh, Bangladesh
7
Institute of Soil and Environmental Sciences, University of Agriculture, Faisalabad 38000, Pakistan
8
USDA-ARS Grain Legume Genetics and Physiology Research Unit, Pullman, WA 99164, USA
*
Author to whom correspondence should be addressed.
Int. J. Mol. Sci. 2020, 21(6), 2129; https://doi.org/10.3390/ijms21062129
Submission received: 5 March 2020 / Revised: 13 March 2020 / Accepted: 16 March 2020 / Published: 20 March 2020
(This article belongs to the Section Molecular Genetics and Genomics)

Abstract

:
Lentil (Lens culinaris Medikus) is an important source of protein for people in developing countries. Aphanomyces root rot (ARR) has emerged as one of the most devastating diseases affecting lentil production. In this study, we applied two complementary quantitative trait loci (QTL) analysis approaches to unravel the genetic architecture underlying this complex trait. A recombinant inbred line (RIL) population and an association mapping population were genotyped using genotyping by sequencing (GBS) to discover novel single nucleotide polymorphisms (SNPs). QTL mapping identified 19 QTL associated with ARR resistance, while association mapping detected 38 QTL and highlighted accumulation of favorable haplotypes in most of the resistant accessions. Seven QTL clusters were discovered on six chromosomes, and 15 putative genes were identified within the QTL clusters. To validate QTL mapping and genome-wide association study (GWAS) results, expression analysis of five selected genes was conducted on partially resistant and susceptible accessions. Three of the genes were differentially expressed at early stages of infection, two of which may be associated with ARR resistance. Our findings provide valuable insight into the genetic control of ARR, and genetic and genomic resources developed here can be used to accelerate development of lentil cultivars with high levels of partial resistance to ARR.

1. Introduction

Lentil (Lens culinaris Medikus), an important grain legume, is widely grown throughout the world with an annual production of 7.8 million tons [1]. In 2017, the major producers of lentils were Canada (48.1%), India (15.7%), Turkey (5.5%), United States (4.4%), and Kazakhstan (4.0%). Lentils have high concentrations of protein, minerals, carbohydrates, and fiber and are an inexpensive food that can help alleviate malnutrition in developing countries. Through a symbiotic association with Rhizobium leguminosarum, lentils are able to fix atmospheric nitrogen, which offers significant benefits in cereal-based cropping systems [2].
Root rot disease caused by Aphanomyces euteiches Drechs. is one of most devastating diseases in lentil production and can cause yield losses up to 80% [3]. A. euteiches belongs to the phylum Oomycota, and this soil-borne pathogen has a wide host range within Fabaceae, including pea, lentil, faba bean, dry bean, alfalfa, and red clover [3,4,5,6]. Species-specific A. euteiches isolates were reported by Moussart et al. [7], Malvick and Percich [8], and Levenfors et al. [9]. Aphanomyces root rot (ARR) was first described by Jones and Drechsler in 1927 and was reported as a prevalent pathogen in pea fields worldwide. Kraft et al. [10] determined that the progress of the disease in lentil was rapid and severe, and none of the cultivars and the accessions they evaluated were resistant. Further testing of lentil cultivars with a French isolate confirmed the lack of resistance in lentil lines [7]. While it was known previously, lentil root rot caused by A. euteiches was first identified in the US in 2008 [11] and in Canada in 2012 [12]. It is now recognized to be widespread in lentil growing areas across most of the northern Great Plains of the U.S. and Canada [13,14]. The severe root damage caused by A. euteiches dramatically restricts water and nutrient transport from the roots and results in stunted plants and tremendous yield loss [15]. The thick-walled oospores can survive in soil more than 10 years [16], making crop rotation an ineffective method of disease management. Given that limited information exists regarding the pathogenic variability and the physiologic specialization of this pathogen, comprehensive races of A. euteiches have not been identified [17]. Nevertheless, differences in the ability of different isolates to infect plants were well characterized, and two Pathotypes (I and III) were identified. Pathotypes I and III were found in North America, while only Pathotype I was documented in France [18]. Cultural practices, fungicides, biological control, and soil fumigants are undesirable approaches to manage ARR, as they were proven to be either ineffective or environmentally unfriendly [15]. The most effective, economical, and sustainable management of ARR is utilizing genetic resistance in the development of cultivars with high levels of partial resistance.
However, no lentil cultivars resistant to ARR are currently available, which makes economic loss and the costs of managing this disease significant. Developing other legume cultivars with resistance to ARR through traditional breeding has been hampered by the difficulty of pyramiding resistance genes given the polygenic nature of inheritance [19]. A genome-wide approach provides an unprecedented opportunity for breeding programs to accelerate the development of lentil cultivars with high levels of resistance to ARR. Limited genetic and genomic resources have been available for lentil due to its relatively large genome (~4.2 GB) and minor crop status. Recently, an international collaboration developed a draft lentil genome reference [20] and the advent of inexpensive, high-throughput sequencing and marker development made possible genetic and genomic research required to investigate highly quantitative characteristics in lentil [21]. Quantitative trait loci (QTL) analysis, by integrating genome-wide association study (GWAS) and QTL mapping, is an efficient and effective approach to unravel genetic architecture and detect variations underlying complex traits, particularly polygenic resistance to plant disease [22,23,24]. Over the last two decades, QTL mapping has become a powerful tool in identifying genomic regions associated with traits of interests in bi-parental populations. The low allelic diversity and recombination rates in bi-parental populations, however, limit the ability to detect natural variations in diverse genetic backgrounds. To overcome the limitations inherent in QTL mapping, GWAS is able to assess wider genetic diversity and probe greater amounts of recombination due to the evolutionary history of natural populations. By mitigating each other’s limitations, combining the two QTL analysis approaches provides a complementary, powerful, and robust assay to uncover the genetic basis underlying complex traits [25]. Moreover, with the advent of plant sensing technologies, image-based high-throughput phenotyping enables acquisition of high-quality phenotypic data rapidly, accurately, and objectively [26]. Integration of traditional and image-based phenotyping tools offers us a robust assay to uncover the genetic basis underlying complex traits.
Due to the relatively recent identification of ARR and the lack of genomic resources in lentil, no QTL studies on this disease have been reported in lentil to date. Conversely, the genomic regions associated with ARR resistance in pea and Medicago are well characterized. Twenty-seven meta-QTL were identified in pea in four recombinant inbred line (RIL) populations, seven of which were major resistance QTL detected consistently across multiple environments [27]. Subsequently, GWAS validated seven major resistance QTL and discovered numerous novel QTL associated with resistance to ARR in pea [19,28]. In Medicago truncatula, a candidate gene encoding an F-box protein was identified, using GWAS, as a negative regulator of resistance to ARR [29]. To bridge the gap between ARR genetic and genomic knowledge and breeding application in lentil, in the present work, we performed QTL mapping and GWAS to discover genomic regions associated with genetic resistance to A. euteiches in lentil. We investigated the genetic variations in a USDA lentil single plant-derived (LSP) core collection, an international collection from the International Center for Agricultural Research in the Dry Areas (ICARDA), and an RIL population derived from a susceptible line and a partially resistant line. We integrated large-scale single nucleotide polymorphism (SNP) data generated via genotyping by sequencing (GBS) and high-throughput image-based phenotyping to decipher the genetic architecture. This study provides promising insights of ARR resistance in lentil and will accelerate the development of resistant cultivars.

2. Results

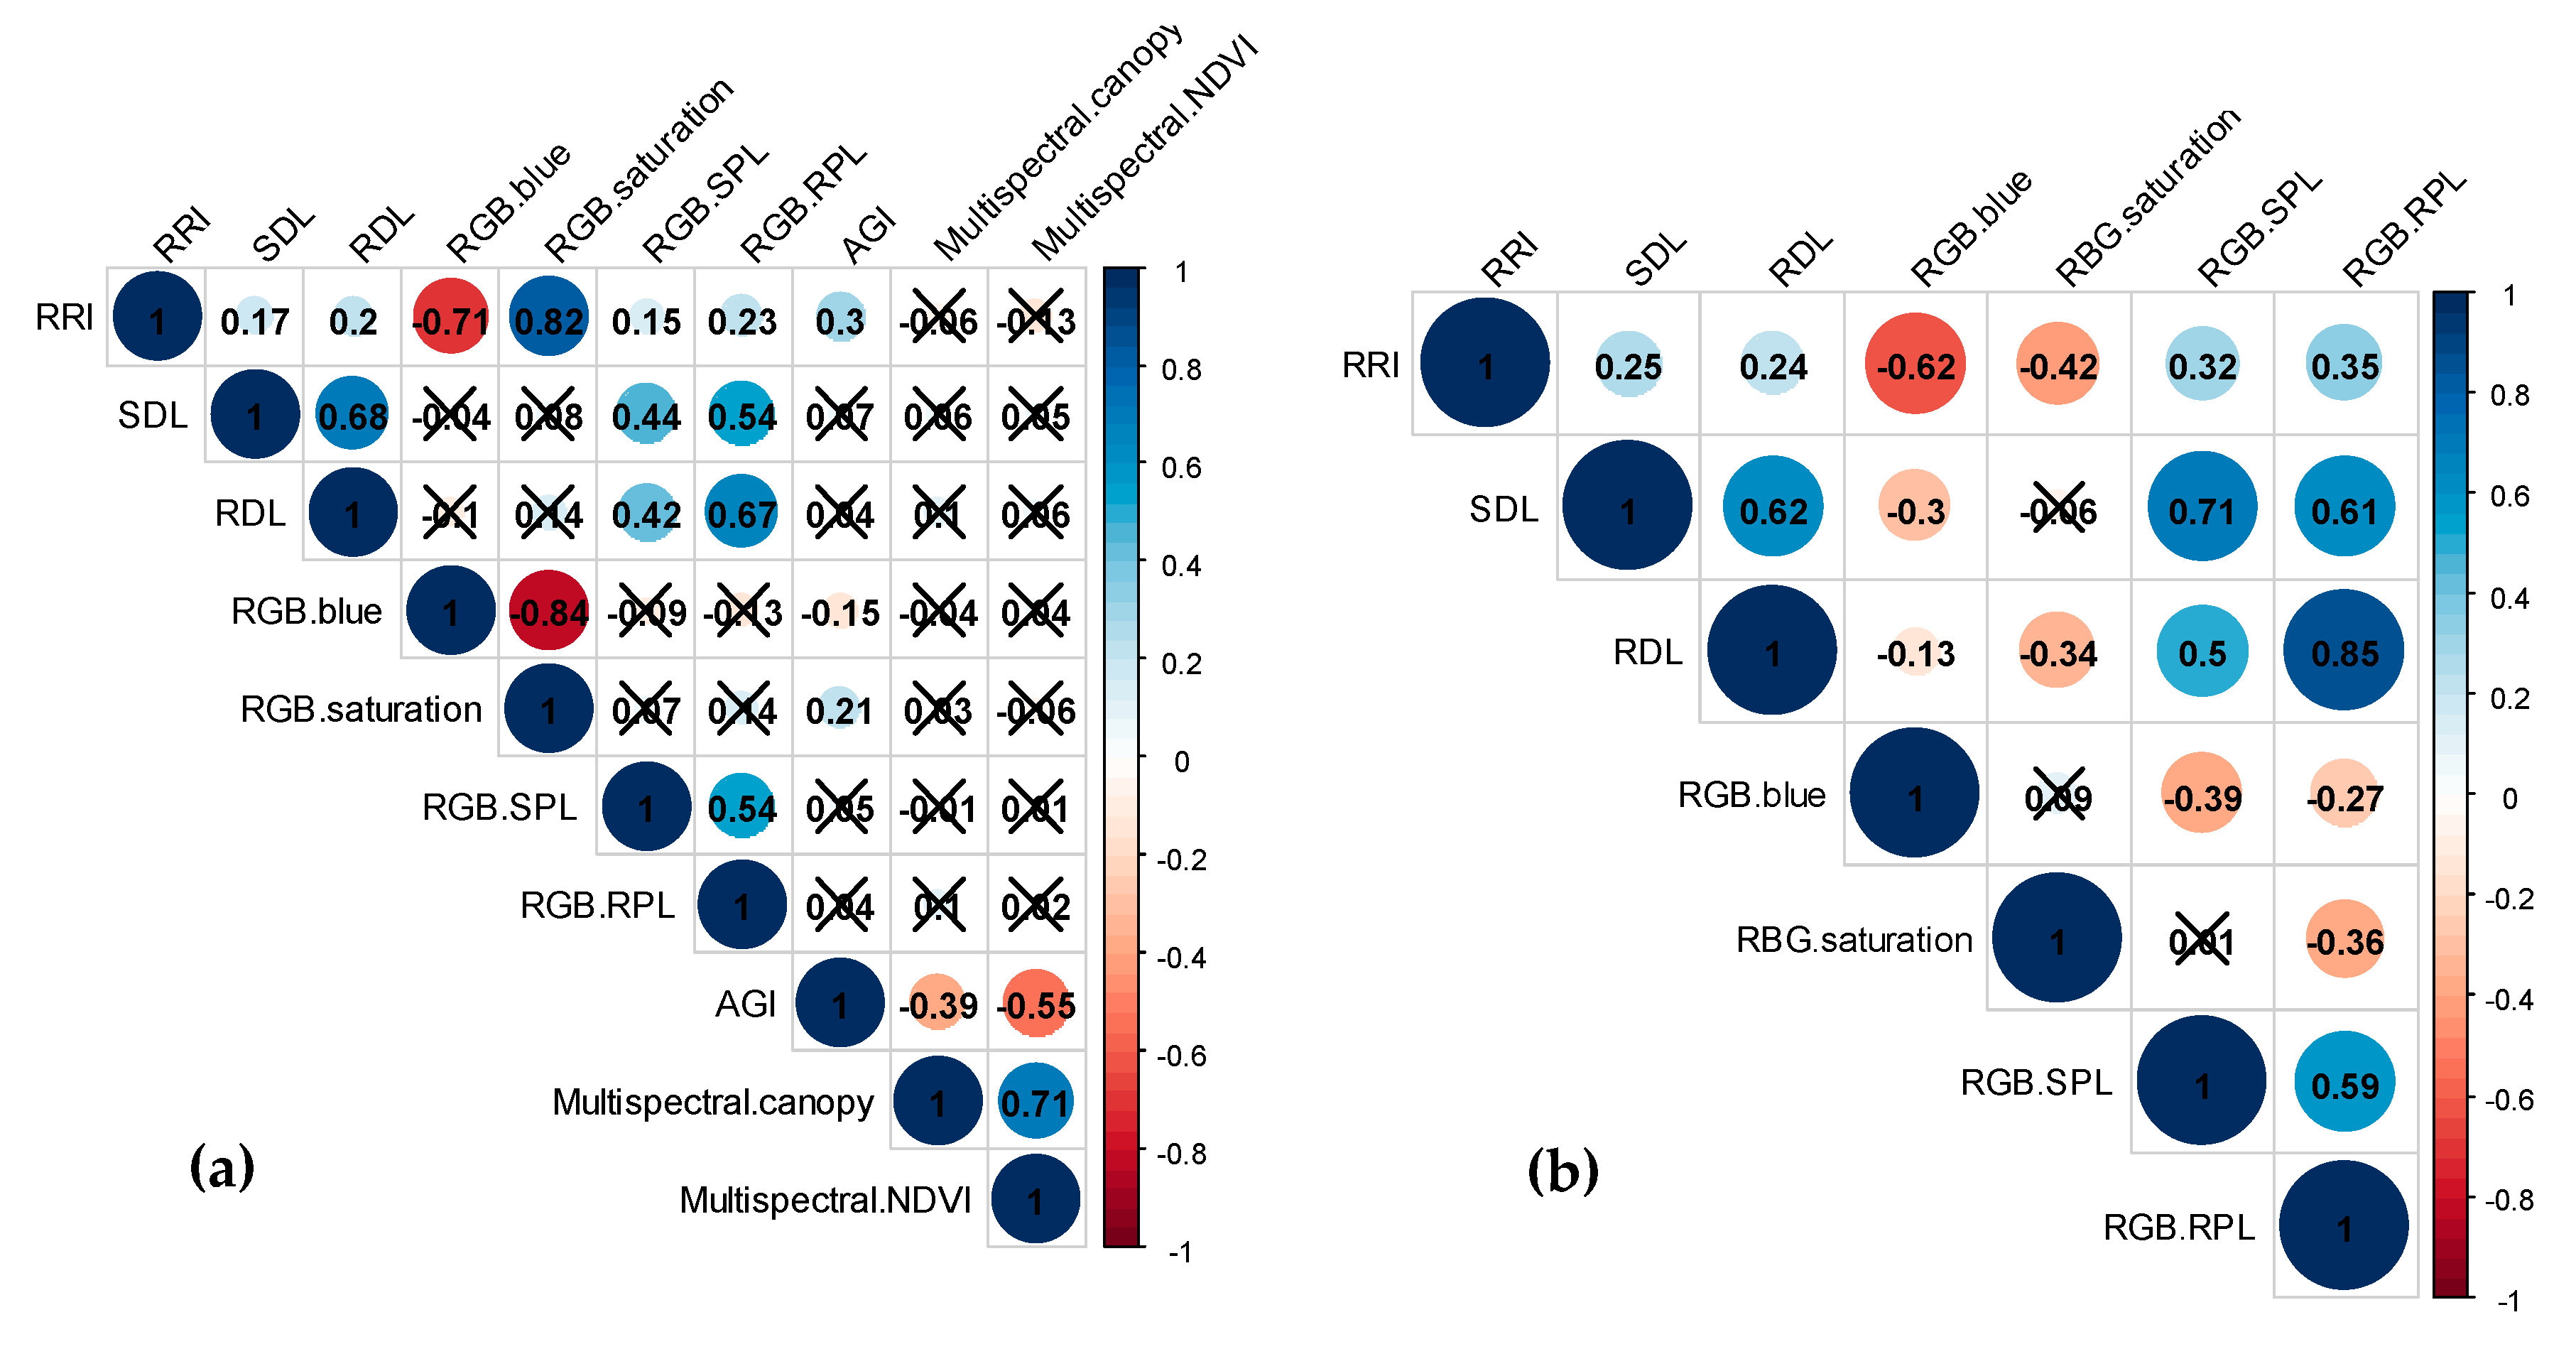
2.1. Phenotypic Data Analysis

The RIL population evaluated for reaction to A. euteiches in a controlled condition (189 RILs) and an infested field condition (173 RILs) displayed transgressive segregation for all the resistance traits (Supplementary Figure S1). The analysis of variance (ANOVA), shown in Table 1, indicated all the genotypes had significant differences for each of the resistance traits (p < 0.05). In terms of the environmental (replicate) effects, there were no significant differences for most of the traits; however, shoot dry weight loss per plant (SDL), root dry weight loss per plant (RDL), average intensity of blue channel acquired from an Red-Green-Blue (RGB) camera (RGB.blue), above ground index (AGI), and canopy area acquired from a multispectral camera (Multispectral.canopy) showed significant environmental effects. Broad-sense heritability appeared to be relatively low in the RIL population and ranged from 0.05 (Multispectral.canopy) to 0.52 (RGB.blue) (Table 1). Frequency distributions of most traits fit normal curves, whereas SDL, RDL, number of pixels loss per plant in shoot acquired from an RGB camera (RGB.SPL), and number of pixels loss per plant in root acquired from an RGB camera (RGB.RPL) had moderately skewed distributions toward high scores. All the traditional ARR traits, root rot index (RRI), SDL, RDL, and AGI, were significantly and positively correlated with each other (p < 0.01) except between AGI and SDL/RDL. The correlation coefficient analysis showed correlations between the two environments were relatively low (0.15 <|r|< 0.30). Image-derived traits, RGB.blue, standard deviation of saturation channel acquired from an RGB camera (RGB.saturation), RGB.SPL, RGB.RPL, standard deviation of normalized difference vegetation index acquired from a multispectral camera (Multispectral.NDVI), and Multispectral.canopy, were significantly and highly correlated with corresponding traditional ARR traits (0.15 < |r| < 0.82) (Figure 1).
Using a GWAS approach, 326 diverse accessions were evaluated for Aphanomyces resistance under controlled conditions at the seedling stage. ANOVA of all the traits indicated highly significant genotype effects (p < 0.001) and environmental (replicate) effects (p < 0.001) (Table 1). Frequency distributions of SDL and RGB.RPL fit a normal curve, while RRI, RGB.saturation, and RGB.SPL had moderately skewed distributions toward low scores, and RDL and RGB.blue skewed toward high scores (Supplementary Figure S1). Broad-sense heritability was high for RRI and RGB.saturation (H2 = 0.73) but moderate for the rest of the traits (0.50 < H2 < 0.62). All the traditional ARR traits (RRI, SDL, and RDL) of the association mapping population were significantly and positively correlated with each other (p < 0.001), where the correlation coefficient was higher between SDL and RDL (r = 0.62) than between RRI and SDL (r = 0.25) and RRI and RDL (r = 0.24). Image-derived traits (RGB.blue, RGB.saturation, RGB.SPL, and RGB.RPL) were significantly and highly related with traditional ARR traits with |r| ranging from 0.13 to 0.85, especially between RDL and RGB.RPL (r = 0.85) (Figure 1).

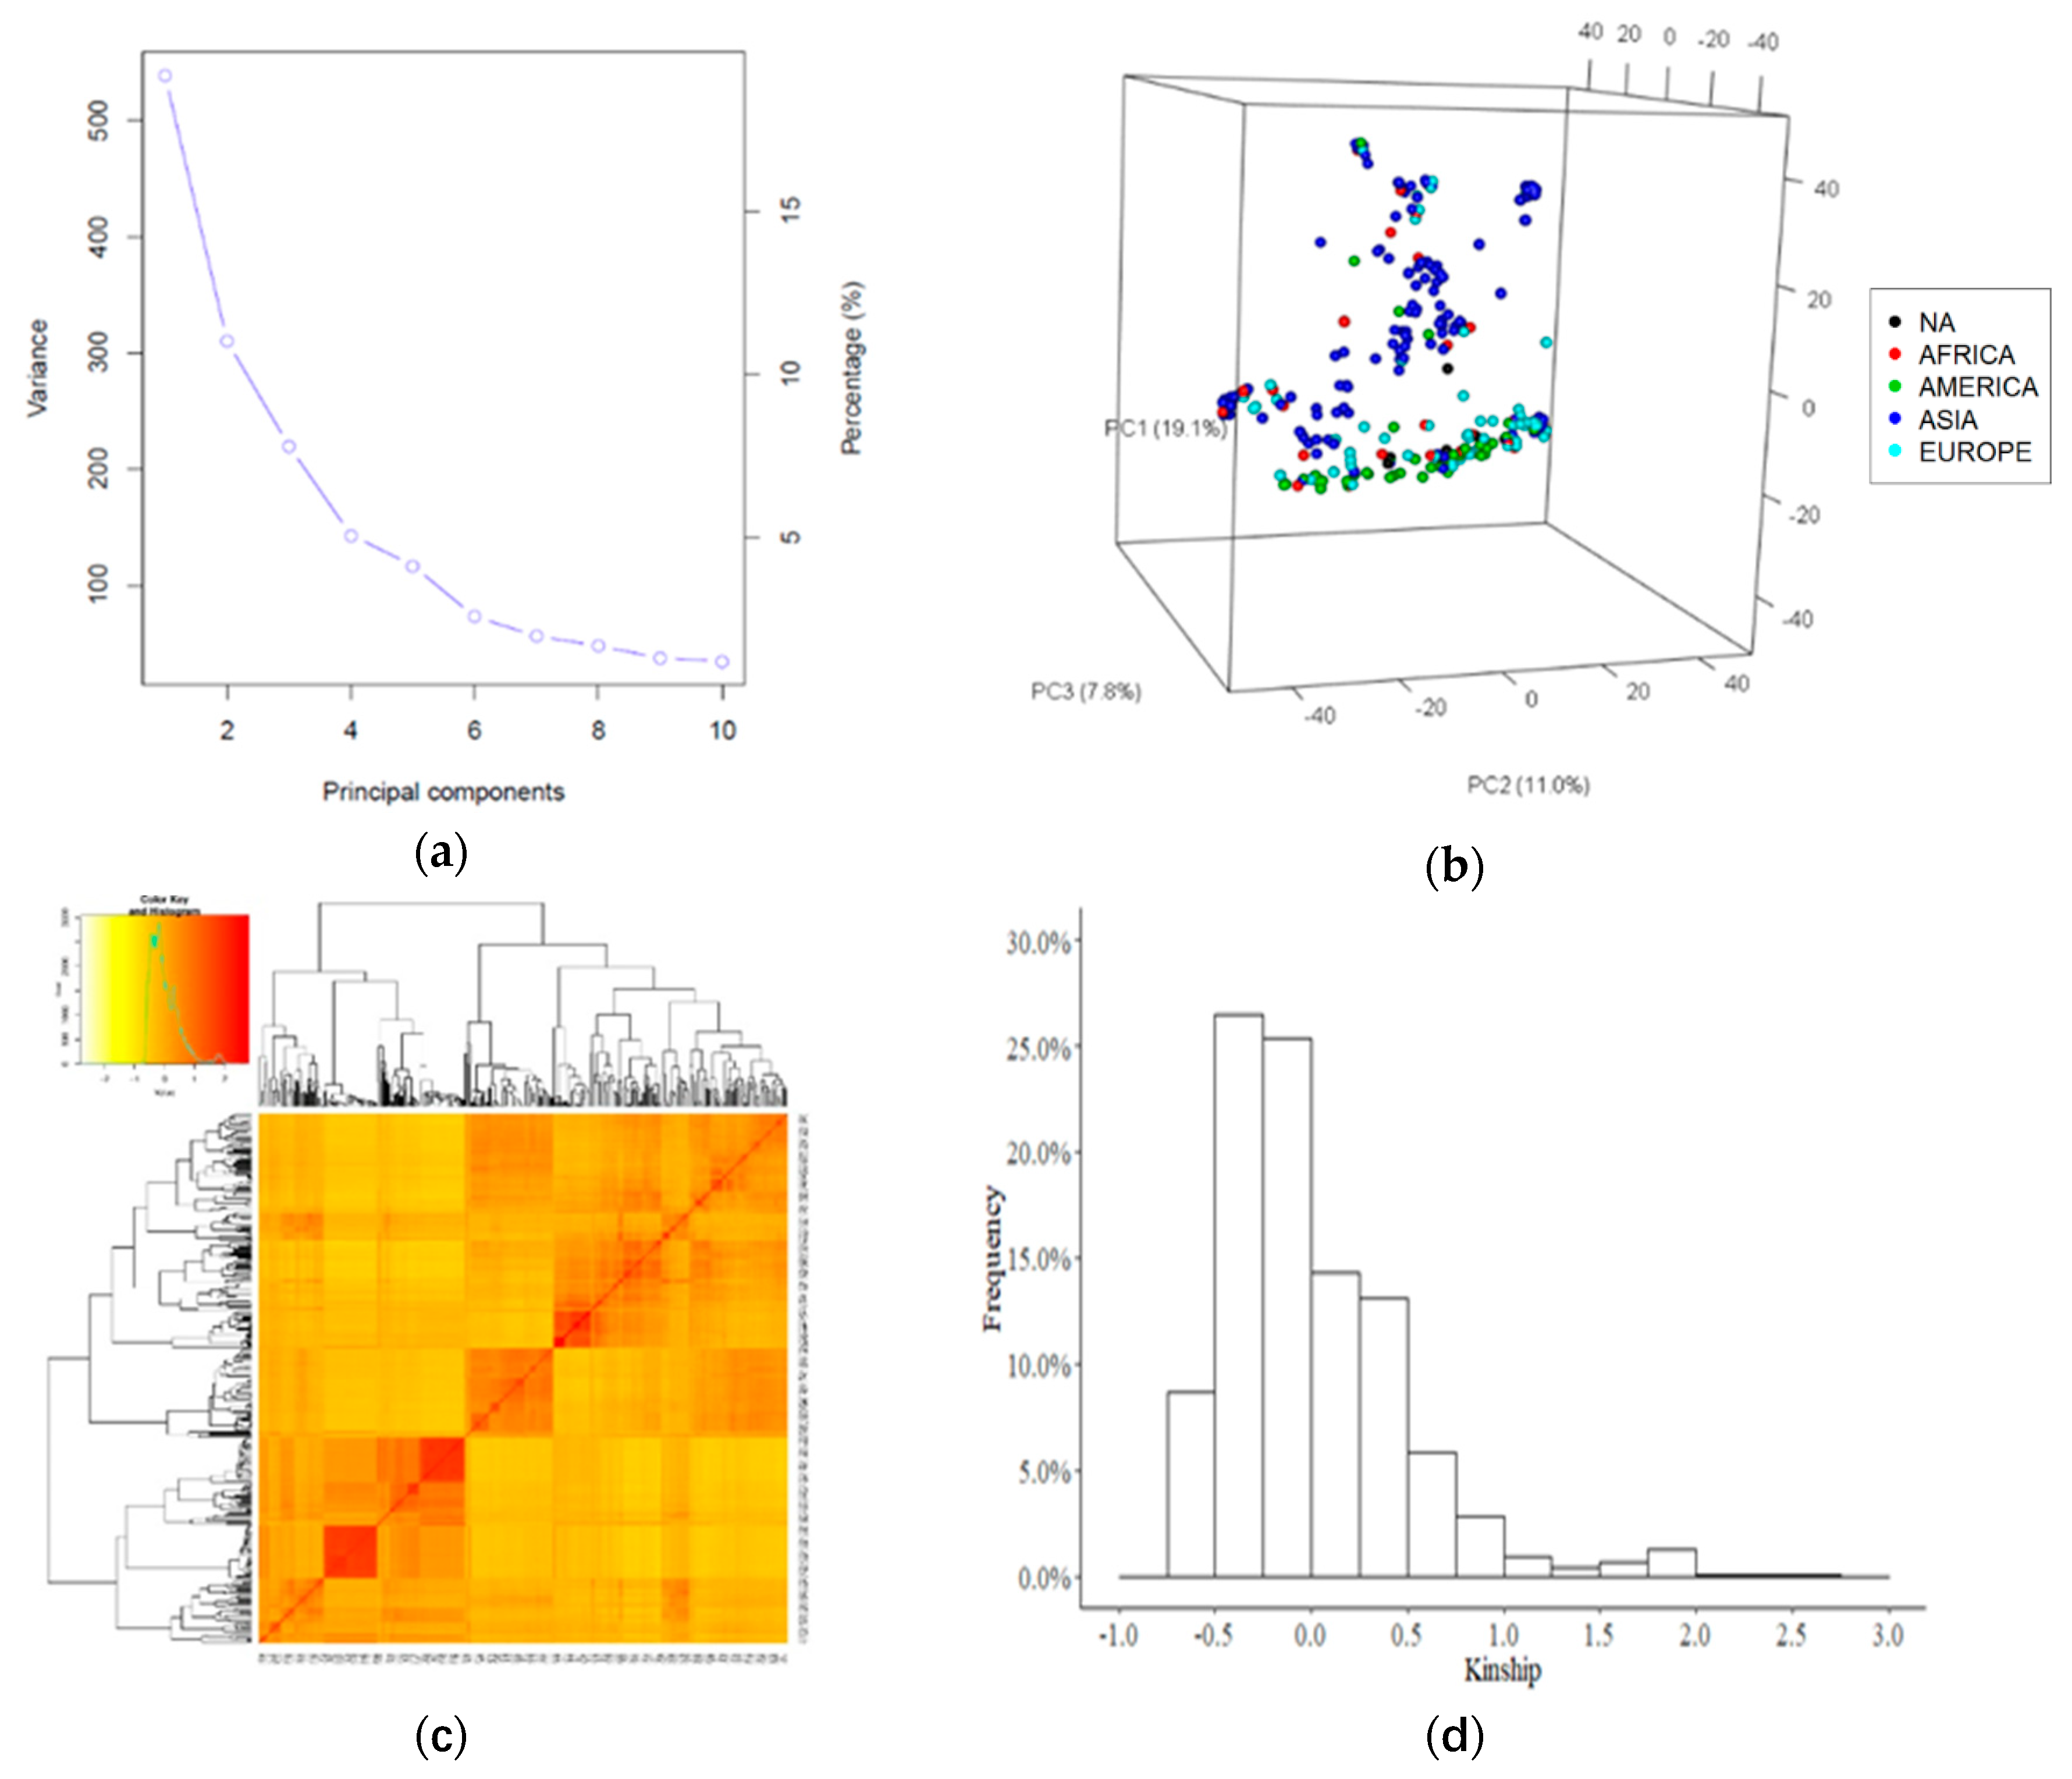
2.2. Genotypic Data Analysis
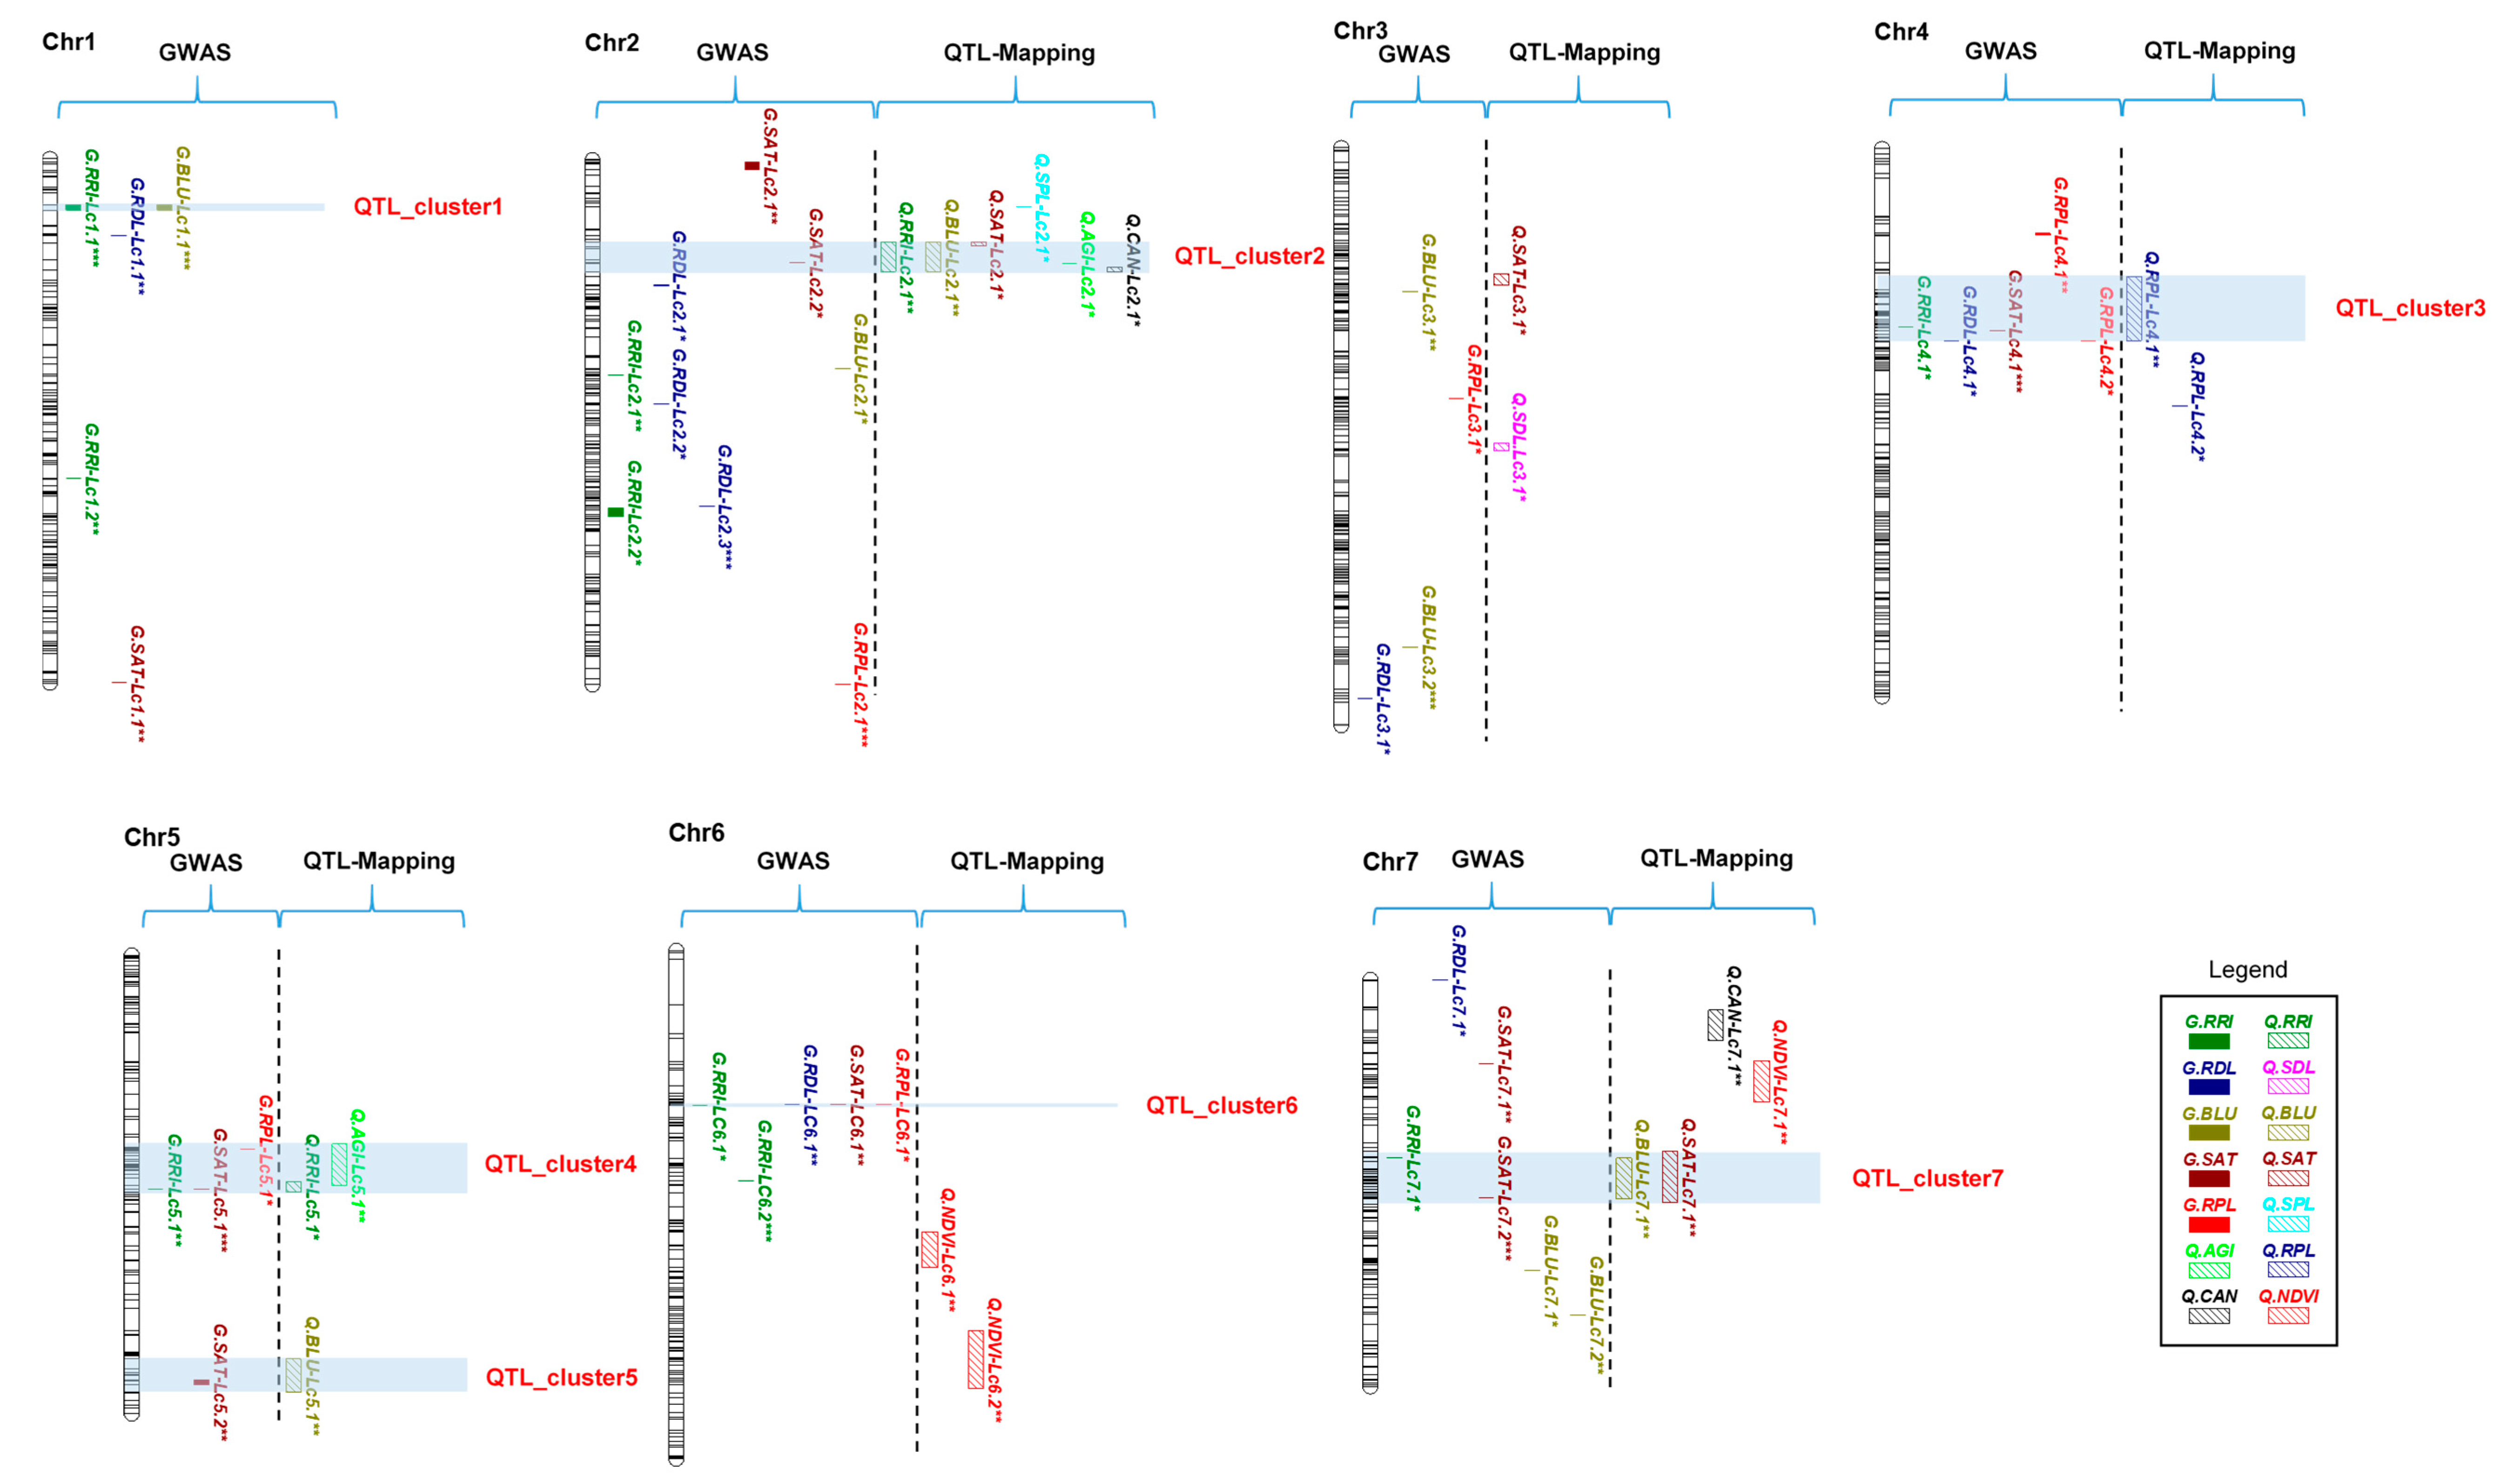
GBS libraries of the RIL population were constructed using the two-enzyme GBS approach and sequenced on an Illumina HiSeqTM 4000 platform. A total of 3.9 billion reads were obtained from the high-throughput sequencing (Supplementary Table S1), and 2.9 billion reads (74% of raw data) were retained after demultiplexing and cleaning. The average number of reads per sample was 15 million with a range from 5.1 million to 34 million reads. With Freebayes-based SNP calling, 164,099 SNPs were identified among the two parents and the RILs. Those SNPs that were polymorphic between the two parents without unknown and heterozygous genotypes, with minor allele frequency (MAF) > 0.3, and with missing values < 0.2 were retained, leaving 2880 SNPs for analysis.
For the association mapping population, the same two-enzyme approach was used for GBS library construction, but the libraries were sequenced on an Illumina HiSeqTM 2500 platform. Subsequently, 1.7 billion raw reads were generated through the sequencing platform (Supplementary Table S1), and 1.5 billion cleared reads (86% of raw data) were retained. The number of reads per sample ranged from 1.4 million to 11.6 million with an average of 4.5 million reads. Using the Stacks pipeline, 28,593 SNPs were identified in this population. With filtering the SNPs with MAF > 0.05 and missing values < 0.3, 4558 SNPs were retained for further GWAS.

2.3. QTL Mapping

In total, 2865 out of 2880 SNPs identified from the RIL population were assigned to seven linkage groups. The estimated map had a length of 978.1 cM and a density of 2.9 markers per cM with 99% of the intervals between adjacent markers being smaller than 5 cM (Supplementary Table S2). QTL associated with ARR were identified across all the chromosomes except Chr 1. A total of two QTL were identified for RRI, one QTL for SDL, and two QTL for AGI. In terms of image-derived features, three QTL for RGB.blue, three QTL for RGB.saturation, one QTL for RGB.SPL, two QTL for RGB.RPL, two QTL for Multispectral.canopy and three QTL for Multispectral.NDVI were identified (Table 2). The detected QTL explained from 5.2% to 12.1% of the phenotypic variance. It is worthwhile to note that two co-localization regions were identified on Chr 2 and Chr 5, respectively, where five QTL (Q.RRI-Lc2.1, Q.BLU-Lc2.1, Q.SAT-Lc2.1, Q.CAN-Lc2.1, and Q.AGI-Lc2.1) were clustered between 22.8 cM and 31 cM on Chr 2 and two QTL (Q.RRI-Lc5.1 and Q.AGI-Lc5.1) were co-localized between 51.7 cM and 64.8 cM on Chr 5.

2.4. Genome-Wide Association Study

With an analysis using unimputed 4558 SNPs in Haploview, linkage disequilibrium (LD) decay was estimated to range from 128 kb to 762 kb with an average of 331 kb over all the chromosomes (Supplementary Figure S2). In the principle component (PC) analysis, the first three PCs explained 19.1%, 11%, and 7.8% (37.9% total) of genetic variance (Figure 2a,b) and clearly separated the lentil accessions collected in Asia from other regions (Figure 2b). The first three PCs were used as covariates to account for population structure in GWAS. The VanRaden kinship coefficient matrix (Figure 2c) ranged from −0.68 to 2.78, with 79% of pairwise kinship coefficients ranging from −0.5 to 0.5 (Figure 2d).
GWAS identified a total of 38 QTL across seven chromosomes associated with five ARR related traits, including two traditional phenotypic traits (RRI and RDL) and three image-derived traits (RGB.saturation, RGB.blue, and RGB.RPL). The p-values ranged from 3.4 × 10⁻¹⁰ to 8.9 × 10⁻⁴, explaining 1.4% to 21.4% of phenotypic variance (Table 3). Nine QTL exceeded the experiment-wise threshold p < 2.2 × 10⁻⁶, 13 reached the marker-wise threshold p < 0.0001, and 16 had a marker-wise p-value between 0.0001 and 0.001. Four co-localization regions were detected on four chromosomes. Two QTL (G.RRI-Lc1.1 and G.BLU-Lc1.1) were co-localized on Chr 1 with a highly significant trait-associated SNP marker (1569_6) consistently detected for RRI and RGB.blue, explaining 10.7% and 13.7% of the phenotypic variance, respectively. A co-localization region on Chr 4 included two QTL (G.RDL-Lc4.1 and G.RPL-Lc4.2) for RDL and RGB.RPL. Two QTL (G.RRI-Lc5.1 and G.SAT-Lc5.1) were clustered on Chr 5 where a trait-associated SNP marker (7154_47) was consistently detected for RRI and RGB.saturation, explaining 10% of phenotypic variance for RRI. A co-localization region was identified on Chr 6 for RDL, RGB.saturation, and RGB.RPL (Table 3).

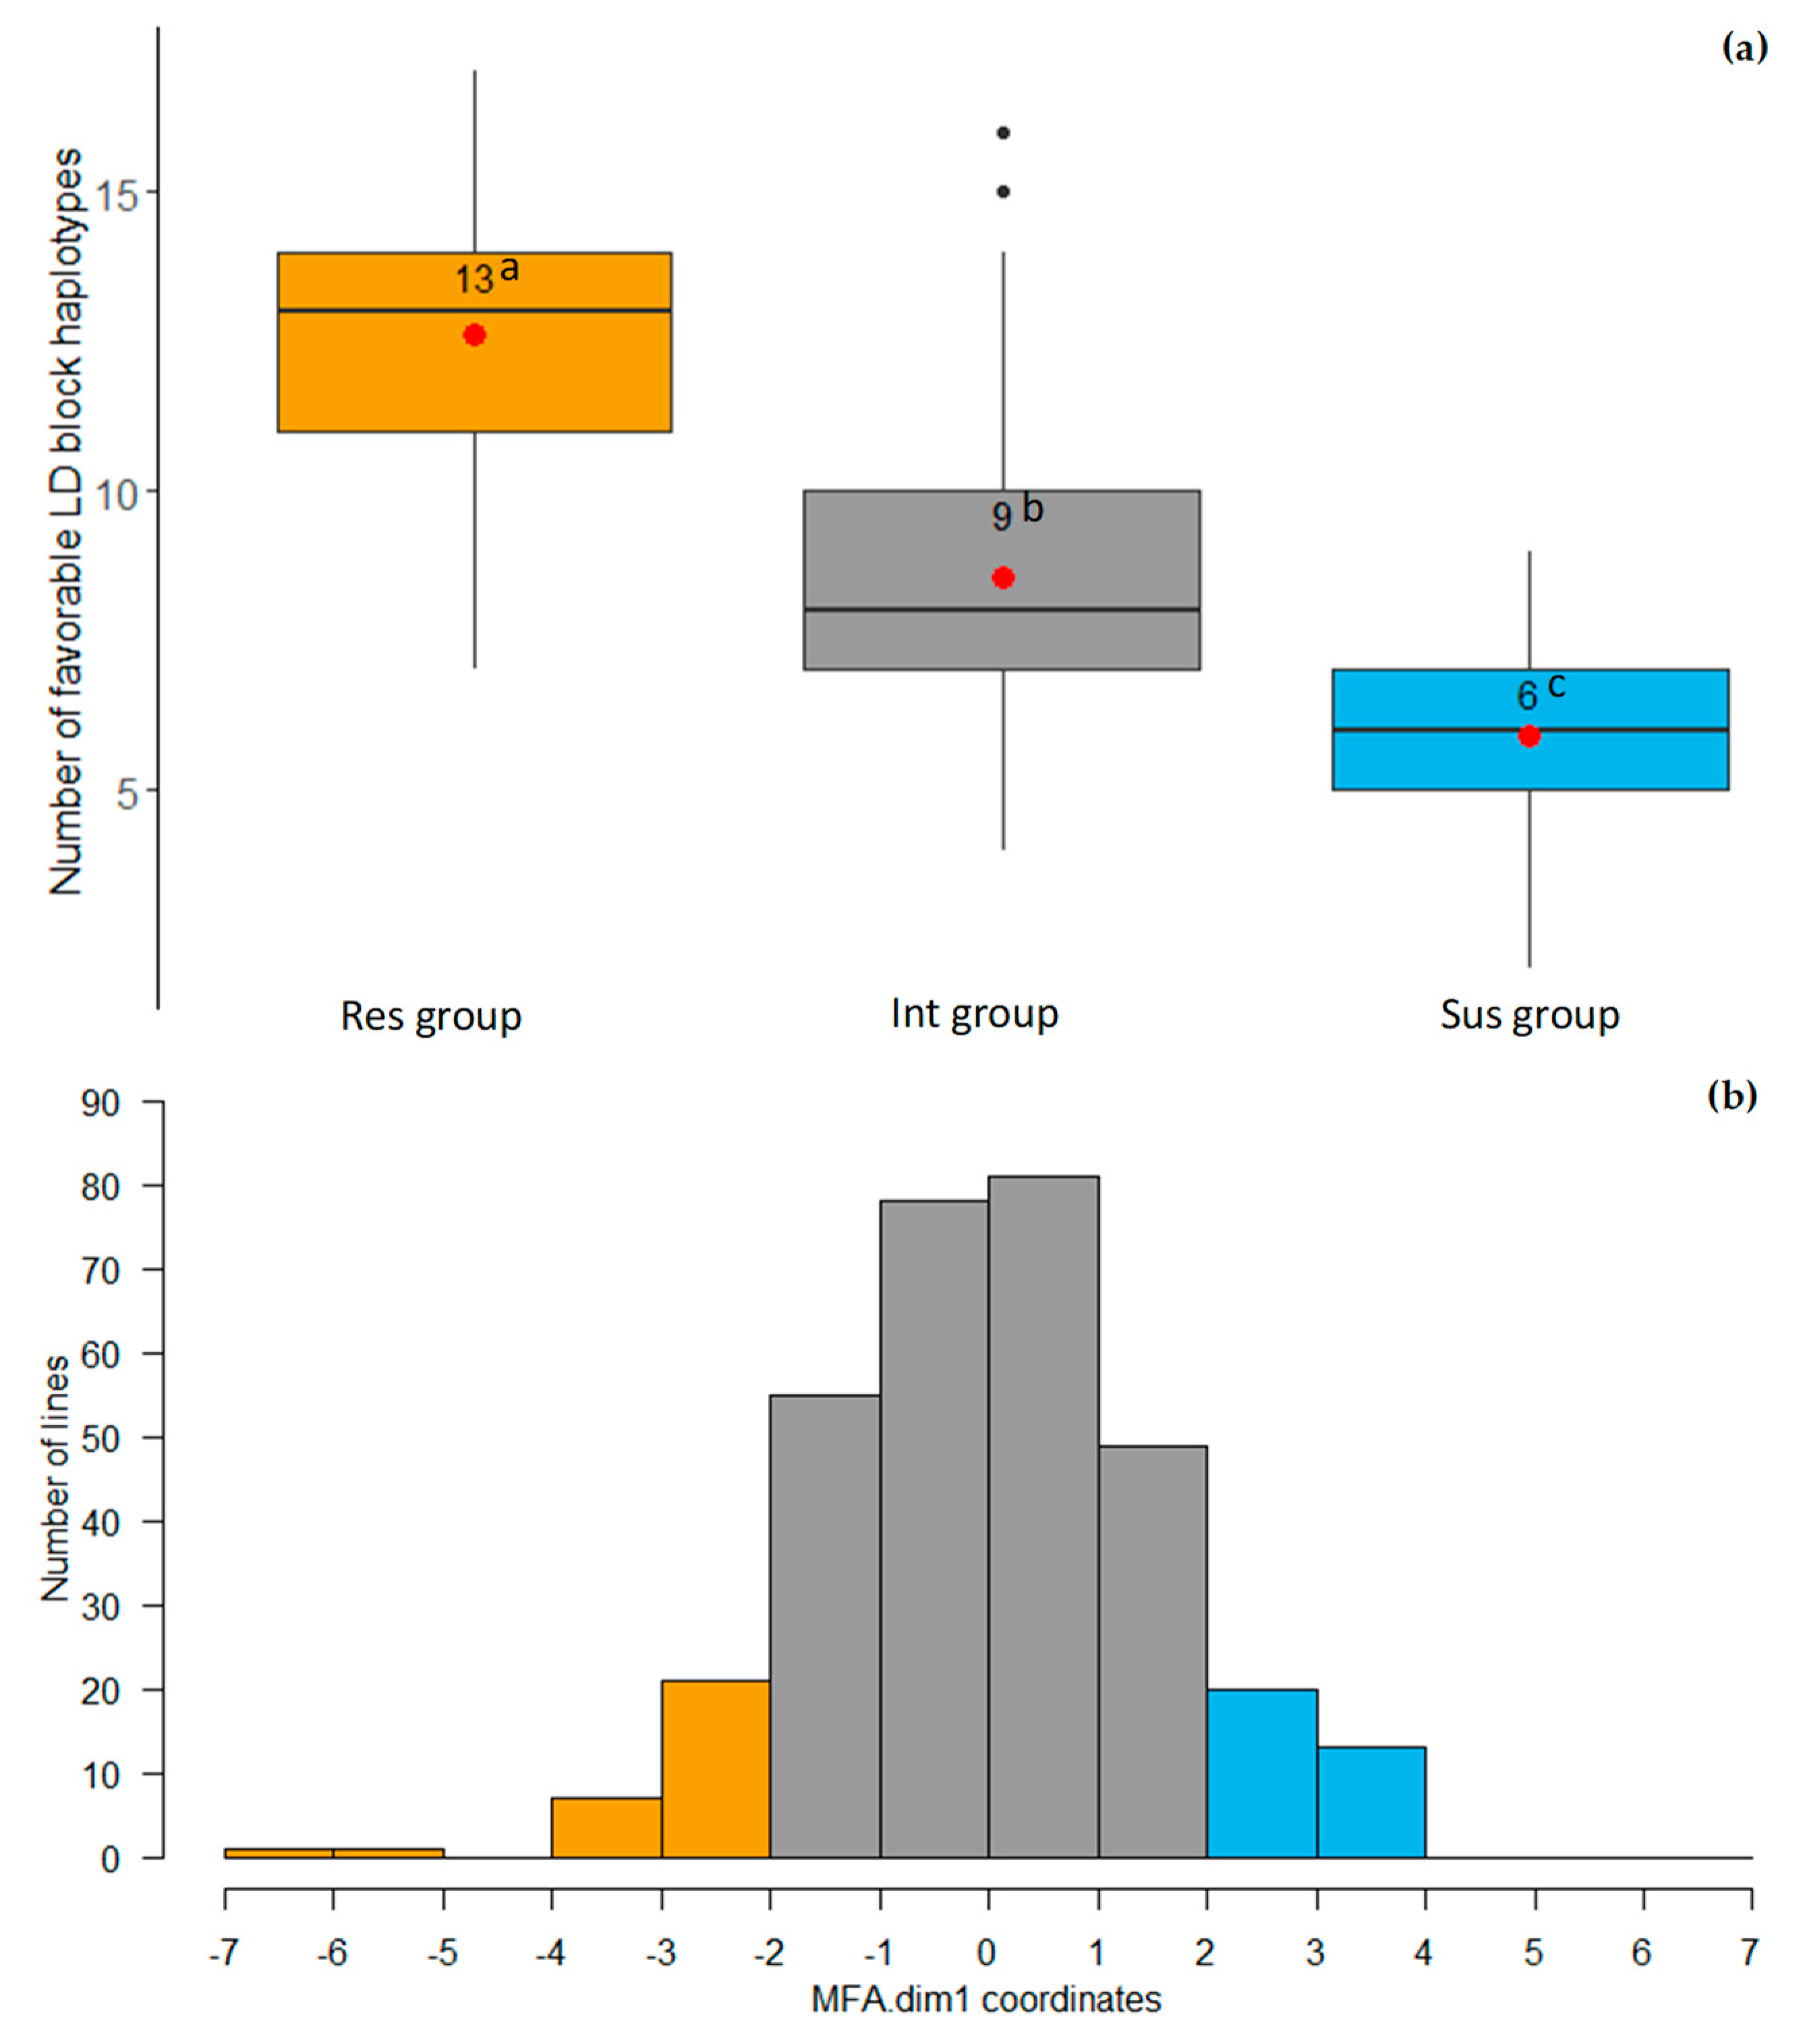
2.5. LD Block Haplotypes

Thirty-three LD blocks were identified containing all the markers in LD r2 > 0.5 with marker-trait associations (MTAs). Three to 13 haplotypes were detected within each of the LD blocks. Twenty-seven favorable haplotypes and 30 unfavorable haplotypes were selected in accordance with comparison of phenotypic mean values between each group (Supplementary Table S3). Among the association mapping population, the ARR resistant lentil lines with multiple factor analysis coordinates (MFA.dim1) < −2 (13 favorable haplotypes on average) had a significantly higher number of favorable haplotypes than the intermediate lines (nine favorable haplotypes on average) and the susceptible lines (six favorable haplotypes on average) (Figure 3). Lentil lines ILL_1861 and ILL_4830 carried the 17 favorable LD block haplotypes, whereas PI_432237 and PI_299215 had only two favorable haplotypes (Supplementary Table S4).

2.6. QTL Clusters

According to the GWAS and the QTL mapping results, seven clusters (QTL_cluster1- QTL_cluster7) were defined on Chr 1, Chr 2, Chr 4, Chr 5, Chr 6, and Chr 7 (Figure 4), where the cluster was considered as a co-localization region consisting of at least two QTL identified using GWAS and/or QTL mapping. Among the seven clusters, five contained QTL from both GWAS and QTL mapping, whereas two (QTL_cluser1 and QTL_cluster6) were only GWAS-based clusters. Furthermore, QTL_cluster2, QTL_cluster3, QTL_cluster4, and QTL_cluster7 were major QTL clusters. QTL_cluster2 included six QTL for five traits, including two traditional phenotypic traits (RRI and AGI) and three image-derived traits (RGB.blue, RGB.saturation, and Multispectral.canopy), with a GWAS-based trait-associated SNP marker (3450_21) explaining 21% of phenotypic variance. QTL_cluster3 and QTL_cluster4, the second major clusters, each contained five QTL. QTL_cluster7 consisted of four QTL for three traits with a trait-associated marker explaining 21.4 % of phenotypic variance.

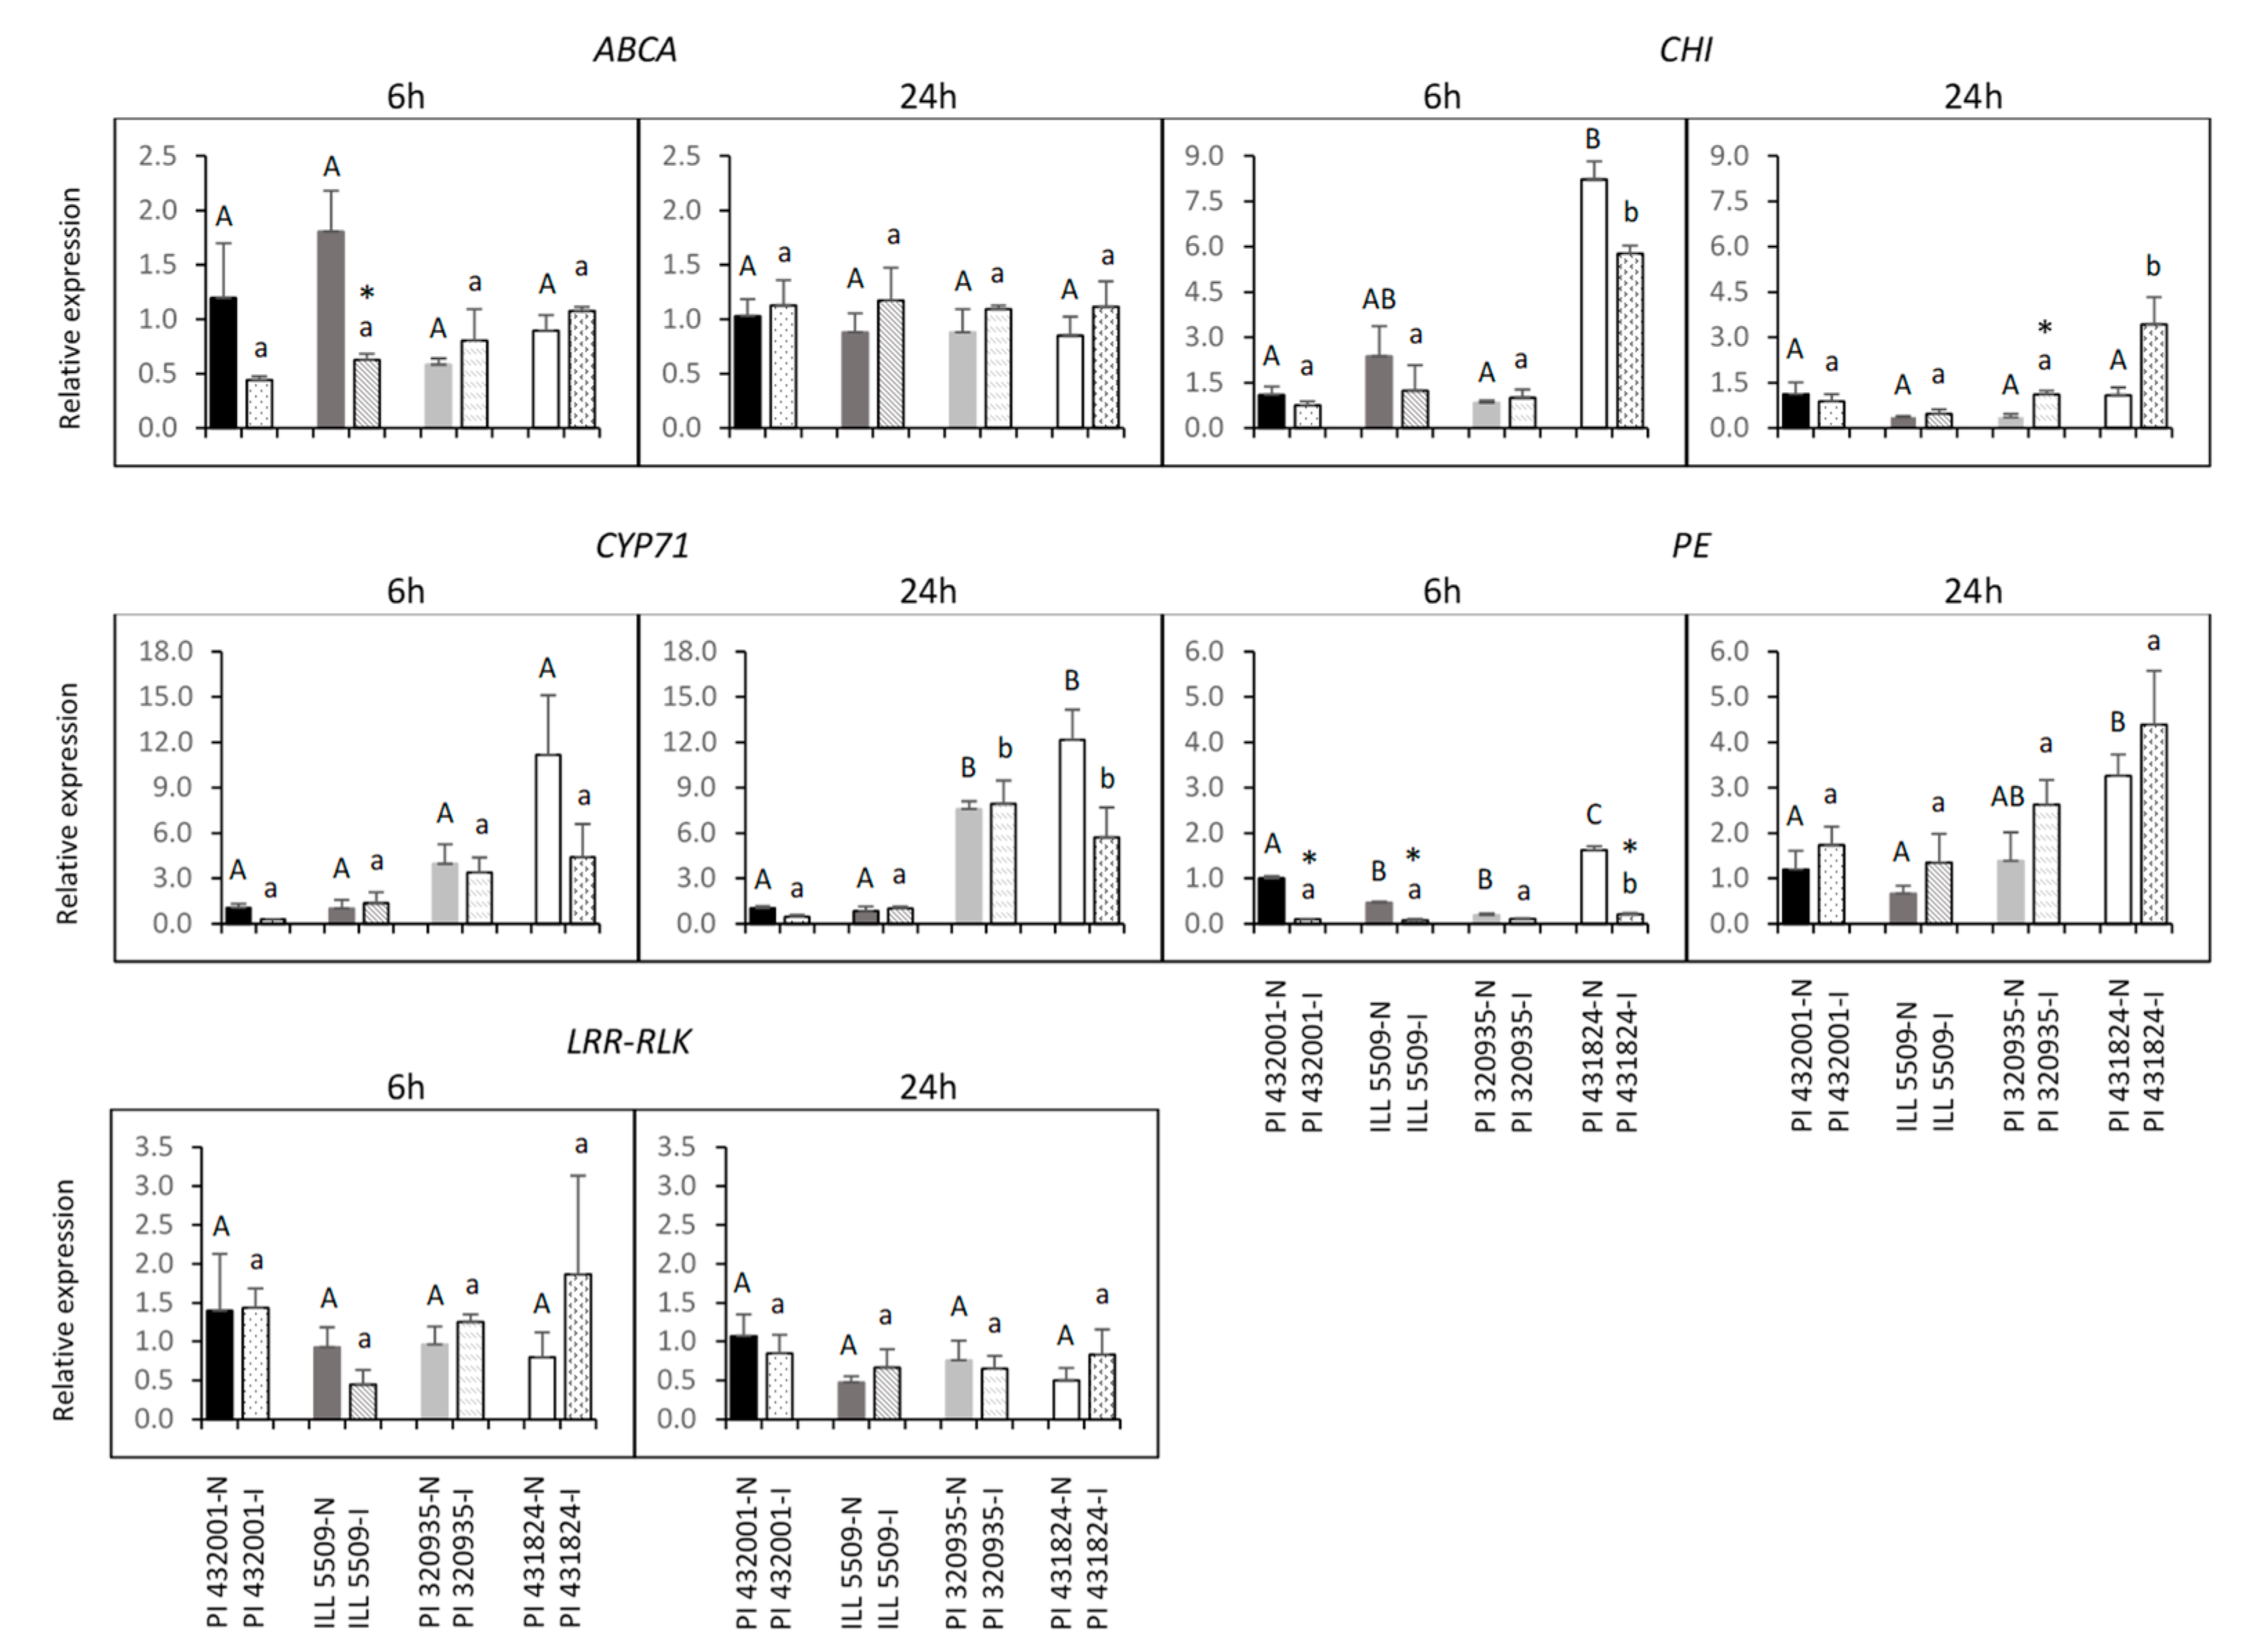
2.7. Prediction of Candidate Genes and Expression Analysis

With annotations of 106 SNPs identified in the 33 ARR-related LD blocks, 92 SNPs were located in genes, 43 of which were in coding sequences, 42 were in introns, and seven were in untranslated regions (Supplementary Table S5). In addition, 34 SNPs were discovered in the seven QTL clusters and assigned to 15 types of genes. Among these genes, five were chosen for validation, encoding Leucine Rich Repeat Receptor-like Kinase (LRR-RLK), cytochrome P450 family 71 protein (CYP71), ATP binding cassette transporter A family protein (ABCA), pectin esterase (PE), and chalcone-flavanone isomerase family protein (CHI). It was reported in previous studies that these genes are potentially associated with ARR resistance in pea [19] and Medicago [29,30].
Expression profiles of five candidate genes were examined among four lentil accessions (partially resistant accessions: PI 432001 and ILL 5509; and susceptible accessions: PI 320935 and PI 431824) during interaction with A. euteiches at 6 hpi (hours post inoculation) and 24 hpi (Figure 5). Expression of ABCA was significantly (p < 0.05) downregulated three-fold in the resistant accession ILL 5509 at 6 hpi in response to A. euteiches, while there was no significant difference (p > 0.05) between inoculated and non-inoculated plants in the resistant accession PI 432001 at the same time point. No expression polymorphism was observed in the four accessions at 24 hpi. CHI expression level was significantly up-regulated (2.8-fold) in the susceptible accession PI 320935 at 24 hpi, but there was no significant change at 6 hpi. Surprisingly, expression of CHI was much higher in the susceptible accession PI 431824 than other accessions at 6 hpi under both inoculated and non-inoculated conditions. Expression of CYP71 was higher in the susceptible accessions than resistant accessions at 24 hpi, but no significant expression difference was observed between inoculated and non-inoculated plants in any of the accessions. It indicated that such expression differences are ecotype-specific and may not relate with ARR disease. PE was more dramatically suppressed in the resistant accessions PI 432001 (10-fold) and ILL 5509 (five-fold) than the susceptible accession (two-fold) at 6 hpi, but the gene expression level was significantly downregulated (eight-fold) in the susceptible accession PI 431824. Expression of LRR-RLK was unchanged in the four accessions at both time points. The quantitative reverse transcriptase-polymerase chain reaction (qRT-PCR) analysis revealed that ABCA, CHI, and PE were differentially expressed after A. euteiches inoculation, and two, ABCA and PE, may be associated with ARR resistance. CYP71 and LRR-RLK may not be directly linked to this disease.

3. Discussion

Genetic and genomic resources for lentil have been limited due to its relatively large genome size (~4.2 GB) [31]. However, with the emerging technologies in DNA sequencing, this is changing rapidly, including online access to the lentil reference genome for lentil cultivar CDC Redberry [20], an exome capture set for lentil [2], and assorted GBS data sets [32,33,34,35]. In this study, we demonstrated the first QTL mapping and GWAS in lentil to decipher the genetic basis of resistance to a major root disease, ARR, by evaluating two types of populations using advanced phenotyping and genotyping technologies. With the RIL population derived from two distinct parents and the association mapping population with a very wide genetic diversity, the two complementary QTL analysis approaches enabled us to precisely detect natural variations underlying this complex trait. We utilized GBS to discover novel SNPs for both populations, which significantly enhanced the genetic and the genomic resources available to help overcome the devastating impact of ARR in lentil production. Utilizing an advanced imaging-based phenotyping technology, we conducted the QTL analysis with image-derived features along with traditional phenotypic traits. Finally, our study reported novel QTL for resistance to ARR in lentil, pinpointed favorable haplotypes in the resistance lines, and identified putative candidate genes associated with ARR resistance.
ARR is a complex polygenic trait with low heritability and is strongly affected by the environment [36,37]. Our study supports the observations of previous studies showing heritability ranged from 0.05 to 0.73 in the two mapping populations. With climate and soil structure as well as microbiome variations present in the field condition, the heritability shown in the field was lower than in the controlled conditions. In addition, a relatively low correlation was detected between these two conditions, as was also observed in the study of Pilet-Nayel et al. [38]. To effectively and precisely capture resistance variations among all the lentil lines and accessions, we integrated high-throughput phenotyping with RGB imaging and unmanned aerial system-based multispectral imaging in this study. With strong and significant correlations discovered between the image-derived traits and traditional phenotypic traits, the high-throughput phenotyping technology is considered an excellent alternative tool to phenotype this complex trait.
QTL and association mapping approaches have proven to be complementary to and effective in detecting QTL across many species [39,40,41]. In the present study, we identified 19 QTL-mapping-based QTL and 38 GWAS-based QTL. Notably, limited co-localizations occurred among QTL discovered in the RIL population and the association mapping population. This highlighted the importance of integrating QTL mapping and association mapping for a comprehensive assessment of ARR resistance QTL. Seven QTL clusters were detected with at least two co-localized QTL found through GWAS and/or QTL mapping. Five clusters were both GWAS-based and QTL-mapping-based QTL. It is noteworthy that QTL_cluster2 on chromosome 2, QTL_cluster3 on chromosome 4, QTL_cluster4 on chromosome 5, and QTL_cluster7 on chromosome 7 accumulated the most QTL and explained large portions of the phenotypic variance. Interestingly, the majority of QTL within QTL_cluster2 were detected in the RIL population in both environments, but only one GWAS-based QTL for an image-derived trait (RGB.saturation) co-localized within this region. The saturation channel is in accordance with the pureness or the depth of certain colors that are difficult to detect with human eyes [42]. To some extent, therefore, the color features derived from imaging technology captured more information than the traditional traits, since RRI and AGI are subjective, and SDL and RDL are surrogate traits that may not be accurate when the disease symptoms have not been fully developed.
With various molecular events underlying quantitative disease resistance, limited resistance QTL have been cloned, and resistance genes are largely unknown [43,44]. Diverse mechanisms underlying resistance QTL involve plant-pathogen recognition, signal transduction, plant development, and basal defense [44,45]. In our study, we explored five putative candidate genes selected from the QTL clusters using qRT-PCR. A putative candidate gene, ABCA, discovered in QTL_cluster7, was repressed in one of the resistant accessions at an early stage of infection. ABCA is a subfamily of ABC, one of the largest families of membrane proteins, and plays an important role in hormone transport, secondary metabolites, xenobiotics, and pathogen responses [46]. The functions of the plant ABCA protein subfamily are currently not well known. It was reported that AtABCA1 functions in pollen germination and seed maturation germination in Arabidopsis thaliana [47,48] and SlABCA1 are associated with secretion activity in tomato roots [49]. A transcriptome analysis of M. truncatula reported that genes encoding ABC transporters were significantly detected at one day post inoculation (dpi) with A. euteiches in both resistant and susceptible lines and repressed at 6 dpi only in the resistant line [30]. The findings in this M. truncatula study reflect the importance of ABCA as well, but the expression differences were observed at a later stage of infection. Further gene functional analysis, therefore, is essential to validate ABCA in response to A. euteiches in a future study.
We also identified a putative gene encoding PE in QTL_cluster7. Pectin is a critical component of plant cell walls, considered to be the first external barrier against pathogens [50]. PE is a cell wall degrading enzyme and has an important role in cell wall modification and breakdown by catalyzing pectin into pectate and methanol [51]. It was found that pectin methylesterase inhibitors enhance resistance to Verticillium wilt in cotton [52], Fusarium graminearum and Bipolaris sorokiniana in wheat [53], and Botrytis cinerea in Arabidopsis [54]. In addition, in a previous GWAS, PE was identified underlying a QTL associated with ARR resistance in pea [19]. In this study, we found that the expression of PE was more suppressed in the resistant accessions than one of the susceptible accessions (PI 320935) at 6 hpi but not in the other susceptible accession (PI 431824). Additional resistant and susceptible accessions, therefore, should be included in further gene expression studies to better clarify this conclusion.
The other three genes, CYP71, CHI, and LRR-RLK, identified in QTL clusters may not be directly associated with the ARR resistance. For CYP71, expression differences were only elucidated between susceptible accessions and resistant accessions at 24 hpi but not between inoculated and non-inoculated plants in any of the accessions. This indicates that such gene expression differences could be ecotype-specific, and this gene may not play a direct role in response to A. euteiches. As for the second gene, CHI is a key gene in plant flavonoid biosynthesis, and flavonoids have been shown to be very important in plants’ resistance to pathogens [55,56]. Furthermore, in the transcriptome analysis of M. truncatula’s response to A. euteiches, flavonoid biosynthesis-related genes encoding chalcone synthase, chalcone O-methyltransferases, and isoflavonol reductase were significantly detected in resistant genotypes at 6 dpi [30]. In our study, however, we found CHI expression level was significantly upregulated in one of the susceptible accessions at 24 hpi. This result, inconsistent with previous studies, did not provide us enough assurance of CHI’s relatedness with ARR resistance. For the third gene, LRR-RLK expression was not changed in any of the accessions at either time point, indicating this gene may not be associated with ARR at an early stage of infection.

4. Materials and Methods

4.1. Plant Materials

An RIL population was developed from a cross between a breeding line (K192-1) with high partial resistance and a susceptible breeding line (K191-2). The two parents were selected from an ARR nursery in a farmer’s field near Kendrick, Idaho. The cross was made in Pullman, WA in 2013 and advanced using single-seed decent to the F6 generation. The final population contained 189 RILs and the two parents.
The association mapping population consisted of 326 accessions from 60 countries on four continents, Asia (166), Europe (76), the Americas (47), Africa (30), and unknown origin (7). Among them, 109 accessions were from ICARDA, and 217 accessions were from the LSP collection obtained from the Western Regional Plant Introduction Station, USDA-ARS (Supplementary Table S6).

4.2. Inoculation Precedure

A pure culture of A. euteiches, isolate Ae-16-04D, belonging to Pathotype I (personal communication with Dr. Julie S. Pasche) was used in all controlled conditions. Prior to sowing, lentil seeds were surface sterilized in 95% ethanol for one minute followed by 10% bleach for one minute and then rinsed in distilled water. The seeds were individually planted in 8.25 cm deep Cone-tainers (Stuewe & Sons, Tangent, OR, USA) filled with perlite medium (AFCO Distribution & Milling, Spokane Valley, WA, USA). In order to produce the zoospores required for inoculation, the A. euteiches isolate was grown in pea broth and incubated in the dark at room temperature for six days. Mycelia mats were then removed from the pea broth, rinsed three times in distilled water, and incubated in mineral nutrient solution (0.26% CaCl2⋅2H2O, 0.49 MgSO4⋅7H2O, and 0.074% KCl) for 16 h to induce zoospore production [57]. The concentration of zoospores was calculated with a hemocytometer and adjusted to 104 spores/mL. Fourteen-day old seedlings were inoculated with the zoospore suspension by pipetting 2 mL of inoculum at the base of each plant’s stem. The non-inoculated controls were “inoculated” with 2 mL of sterile distilled water.

4.3. Traditional and Image-Based Phenotyping under Controlled Condition

The RIL population and the association mapping population were evaluated in controlled conditions (25 °C 16 h/23 °C 8 h). The RIL population was planted using a completely randomized design with three inoculated replications and three non-inoculated replications (three plants/genotype/replication/treatment). The association mapping population was planted under the same controlled conditions in a randomized complete block design with 10 inoculated replications and 10 non-inoculated replications (one plant/genotype/replication/treatment).
At 14 dpi with A. euteiches, plants were uprooted, and RRI was determined by assessing roots using a 0 (healthy plants) to 5 (dead plants) scoring scale adapted from McGee et al. [17]. Each entire plant was imaged using an RGB digital camera (Canon PowerShot SX530 HS, Canon U.S.A. Inc., Huntington, NY, USA), where one shoot feature (Shoot.projected.area-total number of pixels of shoots) and three root features (Root.projected.area-total number of pixels of roots, RGB.blue, and RGB.saturation) were extracted using MATLAB (MathWorks Inc., Natick, MA, USA), adopted from Marzougui et al. [58]. Shoots and roots were subsequently separated and placed in a forced-air drying room for seven days prior to collecting dry weights. As a surrogate measure of resistance, the dry weight loss of the inoculated vs. the non-inoculated plants was calculated. SDL and RDL were calculated with SDL/RDL = (dry weight per plant of non-inoculated treatment—dry weight per plant of inoculated treatment) / dry weight per plant of non-inoculated treatment. Subsequently, SDL and RDL were recorded using a 1 to 5 scoring scale, where 1 = greater than 100% of normal growth, 2 = 76–100% of normal growth, 3 = 51–75% of normal growth, 4 = 26–50% of normal growth, and 5 = 0–25% of normal growth [59]. In addition, RGB.SPL and RGB.RPL were calculated using the SDL/RDL formula described above and thereafter recorded via the same scale.

4.4. Traditional and Image-Based Phenotyping under Field Condition

The RIL population was assessed for Aphanomyces resistance in a naturally infested field near Kendrick, Idaho. The 173 RIL lines were planted using a randomized complete block design with three replications, 30 seeds/genotype/replicate. An adjacent susceptible control (Avondale) was planted every four lines and used to adjust for local disease variation using the formula as described in [60]. The plants were evaluated at flowering stage using AGI with a 1 (healthy plants) to 5 (dead plants) scoring scale adapted from Hamon et al. [60]. Aerial images were collected on the same day using a quadcopter unmanned aerial system (AgBot, ATI Inc., Oregon City, OR, USA) with a five-band multispectral camera (RedEdgeTM, Micasense Inc., Seattle, WA, USA). Two features, Multispectral.NDVI and Multispectral.canopy, were extracted from the images [58].

4.5. Genotyping

Total DNA were extracted from each lentil accession using the DNeasy 96 Plant Kit (QIAGEN, Valencia, CA, USA) from approximately 0.1 g of young leaf tissue collected from fourteen-day old plants grown in controlled conditions (25 °C 16 h/23 °C 8 h). DNA concentration was quantified using a NanoDrop ND-1000 spectrophotometer (Nano-Drop Technologies, Wilmington, DE, USA) following the manufacturer’s instructions and normalized to 50 ng/µl. GBS libraries were constructed using the two-enzyme approach described in Poland et al. [61] with minor modifications. Five hundred ng of DNA from each line was digested with the two restriction enzymes, PstI and MspI, followed by ligation using 48 barcode adapters with 4–9 bp sequence [61]. Then, 5 µl of ligated DNA from each line was multiplexed in a single tube and then cleaned up using AMPure XP beads (Beckman Coulter, High Wycombe, UK). The multiplexed DNA was amplified using Illumina primers followed by purification. The GBS libraries of the association mapping population were sequenced on an Illumina HiSeqTM 2500 platform using single-read 100 bp at the Washington State University Genomics Core Lab. The GBS libraries of the RIL population were sequenced on an Illumina HiSeqTM 4000 platform using paired-end reads 150 bp long at Novogene Bioinformatics Technology Co., Ltd, Beijing, China.
Two reference-based GBS pipelines, Stacks and FreeBayes, were used for SNP discovery of the association mapping population and RIL population, respectively. For the Stacks pipeline (the association mapping population), raw sequencing reads with intact barcodes were demultiplexed, cleaned, and truncated to 80 bp with the process_radtags function in Stacks (v 2.0) [62]. Demultiplexed reads were then aligned to the lentil reference genome pre-release v1.2 [20] using the Burrows–Wheeler Aligner [63]. Aligned sequences were filtered using SAMtools (v 0.1.19) [64] to discard multiple mapped reads. SNPs were called using ref_map.pl function with default parameters. For the FreeBayes pipeline (the RIL population), raw reads were demultiplexed and cleaned with process_radtags in Stacks, followed by aligning to the lentil reference genome with Burrows–Wheeler Aligner. SAMtools was used to convert Sequence Alignment Map (SAM) files to Binary Alignment Map (BAM) files, sort the BAM files, and discard the multiple mapped reads. Read groups were added to BAM files using Picard (v 2.18). SNPs were called using Freebayes (v1.2) [65] using the following parameters: —min-base-quality 20, —read-mismatch-limit 2, —min-coverage 10, —no-indels, —genotype-qualities, —ploidy 2, —no-mnps, —no-complex. Using an in-house Perl script, the polymorphic SNPs between two parents were kept, whereas the SNPs with unknown and heterozygous genotypes in one or two of the parents were filtered out. To filter the SNPs for further analysis, VCFtools (v 0.1.16) [66] was used for both GBS pipelines with the following criteria: 1) the association mapping population: MAF > 0.05, missing values < 0.3; 2) the RIL population: MAF > 0.3, missing values < 0.2. For the SNP dataset of the association mapping population, the filtered SNPs were imputed using BEAGLE (v 3.3.2) [67].

4.6. Statistical Analysis of Phenotypic Data

The trait data of the RIL population and the association mapping population were analyzed by ANOVA using ordinal logistic regression (R function polr of MASS package [68]) for categorical variables and general linear model (R function lm of stats package and R function lmer of lme4 package [69]) for numerical variables with genotype as a fixed effect and replication as a random effect by the R 3.5.1 program [70]. The normality of residuals was tested using Skewness, Kurtosis, and Shapiro–Wilk tests (R function describe of psych package; shapiro.test). Frequency distribution histograms of mean values of each trait were drawn by the R function hist. The broad-sense heritability (H2) was calculated as H2   =  σG 2/[σG 2 + σe 2/r], where σG 2  =  genotypic variance, σe 2  =  error variance, and r  =  number of replicates. Pearson’s correlation coefficients were calculated between each trait within each population (R function cor), and heatmaps of Pearson’s correlation coefficients were drawn using the R function corrplot.

4.7. Linkage Map Construction and QTL Mapping

The genetic linkage map was made using the Kosambi mapping function [71] in the R OneMap package [72] with an LOD value of 6 and a recombination frequency less than 0.3. The recombination counting and ordering algorithm was used for ordering the SNPs. QTL were identified with QTL Cartographer 2.5 software (North Carolina State University, Raleigh, NC, USA) [73] using the composite interval mapping method. Significant QTL were determined by two levels of LOD thresholds: (1) LOD > LODthreshold for nominal QTL, where LODthreshold was calculated for each ARR resistance trait by permutation tests (1000 times) at a p value of 0.05; (2) 2.5 < LOD < LODthreshold for suggestive QTL. Mapchart (V 2.2) was used to draw the linkage map and place the QTL.

4.8. LD, Population Structure, and GWAS

Pairwise LD in the form of r2 between SNPs was estimated within each chromosome using Haploview (v 4.2) [74]. The LD decay curve was assessed using the method of Hill and Weir [75] in R 3.5.1 program [70] with ( r 2 ) = [ 10 + C ( 2 + C ) ( 11 + C ) ] [ 1 + ( 3 + C ) ( 12 + 12 C + C 2 ) n ( 2 + C ) ( 11 + C ) ] , where n is sample size, and C indicates the product of the recombination parameter (4Ner) and the genetic distance. The LD decay rate over each chromosome was measured at r2 = 0.5. Population structure was estimated using PCA and kinship relatedness matrix generated from MLM in the Genome Association and Prediction Integrated Tool (GAPIT) R package [76]. A three-dimensional PCA plot was drawn using a plot3d function of rgl package in R program. A kinship relatedness matrix was calculated with the VanRaden algorithm in GAPIT.
GWAS was performed using a multi-locus model, FarmCPU [77], implemented in the R package FarmCPU. SNPs with missing values < 0.3 and MAF > 0.05 were used to perform GWAS in the association mapping population. The first three PCs were used as covariates in this model. The MTAs were assessed by three levels of p values: (1) experiment-wise p < 2.2 × 10⁻⁶ (−log10 p > 5.7) for major MTAs; (2) marker-wise p < 0.0001 (−log10 p > 4) for nominal MTAs; (3) marker-wise p < 0.001 (−log10 p > 3) for suggestive MTAs. The experiment-wise threshold was set according to a Bonferroni-corrected threshold at p = 0.01 corresponded to a threshold of −log10 (α/n) > 5.7, with α = 0.01 and n = 4558, the number of markers. The LD blocks were defined using a four gamete rule algorithm [78] in Haploview (v 4.2) [74].

4.9. Haplotype Analysis

LD haplotypes were identified among all the accessions of the association mapping population at each LD block using imputed genotypic data. For each haplotype, the phenotypic mean values were calculated for associated traits in a given LD block. The Tukey-HSD test (α = 5%) was used to perform multiple mean comparisons among haplotypes in each LD block. Favorable and unfavorable haplotypes were defined as follows: (1) carrying favorable and unfavorable alleles; (2) representing more than seven lentil accessions (2% of total number of lentil accessions); (3) showing significantly higher or lower values than other haplotypes. Each accession was thereafter described for the number of favorable and unfavorable alleles in each LD block. To classify all the lentil accessions into three groups (resistant-Res, intermediate-Int, susceptible-Sus), a multiple factor analysis (MFA) was performed for the associated traits (RRI, RDL, RGB.blue, RGB.saturation, and RGB.RPL) using the R package FactoMineR [79]. The Res group included the accessions with MFA.dim1 < −2, whereas the Int group and the Sus group referred to −2 < MFA.dim1 < 2 and MFA.dim1 > 2, respectively. A Tukey-HSD test was used to compare the mean numbers of favorable alleles in the three groups.

4.10. Prediction of Candidate Genes and Expression Analysis

The lentil reference genome pre-release v1.2 (http://knowpulse.usask.ca) was used to predict putative genes in each LD block. Putative protein functions were assigned to the SNPs underlying the putative genes. To validate the response of each candidate gene to ARR, expression levels of the genes were explored using qRT-PCR. Briefly, the seeds of two partially resistant accessions (PI 432001 and ILL 5509) and two susceptible accessions (PI 320935 and PI 431824) were grown in moist autoclaved ragdolls in a controlled condition (25 °C 16 h/23 °C 8 h). The roots of seven-day-old lentil seedlings were incubated in 50 mL A. euteiches zoospore suspension (104 spores/ ml) for 30 min or in 50 mL autoclaved distilled water for 30 min, followed by harvesting at 6 hpi and 24 hpi. Each treatment was carried out in three replications consisting of 10 lentil roots. The roots were cut about 2 cm from the tips and stored at −80 °C. Total RNA was extracted using RNeasy Plant Mini Kit (Qiagen, Hilden, Germany) followed by DNAse treatment using Turbo DNA-freeTM kit (Ambion, Austin, TX, USA). cDNA was synthesized from total RNA of each sample using the High-Capacity cDNA Reverse Transcription Kit with RNase Inhibitor (Applied Biosystems, Foster City, CA, USA). qRT-PCR was performed in 10 µl reaction volumes with 2 µl of diluted cDNA (20x dilution for LRR-RLK, ABCA, and CHI; 4x dilution for CYP71 and PE), 500 nM of each primer, and 5 µl SsofastTM EvaGreen supermix (Bio-Rad Laboratories Inc., Hercules, CA, USA). The qRT-PCR reactions were conducted on Bio-Rad CFX96 Real-Time PCR System (Hercules, CA, USA) using the following conditions: 95 °C for 1 min, 40 cycles of 95 °C for 5 s, and 60 °C for 20 s. Melting curve analysis was performed by increasing the temperature from 65 °C to 95 °C in increments of 0.5 °C for 5 s. qRT-PCR primers were designed for targeted lentil genes to amplify amplicons using Primer 3 (v 0.4.0) [80] (Supplementary Table S7). Each qRT-PCR reaction was replicated two times for each biological replicate in each treatment. Relative expression values for target genes were calculated using the 2 C T method [81], and the expression of ß-tubulin-3 was used for normalization [82].

5. Conclusions

Taken together, this two-pronged approach based on linkage analysis and association mapping enabled us to dissect comprehensively the genetic architecture of ARR resistance in lentil. In this study, we identified 19 QTL-mapping-based QTL and 38 GWAS-based QTL using both traditional phenotyping traits and image-derived features. Seven QTL clusters were discovered on six chromosomes. Gene expression analysis used to explore five putative candidate genes indicated three of them (ABCA, CHI, and PE) were differentially expressed at early stages of infection, and two of them (ABCA and PE) may be associated with ARR resistance. This study provides valuable genomic resources to aid the development of lentil varieties resistant to ARR. Future functional analyses of the candidate genes will enable us to illustrate more completely the molecular mechanisms in lentil for ARR resistance.

Supplementary Materials

Supplementary materials can be found at https://www.mdpi.com/1422-0067/21/6/2129/s1. Figure S1. Frequency distribution of ARR resistance traits in the RIL population and the association mapping population; Figure S2. Linkage disequilibrium decay in the association mapping population; Table S1. Summary of raw sequencing data for the RIL population and the association mapping population; Table S2. Distribution of SNPs on a linkage map for the RIL population; Table S3. Description of LD block haplotypes in the association mapping population; Table S4. LD block haplotype distribution of the association mapping population; Table S5. Putative annotation of SNPs in detected LD blocks; Table S6. Description of the association population; Table S7. Primers used for qRT-PCR in this study.

Author Contributions

Conceptualization, Y.M., C.J.C., D.M. (Dorrie Main) and R.J.M.; Data curation, Y.M. and A.M.; Formal analysis, Y.M.; Funding acquisition, C.J.C., D.M. (Dorrie Main) and R.J.M.; Investigation, Y.M., A.M., D.M. (Deus Mugabe), J.A.S., C.Z., M.N.A. and N.R.; Methodology, Y.M., C.J.C., D.M. (Dorrie Main), S.S. and R.J.M.; Project administration, Y.M., C.J.C., D.M. (Dorrie Main) and R.J.M.; Resources, C.J.C., D.M. (Dorrie Main), L.D.P., S.P.F. and R.J.M.; Supervision, C.J.C., D.M. (Dorrie Main), S.S. and R.J.M.; Visualization, Y.M.; Writing—original draft, Y.M.; Writing—review & editing, Y.M., A.M., C.J.C., S.S., D.M. (Dorrie Main), L.D.P., D.M. (Deus Mugabe), J.A.S., C.Z., M.N.A., N.R., S.P.F. and R.J.M. All authors have read and agreed to the published version of the manuscript.

Funding

This research was funded by Washington State Department of Agriculture, grant number K1983.

Acknowledgments

We acknowledge Britton Bourland, Mary A. Lauver, Emma Cordrey, Paola L. Flores, Maria Jose Gonzalez Bernal, Deah C. McGaughey, Crystal Jamison, Lydia Fields, and Juan Quiros for their assistance during data collection. We would like to thank the Lentil Genome Sequencing (LenGen) Project leaders (Kirstin E. Bett and Douglas R. Cook) and the researchers responsible for generating the lentil genome reference data.

Conflicts of Interest

The authors declare no conflict of interest.

Abbreviations

ARRAphanomyces root rot
LDLinkage disequilibrium
GBSGenotyping by sequencing
SNPSingle nucleotide polymorphism
QTLQuantitative trait loci
LSPLentil single plant-derived
ICARDAInternational Center for Agricultural Research in the Dry Areas
RILRecombinant inbred line
RGBRed-Green-Blue
RRIRoot rot index
AGIAbove ground index
SDLShoot dry weight loss per plant
RDLRoot dry weight loss per plant
RGB.SPLNumber of pixels loss per plant in shoot
RGB.RPLNumber of pixels loss per plant in root
RGB.blueAverage intensity of blue channel
RGB.saturationStandard deviation of saturation channel
Multispectral.NDVIStandard deviation of normalized difference vegetation index
Multispectral.canopyCanopy area
MAFMinor allele frequency
ANOVAAnalysis of variance
PCAPrinciple component analysis
PCsPrinciple components
GAPITGenome Association and Prediction Integrated Tool
MTAsMarker-trait associations
MFAMultiple factor analysis
qRT-PCRQuantitative reverse transcriptase-polymerase chain reaction
hpiHours post inoculation
dpiDays post inoculation
LRR-RLKLeucine Rich Repeat Receptor-like Kinase
CYP71Cytochrome P450 family 71 protein
ABCAABC transporter A family protein
PEPectin esterase
CHIChalcone-flavanone isomerase family protein
SAMSequence Alignment Map
BAMBinary Alignment Map

References

  1. FAO, FAOSTAT. Available online: http://www.fao.org/faostat/en/#data (accessed on 4 January 2018).
  2. Ogutcen, E.; Ramsay, L.; von Wettberg, E.B.; Bett, K.E. Capturing variation in Lens (Fabaceae): Development and utility of an exome capture array for lentil. Appl. Plant Sci. 2018, 6, 1165. [Google Scholar] [CrossRef] [PubMed] [Green Version]
  3. Gaulin, E.; Jacquet, C.; Bottin, A.; Dumas, B. Root rot disease of legumes caused by Aphanomyces euteiches. Mol. Plant Pathol. 2007, 8, 539–548. [Google Scholar] [CrossRef] [PubMed]
  4. Malvick, D.K.; Grau, C.R.; Percich, J.A. Characterization of Aphanomyces euteiches strains based on pathogenicity tests and random amplified polymorphic DNA analyses. Mycol. Res. 1998, 102, 465–475. [Google Scholar] [CrossRef]
  5. Tofte, J.; Smith, R.; Grau, C. Reaction of red clover to Aphanomyces euteiches. Plant Dis 1992, 76, 39–42. [Google Scholar] [CrossRef]
  6. Wu, L.; Chang, K.F.; Conner, R.L.; Strelkov, S.; Fredua-Agyeman, R.; Hwang, S.F.; Feindel, D. Aphanomyces euteiches: A threat to Canadian field pea production. Engineering 2018, 4, 542–551. [Google Scholar] [CrossRef]
  7. Moussart, A.; Even, M.; Tivoli, B. Reaction of genotypes from several species of grain and forage legumes to infection with a French pea isolate of the oomycete Aphanomyces euteiches. Eur. J. Plant Pathol. 2008, 122, 321–333. [Google Scholar] [CrossRef]
  8. Malvick, D.; Percich, J. Identification of Pisum sativum germ plasm with resistance to root rot caused by multiple strains of Aphanomyces euteiches. Plant Dis. 1999, 83, 51–54. [Google Scholar] [CrossRef] [Green Version]
  9. Levenfors, J.P.; Wikström, M.; Persson, L.; Gerhardson, B. Pathogenicity of Aphanomyces spp. from different leguminous crops in Sweden. Eur. J. Plant Pathol. 2003, 109, 535–543. [Google Scholar] [CrossRef]
  10. Kraft, J.; Tuck, J.; Kaiser, W. Assessment of lentil PI lines as source of relative resistance to common root rot, 1985. Biol. Cult. Tests Cont. Plant Dis. 1987, 2, 12. [Google Scholar]
  11. Vandemark, G.; Porter, L. First report of lentil root rot caused by Aphanomyces euteiches in Idaho. Plant Dis. 2010, 94, 480. [Google Scholar] [CrossRef]
  12. Banniza, S.; Bhadauria, V.; Peluola, C.; Armstrong-Cho, C.; Morrall, R. First report of Aphanomyces euteiches in Saskatchewan. Can. Plant Dis. Surv. 2013, 93, 163–164. [Google Scholar]
  13. Gossen, B.D.; Conner, R.L.; Chang, K.F.; Pasche, J.S.; McLaren, D.L.; Henriquez, M.A.; Chatterton, S.; Hwang, S.F. Identifying and managing root rot of pulses on the northern great plains. Plant Dis. 2016, 100, 1965–1978. [Google Scholar] [CrossRef] [PubMed] [Green Version]
  14. Chatterton, S.; Harding, M.W.; Bowness, R.; Mclaren, D.L.; Banniza, S.; Gossen, B.D. Importance and causal agents of root rot on field pea and lentil on the Canadian prairies, 2014–2017. Can. J. Plant Pathol. 2019, 41, 98–114. [Google Scholar] [CrossRef]
  15. Wu, L. Occurrence and management of root rot of field pea caused by Aphanomyces euteiches. Master Thesis, University of Alberta, Edmonton, AB, Canada, 2018. [Google Scholar]
  16. Papavizas, G.C.; Ayers, W.A. Aphanomyces species and their root diseases in pea and sugarbeet: A review. US Dep. Agric. Agric. Res. Serv. Tech. Bull. 1974, 1485, 158. [Google Scholar]
  17. McGee, R.J.; Coyne, C.J.; Pilet-Nayel, M.L.; Moussart, A.; Tivoli, B.; Baranger, A.; Hamon, C.; Vandemark, G.; McPhee, K. Registration of pea germplasm lines partially resistant to Aphanomyces root rot for breeding fresh or freezer pea and dry pea types. J. Plant Regist. 2012, 6, 203–207. [Google Scholar] [CrossRef]
  18. Wicker, E.; Rouxel, F. Specific behaviour of french Aphanomyces euteiches drechs. Populations for virulence and aggressiveness on pea, related to isolates from Europe, America and New Zealand. Eur. J. Plant Pathol. 2001, 107, 919–929. [Google Scholar] [CrossRef]
  19. Desgroux, A.; L’anthoëne, V.; Roux-Duparque, M.; Rivière, J.P.; Aubert, G.; Tayeh, N.; Moussart, A.; Mangin, P.; Vetel, P.; Piriou, C. McGee, R.J.; Coyne, C.J.; Burstin, J.; Baranger, A.; Manzanares-Dauleux, M.; Bourion, V.; Pilet-Nayel, M. Genome-wide association mapping of partial resistance to Aphanomyces euteiches in pea. BMC Genomics 2016, 17, 124. [Google Scholar] [CrossRef]
  20. Bett, K.E.; Cook, D.R. KnowPulse. Available online: https://knowpulse.usask.ca/ (accessed on 15 August 2018).
  21. Chen, C.; Mitchell, S.E.; Elshire, R.J.; Buckler, E.S.; El-Kassaby, Y.A. Mining conifers’ mega-genome using rapid and efficient multiplexed high-throughput genotyping-by-sequencing (GBS) SNP discovery platform. Tree Genet. Genomes 2013, 9, 1537–1544. [Google Scholar] [CrossRef]
  22. Ju, M.; Zhou, Z.; Mu, C.; Zhang, X.; Gao, J.; Liang, Y.; Chen, J.; Wu, Y.; Li, X.; Wang, S.; et al. Dissecting the genetic architecture of Fusarium verticillioides seed rot resistance in maize by combining QTL mapping and genome-wide association analysis. Sci. Rep. 2017, 7, 46446. [Google Scholar] [CrossRef]
  23. Liu, W.; Naruoka, Y.; Miller, K.; Garland-Campbell, K.A.; Carter, A.H. Characterizing and validating stripe rust resistance loci in US Pacific Northwest winter wheat accessions (Triticum aestivum L.) by genome-wide association and linkage mapping. The Plant Genome 2018, 11, 170087. [Google Scholar] [CrossRef] [Green Version]
  24. Zhao, X.; Han, Y.; Li, Y.; Liu, D.; Sun, M.; Zhao, Y.; Lv, C.; Li, D.; Yang, Z.; Huang, L.; et al. Loci and candidate gene identification for resistance to Sclerotinia sclerotiorum in soybean (Glycine max L. Merr.) via association and linkage maps. Plant J. 2015, 82, 245–255. [Google Scholar] [CrossRef] [PubMed]
  25. Korte, A.; Farlow, A. The advantages and limitations of trait analysis with GWAS: a review. Plant Methods 2013, 9, 29. [Google Scholar] [CrossRef] [PubMed] [Green Version]
  26. Araus, J.L.; Cairns, J.E. Field high-throughput phenotyping: the new crop breeding frontier. Trends P. Sci. 2014, 19, 52–61. [Google Scholar] [CrossRef]
  27. Hamon, C.; Coyne, C.J.; McGee, R.J.; Lesné, A.; Esnault, R.; Mangin, P.; Hervé, M.; Le Goff, I.; Deniot, G.; Roux-Duparque, M.; et al. QTL meta-analysis provides a comprehensive view of loci controlling partial resistance to Aphanomyces euteiches in four sources of resistance in pea. BMC Plant Biol. 2013, 13, 1. [Google Scholar] [CrossRef] [Green Version]
  28. Desgroux, A.; Baudais, V.N.; Aubert, V.; Le Roy, G.; de Larambergue, H.; Miteul, H.; Aubert, G.; Boutet, G.; Duc, G.; Baranger, A.; et al. Comparative Genome-Wide-Association Mapping identifies common loci controlling root system architecture and resistance to Aphanomyces euteiches in pea. Front. Plant Sci. 2018, 8, 2195. [Google Scholar] [CrossRef] [Green Version]
  29. Bonhomme, M.; André, O.; Badis, Y.; Ronfort, J.; Burgarella, C.; Chantret, N.; Prosperi, J.M.; Briskine, R.; Mudge, J.; Debellé, F.; et al. High-density genome-wide association mapping implicates an F-box encoding gene in Medicago truncatula resistance to Aphanomyces euteiches. New Phytol. 2014, 201, 1328–1342. [Google Scholar] [CrossRef]
  30. Badis, Y.; Bonhomme, M.; Lafitte, C.; Huguet, S.; Balzergue, S.; Dumas, B.; Jacquet, C. Transcriptome analysis highlights preformed defences and signalling pathways controlled by the prAe1 quantitative trait locus (QTL), conferring partial resistance to Aphanomyces euteiches in Medicago truncatula. Mol. Plant. Pathol. 2015, 16, 973–986. [Google Scholar] [CrossRef]
  31. Sharpe, A.G.; Ramsay, L.; Sanderson, L.A.; Fedoruk, M.J.; Clarke, W.E.; Li, R.; Kagale, S.; Vijayan, P.; Vandenberg, A.; Bett, K.E. Ancient orphan crop joins modern era: gene-based SNP discovery and mapping in lentil. BMC Genomics 2013, 14, 192. [Google Scholar] [CrossRef]
  32. Wong, M.M.; Gujaria-Verma, N.; Ramsay, L.; Yuan, H.Y.; Caron, C.; Diapari, M.; Vandenberg, A.; Bett, K.E. Classification and characterization of species within the genus Lens using genotyping-by-sequencing (GBS). PLoS ONE 2015, 10, e0122025. [Google Scholar] [CrossRef] [Green Version]
  33. Idrissi, O.; Udupa, S.M.; De Keyser, E.; McGee, R.J.; Coyne, C.J.; Saha, G.C.; Muehlbauer, F.J.; Van Damme, P.; De Riek, J. Identification of quantitative trait loci controlling root and shoot traits associated with drought tolerance in a lentil (Lens culinaris Medik.) recombinant inbred line population. Front. Plant Sci. 2016, 7, 1174. [Google Scholar] [CrossRef] [Green Version]
  34. Aldemir, S.; Ateş, D.; Temel, H.Y.; Yağmur, B.; Alsaleh, A.; Kahriman, A.; Özkan, H.; Vandenberg, A.; Tanyolac, M.B. QTLs for iron concentration in seeds of the cultivated lentil (Lens culinaris Medic.) via genotyping by sequencing. Turk. J. Agric. and Forest 2017, 41, 243–255. [Google Scholar] [CrossRef] [Green Version]
  35. Bhadauria, V.; Ramsay, L.; Bett, K.E.; Banniza, S. QTL mapping reveals genetic determinants of fungal disease resistance in the wild lentil species Lens ervoides. Sci. Rep. 2017, 7, 3231. [Google Scholar] [CrossRef] [PubMed] [Green Version]
  36. Pilet-Nayel, M.; Muehlbauer, F.; McGee, R.; Kraft, J.; Baranger, A.; Coyne, C. Quantitative trait loci for partial resistance to Aphanomyces root rot in pea. Theor. Appl. Genet. 2002, 106, 28–39. [Google Scholar] [CrossRef] [PubMed]
  37. Shehata, M.; Davis, D.; Pfleger, F. Breeding for resistance to Aphanomyces euteiches root rot and Rhizoctonia solani stem rot in peas. J. Am. Soc. Hortic. Sci. 1983, 108, 1080–1085. [Google Scholar]
  38. Pilet-Nayel, M.; Muehlbauer, F.; McGee, R.; Kraft, J.; Baranger, A.; Coyne, C. Consistent quantitative trait loci in pea for partial resistance to Aphanomyces euteiches isolates from the United States and France. Phytopathology 2005, 95, 1287–1293. [Google Scholar] [CrossRef] [Green Version]
  39. Gao, J.; Wang, S.; Zhou, Z.; Wang, S.; Dong, C.; Mu, C.; Song, Y.; Ma, P.; Li, C.; Wang, Z.; et al. Linkage mapping and GWAS reveal candidate genes conferring thermotolerance of seed-set in maize. J. Exp. Bot. 2019, 70, 4849–4864. [Google Scholar] [CrossRef]
  40. Maccaferri, M.; El-Feki, W.; Nazemi, G.; Salvi, S.; Canè, M.A.; Colalongo, M.C.; Stefanelli, S.; Tuberosa, R. Prioritizing quantitative trait loci for root system architecture in tetraploid wheat. J. Exp. Bot. 2016, 67, 1161–1178. [Google Scholar] [CrossRef]
  41. Sallam, A.; Arbaoui, M.; El-Esawi, M.; Abshire, N.; Martsch, R. Identification and verification of QTL associated with frost tolerance using linkage mapping and GWAS in winter faba bean. Front. Plant Sci. 2016, 7, 1098. [Google Scholar] [CrossRef] [Green Version]
  42. Sural, S.; Qian, G.; Pramanik, S. Segmentation and histogram generation using the HSV color space for image retrieval, Proceedings of the International Conference on Image Processing, Rochester, NY, USA, 22-25 Sep 2002; IEEE: Piscataway, NJ, USA, 2002. [Google Scholar]
  43. Kou, Y.J.; Wang, S.P. Broad-spectrum and durability: understanding of quantitative disease resistance. Curr. Opin. Plant Biol. 2010, 13, 181–185. [Google Scholar] [CrossRef]
  44. Poland, J.A.; Balint-Kurti, P.J.; Wisser, R.J.; Pratt, R.C.; Nelson, R.J. Shades of gray: the world of quantitative disease resistance. Trends Plant Sci. 2009, 14, 21–29. [Google Scholar] [CrossRef]
  45. Michelmore, R.W.; Christopoulou, M.; Caldwell, K.S. Impacts of resistance gene genetics, function, and evolution on a durable future. Annu. Rev. Phytopathol. 2013, 51, 291–319. [Google Scholar] [CrossRef] [PubMed]
  46. Theodoulou, F.L.; Kerr, I.D. ABC transporter research: going strong 40 years on. Biochem. Soc. Trans. 2015, 43, 1033–1040. [Google Scholar] [CrossRef] [PubMed] [Green Version]
  47. Çakır, B.; Kılıçkaya, O. Whole-genome survey of the putative ATP-binding cassette transporter family genes in Vitis vinifera. PLoS ONE 2013, 8, e78860. [Google Scholar] [CrossRef] [PubMed] [Green Version]
  48. Sugiyama, A.; Shitan, N.; Sato, S.; Nakamura, Y.; Tabata, S.; Yazaki, K. Genome-wide analysis of ATP-binding cassette (ABC) proteins in a model legume plant, Lotus japonicus: comparison with Arabidopsis ABC protein family. DNA Res. 2006, 13, 205–228. [Google Scholar] [CrossRef] [Green Version]
  49. Ofori, P.A.; Mizuno, A.; Suzuki, M.; Martinoia, E.; Reuscher, S.; Aoki, K.; Shibata, D.; Otagaki, S.; Matsumoto, S.; Shiratake, K. Genome-wide analysis of ATP binding cassette (ABC) transporters in tomato. PLoS ONE 2018, 13, e0200854. [Google Scholar] [CrossRef]
  50. Lionetti, V.; Cervone, F.; Bellincampi, D. Methyl esterification of pectin plays a role during plant-pathogen interactions and affects plant resistance to diseases. J. Pant Physiol. 2012, 169, 1623–1630. [Google Scholar] [CrossRef]
  51. Pham, A.T.; McNally, K.; Abdel-Haleem, H.; Boerma, H.R.; Li, Z. Fine mapping and identification of candidate genes controlling the resistance to southern root-knot nematode in PI 96354. Theor. Appl. Genet. 2013, 126, 1825–1838. [Google Scholar] [CrossRef]
  52. Liu, N.; Sun, Y.; Pei, Y.; Zhang, X.; Wang, P.; Li, X.; Li, F.; Hou, Y. A pectin methylesterase inhibitor enhances resistance to Verticillium wilt. Plant Physiol. 2018, 176, 2202–2220. [Google Scholar] [CrossRef] [Green Version]
  53. Volpi, C.; Janni, M.; Lionetti, V.; Bellincampi, D.; Favaron, F.; D’Ovidio, R. The ectopic expression of a pectin methyl esterase inhibitor increases pectin methyl esterification and limits fungal diseases in wheat. Mol. Plant Microbe Interact. 2011, 24, 1012–1019. [Google Scholar] [CrossRef] [Green Version]
  54. Lionetti, V.; Raiola, A.; Camardella, L.; Giovane, A.; Obel, N.; Pauly, M.; Favaron, F.; Cervone, F.; Bellincampi, D. Overexpression of pectin methylesterase inhibitors in Arabidopsis restricts fungal infection by Botrytis cinerea. Plant Physiol. 2007, 143, 1871–1880. [Google Scholar] [CrossRef] [Green Version]
  55. Dai, G.; Nicole, M.; Andary, C.; Martinez, C.; Bresson, E.; Boher, B.; Daniel, J.F.; Geiger, J.P. Flavonoids accumulate in cell walls, middle lamellae and callose-rich papillae during an incompatible interaction between Xanthomonas campestris pv. malvacearum and cotton. Physiol. Mol. Plant Pathol. 1996, 49, 285–306. [Google Scholar] [CrossRef]
  56. Skadhauge, B.; Thomsen, K.K.; Von Wettstein, D. The role of the barley testa layer and its flavonoid content in resistance to Fusarium infections. Hereditas 1997, 126, 147–160. [Google Scholar] [CrossRef]
  57. Mihail, J.D.; Rush, C.M.; Singleton, L.L. Methods for Research on Soilborne Phytopathogenic Fungi, 2nd ed.; The American Phytopathological Society Press: St. Paul, MN, USA, 1992. [Google Scholar]
  58. Marzougui, A.; Ma, Y.; Zhang, C.; McGee, R.; Coyne, C.; Main, D.; Sankaran, S. Advanced imaging for quantitative evaluation of Aphanomyces root rot resistance in lentil. Front. Plant Sci. 2019, 10, 383. [Google Scholar] [CrossRef] [PubMed] [Green Version]
  59. Coyne, C.J.; Porter, L.D.; Boutet, G.; Ma, Y.; McGee, R.J.; Lesné, A.; Baranger, A.; Pilet-Nayel, M.L. Confirmation of Fusarium root rot resistance QTL Fsp-Ps 2.1 of pea under controlled conditions. BMC Plant Biol. 2019, 19, 98. [Google Scholar] [CrossRef] [PubMed] [Green Version]
  60. Hamon, C.; Baranger, A.; Coyne, C.J.; McGee, R.J.; Le Goff, I.; L’Anthoene, V.; Esnault, R.; Riviere, J.P.; Klein, A.; Mangin, P.; et al. New consistent QTL in pea associated with partial resistance to Aphanomyces euteiches in multiple French and American environments. Theor. Appl. Genet. 2011, 123, 261–281. [Google Scholar] [CrossRef] [PubMed]
  61. Poland, J.A.; Brown, P.J.; Sorrells, M.E.; Jannink, J.L. Development of high-density genetic maps for barley and wheat using a novel two-enzyme genotyping-by-sequencing approach. PLoS ONE 2012, 7, e32253. [Google Scholar] [CrossRef] [Green Version]
  62. Catchen, J.M.; Amores, A.; Hohenlohe, P.; Cresko, W.; Postlethwait, J.H. Stacks: building and genotyping loci de novo from short-read sequences. G3: Genes Genom. Genet. 2011, 1, 171–182. [Google Scholar] [CrossRef] [Green Version]
  63. Li, H.; Durbin, R. Fast and accurate short read alignment with Burrows-Wheeler transform. Bioinformatics 2009, 25, 1754–1760. [Google Scholar] [CrossRef] [Green Version]
  64. Li, H.; Handsaker, B.; Wysoker, A.; Fennell, T.; Ruan, J.; Homer, N.; Marth, G.; Abecasis, G.; Durbin, R. The sequence alignment/map format and SAMtools. Bioinformatics 2009, 25, 2078–2079. [Google Scholar] [CrossRef] [Green Version]
  65. Garrison, E.; Marth, G. Haplotype-based variant detection from short-read sequencing. arXiv 2012, arXiv:1207.3907. [Google Scholar]
  66. Danecek, P.; Auton, A.; Abecasis, G.; Albers, C.A.; Banks, E.; DePristo, M.A.; Handsaker, R.E.; Lunter, G.; Marth, G.T.; Sherry, S.T.; et al. The variant call format and VCFtools. Bioinformatics 2011, 27, 2156–2158. [Google Scholar] [CrossRef] [PubMed]
  67. Browning, B.L.; Browning, S.R. Genotype imputation with millions of reference samples. Am. J. Hum. Genet. 2016, 98, 116–126. [Google Scholar] [CrossRef] [PubMed] [Green Version]
  68. Venables, W.N.; Ripley, B.D. Modern Applied Statistics with S-PLUS, 2nd ed.; Springer-Verlag: New York City, NY, USA, 2013. [Google Scholar]
  69. Bates, D.; Mächler, M.; Bolker, B.; Walker, S. Fitting linear mixed-effects models using lme4. arXiv 2014, arXiv:1406.5823. [Google Scholar]
  70. Team, R.C. R: A language and environment for statistical computing. R Foundation for Statistical Computing: Vienna, Austria. Available online: https://www.R-project.org/ (accessed on 20 January 2019).
  71. Kosambi, D.D. The estimation of map distances from recombination values. Annals. Eugenics. 1943, 12, 172–175. [Google Scholar] [CrossRef]
  72. Margarido, G.; Souza, A.; Garcia, A. OneMap: software for genetic mapping in outcrossing species. Hereditas 2007, 144, 78–79. [Google Scholar] [CrossRef]
  73. Wang, S. Windows QTL Cartographer 2.5; Department of Statistics, North Carolina State University: Raleigh, NC, USA, 2007. [Google Scholar]
  74. Barrett, J.C.; Fry, B.; Maller, J.; Daly, M.J. Haploview: analysis and visualization of LD and haplotype maps. Bioinformatics 2004, 21, 263–265. [Google Scholar] [CrossRef] [Green Version]
  75. Hill, W.; Weir, B. Variances and covariances of squared linkage disequilibria in finite populations. Theor. Popul. Biol. 1988, 33, 54–78. [Google Scholar] [CrossRef]
  76. Lipka, A.E.; Tian, F.; Wang, Q.; Peiffer, J.; Li, M.; Bradbury, P.J.; Gore, M.A.; Buckler, E.S.; Zhang, Z. GAPIT: genome association and prediction integrated tool. Bioinformatics 2012, 28, 2397–2399. [Google Scholar] [CrossRef] [Green Version]
  77. Liu, X.; Huang, M.; Fan, B.; Buckler, E.S.; Zhang, Z. Iterative usage of fixed and random effect models for powerful and efficient genome-wide association studies. PLoS Genet. 2016, 12, e1005767. [Google Scholar] [CrossRef]
  78. Wang, N.; Akey, J.M.; Zhang, K.; Chakraborty, R.; Jin, L. Distribution of recombination crossovers and the origin of haplotype blocks: the interplay of population history, recombination, and mutation. Am. J. Hum. Genet. 2002, 71, 1227–1234. [Google Scholar] [CrossRef] [Green Version]
  79. Lê, S.; Josse, J.; Husson, F. FactoMineR: an R package for multivariate analysis. J. Stat. Softw. 2008, 25, 1–18. [Google Scholar] [CrossRef] [Green Version]
  80. Rozen, S.; Skaletsky, H. Primer3 on the WWW for general users and for biologist programmers. In Bioinformatics Methods and Protocols, 2nd ed.; Springer: New York City, NY, USA, 2000; pp. 365–386. [Google Scholar]
  81. Livak, K.J.; Schmittgen, T.D. Analysis of relative gene expression data using real-time quantitative PCR and the 2− ΔΔCT method. Methods 2001, 25, 402–408. [Google Scholar] [CrossRef] [PubMed]
  82. Saha, G.C.; Vandemark, G.J. Stability of expression of reference genes among different lentil (Lens culinaris) genotypes subjected to cold stress, white mold disease, and Aphanomyces root rot. Plant Mol. Biol. Rep. 2013, 31, 1109–1115. [Google Scholar] [CrossRef]
Figure 1. Heatmaps of correlation coefficients between the ARR resistance traits in (a) the RIL population and (b) the association mapping population. Blue color represents positive correlation and red color indicates negative correlation. Cross mark shows there is no significant correlation observed between the given traits (p > 0.05).
Ijms 21 02129 g001
Figure 2. Population structure of the association mapping population. (a) The scree plot of first 10 principle components (PCs). (b) The three-dimensional principle component analysis (PCA) plot represents the distribution of the lentil accessions on the first three PCs. The colors represent various continents: red-Africa, green-America, blue-Asia, light blue-Europe, and black-data not available. (c) Cluster heatmap of the Kinship matrix. (d) Histogram of kinship coefficients.
Ijms 21 02129 g002
Figure 3. Comparison of numbers of favorable LD block haplotypes in resistant (Res), intermediate (Int), and susceptible (Sus) groups in the association mapping population. (a) A box plot of the number of favorable LD block haplotypes among three groups. The three groups were categorized by coordinates of first PC of multiple factor analysis (MFA.dim1). Numbers in the box plot indicate mean values of numbers of favorable haplotypes in the given groups. Letters represent significant differences among the three groups based on the mean comparison. (b) Frequency distribution of MFA.dim1 in the association mapping population. Res group (MFA.dim1 < −2, yellow color) carried the highest number of favorable haplotypes, Int group (−2 < MFA.dim1 < 2, gray color) had an intermediate number of favorable haplotypes, and Sus group (MFA.dim1 > 2, blue color) carried the lowest number of favorable haplotypes.
Ijms 21 02129 g003
Figure 4. Genetic map of ARR resistance QTL identified using QTL mapping and genome-wide association study (GWAS). The solid bars represent GWAS-based QTL, and the hollow bars indicate QTL-mapping-based QTL. QTL clusters are highlighted by blue-shaded banding. QTL significance levels are labeled using *** for major QTL, ** for nominal QTL, * for suggestive QTL.
Ijms 21 02129 g004
Figure 5. Expression profiles of putative genes. Relative expression levels were normalized by ß-tubulin-3. Four accessions (two partially resistant accessions: PI 432001 and ILL 5509; two susceptible accessions: PI 320935 and PI 431824) were analyzed in non-inoculated (N) and inoculated (I) with A. euteiches conditions at two time-points (6 and 24 hours post inoculation: 6 hpi and 24 hpi). Error bars represent standard error of the mean. Asterisks indicate statistically significant differences (p < 0.05) between inoculated plants and non-inoculated plants. Capital letters represent significant differences among all four accessions under the non-inoculated condition, while lowercase letters indicate significant differences among all four accessions under the inoculated condition. Abbreviations: ABCA gene encoding ABC transporter A family protein (ABCA), CYP71 gene encoding Cytochrome P450 family 71 protein (CYP71), LRR-RLK gene encoding LRR receptor-like kinase (LRR-RLK), CHI gene encoding Chalcone-flavanone isomerase family protein (CHI), and PE gene encoding Pectin esterase (PE).
Ijms 21 02129 g005
Table 1. Statistical analysis results of all the Aphanomyces root rot (ARR) resistance traits in the recombinant inbred line (RIL) population and the association mapping population.
PopulationTrait aNumber of LinesNumber of ObservationsMin bMax bMean bSE bSkew cKurtosis cNormality Test d,fG
Effect e,f
R
Effect e,f
H2
e
RILRRI1891564051.540.040.190.30ns***ns0.24
SDL189551141.690.030.760.70*******0.10
RDL189554141.90.040.711.02*******0.13
RGB.blue1891563131.19197.79171.20.27−0.21−0.18ns******0.52
RGB.saturation18915630.050.170.100.000.30−0.24ns***ns0.47
RGB.SPL189541151.540.030.58−0.13******ns0.17
RGB.RPL189541151.650.030.72−0.02******ns0.21
AGI1735050.314.812.580.030.09−0.20ns****0.13
Multispectral.NDVI1734970.010.240.120.000.06−0.11ns**ns0.13
Multispectral.canopy173497−0.190.930.330.01−0.040.25ns**0.05
AssociationRRI3263052053.350.01−1.052.07*********0.73
SDL3262910152.190.020.28−0.81ns******0.53
RDL3262911152.110.020.62−0.62*********0.50
RGB.blue326305250.53119.6779.820.200.41−0.06*********0.62
RGB.saturation32630520.310.430.380.00−0.200.12********0.73
RGB.SPL3262895152.570.02−0.08−0.78*******0.50
RGB.RPL3262895152.520.020.16−0.93ns******0.54
a ARR resistance traits are abbreviated as follows: RRI-root rot index, SDL-shoot dry weight loss per plant, RDL-root dry weight loss per plant, RGB.blue-average intensity of blue channel acquired from an RGB camera, RGB.saturation-standard deviation of saturation channel acquired from an RGB camera, RGB.SPL-number of pixels loss per plant in shoot acquired from an RGB camera, RGB.RPL-number of pixels loss per plant in root acquired from an RGB camera, AGI-above ground index, Multispectral.canopy-canopy area acquired from a multispectral camera, Multispectral.NDVI-standard deviation of normalized difference vegetation index acquired from a multispectral camera. b Minimum, maximum, mean, and standard error. c Skew and Kurtosis values used for testing normality. d Normality tested by Shapiro–Wilk test. e G effect: genotype effect; R effect: replicate effect; H2: heritability. f *** < 0.001, ** < 0.01, * < 0.05, not significant (ns) > 0.05.
Table 2. Quantitative trait loci (QTL) for ARR resistance traits in the RIL population across two environments.
TraitQTL aEnvironment bClosest MarkerChrPositionLOD cR2CI dParental Allele e
RRIQ.RRI-Lc2.1CCLcChr2-104830562104830563.2**6.2%22.8−31.0K191-2
Q.RRI -Lc5.1CCLcChr5-22937022252293702222.7*5.3%62.0−64.8K192-1
SDLQ.SDL-Lc3.1CCLcChr3-12430210931243021092.8*5.9%81.8−83.9K192-1
RGB.blueQ.BLU-Lc2.1CCLcChr2-104830562104830563.3**6.5%22.8−30.8K192-1
Q.BLU-Lc5.1CCLcChr5-25743793052574379303.5**6.9%110.6−119.7K192-1
Q.BLU-Lc7.1CCLcChr7-931585697931585693.1**6.0%48.8−60.0K192-1
RGB.saturationQ.SAT-Lc2.1CCLcChr2-8058084280580842.7*5.2%22.8−23.8K191-2
Q.SAT-Lc3.1CCLcChr3-659358573659358572.7*5.7%35.0−38.1K192-1
Q.SAT-Lc7.1CCLcChr7-931585697931585694.2**8.1%47.0−61.0K191-2
RGB.SPLQ.SPL-Lc2.1CCLcChr2-4851535248515352.6*5.3%13.1−13.1K191-2
RGB.RPLQ.RPL-Lc4.1CCLcChr4-836030214836030214.8**9.5%35.5−53.2K192-1
Q.RPL-Lc4.2CCLcChr4-17535795941753579592.8*5.7%71.44−71.44K191-2
AGIQ.AGI-Lc2.1FieldLcChr2-104830562104830562.7*5.6%28.7−28.8K191-2
Q.AGI-Lc5.1FieldLcChr5-22937022252293702223.4**7.0%51.7−63.1K192-1
Multispectral.canopyQ.CAN-Lc2.1FieldLcChr2-104830562104830562.6*5.7%29.8−31.0K192-1
Q.CAN-Lc7.1FieldLcChr7-613527577613527573.2**6.8%8.3−16.7K192-1
Multispectral.NDVIQ.NDVI-Lc6.1FieldLcChr6-17096740961709674094.1**8.8%77.0−86.8K191-2
Q.NDVI-Lc6.2FieldLcChr6-19664131661966413165.6**12.1%104.1−120.0K191-2
Q.NDVI-Lc7.1FieldLcChr7-639332147639332143.7**7.8%22.2−33.6K192-1
a QTL names are assigned by the analysis method (QTL-mapping), ARR related trait, the initial of genus and species (Lens culinaris), chromosome numbers, and the order of the QTL. b CC represents controlled conditions. c ** represents nominal QTL, where LOD > LODthreshold. The LODthreshold values are 3.06 (RRI), 3.11 (SDL), 3.18 (RGB.blue), 3.07 (RGB.saturation), 3.14 (RGB.SPL), 3.00 (RGB.RPL), 3.07 (AGI), 3.01 (Multispectral.canopy), and 2.98 (Multispectral.NDVI) * indicates suggestive QTL, where 2.5 < LOD < LODthreshold. d CI is the confidence interval of QTL regions. e Parental allele contributing to the trait.
Table 3. QTL for the ARR resistance traits in the association mapping population.
TraitQTLaTrait-Associated MarkerChrPositionCI bNumber of Markers cp-Value dMAF eR2Favorable Allele f
RRIG.RRI-Lc.1.11569_617209418571880185-7230818523.4 × 10−10 ***24%10.7%G/A
G.RRI-Lc.1.2869_191271625013271384013-27183901336 × 10−5 **18%3.9%G/A
G.RRI-Lc.2.11827_752102752889102361889-10314388971.4 × 10−5 **39%19.3%T/C
G.RRI-Lc.2.22799_532283548685283157685-28393968521.7 × 10−4 *27%13.4%G/T
G.RRI-Lc.4.15009_134109679991109524991-10983499162.6 × 10−4 *25%1.4%G/A
G.RRI-Lc.5.17154_475225981924225823924-22613992422.7 × 10−5 **20%10.0%T/A
G.RRI-Lc.6.19084_4165150820350746203-5227020343.6 × 10−4 *5%3.1%C/T
G.RRI-Lc.6.28442_656155091517154329517-15585351749.2 × 10−10 ***49%2.3%A/C
G.RRI-Lc.7.19286_77101144016101016016-10127201613.8 × 10−4 *6%8.4%A/G
RDLG.RDL-Lc.1.11604_2817542104975207049-7563504924.6 × 10−5 **11%5.5%G/T
G.RDL-Lc.2.12065_721468873214369732-1500773241.3 × 10−4 *6%6.5%G/A
G.RDL-Lc.2.22066_112146997456146678456-14731645611.6 × 10−4 *17%4.9%C/T
G.RDL-Lc.2.32770_182279028234278709234-27934723418.4 × 10−7 ***24%2.4%C/T
G.RDL-Lc.3.14445_353192079718191596718-19256271854.1 × 10−4 *14%2.3%G/T
G.RDL-Lc.4.15190_314145662855145507855-14581785512.1 × 10−4 *37%3.3%A/T
G.RDL-Lc.6.19009_964065487439892874-4141687435 × 10−6 **45%4.2%A/G
G.RDL-Lc.7.110617_29796777319549731-980573112.3 × 10−4 *31%6.4%C/T
RGB.saturationG.SAT-Lc1.11323_601329974767329760767-33018876745.1 × 10−5 **29%4.2%G/A
G.SAT-Lc2.11913_5521176134857134-149513475 × 10−5 **48%8.3%G/A
G.SAT-Lc2.23450_21295151619196161-983416182.1 × 10−4 *17%21.0%A/T
G.SAT-Lc4.15069_304123435206123280206-12359020622 × 10−7 ***36%1.7%T/C
G.SAT-Lc5.17154_475225981924225823924-22613992428.4 × 10−9 ***20%3.5%T/A
G.SAT-Lc5.27541_425258022703257864703-25818070352.3 × 10−6 **13%1.7%T/C
G.SAT-Lc6.19009_964065487439892874-4141687432.6 × 10−6 **45%1.9%A/G
G.SAT-Lc7.110394_1776264925462521254-6277725433.3 × 10−5 **25%3.8%C/T
G.SAT-Lc7.29492_477157790680157662680-15791868035.6 × 10−7 ***39%21.4%A/T
RGB.blueG.BLU-Lc1.11569_617209418571880185-7230818521.1 × 10−6 ***24%13.7%G/A
G.BLU-Lc2.13136_3124140598641086986-4172498613.2 × 10−4 *39%3.2%T/C
G.BLU-Lc3.14814_4337599353775510537-7647653732.4 × 10−6 **40%5.9%T/A
G.BLU-Lc3.24403_393189225788188742788-18970878846.1 × 10−7 ***27%2.1%A/C
G.BLU-Lc7.19616_97197564498197436498-19769249841.6 × 10−4 *47%2.6%G/A
G.BLU-Lc7.210127_277245915689245787689-24604368927.9 × 10−5 **22%8.6%G/T
RGB.RPLG.RPL-Lc2.13028_632309553121309234121-30987212162.1 × 10−6 ***13%7.1%C/T
G.RPL-Lc3.13562_323110087057109604057-11057005724.8 × 10−4 *12%7.7%C/T
G.RPL-Lc4.16453_18495872519432251-974225121.9 × 10−5 **25%16.2%T/C
G.RPL-Lc4.25190_314145662855145507855-14581785518.9 × 10−4 *37%1.9%A/T
G.RPL-Lc5.16649_585127185901127027901-12734390111.5 × 10−4 *20%6.2%T/C
G.RPL-Lc6.19009_964065487439892874-4141687431.3 × 10−4 *45%7.8%A/G
a QTL names are assigned by the analysis method (GWAS), ARR related traits, the initial of genus and species (Lens culinaris), chromosome number and the order of the QTL. b CI is the confidence interval of QTL regions derived from ± linkage disequilibrium (LD) decays for each chromosome. c Number of markers within the LD block. d ***represents major QTL (p < 2.2 × 10⁻⁶), ** for nominal QTL (p < 0.0001), * for suggestive QTL (p < 0.001). e Minor allele frequency (MAF). f Favorable alleles in bold and underlined text.

