Cardiac miRNA Expression and their mRNA Targets in a Rat Model of Prediabetes

 , ,
, ,  ,
, 
Abstract
1. Introduction
2. Results
2.1. Differentially Expressed miRNAs
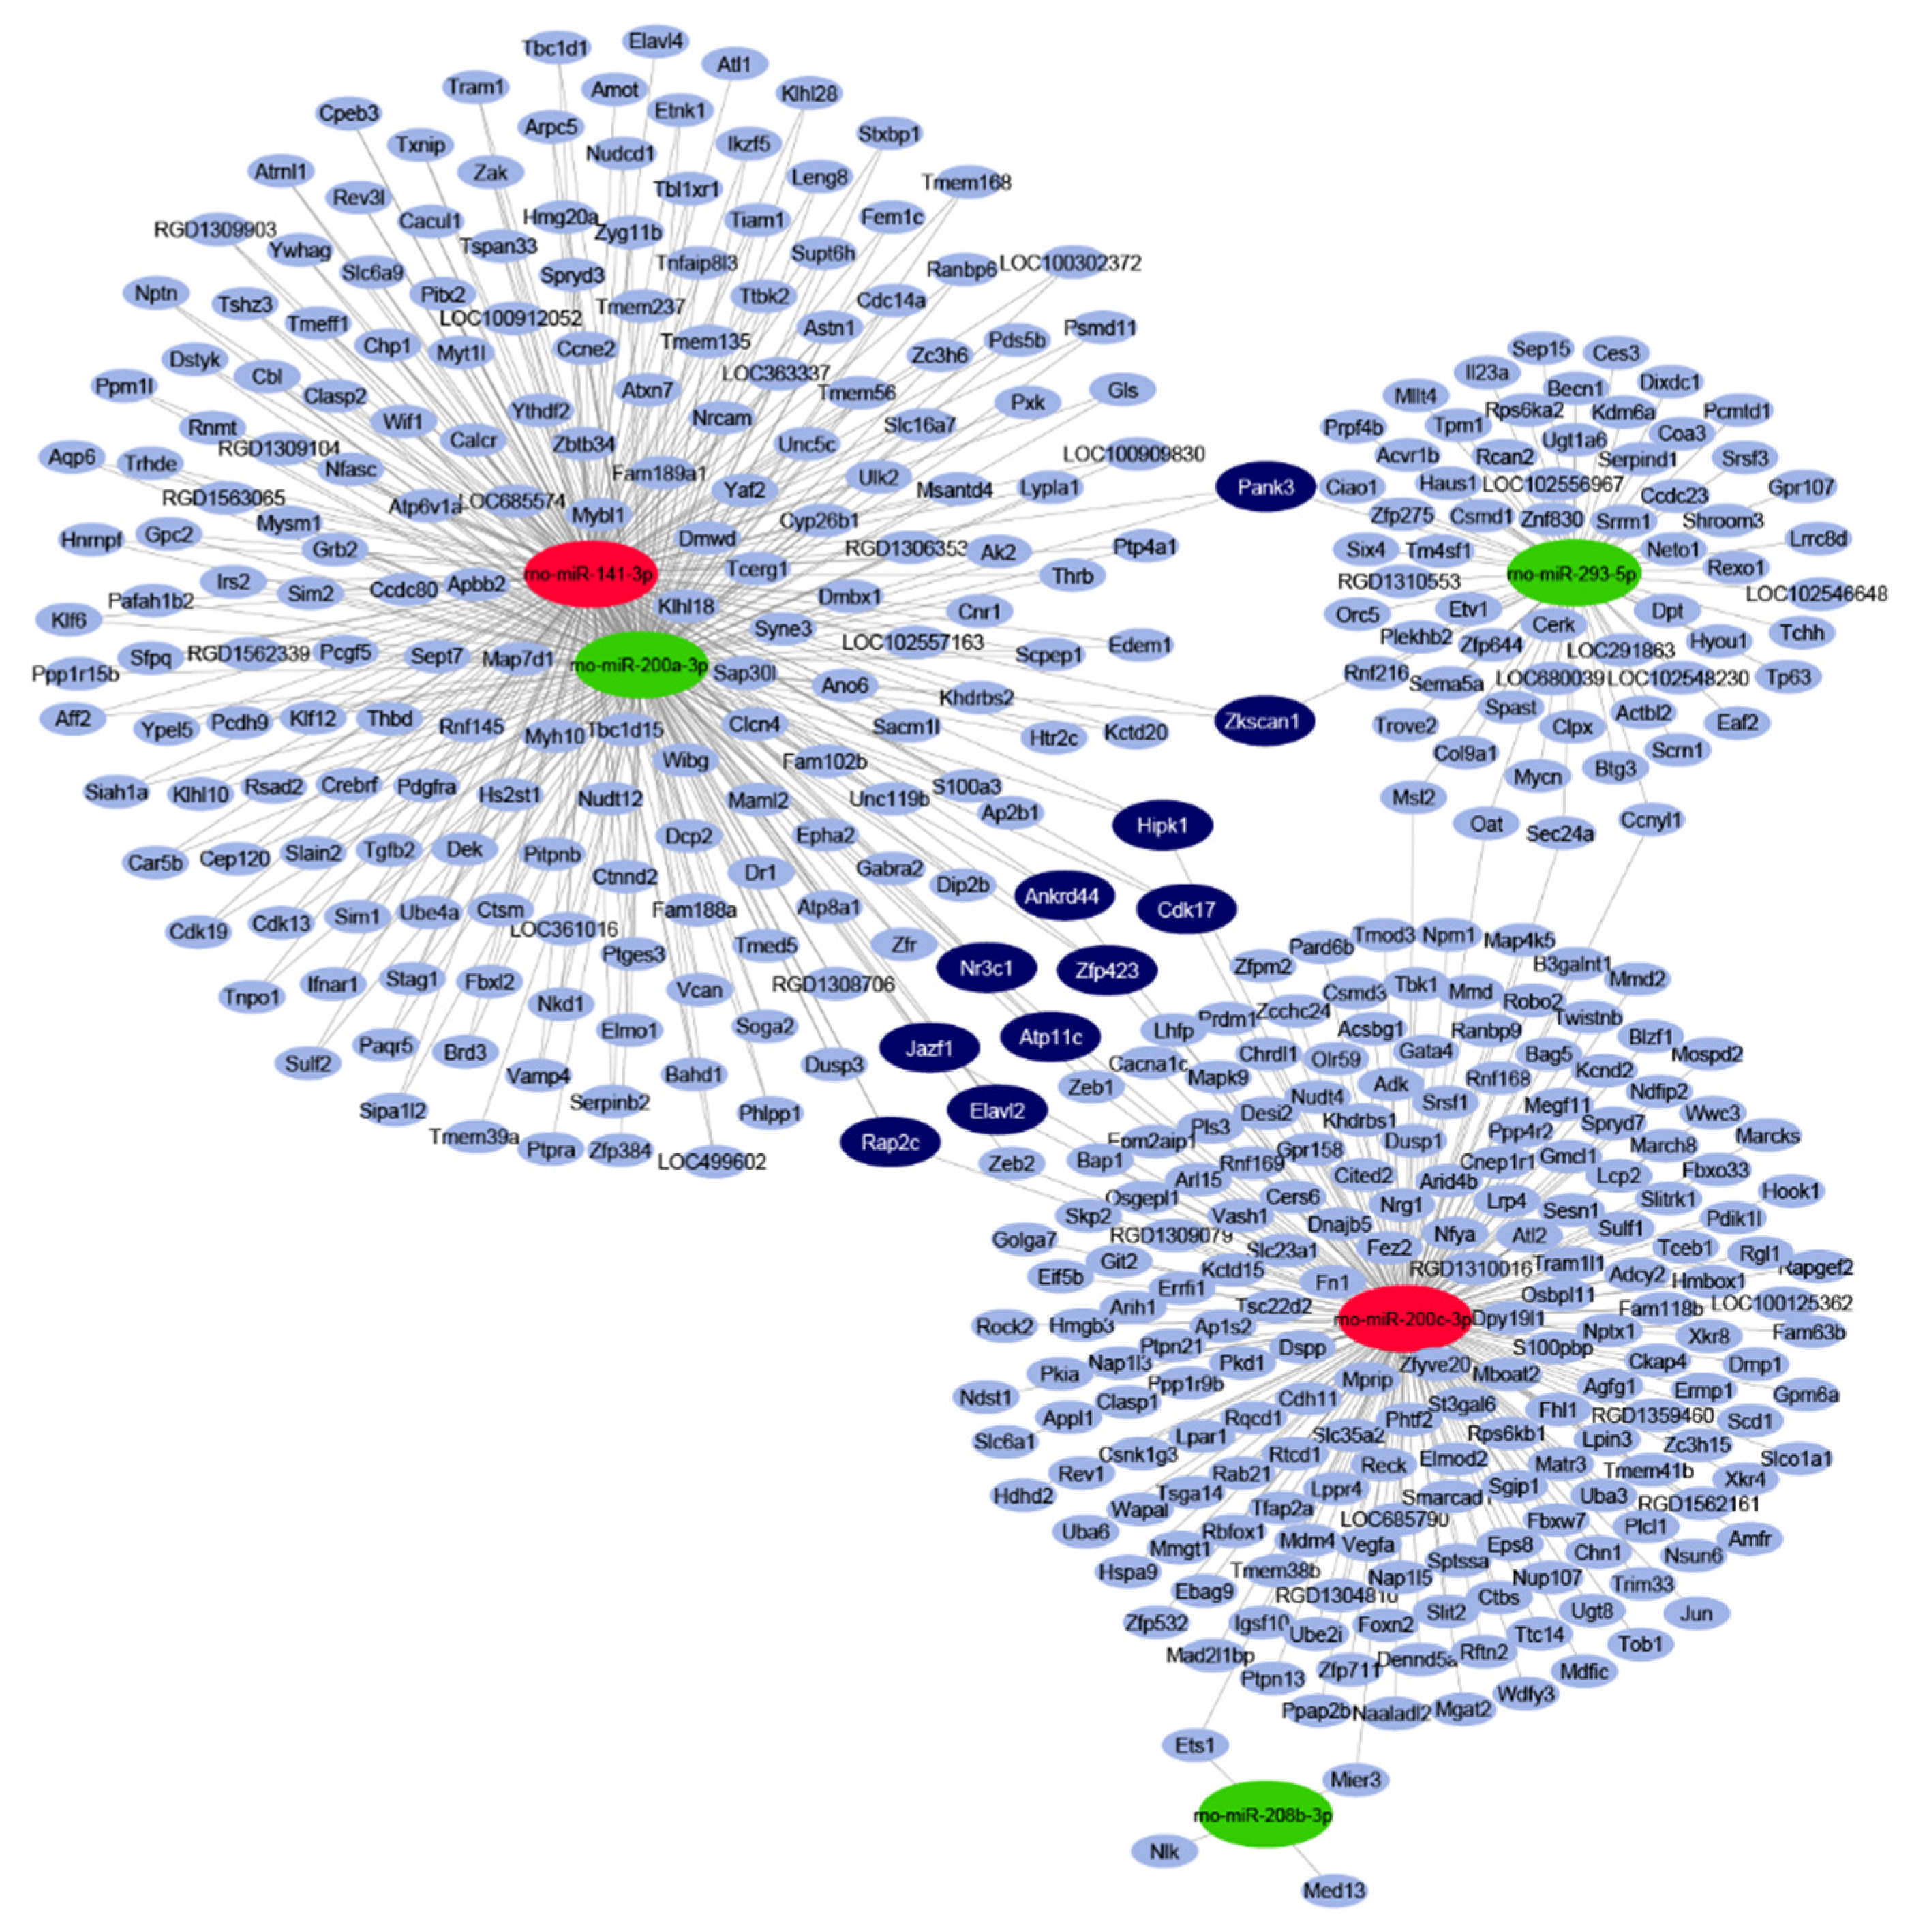
2.2. In Silico miRNA Target Prediction and Network Analysis
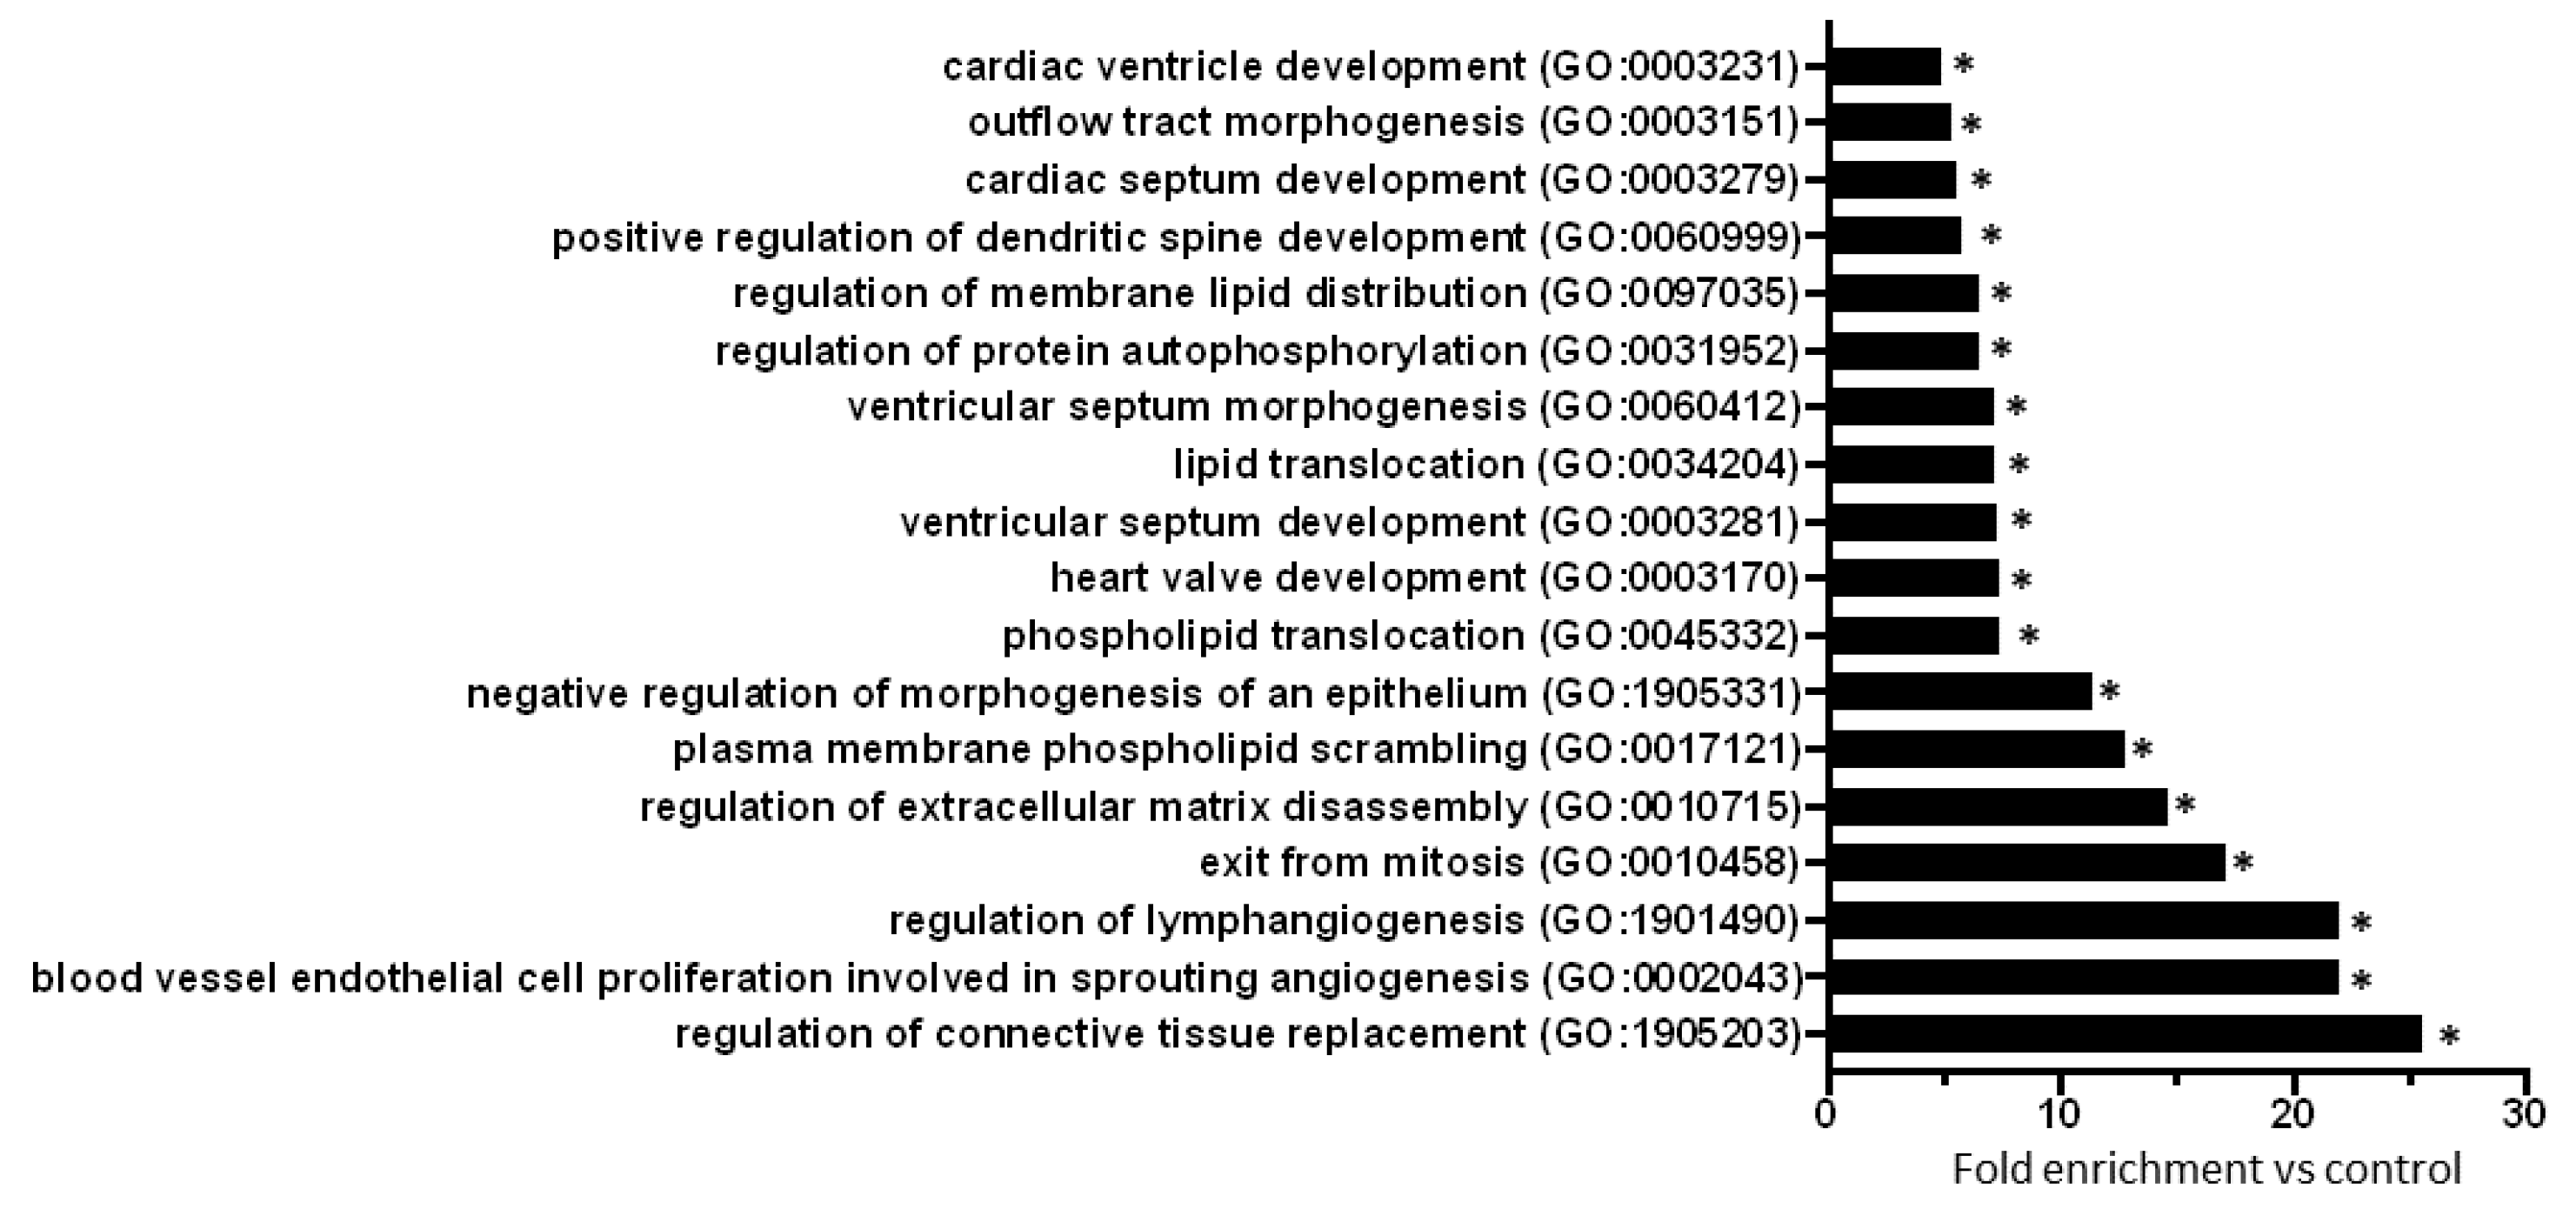
2.3. Gene Ontology Analysis of Predicted mRNAs
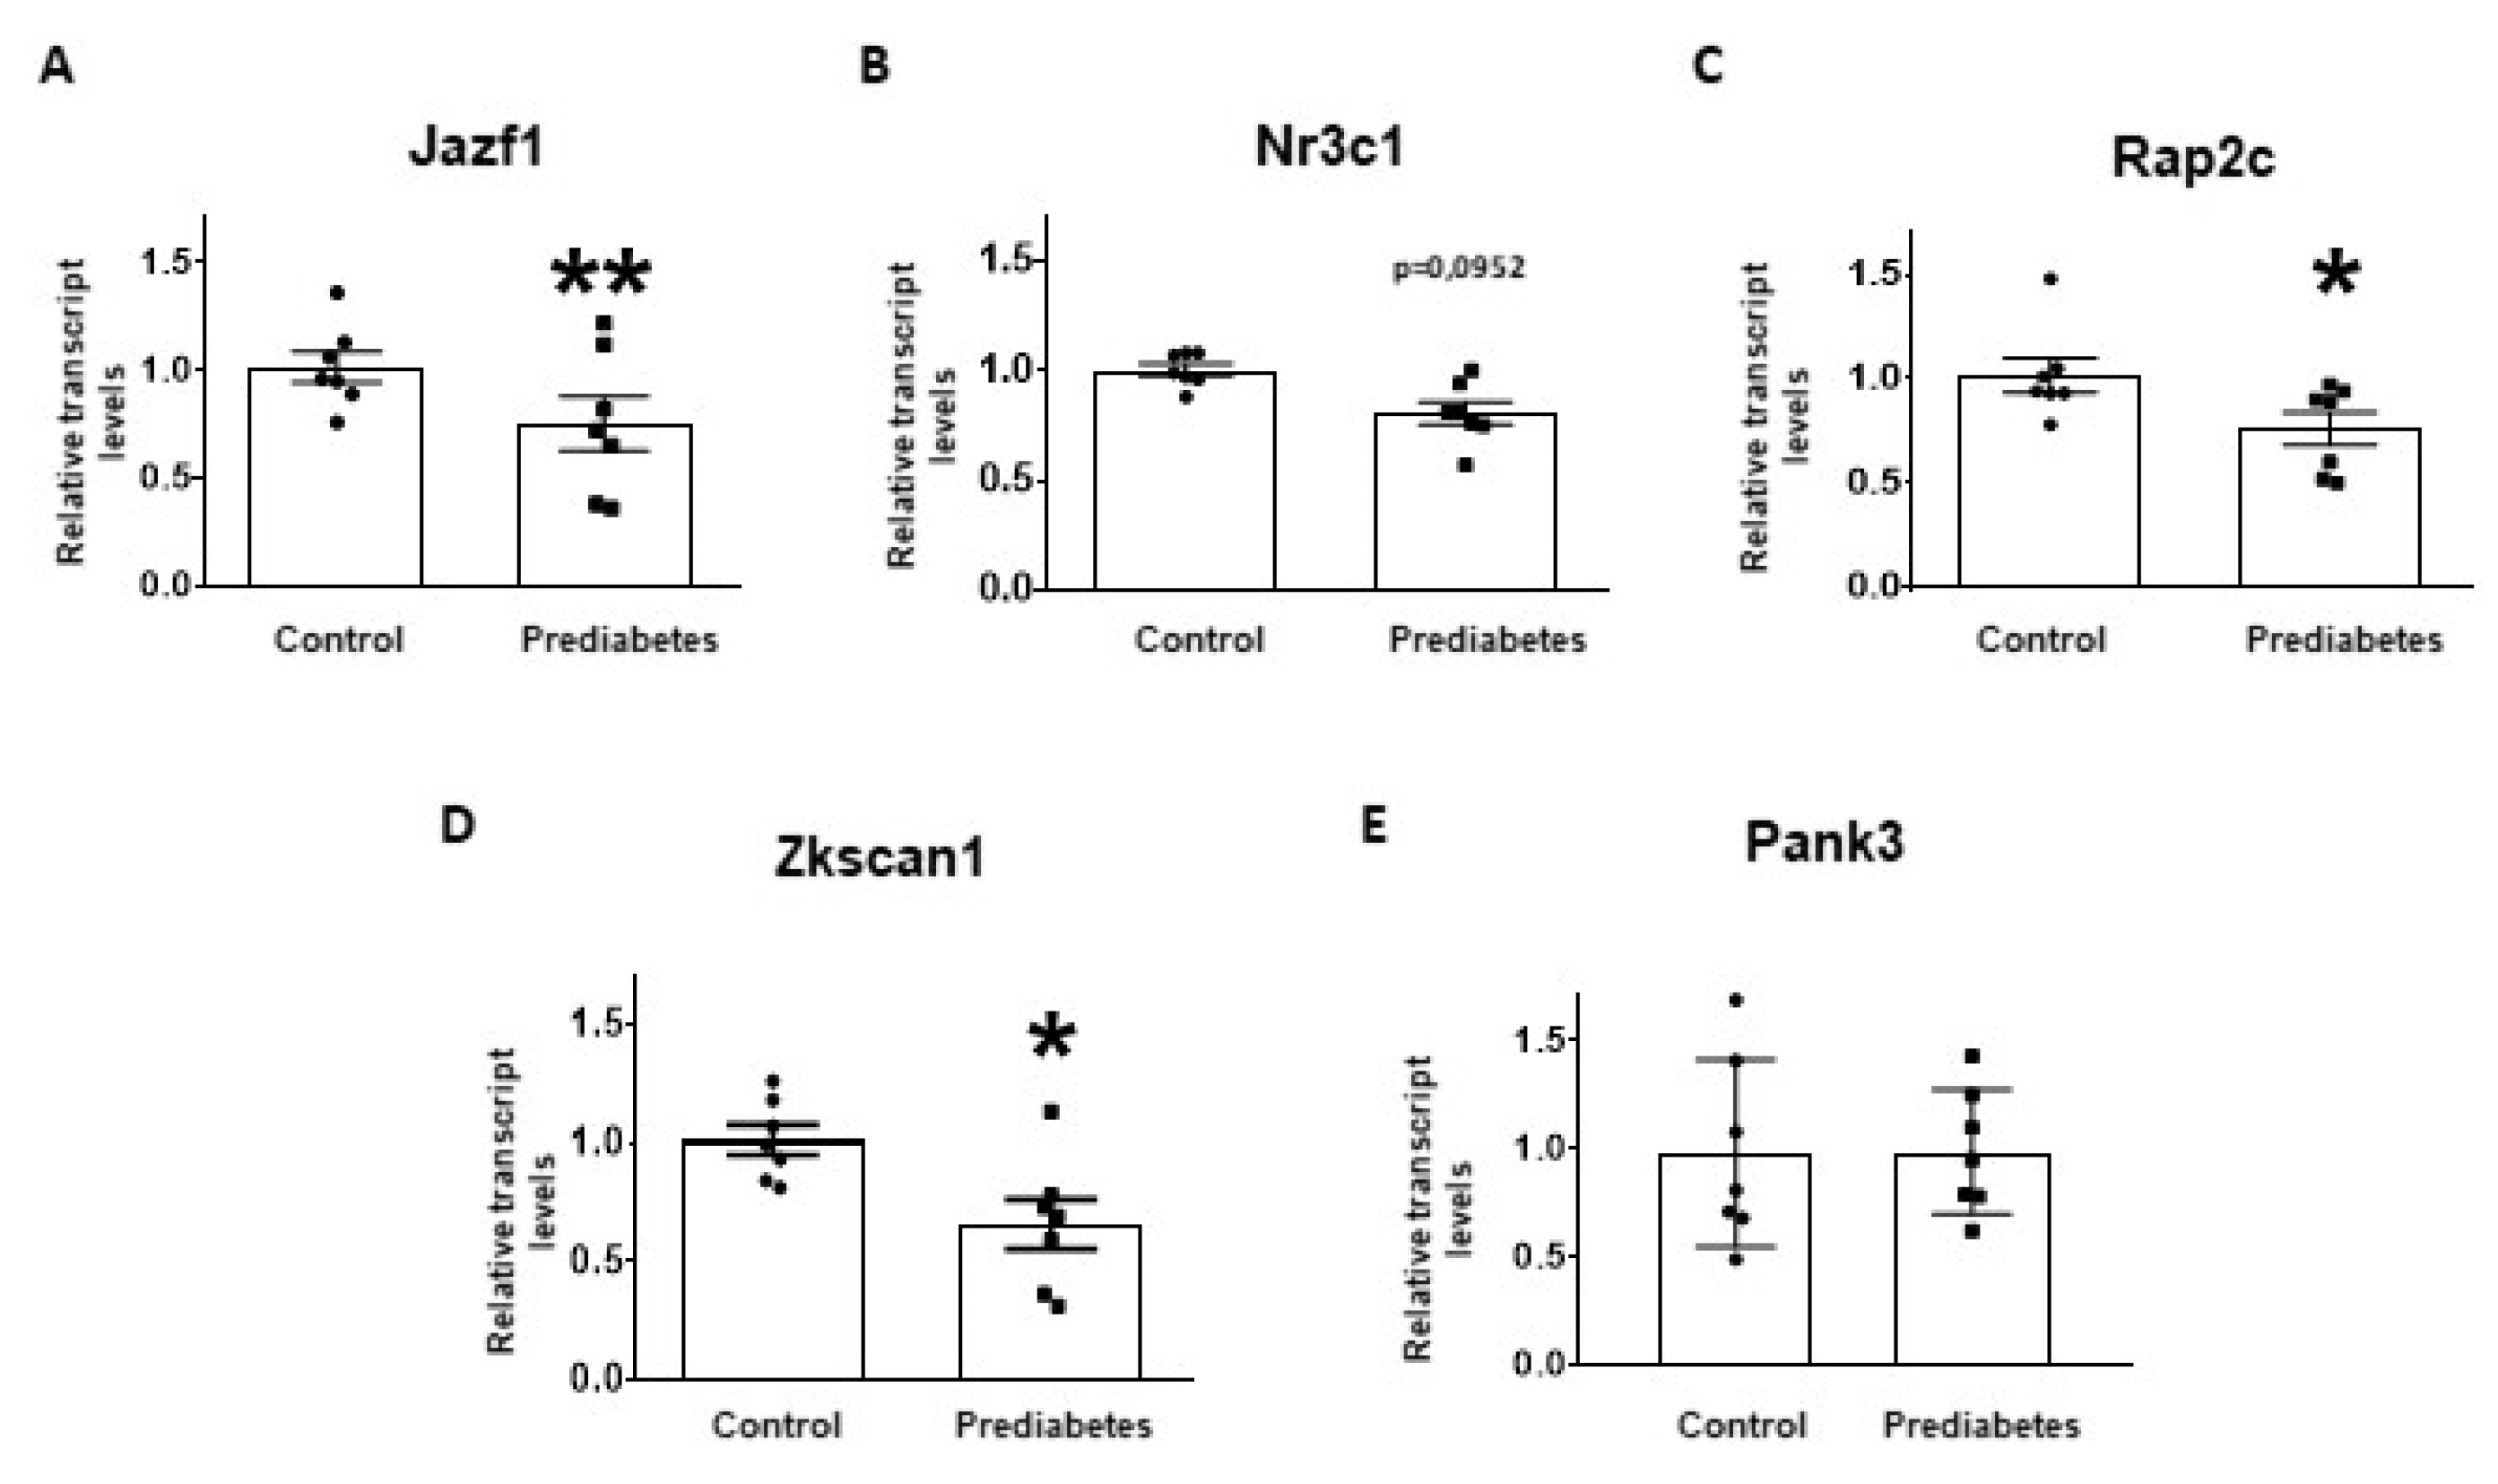
2.4. Validation of mRNA Targets of Predicted miRNAs
3. Discussion
4. Materials and Methods
4.1. Characterization of Prediabetes Model and Tissue Sampling
4.2. RNA Isolation and Small RNA-Sequencing
4.3. Bioinformatics Analysis of Small RNA-Sequencing Data
4.4. miRNA Target Prediction and miRNA-mRNA Target Network Analysis
4.5. Gene Ontology Analysis
4.6. Selection of miRNA Target mRNAs for Experimental Validation
4.7. RNA Isolation and qRT-PCR
4.8. Statistical Analysis
5. Conclusions
Supplementary Materials
Author Contributions
Funding
Acknowledgments
Conflicts of Interest
Abbreviations
| Cp | crossing point values |
| FDR | false-discovery rate |
| GLM | generalized linear models |
| GO | Gene Ontology |
| HFpEF | heart failure with preserved ejection fraction |
| HPRT | Hypoxanthine-guanine phosphoribosyltransferase |
| Jazf1 | Juxtaposed with another zinc finger protein 1 |
| miRNA | microRNA |
| Nr2c2 | Nuclear receptor subfamily 2 group c member 2 |
| Nr3c1 | Nuclear receptor subfamily 3 group c member 1 |
| Pank3 | Pantothenate kinase 3 |
| PPAR | peroxisome proliferator-activated receptor |
| Rap2c | RAP2C, member of RAS oncogene family |
| qRT-PCR | quantitative real-time polymerase chain reaction |
| SERCA | Sarcoplasmic/endoplasmic reticulum calcium ATPase |
| STZ | streptozotocin |
| T1DM | type 1 diabetes mellitus |
| T2DM | type 2 diabetes mellitus |
| Zkscan1 | Zinc finger protein with KRAB and SCAN domains 1 |
| β-MHC | β-myosin heavy chain |
References
- Ogurtsova, K.; da Rocha Fernandes, J.D.; Huang, Y.; Linnenkamp, U.; Guariguata, L.; Cho, N.H.; Cavan, D.; Shaw, J.E.; Makaroff, L.E. IDF Diabetes Atlas: Global estimates for the prevalence of diabetes for 2015 and 2040. Diabetes Res. Clin. Pract. 2017, 128, 40–50. [Google Scholar] [CrossRef] [PubMed]
- Authors/Task Force Members; Ryden, L.; Grant, P.J.; Anker, S.D.; Berne, C.; Cosentino, F.; Danchin, N.; Deaton, C.; Escaned, J.; Hammes, H.P.; et al. ESC Guidelines on diabetes, pre-diabetes, and cardiovascular diseases developed in collaboration with the EASD: The Task Force on diabetes, pre-diabetes, and cardiovascular diseases of the European Society of Cardiology (ESC) and developed in collaboration with the European Association for the Study of Diabetes (EASD). Eur. Heart J. 2013, 34, 3035–3087. [Google Scholar] [CrossRef]
- American Diabetes Association. 2. Classification and Diagnosis of Diabetes: Standards of Medical Care in Diabetes-2018. Diabetes Care 2018, 41, S13–S27. [Google Scholar] [CrossRef]
- Emerging Risk Factors Collaboration; Di Angelantonio, E.; Kaptoge, S.; Wormser, D.; Willeit, P.; Butterworth, A.S.; Bansal, N.; O’Keeffe, L.M.; Gao, P.; Wood, A.M.; et al. Association of Cardiometabolic Multimorbidity With Mortality. JAMA 2015, 314, 52–60. [Google Scholar] [CrossRef] [PubMed]
- Huang, Y.; Cai, X.; Mai, W.; Li, M.; Hu, Y. Association between prediabetes and risk of cardiovascular disease and all cause mortality: Systematic review and meta-analysis. BMJ 2016, 355, i5953. [Google Scholar] [CrossRef]
- Buysschaert, M.; Medina, J.L.; Bergman, M.; Shah, A.; Lonier, J. Prediabetes and associated disorders. Endocrine 2015, 48, 371–393. [Google Scholar] [CrossRef]
- Zand, A.; Ibrahim, K.; Patham, B. Prediabetes: Why Should We Care? Methodist DeBakey Cardiovasc. J. 2018, 14, 289–297. [Google Scholar] [CrossRef]
- Koncsos, G.; Varga, Z.V.; Baranyai, T.; Boengler, K.; Rohrbach, S.; Li, L.; Schluter, K.D.; Schreckenberg, R.; Radovits, T.; Olah, A.; et al. Diastolic dysfunction in prediabetic male rats: Role of mitochondrial oxidative stress. Am. J. Physiol. Heart Circ. Physiol. 2016, 311, H927–H943. [Google Scholar] [CrossRef]
- Di Pino, A.; Mangiafico, S.; Urbano, F.; Scicali, R.; Scandura, S.; D’Agate, V.; Piro, S.; Tamburino, C.; Purrello, F.; Rabuazzo, A.M. HbA1c Identifies Subjects With Prediabetes and Subclinical Left Ventricular Diastolic Dysfunction. J. Clin. Endocrinol. Metab. 2017, 102, 3756–3764. [Google Scholar] [CrossRef]
- Gudul, N.E.; Karabag, T.; Sayin, M.R.; Bayraktaroglu, T.; Aydin, M. Atrial conduction times and left atrial mechanical functions and their relation with diastolic function in prediabetic patients. Korean J. Intern. Med. 2017, 32, 286–294. [Google Scholar] [CrossRef]
- Shao, C.H.; Capek, H.L.; Patel, K.P.; Wang, M.; Tang, K.; DeSouza, C.; Nagai, R.; Mayhan, W.; Periasamy, M.; Bidasee, K.R. Carbonylation contributes to SERCA2a activity loss and diastolic dysfunction in a rat model of type 1 diabetes. Diabetes 2011, 60, 947–959. [Google Scholar] [CrossRef] [PubMed]
- Huynh, K.; Kiriazis, H.; Du, X.J.; Love, J.E.; Jandeleit-Dahm, K.A.; Forbes, J.M.; McMullen, J.R.; Ritchie, R.H. Coenzyme Q10 attenuates diastolic dysfunction, cardiomyocyte hypertrophy and cardiac fibrosis in the db/db mouse model of type 2 diabetes. Diabetologia 2012, 55, 1544–1553. [Google Scholar] [CrossRef] [PubMed]
- Katare, R.G.; Caporali, A.; Oikawa, A.; Meloni, M.; Emanueli, C.; Madeddu, P. Vitamin B1 analog benfotiamine prevents diabetes-induced diastolic dysfunction and heart failure through Akt/Pim-1-mediated survival pathway. Circ. Heart Fail. 2010, 3, 294–305. [Google Scholar] [CrossRef] [PubMed]
- Ágg, B.; Baranyai, T.; Makkos, A.; Vető, B.; Faragó, N.; Zvara, Á.; Giricz, Z.; Veres, D.V.; Csermely, P.; Arányi, T.; et al. MicroRNA interactome analysis predicts post-transcriptional regulation of ADRB2 and PPP3R1 in the hypercholesterolemic myocardium. Sci. Rep. 2018, 8, 10134. [Google Scholar] [CrossRef]
- Perrino, C.; Barabasi, A.L.; Condorelli, G.; Davidson, S.M.; De Windt, L.; Dimmeler, S.; Engel, F.B.; Hausenloy, D.J.; Hill, J.A.; Van Laake, L.W.; et al. Epigenomic and transcriptomic approaches in the post-genomic era: Path to novel targets for diagnosis and therapy of the ischaemic heart? Position Paper of the European Society of Cardiology Working Group on Cellular Biology of the Heart. Cardiovasc. Res. 2017, 113, 725–736. [Google Scholar] [CrossRef]
- Figueira, M.F.; Monnerat-Cahli, G.; Medei, E.; Carvalho, A.B.; Morales, M.M.; Lamas, M.E.; da Fonseca, R.N.; Souza-Menezes, J. MicroRNAs: Potential therapeutic targets in diabetic complications of the cardiovascular and renal systems. Acta Physiol. (Oxf.) 2014, 211, 491–500. [Google Scholar] [CrossRef] [PubMed]
- Kozomara, A.; Birgaoanu, M.; Griffiths-Jones, S. miRBase: From microRNA sequences to function. Nucleic Acids Res. 2019, 47, D155–D162. [Google Scholar] [CrossRef]
- Notari, M.; Pulecio, J.; Raya, A. Update on the Pathogenic Implications and Clinical Potential of microRNAs in Cardiac Disease. Biomed. Res. Int. 2015, 2015, 105620. [Google Scholar] [CrossRef]
- Baseler, W.A.; Thapa, D.; Jagannathan, R.; Dabkowski, E.R.; Croston, T.L.; Hollander, J.M. miR-141 as a regulator of the mitochondrial phosphate carrier (Slc25a3) in the type 1 diabetic heart. Am. J. Physiol. Cell Physiol. 2012, 303, C1244–C1251. [Google Scholar] [CrossRef]
- Saito, S.; Thuc, L.C.; Teshima, Y.; Nakada, C.; Nishio, S.; Kondo, H.; Fukui, A.; Abe, I.; Ebata, Y.; Saikawa, T.; et al. Glucose Fluctuations Aggravate Cardiac Susceptibility to Ischemia/Reperfusion Injury by Modulating MicroRNAs Expression. Circ. J. 2016, 80, 186–195. [Google Scholar] [CrossRef]
- Van Rooij, E.; Quiat, D.; Johnson, B.A.; Sutherland, L.B.; Qi, X.; Richardson, J.A.; Kelm, R.J., Jr.; Olson, E.N. A family of microRNAs encoded by myosin genes governs myosin expression and muscle performance. Dev. Cell 2009, 17, 662–673. [Google Scholar] [CrossRef] [PubMed]
- Zhou, Q.; Schotterl, S.; Backes, D.; Brunner, E.; Hahn, J.K.; Ionesi, E.; Aidery, P.; Sticht, C.; Labeit, S.; Kandolf, R.; et al. Inhibition of miR-208b improves cardiac function in titin-based dilated cardiomyopathy. Int. J. Cardiol. 2017, 230, 634–641. [Google Scholar] [CrossRef] [PubMed]
- Marketou, M.E.; Kontaraki, J.E.; Maragkoudakis, S.; Patrianakos, A.; Konstantinou, J.; Nakou, H.; Vougia, D.; Logakis, J.; Chlouverakis, G.; Vardas, P.E.; et al. MicroRNAs in Peripheral Mononuclear Cells as Potential Biomarkers in Hypertensive Patients With Heart Failure With Preserved Ejection Fraction. Am. J. Hypertens. 2018, 31, 651–657. [Google Scholar] [CrossRef] [PubMed]
- Sun, X.; Zuo, H.; Liu, C.; Yang, Y. Overexpression of miR-200a protects cardiomyocytes against hypoxia-induced apoptosis by modulating the kelch-like ECH-associated protein 1-nuclear factor erythroid 2-related factor 2 signaling axis. Int. J. Mol. Med. 2016, 38, 1303–1311. [Google Scholar] [CrossRef] [PubMed]
- Fang, L.; Ellims, A.H.; Moore, X.; White, D.A.; Taylor, A.J.; Chin-Dusting, J.; Dart, A.M. Circulating microRNAs as biomarkers for diffuse myocardial fibrosis in patients with hypertrophic cardiomyopathy. J. Transl. Med. 2015, 13, 314. [Google Scholar] [CrossRef]
- Yuan, L.; Luo, X.; Zeng, M.; Zhang, Y.; Yang, M.; Zhang, L.; Liu, R.; Boden, G.; Liu, H.; Ma, Z.A.; et al. Transcription factor TIP27 regulates glucose homeostasis and insulin sensitivity in a PI3-kinase/Akt-dependent manner in mice. Int. J. Obes. (Lond.) 2015, 39, 949–958. [Google Scholar] [CrossRef]
- Liao, Z.Z.; Wang, Y.D.; Qi, X.Y.; Xiao, X.H. JAZF1, a relevant metabolic regulator in type 2 diabetes. Diabetes Metab. Res. Rev. 2019, 35, e3148. [Google Scholar] [CrossRef]
- Taneera, J.; Lang, S.; Sharma, A.; Fadista, J.; Zhou, Y.; Ahlqvist, E.; Jonsson, A.; Lyssenko, V.; Vikman, P.; Hansson, O.; et al. A systems genetics approach identifies genes and pathways for type 2 diabetes in human islets. Cell Metab. 2012, 16, 122–134. [Google Scholar] [CrossRef]
- Ho, M.M.; Yoganathan, P.; Chu, K.Y.; Karunakaran, S.; Johnson, J.D.; Clee, S.M. Diabetes genes identified by genome-wide association studies are regulated in mice by nutritional factors in metabolically relevant tissues and by glucose concentrations in islets. BMC Genet. 2013, 14, 10. [Google Scholar] [CrossRef]
- Tabula Muris Consortium; Overall coordination; Logistical coordination; Organ collection and processing; Library preparation and sequencing; Computational data analysis; Cell type annotation; Writing group; Supplemental text writing group; Principal investigators. Single-cell transcriptomics of 20 mouse organs creates a Tabula Muris. Nature 2018, 562, 367–372. [Google Scholar] [CrossRef]
- Bencsik, P.; Kiss, K.; Agg, B.; Baan, J.A.; Agoston, G.; Varga, A.; Gomori, K.; Mendler, L.; Farago, N.; Zvara, A.; et al. Sensory Neuropathy Affects Cardiac miRNA Expression Network Targeting IGF-1, SLC2a-12, EIF-4e, and ULK-2 mRNAs. Int. J. Mol. Sci. 2019, 20, 991. [Google Scholar] [CrossRef] [PubMed]
- Chou, C.H.; Shrestha, S.; Yang, C.D.; Chang, N.W.; Lin, Y.L.; Liao, K.W.; Huang, W.C.; Sun, T.H.; Tu, S.J.; Lee, W.H.; et al. miRTarBase update 2018: A resource for experimentally validated microRNA-target interactions. Nucleic Acids Res. 2018, 46, D296–D302. [Google Scholar] [CrossRef] [PubMed]
- Langmead, B.; Salzberg, S.L. Fast gapped-read alignment with Bowtie 2. Nat. Methods 2012, 9, 357–359. [Google Scholar] [CrossRef] [PubMed]
- Liao, Y.; Smyth, G.K.; Shi, W. featureCounts: An efficient general purpose program for assigning sequence reads to genomic features. Bioinformatics 2014, 30, 923–930. [Google Scholar] [CrossRef]
- Robinson, M.D.; McCarthy, D.J.; Smyth, G.K. edgeR: A Bioconductor package for differential expression analysis of digital gene expression data. Bioinformatics 2010, 26, 139–140. [Google Scholar] [CrossRef]
- Benjamini, Y.; Hochberg, Y. Controlling the False Discovery Rate—A Practical and Powerful Approach to Multiple Testing. J. R. Stat. Soc. Ser. B Stat. Methodol. 1995, 57, 289–300. [Google Scholar] [CrossRef]
- Wong, N.; Wang, X. miRDB: An online resource for microRNA target prediction and functional annotations. Nucleic Acids Res. 2015, 43, D146–D152. [Google Scholar] [CrossRef]
- Betel, D.; Koppal, A.; Agius, P.; Sander, C.; Leslie, C. Comprehensive modeling of microRNA targets predicts functional non-conserved and non-canonical sites. Genome Biol. 2010, 11, R90. [Google Scholar] [CrossRef] [PubMed]
- Hsu, S.D.; Tseng, Y.T.; Shrestha, S.; Lin, Y.L.; Khaleel, A.; Chou, C.H.; Chu, C.F.; Huang, H.Y.; Lin, C.M.; Ho, S.Y.; et al. miRTarBase update 2014: An information resource for experimentally validated miRNA-target interactions. Nucleic Acids Res. 2014, 42, D78–D85. [Google Scholar] [CrossRef]
- Ágg, B.; Csaszar, A.; Szalay-Beko, M.; Veres, D.V.; Mizsei, R.; Ferdinandy, P.; Csermely, P.; Kovacs, I.A. The EntOptLayout Cytoscape plug-in for the efficient visualization of major protein complexes in protein-protein interaction and signalling networks. Bioinformatics 2019, 35, 4490–4492. [Google Scholar] [CrossRef]
- Ashburner, M.; Ball, C.A.; Blake, J.A.; Botstein, D.; Butler, H.; Cherry, J.M.; Davis, A.P.; Dolinski, K.; Dwight, S.S.; Eppig, J.T.; et al. Gene ontology: Tool for the unification of biology. The Gene Ontology Consortium. Nat. Genet. 2000, 25, 25–29. [Google Scholar] [CrossRef] [PubMed]
- The Gene Ontology Consortium. The Gene Ontology Resource: 20 years and still GOing strong. Nucleic Acids Res. 2018, 47, D330–D338. [Google Scholar] [CrossRef]


| miRNA Name | logFC | p-Value | FDR | Expression Change |
|---|---|---|---|---|
| rno-miR-141-3p | 2.49 | < 0.001 | < 0.001 | up |
| rno-miR-200a-3p | −1.41 | < 0.001 | 0.037 | down |
| rno-miR-200c-3p | 2.51 | < 0.001 | < 0.001 | up |
| rno-miR-208b-3p | −1.56 | < 0.001 | 0.012 | down |
| rno-miR-293-5p | −1.99 | 0.001 | 0.045 | down |
| Target | Predicted to be Regulated by | ||||
|---|---|---|---|---|---|
| Abbreviation | Name | miR-141-3p ↑ | miR-200a-3p ↓ | miR-200c-3p ↑ | miR-293-5p ↓ |
| Nr3c1 | Nuclear receptor subfamily 3 group c member 1 | + | + | + | |
| Jazf1 | Juxtaposed with another zinc finger protein 1 | + | + | + | |
| Rap2c | RAP2C, member of RAS oncogene family | + | + | + | |
| Zkscan1 | Zinc finger with KRAB and SCAN domains 1 | + | + | + | |
| Pank3 | Pantothenate kinase 3 | + | + | + | |
| Target | Accession Number | Forward Primer | Reverse Primer | Product Size (bp) |
|---|---|---|---|---|
| Nr3c1 | NM_012576.2 | AGGCGATACCAGGCTTCAGA | TCAGGAGCAAAGCAGAGCAG | 142 |
| Jazf1 | XM_001065610.6 | CCAACAGGCAGCGAGTATGA | AGGCTTCTCTTCCCCTCCAT | 138 |
| Rap2c | NM_001106950.2 | GGCCATACCGAGCAGATAAAAAC | TGGATCTGGAGGGCCAAAGA | 164 |
| Zkscan1 | NM_001025760.1 | GGAGTCCTCAAGCTTCGACC | GATCTTCACCATTGCCTGGGA | 193 |
| Pank3 | NM_001108272.2 | TGGGCTGTGGCATCTAGTTTT | AACAGCACACATTCGAGCCA | 135 |
| HPRT | NM_012583.2 | GTCCTGTTGATGTGGCCAGT | TGCAAATCAAAAGGGACGCA | 144 |
© 2020 by the authors. Licensee MDPI, Basel, Switzerland. This article is an open access article distributed under the terms and conditions of the Creative Commons Attribution (CC BY) license (http://creativecommons.org/licenses/by/4.0/).
Share and Cite
Sághy, É.; Vörös, I.; Ágg, B.; Kiss, B.; Koncsos, G.; Varga, Z.V.; Görbe, A.; Giricz, Z.; Schulz, R.; Ferdinandy, P. Cardiac miRNA Expression and their mRNA Targets in a Rat Model of Prediabetes. Int. J. Mol. Sci. 2020, 21, 2128. https://doi.org/10.3390/ijms21062128
Sághy É, Vörös I, Ágg B, Kiss B, Koncsos G, Varga ZV, Görbe A, Giricz Z, Schulz R, Ferdinandy P. Cardiac miRNA Expression and their mRNA Targets in a Rat Model of Prediabetes. International Journal of Molecular Sciences. 2020; 21(6):2128. https://doi.org/10.3390/ijms21062128
Chicago/Turabian StyleSághy, Éva, Imre Vörös, Bence Ágg, Bernadett Kiss, Gábor Koncsos, Zoltán V. Varga, Anikó Görbe, Zoltán Giricz, Rainer Schulz, and Péter Ferdinandy. 2020. "Cardiac miRNA Expression and their mRNA Targets in a Rat Model of Prediabetes" International Journal of Molecular Sciences 21, no. 6: 2128. https://doi.org/10.3390/ijms21062128
APA StyleSághy, É., Vörös, I., Ágg, B., Kiss, B., Koncsos, G., Varga, Z. V., Görbe, A., Giricz, Z., Schulz, R., & Ferdinandy, P. (2020). Cardiac miRNA Expression and their mRNA Targets in a Rat Model of Prediabetes. International Journal of Molecular Sciences, 21(6), 2128. https://doi.org/10.3390/ijms21062128