Abstract
Dwarfism and semi-dwarfism are among the most valuable agronomic traits in crop breeding, which were adopted by the “Green Revolution”. Previously, we reported a novel semi-dwarf rice mutant (oscyp96b4) derived from the insertion of a single copy of Dissociator (Ds) transposon into the gene OsCYP96B4. However, the systems metabolic effect of the mutation is not well understood, which is important for understanding the gene function and developing new semi-dwarf mutants. Here, the metabolic phenotypes in the semi-dwarf mutant (M) and ectopic expression (ECE) rice line were compared to the wild-type (WT) rice, by using nuclear magnetic resonance (NMR) metabolomics and quantitative real-time polymerase chain reaction (qRT-PCR). Compared with WT, ECE of the OsCYP96B4 gene resulted in significant increase of γ-aminobutyrate (GABA), glutamine, and alanine, but significant decrease of glutamate, aromatic and branched-chain amino acids, and some other amino acids. The ECE caused significant increase of monosaccharides (glucose, fructose), but significant decrease of disaccharide (sucrose); induced significant changes of metabolites involved in choline metabolism (phosphocholine, ethanolamine) and nucleotide metabolism (adenosine, adenosine monophosphate, uridine). These metabolic profile alterations were accompanied with changes in the gene expression levels of some related enzymes, involved in GABA shunt, glutamate and glutamine metabolism, choline metabolism, sucrose metabolism, glycolysis/gluconeogenesis pathway, tricarboxylic acid (TCA) cycle, nucleotide metabolism, and shikimate-mediated secondary metabolism. The semi-dwarf mutant showed corresponding but less pronounced changes, especially in the gene expression levels. It indicates that OsCYP96B4 gene mutation in rice causes significant alteration in amino acid metabolism, carbohydrate metabolism, nucleotide metabolism, and shikimate-mediated secondary metabolism. The present study will provide essential information for the OsCYP96B4 gene function analysis and may serve as valuable reference data for the development of new semi-dwarf mutants.
1. Introduction
Rice (Oryza sativa L.) is an important staple food for more than half of the global population [1]. Its sustainable production is critical to the world’s food security and the health of the ever-increasing global population. Although nitrogen fertilization is essential for improving grain yield, the increasing usage rate will lead to increased plant height [2,3]. The resulting taller plants are prone to lodging caused by wind/rain, which will increase the difficulty of harvest, promote pre-harvest germination and fungal contamination, and ultimately lead to significant reduction in grain yield and quality [2,4].
As adopted by the “Green Revolution” [2], dwarfism and semi-dwarfism are among the most valuable agronomic traits in crop breeding [5,6]. The semi-dwarfism in rice enhances their lodging resistance (e.g., to wind and rain), improves harvest index (i.e., grain/straw ratio) and enhances biomass production [2]. Therefore, a wide range of studies have been done on the development of rice semi-dwarf mutants [3,6,7,8], which can be broadly categorized into phytohormone-dependent (e.g., brassinosteroids- or gibberellins-related) and phytohormone-independent mutants [6]. Previously, we reported a novel phytohormone-independent semi-dwarf rice mutant derived from the insertion of a single copy of transposon Dissociator (Ds) into the gene OsCYP96B4 (Oryza sativa CytochromeP450 96B4), which resulted in defects in cell elongation and pollen germination [5]. As one of the largest protein-encoding gene families in plants, the cytochrome P450 (CYP) superfamily plays important roles in plant growth, development, and responses to biotic and abiotic stresses [9]. CYP96B subfamily belongs to the CYP96 family of the CYP86 clan. Recently, the functions of the CYP96B subfamily have been gradually revealed. CYP96B5 hydroxylates alkanes to primary alcohols and is involved in rice leaf cuticular wax synthesis [10]. OsCYP96B4 is involved in secondary cell wall formation in rice [11], associated with the growth and drought stress responses in rice [12], and may be an important regulator of plant growth that affects plant height in rice [6]. However, to the best of our knowledge, currently, the systems metabolic effect of the OsCYP96B4 gene mutation in rice is unclear, which is important for understanding the gene function and developing new semi-dwarf mutants.
Metabolomics is useful in characterizing the systems metabolic changes of biological systems to genetic modification or environmental stimuli [13,14,15,16]. Nuclear magnetic resonance (NMR) and mass spectrometry (MS) are the two dominant high-throughput analytical platforms employed in metabolomics, possessing their own advantages and providing complementary metabolic information [17]. For NMR analysis, it shows very high reproducibility, requires minimal sample preparation, detects in a non-selective manner and favors unambiguous metabolite identification [17]. Metabolomics has been widely applied in evaluating the metabolic response of plants to gene manipulation and biotic/abiotic stresses, e.g., the insertion of a moss Na+ transporter gene in rice and barley [18], the influence of SUB1A gene during submergence stress in rice [19], Tri5 gene deletion in Fusarium graminearum [20], antisense thioredoxin s (anti-trx-s) introduction to wheat for pre-harvest sprouting resistance [21], Fusarium oxysporum inoculation in chickpea roots [22], brown planthopper infestation in pest-susceptible and -resistant rice plants [23]. Metabolomics has also been used to characterize the metabolic phenotypes of plant dwarf and semi-dwarf mutants, e.g., BW312 barley (Hordeum vulgare) semi-dwarf mutant [24], dwarf banana (Musa spp.; Musaceae) variants [25], tomato (Solanum lycopersicum L.) dwarf cultivar Micro-Tom [26], a dwarf genotype of soybean named MiniMax [27], and dwarfed tcd2 (totally cyanide deficient 2) mutants of Sorghum bicolor (L.) Moench [28]. Such studies indicate that there are significant metabolic profile alterations in the dwarf/semi-dwarf mutant plants. However, to the best of our knowledge, currently, there is no metabolomics study on the dwarf rice.
In the present study, we investigated the differences in the metabolome and related gene expression levels among the oscyp96b4 semi-dwarf mutant (M), ectopic expression (ECE), and wild-type (WT) rice using NMR-based metabolomics and quantitative real-time polymerase chain reaction (qRT-PCR). We aimed to (1) characterize the metabolic phenotypes of the mutant rice and (2) elucidate the systems metabolic effect of the mutation by integrating the metabolomics and gene expression data. The analysis provides essential information on the OsCYP96B4 gene function and may serve as reference data for the development of new semi-dwarf mutants.
2. Results
2.1. Metabolite Profiling in Wild-Type and Mutant Rice
In the 1H NMR spectra of rice extracts, a total of 42 abundant metabolites were assigned (Table S1) according to 2D NMR experiments and literature reports [29]. Typical 1D 1H NMR spectra of WT, M, and ECE rice extracts were shown in Figure 1. The NMR spectra contain signals mainly from amino acids and derivatives, choline metabolism-related metabolites, carbohydrate metabolites, tricarboxylic acid (TCA) cycle intermediates, nucleotide metabolites, N-methylnicotinate, nicotinamide mononucleotide, lipid, formate, methylamine, mono-methyl phosphate, and methanol.
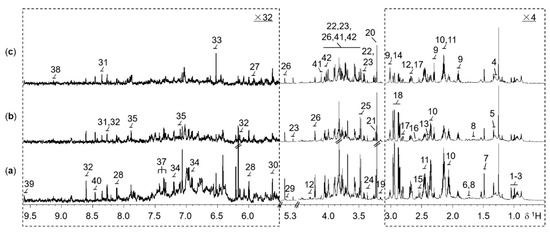
Figure 1.
Representative 800 MHz 1H NMR spectra for the extracts of 2-week-old seedling shoots (without roots) from (a) the wild type, (b) the oscyp96b4 semi-dwarf mutant, and (c) the OsCYP96B4 ectopic expression rice lines. The dotted regions δ0.5−3.1 and δ5.5−9.61 were vertically expanded 4 and 32 times respectively, compared to the region δ3.1-4.5. Metabolite keys: 1, isoleucine; 2, leucine; 3, valine; 4, lipid; 5, threonine; 6, lysine; 7, alanine; 8, arginine; 9, γ-aminobutyrate; 10, glutamate; 11, glutamine; 12, malate; 13, succinate; 14, 2-oxoglutarate; 15, citrate; 16, methylamine; 17, aspartate; 18, asparagine; 19, ethanolamine; 20, choline; 21, phosphocholine; 22, β-glucose; 23, α-glucose; 24, methanol; 25, mono-methyl phosphate; 26, sucrose; 27, uridine; 28, uridine 5′-monophosphate (UMP); 29, allantoin; 30, uridine diphosphate glucuronic acid (UDP glucuronate); 31, adenosine; 32, adenosine monophosphate (AMP); 33, fumarate; 34, tyrosine; 35, histidine; 36, tryptophan; 37, phenylalanine; 38, N-methylnicotinate (trigonelline, NMNA); 39, nicotinamide mononucleotide (nicotinamide ribotide, NMN); 40, formate; 41, β-D-fructopyranose; 42, β-D-fructofuranose.
2.2. OsCYP96B4 Gene Mutation Induced Metabolic Changes in Mutant Rice
Clear differentiation in the metabolic profiles among the three rice phenotypes was shown in the PCA scores plots (Figure S1) and the corresponding OPLS-DA scores plots (Figure 2). The OPLS-DA model quality was evaluated by the sevenfold internal cross-validation, with R2(X) = 0.368, R2(Y) = 0.988, Q2 = 0.940 for the comparison between WT and M (Figure 2a), R2(X) = 0.537, R2(Y) = 0.985, Q2 = 0.959 for the comparison between WT and ECE (Figure 2b), and R2(X) = 0.464, R2(Y) = 0.972, Q2 = 0.915 for the comparison between M and ECE (Figure 2c). The model validities were demonstrated by CV-ANOVA of OPLS-DA models (Figure 2) and permutation tests on the corresponding PLS-DA models (Figure S2). Detailed metabolic profile difference among the three phenotypes were shown in the color-coded loadings plots of OPLS-DA models (Figure 2) and further summarized in Figure 3 and Table S2.
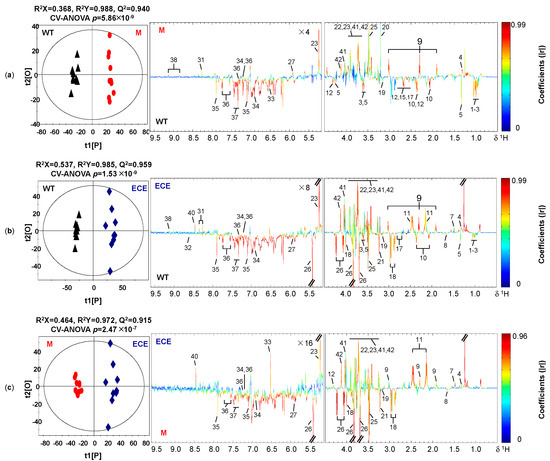
Figure 2.
Cross-validated OPLS-DA scores plots (left) and the corresponding loadings plots (right) derived from the comparison of 1H NMR spectra for (a) the wild type (WT, ▲) and the oscyp96b4 semi-dwarf mutant (M, ●), (b) the wild type (WT, ▲) and the OsCYP96B4 ectopic expression (ECE, ◆), (c) the oscyp96b4 semi-dwarf mutant (M, ●) and the OsCYP96B4 ectopic expression (ECE, ◆). Metabolite keys are shown in Figure 1 and Table S1.
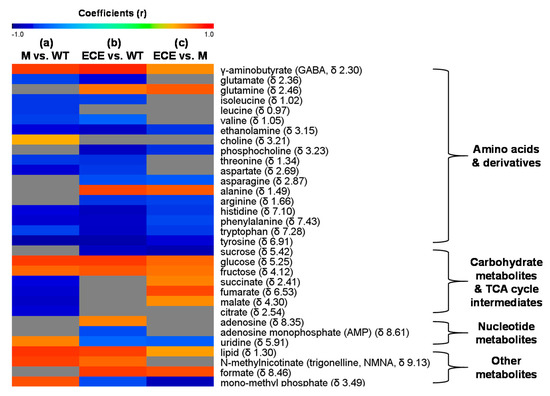
Figure 3.
Heat map showing metabolites with significant level changes (p < 0.05) for (a) the oscyp96b4 semi-dwarf mutant (M) vs. the wild type (WT), (b) the OsCYP96B4 ectopic expression (ECE) vs. the wild type (WT), and (c) the OsCYP96B4 ectopic expression (ECE) vs. the oscyp96b4 semi-dwarf mutant (M). It was color-coded with the Pearson correlation coefficients from the corresponding OPLS-DA models, where a warm color (e.g., red) indicates significant increase of metabolites in M (a) or ECE (b,c) as compared to the counterpart, a cool color (e.g., blue), indicating significant decrease, and the grey color indicates no significant difference.
Compared to WT, M showed higher levels of γ-aminobutyrate, choline, carbohydrates (glucose, fructose), uridine, N-methylnicotinate, lipid, and mono-methyl phosphate, but lower levels of most amino acids (isoleucine, leucine, valine, threonine, glutamate, aspartate, tyrosine, histidine, tryptophan, phenylalanine), ethanolamine, and TCA cycle intermediates (malate, succinate, citrate, and fumarate) (p < 0.05, Figure 2a and Figure 3a, Table S2). ECE presented more alanine, γ-aminobutyrate, glutamine, carbohydrates (glucose, fructose), adenosine, N-methylnicotinate, lipid, and formate, but less amino acids (isoleucine, valine, threonine, arginine, glutamate, aspartate, asparagine, tyrosine, histidine, tryptophan, phenylalanine), choline metabolites (ethanolamine, phosphocholine), sucrose, nucleotide metabolites (uridine, adenosine monophosphate), and mono-methyl phosphate than WT (p < 0.05, Figure 2b and Figure 3b, Table S2). Compared with M, there were increases of γ-aminobutyrate, glutamine, alanine, carbohydrates (glucose, fructose), TCA cycle intermediates (succinate, fumarate and malate), lipid, and formate, but decreases of amino acids (asparagine, arginine, histidine, phenylalanine, tyrosine, tryptophan), choline metabolites (ethanolamine, phosphocholine), sucrose, uridine, and mono-methyl phosphate in ECE (p < 0.05, Figure 2c and Figure 3c, Table S2).
2.3. Gene Expression Analysis
The qRT-PCR analysis was performed to acquire supporting information for the aforementioned metabolic changes induced by OsCYP96B4 gene mutation. Compared with WT, significant alterations (p < 0.05) in M or ECE were observed for the expression levels of key enzyme-encoding genes, responsible for the regulation of GABA shunt, glutamate/glutamine metabolism, choline metabolism, carbohydrate metabolism, nucleotide metabolism, and secondary metabolism (Figure 4).
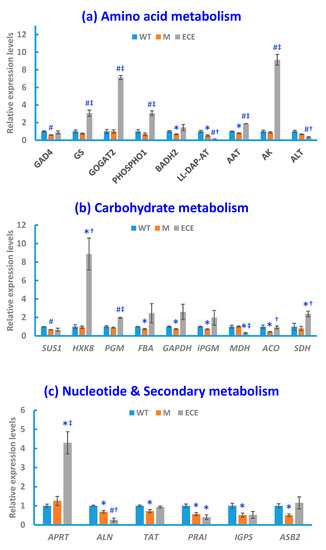
Figure 4.
Gene expression levels in the wild-type (WT, blue bars), the oscyp96b4 semi-dwarf mutant (M, orange bars), and the OsCYP96B4 ectopic expression (ECE, grey bars) rice lines measured by qRT-PCR. Data shown are means ± SE of three biological replicates each with three technical replicates (* p < 0.05, #P < 0.01, as compared to WT; † p < 0.05, ‡ p < 0.01, as compared to M).
Along with the metabolite level changes, OsCYP96B4 gene mutation induced significant alterations in the expression levels of key genes in GABA shunt and glutamate/glutamine metabolism, including the down-regulation of glutamate decarboxylase 4 gene (GAD4) in M and the up-regulation of glutamate synthase 2 gene (GOGAT2) and glutamine synthetase gene (GS) in ECE. OsCYP96B4 gene mutation also resulted in significant changes of gene expression related to choline metabolism, i.e., down-regulation of betaine aldehyde dehydrogenase 2 gene (BADH2) in M and up-regulation of phosphoethanolamine/phosphocholine phosphatase gene (PHOSPHO1) in ECE. In addition, significant alterations were also observed for the gene expression pertaining to the metabolism of other amino acids, including the down-regulation of aspartate aminotransferase gene (AAT) and LL-diaminopimelate aminotransferase gene (LL-DAP-AT) in M, along with the up-regulation of AAT and aspartate kinase gene (AK) and down-regulation of alanine transaminase gene (ALT) and LL-DAP-AT in ECE (Figure 4a).
There were significant changes in the gene expression involved in carbohydrate metabolism, including significant down-regulation of genes encoding sucrose synthase 1 (SUS1), fructose-bisphosphate aldolase (FBA), glyceraldehyde 3-phosphate dehydrogenase (GAPDH), 2,3-bisphosphoglycerate-independent phosphoglycerate mutase (iPGM) and aconitase (ACO) in M, along with the up-regulation of genes encoding hexokinase-8 (HXK8), phosphoglucomutase (PGM), and succinate dehydrogenase (SDH) and down-regulation of genes encoding malate dehydrogenase (MDH) in ECE (Figure 4b).
Significant changes also occurred in the gene expression related to nucleotide metabolism, i.e., the up-regulation of adenine phosphoribosyltransferase gene (APRT) in ECE, and down-regulation of allantoinase (ALN) gene in both M and ECE (Figure 4c). In addition to the significant alterations of gene expression in primary metabolism, OsCYP96B4 gene mutation also led to significant changes of gene expression in secondary metabolism, i.e., the down-regulation of tyrosine aminotransferase gene (TAT), phosphoribosylanthranilate isomerase gene (PRAI), indole-3-glycerol phosphate synthase gene (IGPS), anthranilate synthase beta subunit 2 gene (ASB2) in M, and the down-regulation of PRAI in ECE (Figure 4c).
For the comparison between ECE and M, the gene expression alterations were nearly the same as the comparison between ECE and WT, except for the significant increase of ACO and no significant change of PRAI in ECE when compared with M (at the significance level of 0.05, Figure 4a–c).
3. Discussion
The aforementioned metabolomics and gene expression data showed that OsCYP96B4 gene mutation resulted in comprehensive metabolic responses in rice plants. The responses were summarized in Figure 5, mainly including alterations in amino acid metabolism, carbohydrate metabolism, nucleotide metabolism, and secondary metabolism. In general, such changes were more comprehensive in ECE than in M when compared with WT, especially on the gene expression levels. Moreover, significant differences were observed in the metabolic and gene expression levels between ECE and M. These differences may be related to the developmental disparities in the two mutants. The oscyp96b4 mutant displayed a semi-dwarf phenotype, but with the development of panicles and seeds (i.e., complete mature plant formation). However, the ECE plants remained severely dwarf, without any panicle formation, and normally died after about 4 weeks in the pot. Taken together, the results shed light on the OsCYP96B4 gene function and may be associated with the plant phenotype (i.e., dwarfism).
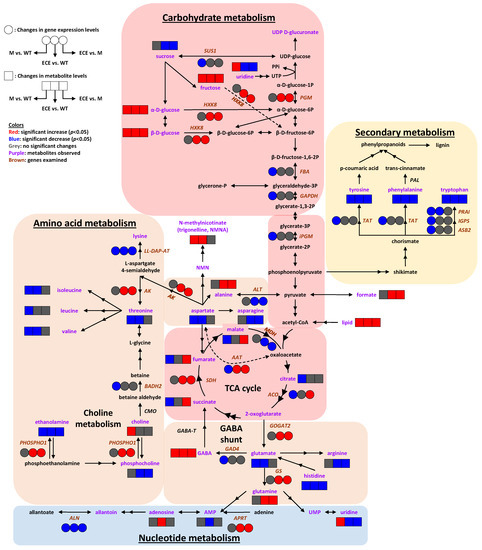
Figure 5.
Systems metabolic reprogramming induced by OsCYP96B4 gene mutation in rice. Symbols: boxes (☐) represent metabolite levels; circles (◯) represent gene expression levels; both the solid and dashed arrows indicate the enzyme catalyzed metabolic reactions, where the dashed arrows were intentionally used to prevent the intersection between solid ones. Colors: red indicates significant increase (p < 0.05), blue indicates significant decrease (p < 0.05), grey indicates no significant change; purple letters denote identified metabolites; italic brown letters denote genes with examined transcript levels. Metabolite abbreviations: AMP, adenosine monophosphate; GABA, γ-aminobutyrate; NMN, nicotinamide mononucleotide; NMNA, N-methylnicotinate; PPi, diphosphate; UDP, uridine diphosphate; UMP, uridine 5’-monophosphate; UTP, uridine triphosphate. Gene abbreviations: SUS1, sucrose synthase 1; PGM, phosphoglucomutase; HXK8, hexokinase-8; FBA, fructose-bisphosphate aldolase; GAPDH, glyceraldehyde 3-phosphate dehydrogenase; iPGM, 2,3-bisphosphoglycerate-independent phosphoglycerate mutase; SDH, succinate dehydrogenase; MDH, malate dehydrogenase; ACO, aconitase; PAL, phenylalanine ammonia-lyase; TAT, tyrosine aminotransferase; PRAI, phosphoribosylanthranilate isomerase; IGPS, indole-3-glycerol phosphate synthase; ASB2, anthranilate synthase beta subunit 2; LL-DAP-AT, LL-diaminopimelate aminotransferase; AK, aspartate kinase; ALT, alanine transaminase; AAT, aspartate aminotransferase; BADH2, betaine aldehyde dehydrogenase 2; CMO, choline monooxygenase; PHOSPHO1, phosphoethanolamine/phosphocholine phosphatase; GABA-T, GABA transaminase; GAD4, glutamate decarboxylase 4; GOGAT2, glutamine:2-oxoglutarate amidotransferase 2; GS, glutamine synthetase; APRT, adenine phosphoribosyltransferase; ALN, allantoinase.
3.1. Amino Acid Metabolism
The GABA shunt is comprised of three steps, including the α-decarboxylation of glutamate to GABA by glutamate decarboxylase (GAD), the conversion of GABA to succinic semialdehyde by GABA transaminase (GABA-T), and the oxidization of succinic semialdehyde to succinate catalyzed by succinic semialdehyde dehydrogenase (SSADH) [30,31]. There are reported connections between GABA shunt and plant dwarfism. The suppression of GABA-T induces prominent GABA accumulation, dwarfism, and infertility in the tomato [32]. Rice plants overexpressing OsGAD2ΔC have dwarf phenotypes [33]. In the present study, there was significant increase of GABA and decrease of glutamate levels in both M and ECE. Besides, the succinate level and the GAD4 gene expression was down-regulated in M. Although both glutamate and GAD4 were down-regulated in M, other metabolic pathways (e.g., arginine and proline metabolism) may contribute to the increase of GABA level. It indicates that OsCYP96B4 functions affect rice GABA shunt, which may be connected with the dwarfism phenotype [32,33].
The glutamine synthetase/glutamine:2-oxoglutarate amidotransferase (i.e., GS/GOGAT) cycle plays a regulatory role in the nitrogen assimilation process in plants [34]. While glutamine synthetase (GS) catalyzes the conversion of glutamate and ammonia into glutamine, glutamate synthase (i.e., GOGAT, or glutamine:2-oxoglutarate amidotransferase) catalyzes the formation of glutamate from glutamine and 2-oxoglutarate. Here, the significant decrease of glutamate was observed in both M and ECE, together with the up-regulated GS, GOGAT2 gene expression, and glutamine level in ECE. It suggests the function of OsCYP96B4 on rice glutamate and glutamine metabolism, along with GS/GOGAT cycle, which may be connected with the nitrogen assimilation process [34] and the dwarfism phenotype.
Isoleucine, leucine, and valine are three branched-chain amino acids (BCAAs). Here, significant decrease of isoleucine and valine were observed in both M and ECE, along with the significantly reduced leucine level in M. As both valine and isoleucine possess the glucogenic property, their level decrease and the increase of glucose concentration may indicate the possible gluconeogenesis process in the mutant rice. Although at present there are no relevant reports, it suggests the effect of OsCYP96B4 mutation on rice branched-chain amino acid metabolism, which may be connected with the dwarfism phenotype.
Phosphoethanolamine/phosphocholine phosphatase (PHOSPHO1) catalyzes the conversion of phosphoethanolamine to ethanolamine and the conversion of phosphocholine to choline. Choline can be further converted to betaine by the action of choline monooxygenase (CMO) and betaine aldehyde dehydrogenase 2 (BADH2). It was shown that simultaneous expression of Spinacia oleracea chloroplast CMO and BADH genes contribute to dwarfism in transgenic Lolium perenne [35]. In the current study, there were significantly decreased ethanolamine level and BADH2 gene expression level, along with significantly increased choline level in M. While, there were significantly decreased ethanolamine and phosphocholine levels and significantly increased PHOSPHO1 gene expression level in ECE. These observations suggest the influence of OsCYP96B4 function on rice choline metabolism and dwarfism [35].
In addition, OsCYP96B4 mutation showed potential effects on the metabolism of other amino acids, including the significant decrease of threonine, aspartate, histidine levels, and LL-DAP-AT gene expression in both M and ECE, the down-regulation of AAT expression level in M, and the significantly decreased levels of asparagine, arginine, and ALT expression along with the significantly increased levels of alanine and AK expression in ECE.
3.2. Carbohydrate Metabolism
Sucrose synthase (SUS) is a key enzyme for the regulation of carbon partitioning in plants by providing UDP-glucose as a substrate for the biosynthesis of cellulose and other polysaccharides [36]. It has been shown that AtCesA8::SUS3 transgenic rice plants exhibited largely improved biomass saccharification and lodging resistance by reducing cellulose crystallinity and increasing cell wall thickness [36]. OsIDD2 overexpression leads to severely dwarfed rice plants and OsIDD2 negatively regulates the transcription of genes involved in lignin biosynthesis, cinnamyl alcohol dehydrogenase 2 and 3 (CAD2 and 3), and sucrose metabolism sucrose synthase 5 (SUS5) [37]. In the present study, although there were significant increases of glucose, fructose, and uridine levels in M, the significant decrease of SUS1 gene expression may lead to the unchanged level of sucrose. While for ECE, the significantly increased levels of glucose, fructose, and HXK8 and PGM gene expression and the decreased uridine level may result in the decrease of sucrose level, in spite of the unchanged SUS1 gene expression. It suggests the influence of OsCYP96B4 on sucrose metabolism, which may be connected with dwarfism [37]. Besides, the significantly decreased FBA, GAPDH, and iPGM gene expression levels in M further supported the effect of OsCYP96B4 gene mutation on rice carbohydrate metabolism.
The TCA cycle is carried out through a variety of interconnected enzymatic reactions, e.g., the conversion of succinate to fumarate by succinate dehydrogenase (SDH), the oxidation of malate to oxaloacetate via malate dehydrogenase (MDH), and the transformation of citrate to cis-aconitate and then isocitrate by aconitase (ACO). OsAPX2 (rice ascorbate peroxidase 2) knock-out leads to shoot dwarfing and up-regulation of enzymes linked to glycolysis and TCA cycle in rice flag leaves [38]. Arabidopsis thaliana mutants lacking plastidial NAD-dependent MDH (pdnad-mdh) are embryo-lethal, and constitutive silencing (miR-mdh-1) leads to a dwarfed phenotype [39]. In the present study, there were significant decreases of TCA cycle intermediates (i.e., succinate, fumarate, malate, and citrate) and ACO gene expression level in M, along with the significant up-regulation of SDH and the down-regulation of MDH gene expression levels in ECE. It is inferred that the perturbation in TCA cycle is related to OsCYP96B4 gene function and may be connected with the rice dwarfism phenotype [38,39].
3.3. Nucleotide Metabolism
As an important intermediate in the purine metabolism, adenosine monophosphate (AMP) is formed from adenine by adenine phosphoribosyltransferase (APRT) [40] and is interconvertible with adenosine through hydroxylation and phosphorylation reactions. Allantoin, an intermediary metabolite of purine catabolism, is hydrolyzed to allantoate under the catalysis of allantoinase (ALN) [41]. Similarly, uridine and UMP are two interconvertible intermediates in the pyrimidine metabolism. APRT was shown to be potentially involved in thermo-sensitive genic male sterility (TGMS) in the rice line ‘Annong S-1′ [42] and associated with growth retardation and male sterility in Arabidopsis [43]. In the current study, there was significant increase of adenosine and APRT gene expression, but significant decrease of AMP, uridine, and ALN gene expression level in ECE, along with significant increase of uridine and the significant decrease of ALN gene expression level in M. It suggests the potential function of OsCYP96B4 on rice nucleotide metabolism, which may be associated with the rice dwarfism phenotype. However, to the best of our knowledge, currently, there are no reports on such association.
3.4. Secondary Metabolism
The shikimate and aromatic amino acids (AAA) biosynthesis pathways represent a link between primary and secondary metabolism in plants [44]. The catabolism of AAAs results in a variety of secondary metabolites, e.g., phenylpropanoids and flavonoids from phenylalanine, tocochromanols and phenylpropanoids from tyrosine, and indole-containing metabolites from tryptophan [45]. Cytochrome P450 monooxygenases (CYP450s) play important roles in the biosynthesis of plant secondary metabolites, including phenylpropanoids, terpenes, and alkaloids [46]. As one of the major phenylpropanoid pathway end-products, lignin is a major component of the secondary cell wall and is vital for providing mechanical strength to reduce lodging stress in plants [47,48]. Phenylalanine ammonia-lyase (PAL) catalyzes the conversion of phenylalanine to trans-cinnamic acid and plays an important role in the biosynthetic pathway of lignin [49]. In the dwarf rice mutant Fukei 71, elevated levels of p-coumaric acid (PCA), ferulic acid (FA), and PAL were observed in the abnormal parenchyma tissue, indicating that the abnormal activation of phenylpropanoid pathway leads to the biosynthesis of polysaccharide-linked FA and PCA [50]. The AAAs metabolism is also connected with dwarfism. The overexpression of a rice tyrosine decarboxylase (TyDC) leads to tyramine accumulation in rice cells and causes a dwarf phenotype via reduced cell division [51]. The suppression of serotonin N-acetyltransferase 2 (SNAT2) leads to melatonin-deficient rice with a semidwarf phenotype [52]. Our present study showed that there was significant decrease in levels of phenylalanine, tyrosine, and tryptophan in both M and ECE, along with the significant decrease of TAT, PRAI, IGPS, and ASB2 expression levels in M and the significant decrease of PRAI expression level in ECE. It may indicate the declined synthesis of phenylalanine, tyrosine, and tryptophan and reflect the function of OsCYP96B4 on shikimate-mediated secondary metabolism in rice, which may be possibly connected with the dwarfism phenotype [51,52].
3.5. Other Metabolism
In our previous study [5], GC-MS lipid profiling was performed on non-polar extracts of rice leaves from WT and M. Three classes of lipid were analyzed, i.e., plant glycolipids, the common membrane phospholipid classes, and the minor membrane lipid metabolites. Compared with WT, there were no significant alteration in total monogalactosyldiacylglycerol (MGDG) or total digalactosyldiacylglycerol (DGDG), but significant increase of MGDG 34:6, and significant decreases of DGDG 34:1, DGDG 36:2, total phosphatidylglycerol (PG), PG 36:2, total lysoPG and lysoPG 16:1 in M. While, in the present study, untargeted NMR metabolic profiling was performed on the polar extraction of the whole 2-week-old seedling shoots without roots. The accumulation of total lipids, with a wider species coverage than our previous study [5], was observed in both M and ECE. Though the difference in plant material, extraction method, and lipid coverage may lead to different results, both studies suggested that OsCYP96B4 might be involved in rice plant lipid metabolism. The accumulation of lipids observed here may indicate the reduced conversion of lipids to other metabolites or the increased synthesis of lipids from other metabolites. The significant elevation of N-methylnicotinate level in both M and ECE may indicate the potential effect of this mutation on vitamin B3 metabolism. In addition, the significant increase of formate concentration suggests altered formate metabolism in ECE.
4. Materials and Methods
4.1. Plant Materials
The Japonica rice (Oryza sativa ssp. japonica cv. Nipponbare) was used as the wild-type (WT) rice plant for the current study. The oscyp96b4 semi-dwarf (M) was a Ds insertion mutant, and the OsCYP96B4 ectopic expression (ECE) lines showing the most severe dwarf phenotype were generated constitutively expressing the OsCYP96B4 gene in the Nipponbare background. The detailed descriptions about the mutant and ectopic expression lines can be found in our previous report [5]. For each genotype of rice plants (i.e., WT, M, and ECE, Figure S3), 19 seedlings were grown in a Phytatray™ II (Sigma-Aldrich, St. Louis, MO, USA) containing half strength Murashige and Skoog medium [53] (Sigma-Aldrich, St. Louis, MO, USA) in a plant growth room maintained at 28 °C with 12 h dark and 12 h light. For metabolites extraction, 10 whole 2-week-old seedling shoots without roots were used for each genotype. While for qRT-PCR, 3 independent biological replicates were used, where each replicate was made up of RNA extracted from 3 seedlings pooled together for better representation. Each plant sample was collected individually into a 2 mL Eppendorf tube, weighed, immediately snap-frozen in liquid nitrogen and stored at −80 °C until further analyses.
4.2. Metabolome Analysis
4.2.1. Chemicals
Analytical grade methanol, K2HPO4·3H2O, NaH2PO4·2H2O and sodium azide (NaN3) were purchased from Sigma-Aldrich (St. Louis, MO, USA). Sodium 3-trimethylsilyl [2,2,3,3−2H4]-propionate (TSP) and deuterium oxide (D2O, 99.9% D) were purchased from Cambridge Isotope Laboratories, Inc. (Tewksbury, MA, USA). The phosphate buffer for NMR analysis was prepared by dissolving K2HPO4 and NaH2PO4 in water (0.15 M, pH 7.44, K2HPO4/NaH2PO4 = 4:1) containing 0.001% TSP, 0.1% NaN3, and 50% D2O [54].
4.2.2. Plant Extraction and Sample Preparation
For each of the three groups (i.e., WT, M, and ECE), 10 biological replicates of rice plants were used for the extraction and subsequent NMR-based metabolomics analysis. Each rice plant was extracted individually using a method modified from previous reports [23,54]. Firstly, the rice sample-containing tube was snap-frozen in liquid nitrogen and the rice tissue was then swiftly ground into fine powder using a pre-cooled pestle. Pre-cooled methanol/water (v/v = 2/1, −20 °C) was added into the homogenized sample at a ratio of 600 µL per 100 mg powder. Afterwards, the mixture was further homogenized using a 2010 Geno/Grinder® (SPEX Sample Prep, Metuchen, NJ, USA) at 1300 rpm for 90 s. Then the homogenate mixture was sonicated in an ice bath with 10 cycles of 30 s sonication and 30 s break. Following centrifugation (14,489× g, 10 min, 4 °C), the supernatant was collected, and the remaining pellets were further treated twice using the same procedure. Three supernatants were combined and lyophilized after removal of methanol in vacuo (CentriVap Centrifugal Vacuum Concentrators, Labconco, MO, USA). Each dried extract was reconstituted into 600 μL phosphate buffer prepared as previously described. After a final centrifugation, 500 μL supernatant was transferred into a 5 mm NMR tube for NMR analysis.
4.2.3. NMR Spectroscopy
All NMR spectra were acquired on a Bruker Avance 800 MHz NMR spectrometer (800.15 MHz for proton frequency) at 302 K using a 5 mm cryoprobe (Bruker Biospin, Rheinstetten, Germany) [55]. A one-dimensional (1D) 1H NMR spectrum was acquired for each sample in a random order using the first increment of the gradient selected NOESY pulse sequence (recycle delay−G1−90°−t1−90°−tm−G2−90°−acquisition) with water presaturation during both the recycle delay (2 s) and mixing time (tm, 80 ms) [56]. For each spectrum, a total of 64 transients were collected into 32,768 data points over a spectral width of 16,025 Hz with a 90° pulse length adjusted to around 11 μs. For selected samples, a variety of two-dimensional (2D) NMR spectra [54] were acquired for the purpose of resonance assignment, including 1H−1H Correlation Spectroscopy (COSY), 1H−1H Total Correlation Spectroscopy (TOCSY), 1H J-Resolved Spectroscopy (JRES), 1H−13C Heteronuclear Single Quantum Correlation Spectroscopy (HSQC), and 1H−13C Heteronuclear Multiple Bond Correlation Spectroscopy (HMBC).
After Fourier transformation with 1 Hz exponential line broadening and 65,536 data points zero-filling, each 1D spectrum was manually corrected for phase and baseline distortions and referenced to TSP (δ 0.00) using Topspin 2.0 (Bruker Biospin, Germany). The spectra regions δ 0.500−9.610 were segmented into discrete bins of 0.003 ppm width using AMIX (V3.9.15, Bruker Biospin, Germany) [57]. Spectra regions with imperfect water suppression (δ 4.500−5.170) or residual methanol signal (δ 3.356−3.370) were discarded. The intersample chemical-shift variations for some metabolites were manually corrected to prevent the possible adverse effect on subsequent data analysis [58].
4.2.4. Multivariate Data Analysis
The integral of each included bin was normalized to the summed integral of all included bins. The normalized data was then utilized for multivariate data analysis using SIMCA-P+ (V11.0 and 13.0, Umetrics AB, Umea, Sweden). Initially, for the overview of data distribution and detection of possible outliers, Principal Component Analysis (PCA) was performed on mean-centered data using two principal components. Then, Projection to Latent Structure Discriminant Analysis (PLS-DA) and Orthogonal Projection to Latent Structure Discriminant Analysis (OPLS-DA) were performed on unit-variance scaled data by using grouping information as Y-matrix [59]. Two PLS components were calculated for PLS-DA models, while one PLS and one orthogonal component were used for OPLS-DA models. Both supervised models were validated using a 7-fold cross-validation method [59]. Further assessments of model quality were also performed, including a permutation test with 200 permutations for PLS models [60] and ANOVA of the cross-validated residuals (CV-ANOVA) tests for OPLS-DA models [61].
The OPLS-DA models were interpreted as back-transformed and color-coded correlation coefficients loadings plots [62] (MATLAB 7.0, The Mathworks Inc., Natick, MA, USA), where the colors indicate the significance of differentiating metabolites, with a warm color (e.g., red) being more significant than a cool color (e.g., blue). The cutoffs for correlation coefficients were chosen on the basis of discrimination significance (p < 0.05), e.g., a cutoff value (|r|) of 0.602 was corresponding to the sample number (n) of 10. Differentiating metabolites were also summarized in a heat map, color-coded with the Pearson correlation coefficients from the OPLS-DA models (MeV version 4.9.0).
4.3. RNA Extraction and qRT-PCR Analysis
For RNA extraction and subsequent qRT-PCR analysis, 3 biological replicates were used for each of the three genotypes (i.e., WT, M, and ECE). Each replicate consisted of 3 seedlings pooled together before RNA extraction, and the seedlings were from the same batch used for the metabolomics analysis. Moreover, each qRT-PCR reaction was performed with 3 technical replicates. Total RNA was extracted using Qiagen RNeasy Mini Kit (Cat No. 74904) from 2-week-old seedling shoots without roots according to the manufacturer’s instructions. The RNA quality was determined by a Nanodrop ND-1000 spectrophotometer (Nanodrop Technologies), and RNA samples with A260/A280 ratios between 1.9 and 2.1 were selected for further analysis. One microgram total RNA was reverse transcribed using Maxima First-Strand cDNA Synthesis Kit (ThermoFisher Scientific, Waltham, MA, USA, Cat No. K1671), as per the manufacturer’s instructions. The qRT-PCR analysis was carried out using selected gene-specific primer pairs (Table S3) on BIO-RAD CFX384 Real-Time system with denaturation at 95 °C for 10 min, followed by 40 cycles of denaturation at 95 °C for 15s and annealing/extension at 60 °C for 1 min. The amplification of an ACTIN gene (OsACT1) was used as an internal control to normalize the data. Melting curve analyses were performed to confirm the amplicon specificity [63]. The values were expressed as the average of three independent biological samples, each averaged from its three technical replicates. The relative expression levels were calculated using the 2−∆∆Ct method [64]. Differentially expressed transcripts were derived from two-sided unpaired t-tests, with a p value of less than 0.05 considered to be statistically significant. The data analysis and charting (with reference to WT) was performed using Microsoft Excel 2016 (Microsoft, Redmond, WA, USA).
4.4. Metabolic Pathway Analysis
Based on the differential metabolites and transcripts, the comprehensive metabolic responses in rice plants induced by OsCYP96B4 gene mutation were mapped onto relevant metabolic pathways, with reference to the KEGG pathway database [65].
5. Conclusions
In the present study, the combination of NMR-based metabolomics and qRT-PCR analyses revealed that there were systems alteration in the metabolic phenotypes of semi-dwarf mutant (M) and ectopic expression (ECE) rice lines in comparison with the wild-type (WT) rice, as a result of the OsCYP96B4 gene mutation. Such changes included the significant effect on amino acid metabolism (e.g., GABA shunt, glutamate and glutamine metabolism, branched-chain amino acid metabolism, choline metabolism), carbohydrate metabolism (e.g., sucrose metabolism, TCA cycle), nucleotide metabolism, and shikimate-mediated secondary metabolism. The present findings provide useful information on understanding the OsCYP96B4 gene function possibly pertaining to the metabolism and dwarfism, which may be helpful for the development of valuable new semi-dwarf plant mutants in the future.
Supplementary Materials
The following are available online at https://www.mdpi.com/1422-0067/21/6/1924/s1, Figure S1: PCA scores plots derived from 1H NMR spectra of rice plant extracts from different groups; Figure S2: Permutation test results (with 200 permutations) for PLS-DA models (with 2 components) derived from 1H NMR spectra of rice plant extracts from different groups; Figure S3: Representative phenotypes of the 2-week-old (A) oscyp96b4 semi-dwarf mutant (M), (B) OsCYP96B4 ectopic expression (ECE), and (C) wild-type (WT) rice plants; Table S1: 1H and 13C NMR assignment for metabolites in rice plant extracts; Table S2: OPLS-DA loadings correlation coefficients; Table S3: Primers for quantitative real-time PCR analysis on selected genes.
Author Contributions
Conceptualization, L.J., R.R. and P.P.K.; Data curation, L.J., R.R. and S.R.; Formal analysis, L.J., R.R. and S.R.; Funding acquisition, L.J. and P.P.K.; Investigation, L.J., R.R. and S.R.; Methodology, L.J. and R.R.; Project administration, L.J. and P.P.K.; Resources, L.J., S.R. and P.P.K.; Software, L.J. and R.R.; Supervision, L.J. and P.P.K.; Validation, L.J. and R.R.; Visualization, L.J. and R.R.; Writing—original draft, L.J.; Writing—review & editing, L.J., R.R., S.R. and P.P.K. All authors have read and agreed to the published version of the manuscript.
Funding
This research was funded by National University of Singapore (R-180-000-016-733; NRF-CRP7-2010-02), Huazhong University of Science and Technology (513-3004513113), and the Chinese Academy of Sciences (KJZD-EW-G20-01).
Acknowledgments
We acknowledge the help of Siyi Guo and Toshiro Ito (Temasek Life Sciences Laboratory) for the use of Geno/Grinder®. Limiao Jiang gratefully acknowledges Huiru Tang (Fudan University) for the kind help on facilitating this collaborative study and thanks Caixiang Liu (Wuhan Institute of Physics and Mathematics) for the useful discussion.
Conflicts of Interest
The authors declare no conflict of interest. The funders had no role in the design of the study; in the collection, analyses, or interpretation of data; in the writing of the manuscript, or in the decision to publish the results.
Abbreviations
| Ds | Dissociator |
| ECE | Ectopic expression |
| GABA | γ-aminobutyrate |
| M | Mutant |
| NMR | Nuclear magnetic resonance |
| OPLS-DA | Orthogonal projection to latent structure discriminant analysis |
| OsCYP96B4 | Oryza sativa Cytochrome P450 96B4 |
| PCA | Principal component analysis |
| PLS-DA | Projection to latent structure discriminant analysis |
| qRT-PCR | Quantitative real-time polymerase chain reaction |
| TCA | Tricarboxylic acid |
| WT | Wild type |
References
- Yu, J.; Hu, S.N.; Wang, J.; Wong, G.K.S.; Li, S.G.; Liu, B.; Deng, Y.J.; Dai, L.; Zhou, Y.; Zhang, X.Q.; et al. A draft sequence of the rice genome (Oryza sativa L. ssp indica). Science 2002, 296, 79–92. [Google Scholar] [CrossRef] [PubMed]
- Khush, G.S. Green revolution: Preparing for the 21st century. Genome 1999, 42, 646–655. [Google Scholar] [CrossRef] [PubMed]
- Morinaka, Y.; Sakamoto, T.; Inukai, Y.; Agetsuma, M.; Kitano, H.; Ashikari, M.; Matsuoka, M. Morphological alteration caused by brassinosteroid insensitivity increases the biomass and grain production of rice. Plant Physiol. 2006, 141, 924–931. [Google Scholar] [CrossRef] [PubMed]
- Berry, P.M.; Sterling, M.; Spink, J.H.; Baker, C.J.; Sylvester-Bradley, R.; Mooney, S.J.; Tams, A.R.; Ennos, A.R. Understanding and reducing lodging in cereals. Adv. Agron. 2004, 84, 217–271. [Google Scholar]
- Ramamoorthy, R.; Jiang, S.Y.; Ramachandran, S. Oryza sativa Cytochrome P450 Family Member OsCYP96B4 Reduces Plant Height in a Transcript Dosage Dependent Manner. PLoS ONE 2011, 6, e28069. [Google Scholar] [CrossRef]
- Zhang, J.; Liu, X.Q.; Li, S.Y.; Cheng, Z.K.; Li, C.Y. The Rice Semi-Dwarf Mutant sd37, Caused by a Mutation in CYP96B4, Plays an Important Role in the Fine-Tuning of Plant Growth. PLoS ONE 2014, 9, e88068. [Google Scholar] [CrossRef]
- Asano, K.; Hirano, K.; Ueguchi-Tanaka, M.; Angeles-Shim, R.B.; Komura, T.; Satoh, H.; Kitano, H.; Matsuoka, M.; Ashikari, M. Isolation and characterization of dominant dwarf mutants, Slr1-d, in rice. Mol. Genet. Genomics 2009, 281, 223–231. [Google Scholar] [CrossRef]
- Tong, J.P.; Han, Z.S.; Han, A.N.; Liu, X.J.; Zhang, S.Y.; Fu, B.Y.; Hu, J.; Su, J.P.; Li, S.Q.; Wang, S.J.; et al. Sdt97: A Point Mutation in the 5 Untranslated Region Confers Semidwarfism in Rice. G3-Genes Genomes Genet. 2016, 6, 1491–1502. [Google Scholar] [CrossRef]
- Xu, J.; Wang, X.Y.; Guo, W.Z. The cytochrome P450 superfamily: Key players in plant development and defense. J. Integr. Agric. 2015, 14, 1673–1686. [Google Scholar] [CrossRef]
- Zhang, D.; Yang, H.F.; Wang, X.C.; Qiu, Y.J.; Tian, L.H.; Qi, X.Q.; Qu, L. Cytochrome P450 family member CYP96B5 hydroxylates alkanes to primary alcohols and is involved in rice leaf cuticular wax synthesis. New Phytol. 2020, 225, 2094–2107. [Google Scholar] [CrossRef]
- Wang, X.L.; Cheng, Z.J.; Zhao, Z.C.; Gan, L.; Qin, R.Z.; Zhou, K.N.; Ma, W.W.; Zhang, B.C.; Wang, J.L.; Zhai, H.Q.; et al. BRITTLE SHEATH1 encoding OsCYP96B4 is involved in secondary cell wall formation in rice. Plant Cell Rep. 2016, 35, 745–755. [Google Scholar] [CrossRef] [PubMed]
- Tamiru, M.; Undan, J.R.; Takagi, H.; Abe, A.; Yoshida, K.; Undan, J.Q.; Natsume, S.; Uemura, A.; Saitoh, H.; Matsumura, H.; et al. A cytochrome P450, OsDSS1, is involved in growth and drought stress responses in rice (Oryza sativa L.). Plant Mol. Biol. 2015, 88, 85–99. [Google Scholar] [CrossRef]
- Nicholson, J.K.; Lindon, J.C.; Holmes, E. ‘Metabonomics’: Understanding the metabolic responses of living systems to pathophysiological stimuli via multivariate statistical analysis of biological NMR spectroscopic data. Xenobiotica 1999, 29, 1181–1189. [Google Scholar] [CrossRef] [PubMed]
- Fiehn, O. Metabolomics-the link between genotypes and phenotypes. Plant Mol. Biol. 2002, 48, 155–171. [Google Scholar] [CrossRef] [PubMed]
- Nicholson, J.K.; Connelly, J.; Lindon, J.C.; Holmes, E. Metabonomics: A platform for studying drug toxicity and gene function. Nat. Rev. Drug Discovery 2002, 1, 153–161. [Google Scholar] [CrossRef] [PubMed]
- Fiehn, O.; Kopka, J.; Dormann, P.; Altmann, T.; Trethewey, R.N.; Willmitzer, L. Metabolite profiling for plant functional genomics. Nat. Biotechnol. 2000, 18, 1157–1161. [Google Scholar] [CrossRef]
- Tang, H.R.; Wang, Y.L. Metabonomics: A revolution in progress. Prog. Biochem. Biophys. 2006, 33, 401–417. [Google Scholar]
- Jacobs, A.; Lunde, C.; Bacic, A.; Tester, M.; Roessner, U. The impact of constitutive heterologous expression of a moss Na+ transporter on the metabolomes of rice and barley. Metabolomics 2007, 3, 307–317. [Google Scholar] [CrossRef]
- Barding, G.A.; Fukao, T.; Beni, S.; Bailey-Serres, J.; Larive, C.K. Differential Metabolic Regulation Governed by the Rice SUB1A Gene during Submergence Stress and Identification of Alanylglycine by H-1 NMR Spectroscopy. J. Proteome Res. 2012, 11, 320–330. [Google Scholar] [CrossRef]
- Chen, F.F.; Zhang, J.T.; Song, X.S.; Yang, J.; Li, H.P.; Tang, H.R.; Liao, Y.C. Combined metabonomic and quantitative real-time PCR analyses reveal systems metabolic changes of Fusarium graminearum induced by Tri5 gene deletion. J. Proteome Res. 2011, 10, 2273–2285. [Google Scholar] [CrossRef]
- Liu, C.X.; Ding, F.; Hao, F.H.; Yu, M.; Lei, H.H.; Wu, X.Y.; Zhao, Z.X.; Guo, H.X.; Yin, J.; Wang, Y.L.; et al. Reprogramming of Seed Metabolism Facilitates Pre-harvest Sprouting Resistance of Wheat. Sci. Rep. 2016, 6, 20593. [Google Scholar] [CrossRef] [PubMed]
- Kumar, Y.; Zhang, L.M.; Panigrahi, P.; Dholakia, B.B.; Dewangan, V.; Chavan, S.G.; Kunjir, S.M.; Wu, X.Y.; Li, N.; Rajmohanan, P.R.; et al. Fusarium oxysporum mediates systems metabolic reprogramming of chickpea roots as revealed by a combination of proteomics and metabolomics. Plant Biotechnol. J. 2016, 14, 1589–1603. [Google Scholar] [CrossRef] [PubMed]
- Liu, C.X.; Hao, F.H.; Hu, J.; Zhang, W.L.; Wan, L.L.; Zhu, L.L.; Tang, H.R.; He, G.C. Revealing different systems responses to brown planthopper infestation for pest susceptible and resistant rice plants with the combined metabonomic and gene-expression analysis. J. Proteome Res. 2010, 9, 6774–6785. [Google Scholar] [CrossRef] [PubMed]
- Villette, C.; Zumsteg, J.; Schaller, H.; Heintz, D. Non-targeted metabolic profiling of BW312 Hordeum vulgare semi dwarf mutant using UHPLC coupled to QTOF high resolution mass spectrometry. Sci. Rep. 2018, 8, 13178. [Google Scholar] [CrossRef]
- Cevallos-Cevallos, J.M.; Jines, C.; Mariduena-Zavala, M.G.; Molina-Miranda, M.J.; Ochoa, D.E.; Flores-Cedeno, J.A. GC-MS metabolite profiling for specific detection of dwarf somaclonal variation in banana plants. Appl. Plant Sci. 2018, 6, e1194. [Google Scholar] [CrossRef]
- Flores, P.; Hernandez, V.; Hellin, P.; Fenoll, J.; Cava, J.; Mestre, T.; Martinez, V. Metabolite profile of the tomato dwarf cultivar Micro-Tom and comparative response to saline and nutritional stresses with regard to a commercial cultivar. J. Sci. Food Agric. 2016, 96, 1562–1570. [Google Scholar] [CrossRef]
- John, K.M.M.; Khan, F.; Luthria, D.L.; Matthews, B.; Garrett, W.M.; Natarajan, S. Proteomic and metabolomic analysis of minimax and Williams 82 soybeans grown under two different conditions. J. Food Biochem. 2017, 41, e12404. [Google Scholar] [CrossRef]
- Blomstedt, C.K.; O’Donnell, N.H.; Bjarnholt, N.; Neale, A.D.; Hamill, J.D.; Moller, B.L.; Gleadow, R.M. Metabolic consequences of knocking out UGT85B1, the gene encoding the glucosyltransferase required for synthesis of dhurrin in Sorghum bicolor (L. Moench). Plant Cell Physiol. 2016, 57, 373–386. [Google Scholar] [CrossRef]
- Fan, W.M.T. Metabolite profiling by one- and two-dimensional NMR analysis of complex mixtures. Prog. Nucl. Magn. Reson. Spectrosc. 1996, 28, 161–219. [Google Scholar] [CrossRef]
- Shelp, B.J.; Bown, A.W.; McLean, M.D. Metabolism and functions of gamma-aminobutyric acid. Trends Plant Sci. 1999, 4, 446–452. [Google Scholar] [CrossRef]
- Bouche, N.; Fait, A.; Bouchez, D.; Moller, S.G.; Fromm, H. Mitochondrial succinic-semialdehyde dehydrogenase of the gamma-aminobutyrate shunt is required to restrict levels of reactive oxygen intermediates in plants. Proc. Natl. Acad. Sci. USA 2003, 100, 6843–6848. [Google Scholar] [CrossRef] [PubMed]
- Koike, S.; Matsukura, C.; Takayama, M.; Asamizu, E.; Ezura, H. Suppression of gamma-Aminobutyric Acid (GABA) Transaminases Induces Prominent GABA Accumulation, Dwarfism and Infertility in the Tomato (Solanum lycopersicum L.). Plant Cell Physiol. 2013, 54, 793–807. [Google Scholar] [CrossRef] [PubMed]
- Akama, K.; Takaiwa, F. C-terminal extension of rice glutamate decarboxylase (OsGAD2) functions as an autoinhibitory domain and overexpression of a truncated mutant results in the accumulation of extremely high levels of GABA in plant cells. J. Exp. Bot. 2007, 58, 2699–2707. [Google Scholar] [CrossRef] [PubMed]
- Yang, X.L.; Nian, J.Q.; Xie, Q.J.; Feng, J.; Zhang, F.X.; Jing, H.W.; Zhang, J.; Dong, G.J.; Liang, Y.; Peng, J.L.; et al. Rice Ferredoxin-Dependent Glutamate Synthase Regulates Nitrogen-Carbon Metabolomes and Is Genetically Differentiated between japonica and indica Subspecies. Mol. Plant 2016, 9, 1520–1534. [Google Scholar] [CrossRef] [PubMed]
- Bao, Y.X.; Zhao, R.; Li, F.F.; Tang, W.; Han, L.B. Simultaneous Expression of Spinacia oleracea Chloroplast Choline Monooxygenase (CMO) and Betaine Aldehyde Dehydrogenase (BADH) Genes Contribute to Dwarfism in Transgenic Lolium perenne. Plant Mol. Biol. Rep. 2011, 29, 379–388. [Google Scholar] [CrossRef]
- Fan, C.F.; Feng, S.Q.; Huang, J.F.; Wang, Y.T.; Wu, L.M.; Li, X.K.; Wang, L.Q.; Tu, Y.Y.; Xia, T.; Li, J.Y.; et al. AtCesA8-driven OsSUS3 expression leads to largely enhanced biomass saccharification and lodging resistance by distinctively altering lignocellulose features in rice. Biotechnol. Biofuels 2017, 10, 221. [Google Scholar] [CrossRef]
- Huang, P.; Yoshida, H.; Yano, K.; Kinoshita, S.; Kawai, K.; Koketsu, E.; Hattori, M.; Takehara, S.; Huang, J.; Hirano, K.; et al. OsIDD2, a zinc finger and INDETERMINATE DOMAIN protein, regulates secondary cell wall formation. J. Integr. Plant Biol. 2018, 60, 130–143. [Google Scholar] [CrossRef]
- Wu, B.M.; Li, L.; Qiu, T.H.; Zhang, X.; Cui, S.X. Cytosolic APX2 is a pleiotropic protein involved in H2O2 homeostasis, chloroplast protection, plant architecture and fertility maintenance. Plant Cell Rep. 2018, 37, 833–848. [Google Scholar] [CrossRef]
- Beeler, S.; Liu, H.C.; Stadler, M.; Schreier, T.; Eicke, S.; Lue, W.L.; Truernit, E.; Zeeman, S.C.; Chen, J.; Kotting, O. Plastidial NAD-Dependent Malate Dehydrogenase Is Critical for Embryo Development and Heterotrophic Metabolism in Arabidopsis. Plant Physiol. 2014, 164, 1175–1190. [Google Scholar] [CrossRef]
- Itai, R.; Suzuki, K.; Yamaguchi, H.; Nakanishi, H.; Nishizawa, N.K.; Yoshimura, E.; Mori, S. Induced activity of adenine phosphoribosyltransferase (APRT) in iron-deficient barley roots: A possible role for phytosiderophore production. J. Exp. Bot. 2000, 51, 1179–1188. [Google Scholar] [CrossRef]
- Casartelli, A.; Melino, V.J.; Baumann, U.; Riboni, M.; Suchecki, R.; Jayasinghe, N.S.; Mendis, H.; Watanabe, M.; Erban, A.; Zuther, E.; et al. Opposite fates of the purine metabolite allantoin under water and nitrogen limitations in bread wheat. Plant Mol.Biol. 2019, 99, 477–497. [Google Scholar] [CrossRef] [PubMed]
- Zhou, C.J.; Li, J.; Zou, J.C.; Liang, F.S.; Ye, C.J.; Jin, D.M.; Weng, M.L.; Wang, B. Cloning and characterization of a second form of the rice adenine phosphoribosyl transferase gene (OsAPT2) and its association with TGMS. Plant Mol.Biol. 2006, 60, 365–376. [Google Scholar] [CrossRef] [PubMed]
- Moffatt, B.; Somerville, C. Positive selection for male-sterile mutants of Arabidopsis lacking adenine phosphoribosyl transferase activity. Plant Physiol. 1988, 86, 1150–1154. [Google Scholar] [CrossRef] [PubMed]
- Tzin, V.; Galili, G. The Biosynthetic Pathways for Shikimate and Aromatic Amino Acids in Arabidopsis thaliana. Arabidopsis Book 2010, 8, e0132. [Google Scholar] [CrossRef]
- Tzin, V.; Galili, G. New Insights into the Shikimate and Aromatic Amino Acids Biosynthesis Pathways in Plants. Mol. Plant 2010, 3, 956–972. [Google Scholar] [CrossRef]
- Yang, D.H.; Chung, B.Y.; Kim, J.S.; Kim, J.H.; Yun, P.Y.; Lee, Y.K.; Lim, Y.P.; Lee, M.C. cDNA cloning and sequence analysis of the rice cinnamate-4-hydroxylase gene, a cytochrome P450-dependent monooxygenase involved in the general phenylpropanoid pathway. J. Plant Biol. 2005, 48, 311–318. [Google Scholar] [CrossRef]
- Kim, J.I.; Dolan, W.L.; Anderson, N.A.; Chapple, C. Indole Glucosinolate Biosynthesis Limits Phenylpropanoid Accumulation in Arabidopsis thaliana. Plant Cell 2015, 27, 1529–1546. [Google Scholar] [CrossRef]
- Ahmad, I.; Kamran, M.; Ali, S.; Bilegjargal, B.; Cai, T.; Ahmad, S.; Meng, X.P.; Su, W.N.; Liu, T.N.; Han, Q.F. Uniconazole application strategies to improve lignin biosynthesis, lodging resistance and production of maize in semiarid regions. Field Crop. Res. 2018, 222, 66–77. [Google Scholar] [CrossRef]
- Wang, C.; Hu, D.; Liu, X.B.; She, H.Z.; Ruan, R.W.; Yang, H.; Yi, Z.L.; Wu, D.Q. Effects of uniconazole on the lignin metabolism and lodging resistance of culm in common buckwheat (Fagopyrum esculentum M.). Field Crop. Res. 2015, 180, 46–53. [Google Scholar] [CrossRef]
- Nishikubo, N.; Araki, T.; Kajita, S.; Kuroda, K.; Kitano, H.; Katayama, Y. Specific accumulation of polysaccharide-linked hydroxycinnamoyl esters in the cell walls of irregularly shaped and collapsed internode parenchyma cells of the dwarf rice mutant Fukei 71. Plant Cell Physiol. 2000, 41, 776–784. [Google Scholar] [CrossRef]
- Kim, Y.S.; Park, S.; Kang, K.; Lee, K.; Back, K. Tyramine accumulation in rice cells caused a dwarf phenotype via reduced cell division. Planta 2011, 233, 251–260. [Google Scholar] [CrossRef] [PubMed]
- Lee, K.; Back, K. Melatonin-deficient rice plants show a common semidwarf phenotype either dependent or independent of brassinosteroid biosynthesis. J. Pineal Res. 2019, 66, e12537. [Google Scholar] [CrossRef] [PubMed]
- Murashige, T.; Skoog, F. A revised medium for rapid growth and bio assays with tobacco tissue cultures. Physiol. Plant. 1962, 15, 473–497. [Google Scholar] [CrossRef]
- Jiang, L.M.; Huang, J.; Wang, Y.L.; Tang, H.R. Metabonomic analysis reveals the CCl4-induced systems alterations for multiple rat organs. J. Proteome Res. 2012, 11, 3848–3859. [Google Scholar] [CrossRef] [PubMed]
- Jiang, L.; Lee, S.C.; Ng, T.C. Pharmacometabonomics Analysis Reveals Serum Formate and Acetate Potentially Associated with Varying Response to Gemcitabine-Carboplatin Chemotherapy in Metastatic Breast Cancer Patients. J. Proteome Res. 2018, 17, 1248–1257. [Google Scholar] [CrossRef] [PubMed]
- Jiang, L.M.; Zhao, X.J.; Huang, C.Y.; Lei, H.H.; Tang, H.R.; Wang, Y.L. Dynamic changes in metabolic profiles of rats subchronically exposed to mequindox. Mol. Biosyst. 2014, 10, 2914–2922. [Google Scholar] [CrossRef]
- Jiang, L.; Wang, J.; Li, R.; Fang, Z.-M.; Zhu, X.-H.; Yi, X.; Lan, H.; Wei, X.; Jiang, D.-S. Disturbed energy and amino acid metabolism with their diagnostic potential in mitral valve disease revealed by untargeted plasma metabolic profiling. Metabolomics 2019, 15, 57. [Google Scholar] [CrossRef]
- Jiang, L.M.; Huang, J.; Wang, Y.L.; Tang, H.R. Eliminating the dication-induced intersample chemical-shift variations for NMR-based biofluid metabonomic analysis. Analyst 2012, 137, 4209–4219. [Google Scholar] [CrossRef]
- Trygg, J.; Wold, S. Orthogonal projections to latent structures (O-PLS). J. Chemom. 2002, 16, 119–128. [Google Scholar] [CrossRef]
- Lindgren, F.; Hansen, B.; Karcher, W.; Sjostrom, M.; Eriksson, L. Model validation by permutation tests: Applications to variable selection. J. Chemom. 1996, 10, 521–532. [Google Scholar] [CrossRef]
- Eriksson, L.; Trygg, J.; Wold, S. CV-ANOVA for significance testing of PLS and OPLS® models. J. Chemom. 2008, 22, 594–600. [Google Scholar] [CrossRef]
- Cloarec, O.; Dumas, M.E.; Trygg, J.; Craig, A.; Barton, R.H.; Lindon, J.C.; Nicholson, J.K.; Holmes, E. Evaluation of the orthogonal projection on latent structure model limitations caused by chemical shift variability and improved visualization of biomarker changes in 1H NMR spectroscopic metabonomic studies. Anal. Chem. 2005, 77, 517–526. [Google Scholar] [CrossRef] [PubMed]
- Pryor, R.J.; Wittwer, C.T. Real-time polymerase chain reaction and melting curve analysis. In Methods in Molecular Biology; Lo, Y.M.D., Chiu, R.W.K., Chan, K.C.A., Eds.; 999 Riverview Dr, Ste 208; Humana Press Inc.: Totowa, NJ, USA, 2006; Volume 336, pp. 19–32. [Google Scholar]
- Livak, K.J.; Schmittgen, T.D. Analysis of relative gene expression data using real-time quantitative PCR and the 2-△△Ct method. Methods 2001, 25, 402–408. [Google Scholar] [CrossRef] [PubMed]
- Kanehisa, M.; Goto, S. KEGG: Kyoto Encyclopedia of Genes and Genomes. Nucleic Acids Res. 2000, 28, 27–30. [Google Scholar] [CrossRef]


© 2020 by the authors. Licensee MDPI, Basel, Switzerland. This article is an open access article distributed under the terms and conditions of the Creative Commons Attribution (CC BY) license (http://creativecommons.org/licenses/by/4.0/).