Abstract
Improving nitrogen use efficiency (NUE) is very important for crops throughout the world. Rice mainly utilizes ammonium as an N source, but it also has four NRT2 genes involved in nitrate transport. The OsNRT2.3b transporter is important for maintaining cellular pH under mixed N supplies. Overexpression of this transporter driven by a ubiquitin promoter in rice greatly improved yield and NUE. This strategy for improving the NUE of crops may also be important for other cereals such as wheat and barley, which also face the challenges of nutrient uptake balance. To test this idea, we constructed transgenic barley lines overexpressing OsNRT2.3b. These transgenic barley lines overexpressing the rice transporter exhibited improved growth, yield, and NUE. We demonstrated that NRT2 family members and the partner protein HvNAR2.3 were also up-regulated by nitrate treatment (0.2 mM) in the transgenic lines. This suggests that the expression of OsNRT2.3b and other HvNRT2 family members were all up-regulated in the transgenic barley to increase the efficiency of N uptake and usage. We also compared the ubiquitin (Ubi) and a phloem-specific (RSs1) promoter-driven expression of OsNRT2.3b. The Ubi promoter failed to improve nutrient uptake balance, whereas the RSs1 promoter succeed in increasing the N, P, and Fe uptake balance. The nutrient uptake enhancement did not include Mn and Mg. Surprisingly, we found that the choice of promoter influenced the barley phenotype, not only increasing NUE and grain yield, but also improving nutrient uptake balance.
1. Introduction
Plants take up and use various N forms from soil, mostly the inorganic ions ammonium (NH4+) and nitrate (NO3−) [1,2,3]. Plant growth and development needs the presence of NO3− [4]. To adjust to the different concentrations of NO3− in the soil, plants have developed multiple nitrate uptake systems. There are three known nitrate uptake systems: a constitutively high-affinity transport system (cHATS); a NO3− inducible high-affinity transport system (iHATS); and a low-affinity constitutively expressed transport system (LATS) [5,6,7,8]. The energy for the activity of these transport systems is mainly derived from the proton electrochemical gradient across membranes [9,10]. A better understanding of how plants respond to nitrate availability in soil and regulate uptake is important for increasing nitrogen use efficiency (NUE).
Additionally, cellular pH homeostasis also plays an important role in plant growth and development. The “loosening” of cell walls occurs at low pH, which leads to cell elongation [11] and growth. Normally, the amount and ratio of the two inorganic N forms can affect plant pH homeostasis in the local environment and inside cells. Within the plant, the phloem is a vascular network tissue connecting the shoot and root for transporting nutrients and communicating signals [12]. Simultaneously, phloem pH homeostasis maintains the physiological balance of the whole plant for better transporting and signaling functions in this tissue.
There are at least 53 NRT1 and seven NRT2 membrane nitrate transporters in Arabidopsis [9,13]. The NRT1 family mostly includes low-affinity nitrate transporters, with the exception of CHLI (AtNRT1.1), which is a dual-affinity nitrate transporter and transceptor [14,15,16]. CHL1 was the first nitrate transporter identified in plants [17] and may function as a nitrate sensor operating over a wide range of concentrations and having a specific involvement in nascent organ development [14,18]. NRT2s are high-affinity nitrate transporters that need a partner protein, NAR2, to perform their functions [19,20,21,22]. Several transporters are mainly involved in long-distance xylem and phloem nitrate transport within the plant [23,24,25], and studies have identified five NRT2 genes in rice [26,27]. OsNRT2.1, OsNRT2.2, and OsNRT2.3a need to interact with the partner protein OsNAR2.1 for nitrate uptake, whereas OsNRT2.3b and OsNRT2.4 can function independently without OsNAR2.1 [27,28,29,30]. OsNRT2.3 has two transcripts, OsNRT2.3a (AK109776) and OsNRT2.3b (AK072215), which exhibit 94% similarity in amino acid sequences [25]. OsNRT2.3b is mainly expressed in the phloem and has a regulatory motif on the cytosolic side that switches nitrate transport activity on/off by a pH-sensing mechanism [10]. OsNRT2.3b overexpression in rice can improve the pH-buffering capacity and increase N, Fe, and P uptake [25].
Barley (Hordeum vulgare L.) was domesticated in the Fertile Crescent about 10,000 years ago [31]. Today, barley is an economically important crop that is mainly used in the production of malt, food, animal feed, and medicine [32]. In addition, barley is also an important model species for Triticeae genomics, and it has extensive physiological information on N uptake and transport [33]. Crop yield is affected by a variety of factors, of which N is a key factor. Plants usually assimilate N from nitrate (NO3−) or ammonium (NH4+) from soils [3]. However, these chemical species can also be converted to N2O by microbial metabolism, leading to environmental N losses and deficiency [34], which can be a serious threat to crop development and growth.
A larger number of candidate transporter genes that may be responsible for nitrate uptake and transport have been identified in many species. In this study, we transferred the high-affinity nitrate transporter rice gene OsNRT2.3b into barley by using Agrobacterium-mediated transformation technology [35]. Then, we studied nutrient uptake and crop yield in the different transgenic lines.
2. Results
2.1. Confirmation of Transgenic Barley Lines with Real-Time Quantitative PCR and Western Blotting
The segregating population of T0-generation transgenic barley transformed with OsNRT2.3b was selected with 50 mg/L hygromycin, and 200 lines were acquired. Then, T1 transgenic plants were screened from null segregates by the germination of seed on hygromycin (100 mg/L), and we obtained three independent T2 lines for each type of transgenic barley. The T2 generation of Ubi-1/2/3 and RSs1-1/2/3 was further characterized by real-time PCR and Western blotting. RNA and protein were extracted from stems of all barley lines in the tillering stage, and RT-PCR analyses indicated an absence of OsNRT2.3b transcription in the wild-type (WT) barley. However, the stems of transgenic barley lines had different expression levels of OsNRT2.3b mRNA (Figure 1A). The overexpression of OsNRT2.3b was higher in Ubi-1/2/3 transgenic lines than in RSs1-1/2/3 transgenic barley (Figure 1A). Likewise, Western blotting showed that the OsNRT2.3b protein just appeared in overexpression barley lines, not in wild type (Figure 1B). The expression of OsNRT2.3b in the Ubi-3 barley line was determined at the transcriptional and protein levels in transgenic barley lines (Figure 1). Meanwhile, the copy numbers of transgenic barley lines were identified by Southern blot (Figure S1). The results show that Ubi-1/2/3 and RSs1-1/2 were one copy insertion lines and RSs1-3 was two copy insertion line.
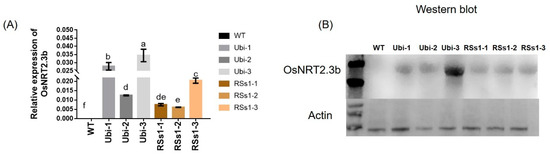
Figure 1.
The OsNRT2.3b mRNA and protein expression levels in transgenic lines and WT barley plants. All plants were grown in soil in pots. (A) Real-time quantitative PCR analysis of OsNRT2.3b mRNA. Different letters indicate a significant difference between transgenic and WT plants (p < 0.05, one-way ANOVA). Error bars: standard error (n = 4 plants). (B) Western blot analysis of OsNRT2.3b expression in the barley stem. Total proteins were separated by SDS-PAGE, transferred to a polyvinylidene fluoride membrane (Thermo), and hybridized with an OsNRT2.3b-specific antibody. Each lane was loaded with an equal quantity of proteins (30 μg). WT: wild-type; Ubi-1/2/3 and RSs1-1/2/3 overexpression were performed with the ubiquitin promoter and phloem-specific promoter (RSs1) driven OsNRT2.3b gene, respectively, as below.
2.2. Phenotype of Transgenic Barley Lines during the Vegetative Growth Stage
Representative photographs of these transgenic barley lines during the vegetative growth stage are shown in Figure 2A,B. The Ubi-1 and Ubi-3 lines grew better than WT at the seeding stage (Figure 2A). Correspondingly, the fresh weights of Ubi-1/3 were higher than the WT (Figure 2C). By contrast, the RSs1-1/2/3 line had a better phenotype than the wild type in plant weight and tiller at the tillering stage (Figure 2B). The fresh weights of the transgenic lines were also increased at the tillering stage, besides the RSs1-3 line not being marked (Figure 2D). These results indicated that the rice nitrate transporter gene NRT2.3b can function in barley to increase growth. Moreover, the effect of the ubiquitin promoter driving strong gene expression in rapidly dividing cells is faster in the phenotype than in RSs1, which is a phloem-specific promoter (Figure 2A,B), or expressing OsNRT2.3b in the phloem of rice by in situ experiment [25,26].
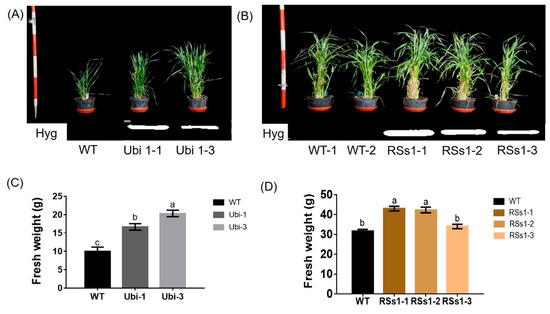
Figure 2.
Phenotypes of all barley plants in pot experiments during the vegetative growth stage. (A) The phenotypes and (C) fresh weight of WT and Ubi-1/2/3 transgenic lines. (B) The phenotypes and (D) fresh weight of WT and RSs1-1/2/3 transgenic lines. Different letters indicate a significant difference between overexpression transgenic lines and WT (p < 0.05, one-way ANOVA). Error bars: standard error (n = 4 plants).
2.3. Characterization of Transgenic Barley during the Reproductive Growth Stage
The phenotypes of all the barley lines were not significant different at the grain-filling stage. Grain-related indicators are the basic criteria for measuring crop yields. Thus, we measured the grain weight, N, and metal concentration in the seeds of all the barley lines. We found that the grain weight of the transgenic barley lines was increased relative to WT (Figure 3A). Moreover, the Ubi-1/2/3 and RSs1-1/2/3 lines were approximately 60% and 40% higher than those of the WT (Figure 3A). NUE in the transformants was higher than WT (ranging from 27% to 43%) (Figure 3C). The total N content of Ubi-1/2/3 was increased by 33%, whereas the total N of RSs1-1/2/3 lines was only increased 19% and exhibited no statistically significant difference compared to WT (Figure 3B). Furthermore, the Fe concentration in seeds was only increased in the Ubi-1/2/3 lines (Figure 3D). Additionally, we analyzed other elements in the seeds of different lines. The Ubi-1/2/3 lines exhibited no significant differences in manganese (Figure S2A) and magnesium (Figure S2B) concentrations relative to WT. This result was similar to the overexpression of OsNRT2.3b with Ubi promoter in rice seeds [36], but the manganese concentrations in RSs1-1/2/3 seeds were significantly lower than those in the WT (Figure S2A).
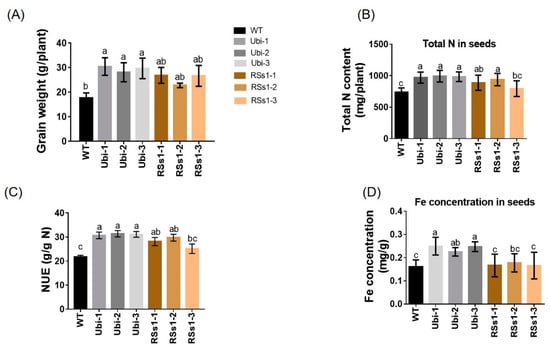
Figure 3.
Characterization of barley plants in pot experiments at maturity. (A) Grain weight, (B) total N contents in seeds, (C) nitrogen use efficiency (NUE), and (D) Fe concentration in seeds. Different letters indicate a significant difference between transgenic lines and WT (p < 0.05, one-way ANOVA). Error bars: standard error (n = 4 plants).
Seed size is an important agronomic trait; thus, we assessed seed morphology. The seeds of transgenic barley were larger than those of WT (Figure 4A, B). The seed lengths of Ubi-1/2/3 and RSs1-1/2/3 lines were increased by 9% and 10%, respectively (Figure 4A), and the seed widths of the Ubi-1/2/3 and RSs1-1/2/3 lines were increased by 24% and 27% compared with that of the WT (Figure 4B).
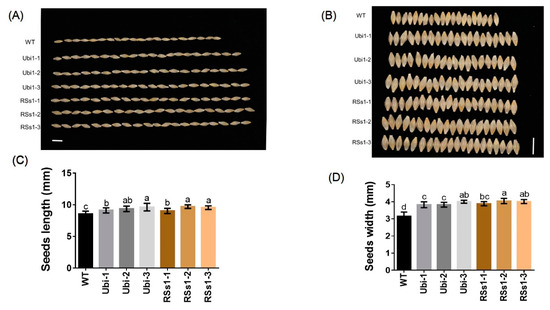
Figure 4.
Comparison of seed morphology in barley plants (A), (B) seed morphology images of all barley plants. Bars = 1 cm. (C) The length and (D) width of seeds. Different letters indicate a significant difference between transgenic lines and WT (p < 0.05, one-way ANOVA). Error bars: standard error (n = 4 plants). Bars = 1 cm.
These results indicate that a high expression of OsNRT2.3b with a pH-sensing motif in barley enhances the seed length and width to increase grain weight. Meanwhile, the ubiquitin promoter-driven expression of OsNRT2.3b in barley resulted in an improved Fe concentration in seeds when compared with the phloem-specific expression of OsNRT2.3b.
2.4. Plant Development and Metabolism at Maturity
Physiological indexes are used to measure plant development and metabolism, and plant shoot growth is the basis for normal plant ontogenesis and crop yield. The transgenic lines exhibited an increased tiller number per plant (Figure 5A) as well as increased shoot dry weight (Figure 5B). The Ubi-1/2/3 line exhibited an increased nitrate concentration in shoot by 23%, and the RSs1-1/2/3 lines showed an increasing trend, but it was not statistically significant compared with WT (Figure 5C). The stems of transgenic lines show a trend of increased total N content but it was not significantly different (Figure 5D), which was contrary to the increased total N of seeds in transgenic lines (Figure 3B).
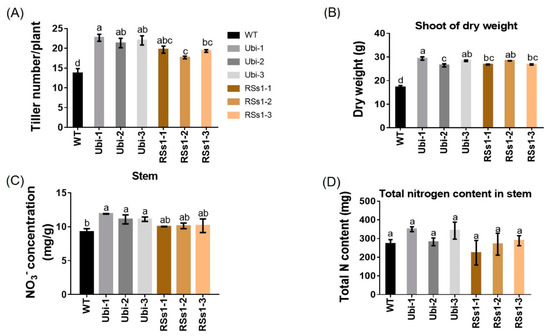
Figure 5.
Physiological indexes of shoots. (A) Tiller number, (B) dry weight, (C) nitrate concentration, and (D) total N content in shoots at maturity in pot experiments. Different letters indicate a significant difference between transgenic lines and WT (p < 0.05, one-way ANOVA). Error bars: standard error (n = 4 plants).
Taken together, OsNRT2.3b as a rice nitrate transporter can improve nitrate acquisition and transport in barley, which is a favored nitrate crop. This result is consistent with the overexpression of OsNRT2.3b in rice. [25].
2.5. NH4+ and NO3− Influx Rates in WT and OsNRT2.3b Transgenic Barley
The influence of OsNRT2.3b overexpression on the 15N-NH4+ and 15N-NO3− influx of hydroponically grown barley from root into intact plant was determined. Under 0.2 mM 15NH4+ supply, the transgenic barley lines exhibited no significant differences compared to WT (Figure 6A). In contrast, the uptake of 15N-NO3− was higher influx in transgenic lines after five minutes. The nitrate influx rates of the Ubi-1/2/3 and RSs1-1/2/3 lines were higher than that of the WT (ranging from 38% to 53%) (Figure 6B). These results indicated that the overexpression of the high-affinity nitrate transporter OsNRT2.3b improved NO3− uptake (Figure 6B) into the plant (Figure 5C), which resulted in an increased total N content in seeds (Figure 3B) to further enhance the grain yield.
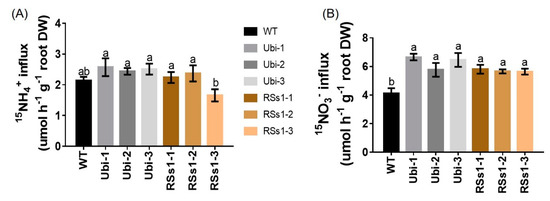
Figure 6.
NH4+ and NO3− influx rates of WT and transgenic plants measured using 15N-enriched sources. WT and transgenic barley seedlings were grown in 1/4 Hoagland nutrient solution for 2 weeks and N starved for 4 days. Then, NO3− and NH4+ influx rates were measured at (A) 0.2 mM 15NH4+ (B) 0.2 mM 15NO3− for 5 min. Different letters indicate a significant difference between transgenic and WT lines (p < 0.05, one-way ANOVA). Error bars: standard error (n = 4 plants).
2.6. The Effect of Different N Treatments on Gene Expression, and Total N, P, and Other Fe Concentration in Different Plant Parts
We investigated the effect of OsNRT2.3b overexpression on barley growth under different N treatments (0.2 mM NH4+ and 0.2 mM NO3−). NH4+ and NO3− treatments up-regulated the expression of OsNRT2.3b, which was mainly expressed in leaves and stem sheath (Figure 7A,D). The expression of OsNRT2.3b in leaves of the Ubi-1/2/3 lines was increased 1.6-fold and 3.8-fold, compared to the RSs1-1/2/3 lines treated with 0.2 mM NH4+ and 0.2 mM NO3−, respectively (Figure 7A,D). Interestingly, the expression of OsNRT2.3b in all lines treated with 0.2 mM NO3− was increased by more than 10-fold compared with 0.2 mM NH4+ treatment (Figure 7A,D). NH4+ treatment did not affect the dry weight of the different plant parts (Figure 7B) or the total N concentration in any of the lines (Figure 7C). In contrast, NO3− treatment increased the dry weight of leaves and sheaths in the transgenic lines (especially the Ubi-1/2/3 line), whereas the roots remained unaffected (Figure 7E). NO3− treatment exhibited a similar effect on the total N concentration (Figure 7F). These effects of NO3− treatment on dry weight and total N concentration corresponded with the expression of OsNRT2.3b under 0.2 mM NO3− treatment (Figure 7D).
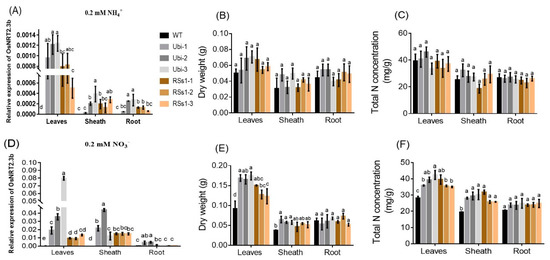
Figure 7.
The effect of different N supplies on the expression of OsNRT2.3b, plant dry weight, and total N concentration in different plant parts in hydroponic experiment. (A–C) 0.2 mM NH4+ treatment, (A) the relative expression of OsNRT2.3b; (B) the dry weight; (C) the total N concentration of different parts in all barley lines. (D–F) Under 0.2 mM NO3− treatment, (D) relative expression of OsNRT2.3b; (E) the dry weight; (F) the total nitrogen concentration of different parts in all barley lines. Error bars: standard error (n = 4 plants). Significant differences between transgenic and WT lines are indicated by different letters (p < 0.05, one-way ANOVA).
The effects of N treatment on the expression of different nitrate transporters expression in the different plant parts were also assessed. The nitrate transporters HvNRT2.1/2.2/2.3 and partner protein gene HvNAR2.3 in leaves and sheaths were also up-regulated in the transgenic lines under NO3− treatment, especially in the Ubi-1/2/3 lines (Figure S4A,B). The barley NRT2 gene family requires a partner protein gene HvNAR2.3 to transport nitrate [37]. Interestingly, HvNRT2.1/2.2/2.3 and HvNAR2.3 were not up-regulated in barley roots (Figure S4C). The elemental concentrations tested in different parts of all the barley lines showed no significant differences with the 0.2 mM NH4+ and NO3− treatments (Figure S5). From statistical analysis, NH4+ treatment did not affect the total N, P, or Fe in shoots and roots of any barley line (Table S3). However, the shoots of transgenic barley lines exhibited a higher total N than WT under 0.2 mM NO3− treatment. On the other hand, RSs1-1/2/3 exhibited the highest total P and Fe in shoots (Table 1). In contrast, the amounts of total N, P, and Fe exhibited an opposite trend in roots (Table 1). These results suggest that more nutrients were transported to the shoots from the roots for plant growth in the transgenic lines.

Table 1.
The effect of 0.2 mM NO3− treatment on the distribution of total N, P, and Fe in shoots and roots. Significant differences between the transgenic and WT lines are indicated by different letters (p < 0.05, one-way ANOVA)
In further hydroponic experiments, barley was grown in 10 mM NH4+/NO3−. A 10 mM NH4+ and NO3− supply resulted in an increased expression of OsNRT2.3b in the leaves of transgenic lines and a suppressed expression in sheaths and roots (Figure S6A,D). The dry weights of the different plant parts (Figure S6B,E) and the total N concentration (Figure S6C,F) were not affected by 10 mM NH4+ and NO3−. These results indicate that high N concentrations suppress the expression of the high-affinity nitrate transporter OsNRT2.3b to decrease N uptake and transfer.
2.7. The Characteristics of HvNRT2.5, a Gene Homologous to OsNRT2.3b
Barley has seven candidate members of the NRT2 family (HvNRT2.1-2.7) and three partner proteins HvNAR2 [38]. Interestingly, OsNRT2.3b has a high sequence similarity to HvNRT2.5 in barley (Figure S3). Furthermore, HvNRT2.5 has a pH-sensing motif similar to that identified in OsNRT2.3b [25] (Figure S3B). The relative expression of HvNRT2.5 in transgenic barley roots was up-regulated under 0.2 mM NO3− condition, compared with the wild types (Figure 8A). However, the relative expression of HvNRT2.5 in leaves and sheaths was not significantly different in all barley lines under 0.2 mM NO3− supply (Figure 8A). HvNRT2.5 transcript was clearly up-regulated in the roots under NO3− supply (Figure 8B). Simultaneously, we found that the HvNRT2.5 needs a partner protein HvNAR2.3 to transport nitrate under 0.25 mM NO3−, pH 5.5 supply when expressed in oocytes (Figure 9A). The co-injection of HvNRT2.5 and HvNAR2.3 in oocytes did not significantly increase nitrate transport relative to water-injected controls under 10 mM NO3−, pH 5.5 treatment (Figure 9B). These data indicated that HvNRT2.5 belongs to a high-affinity nitrate transporter and it needs a partner protein HvNAR2.3 to transfer nitrate in oocytes.
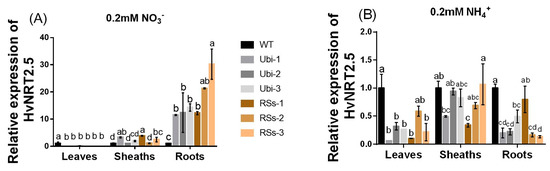
Figure 8.
The relative expression of the HvNRT2.5 gene homologous to OsNRT2.3b under 0.2 mM NH4+/NO3− treatments. The relative expression of HvNRT2.5 in leaves, sheaths, and roots (A) under 0.2 mM NO3− supply; (B) under 0.2mM NH4+ condition. Error bars: standard error (n = 4 plants). Significant differences between transgenic and WT lines are indicated by different letters (p < 0.05, one-way ANOVA).
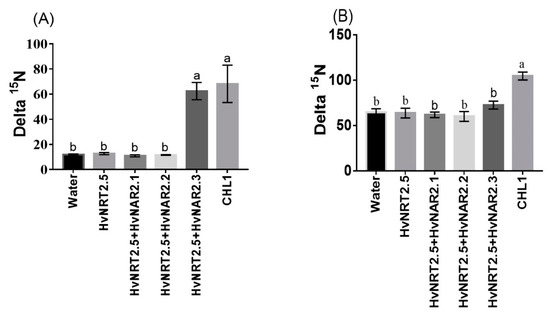
Figure 9.
Functional assay of HvNRT2.5 in Xenopus oocytes. Functional assay of HvNRT2.5, HvNAR2.1, HvNAR2.2, HvNAR2.3, and CHL1 activity in nitrate uptake in Xenopus oocytes. Uptake of 15NO3− into oocytes injected with water, single cRNA, or mixtures as indicated. Oocytes injected with cRNA and incubated for 10 h in modified Barth’s saline containing (A) 0.25 mM 15NO3− at pH 5.5, (B) at pH 5.5; 10 mM 15NO3−. The values are means +/-SE for seven oocytes for every concentration. Different letters indicate significant differences between the water and cRNA-injected oocytes of the same treatments (p < 0.05, one-way ANOVA). Three batches of oocytes were used for each test.
These data suggest that a low concentration of nitrate can increase OsNRT2.3b gene expression in barley more than a low ammonium treatment (Table S4, see Figure 2 in [36]), which in turn increases the transport of nutrients, and ultimately increases the grain yield in the transgenics. This may also be due to the up-regulation of HvNRT2.5 expression in the transgenic barley root, while increasing the nitrate uptake and overexpression of OsNRT2.3b in transgenic lines shoot further facilitates nitrate transport.
3. Discussion
Plant uptake of NO3− is carefully regulated depending on the N supply forms and N status of the plant [39]. In rice, it has been reported that the OsNRT2 gene family has key functions in the uptake of NO3− from soil and transport from root to shoot [10,25,26,40,41]. Normally, the OsNRT2 family (except OsNRT2.3b) requires the partner protein OsNAR2.1 for transporting nitrate [30]. OsNRT2.3b is one of the two transcripts with variation in expression and contains a pH-sensing motif that can regulate the transport activity under various N supply forms and improve NUE and grain yield [10]. However, it is not known whether the OsNRT2.3b transporter can exert a nitrate transport function in barley. In this study, the main objective was to demonstrate whether the overexpression of OsNRT2.3b driven by the strong promoter (ubiquitin) and the phloem-specific promoter (RSs1) in barley can enhance the transport of nutrients as well as improve NUE and grain yield.
We found that the increased biomass phenotype appeared earlier in the strong promoter (ubiquitin) OsNRT2.3b lines when compared with the phloem-specific promoter (RSs1) barley lines (Figure 2). The fresh weights of Ubi and RSs1 barley lines were higher than those of the WT (ranging from 28% to 77%) (Figure 2C,D). Correspondingly, the expression of OsNRT2.3b at the RNA and protein level in transgenic ubiquitin-driven lines was higher than that in the phloem-specific promoter lines (Figure 1). The short-term 15N-NO3− influx rate was increased in the lines with an overexpression of OsNRT2.3b, showing that increased levels of the rice transporter in barley can increase nitrate uptake compared with WT under an external 0.2 mM NO3− supply (Figure 6). More nitrate was transferred from the root to the shoot in the transgenic barley. Therefore, the measured nitrate concentrations in shoots in transgenic barley were higher than those in WT (Figure 5C). These data demonstrated that OsNRT2.3b expressed in barley is directly involved in nitrate uptake and transport, which also leads to change in phenotypes, seed morphology, and biomass in transgenic lines (Figure 2, Figure 3, Figure 4). However, the phenotypes of transgenic lines exhibited no visible significant differences during the grain-filling period (Figure 3A). One explanation is that when a critical plant size is established, the overexpression of OsNRT2.3b no longer influenced plant biomass, emphasizing the importance of N supply for establishing the vegetative phase of growth. Another explanation is that the phloem-specific overexpression of OsNRT2.3b just enriched sieve-tube nitrate, and the optimizing pH homeostasis function in phloem cells could increase the long-distance transport of total P and Fe to accumulate more biomass and grain yield during the later growth stages (Table 1). The N content in the two transgenic lines is similar, and there was a comparable P/Fe content change (Table 1). As for the reason why N content was similar in two types of transgenic plants, we think that even though the Ubi promoter was driving the expression in all the types of cells, the phloem-specific expression contributed a stronger functional influence on N transport in the plants. Indeed, the overexpression of OsNRT2.3b in rice can maintain a relatively low phloem sap pH, which enhanced the accumulation of total P and Fe in leaves [25]. Therefore, the overexpression of OsNRT2.3b driven by the phloem (RSs1) promoter can achieve a similar phenotypic effect to that provided by the strong expression of the Ubi promoter. Nevertheless, the detailed molecular mechanism remains to be revealed.
The OsNRT2.3 gene had two transcripts: OsNRT2.3a and b. In rice, the expression of OsNRT2.3a occurred in roots and was induced by nitrate treatment, whereas the expression of OsNRT2.3b was relatively weak in roots, but it was abundant in leaves [25,42]. The expression of OsNRT2.3b is generally very low in WT rice [25]. Some HvNRT2 family members require the partner protein HvNAR2.3 to transport nitrate in barley, but not HvNAR2.1 [37]. Some papers have reported that the HvNRT2.1, HvNRT2.2, and HvNRT2.3 genes belong to the high-affinity nitrate transporter family [43,44]. The oocyte data shows that HvNRT2.5 also belongs to the high-affinity nitrate transporter family (Figure 9A,B).
Interestingly, the expression pattern of OsNRT2.3b was affected by the external N supply forms (Figure 7A,D). One explanation is that a lower expression of OsNRT2.3b in NH4+ plants compared to NO3− plants, as shown in Figure 7, may result from another level of regulation by a micro RNA [45]. Additionally, the expression of OsNRT2.3b was increased in Ubi transgenic barley more than in the RSs1 transgenic barley lines under 0.2 mM NO3− supply (Table S4). The high-affinity nitrate transporter OsNRT2.3b was strongly expressed in the leaves of transgenic barley under high NH4+/NO3− supply and weakly expression in the sheath and root (Figure S6) [46]. This may be due to feedback regulation from the external N form and concentration. The expression of other HvNRT2s in transgenic lines was altered only by 0.2 mM NO3− supply, but not NH4+ (Figure S4 and Figure 8). The accumulation of HvNRT2.1/2.2/2.3 transcript was observed in the wild-type barley roots under NO3− supply [38]. However, the expression of HvNRT2.1/2.2/2.3 was suppressed in the roots of the transgenic lines (Figure S4C). The suppression of these genes may be due to a greater accumulation of NO3− in the roots, which directly down-regulated the expression of HvNRT2.1/2.2/2.3. This was in contrast to the high-affinity nitrate transporter HvNRT2.5 expression pattern in transgenic barley roots under 0.2 mM NO3− supply (Figure 8). We also found that the expression of HvNRT2.1/2.2 and partner protein gene HvNAR2.3 were all up-regulated in the transgenic leaves to response to increased nitrate in the barley plant under 0.2 mM NO3− supply (Figure S4A). Nitrate is the predominant form of N supply for barley, and thus we suggest that NO3− uptake through increased OsNRT2.3b expression leads to the induction of HvNAR2.3 expression. These results indicate that nitrate feedback signaling in barley can alter the expression patterns of HvNRT2s in the transgenic lines.
The up-regulation of HvNRT2.5 in the transgenic lines roots improved nitrate uptake, and the overexpression of OsNRT2.3b promoted more nitrate transport to the shoots in the transgenic lines. Transgenic technology has been successfully used to up-regulate the expression of OsNRT2.3b in barley. The characterization of these transgenic barley lines has demonstrated that this rice high-affinity nitrate transporter has a specific role in nitrate uptake and transport from root to shoot in barley.
4. Materials and Methods
4.1. Plant Materials
We amplified the OsNRT2.3b (AK072215) open reading frame (ORF) from cDNA, which was isolated from Oryza sativa L.ssp. Japonica cv. Nipponbare using the primers listed in Table S1. Then, OsNRT2.3b was inserted into the pG3 vector by the AscI and KpnI enzyme sites without GUS(β-glucuronidase), which was driven by the RSs1 promoter [47] and transferred into the plant expression vector pB211. OsNRT2.3b was also cloned into the pMD19-T vector (Takara Biotechnology company, Dalian City, Liaoning Province, China) and expression vector pTCK303 with a ubiquitin promoter. The positive vector was identified by restriction digest and DNA sequencing. Next, the binary vectors pUbiquitin-OsNRT2.3b and pRSs1-OsNRT2.3b were introduced into the Agrobacterium tumefaciens strain AGL1, which was used to transform the immature embryos of the spring barley (H. vulgare L.) cultivar ‘Golden Promise’ by the method of Bartlett et al. 2008 [48] and Harwood et al., 2009 [49]. The T0-generation transgenic plants were identified by selection on 50 mg/L hygromycin. Transgenic T1 plants could be identified from null segregates by germination of the seed on hygromycin (100 mg/L) containing agar. Three independent T2 generation transgenic barley lines containing each construct were used for further analysis.
4.2. Growth Conditions
Barley plants (Hordeum vulgare L. cv Golden Promise) after hygromycin selection were planted in a greenhouse with artificial illumination with 16/8 h light/darkness at 23 °C and 18 °C, respectively. Light had a photon flux density at plant level equal to 300 μmol m−2 s−1 and 60% relative humidity. For pot experiments, 10 seeds of each transgenic line were grown in pots with barley mix compost, which included perlite and grit [48].
In the hydroponic experiments, healthy barley seeds were selected, surface sterilized with 30% NaClO for 30 min, rinsed with distilled water 3 times, and then soaked for 6 h at 25 °C. Then, the seeds were germinated on moistened filter papers in dark germination boxes and placed into a growth chamber (23/18 °C, day and night). Uniformly sized 10-day-old seedlings of all the transgenic barley lines were transplanted into plastic pots for hydroponic culture in greenhouse. These seedlings were grown in 1/4 Hoagland’s nutrient solution, which was applied in the following proportions: 2 mM KNO3, 1 mM NH4NO3, 0.5 mM MgSO4, 0.5 mM CaNO3, 0.25 mM CaCl2·2H2O, 1 mM NaH2PO4·2H2O, 0.25 mM Fe2-EDTA, 11 μM MnCl2·4H2O, 46 μM H3BO3, 0.8 μM ZnSO4·7H2O, 0.32 μM CuSO4·5H2O, and 0.08 μM (NH4)6Mo7O24·2H2O. Nutrient solutions were changed every two days, and the pH was kept at 6.0 by adding the MES(2-(N-Morpholino) ethanesulfonic acid) buffer in the nutrient solution. In addition, the barley roots were aerated in the hydroponic experiment using aquarium air pumps.
4.3. Western Blotting
The biosynthesis and purification of anti-OsNRT2.3b rabbit monoclonal antibody were as previously described [25,26]. All tissues that were from the stems of all transgenic barley lines were homogenized and lysed in buffer containing 1% Nonidet P-40 and the protease inhibitors. Then, the lysates were clarified by centrifugation, and the protein concentration was measured by spectrophotometry with Bradford reagent in A595. Fifty micrograms of protein was boiled in gel-loading buffer and analyzed on 10% SDS-PAGE gels. After that, the protein was transferred to polyvinylidene difluoride membranes and hybridized by first antibody OsNRT2.3b (1:500) and Actin (1:5000) overnight at 4 °C. The membrane was incubated in an appropriate second antibody (1:5000), followed by chemiluminescence detection to check the protein brands.
4.4. DNA/RNA Extraction and qPCR Analysis
Total RNA was extracted from 100 mg of tissue using TRIzol (Invitrogen, Carlsbad, USA). RNA (2 μg) was reverse-transcribed into cDNA using HiScript Reverse Transcriptase (Vazyme, Nanjing, China), according to the manufacturers protocol. Real-time PCR was used with a Power SYBR Green Master Mix (Vazyme, Nanjing, China) for target genes and HvActin [50]. Real-time PCR was performed using the gene specific primers shown in Table S2. The PCR parameters for the detection of HvActin [50], OsNRT2.3b (AK072215), HvNRT2.1 (accession no. U34198), HvNRT2.2 (accession no. U34298), HvNRT2.5 (accession no.DQ539042) and HvNAR2.3 (accession no. AY2535450) were 95 °C for 30 s, followed by 40 cycles of 95 °C for 10 s, 60 °C for 30 s, and 72 °C for 10 s. Genomic DNA was extracted as described by Ausubel et al. (1994) [51].
4.5. Southern Blot Analysis
Transgene copy numbers were identified by Southern blot analysis. First, genomic DNA were extracted from the leaves of WT and transgenic barley lines. Then, DNA was digested by Hind Ш and EcoR Ι. Second, the digested DNA was separated on 1% (w/v) agarose gels, transferred to a Hybond-N+ nylon membrane, and hybridized using the hygromycin-resistant gene.
4.6. Determination of 15N-NH4+/NO3− Influx Rate in Different Barley Lines
Barley seedlings of untransformed control plants or wild-type (WT) and OsNRT2.3b transgenic barley lines were planted in 1/4 Hoagland’s nutrient solution for 2 weeks (as described above) and then N-starved for 4 days. Then, the transgenic barley lines were transferred into 0.1 mM CaSO4 for 1 min and then into complete nutrient solution containing either 0.2 mM 15NH4+ or 0.2 mM 15NO3− (atom% 15N: 99%) for 5 min and finally to 0.1 mM CaSO4 for 1 min [52]. The 15N influx rate was calculated depending on methods described by Chen et al. (2016) [46].
4.7. Analysis of Agronomic Traits
The agronomic traits were measured for all the transgenic barley at the seeding stage, anthesis stage, and grain-filling stage. The seed morphology of transgenic barley lines was also determined. Plant fresh weight, seed weight, tillering number, and seed length/width were measured. Detailed methods for measurement of these agronomic traits were described previously [53].
4.8. Measurements of Dry Weight, Nitrate, Total N, and Metal Ion Accumulation
WT untransformed and transgenic barley lines were harvested at the mature stage (n = 4) and dried at 105 °C for 30 min. Then, shoots were dried for 3 days at 75 °C. Barley from hydroponic experiments was divided into root, stem sheath, and leaves. Dry weight was measured as biomass. The total N accumulation was measured by using the Kjeldahl method [43] and was assessed in different plant parts by multiplying the N concentration by the corresponding biomass. The calculating method of NUE (NUE, g/g) was described in Chen et al. 2016 [46]. Dried samples were digested in concentrated HNO3 at 120 °C until no nitrogen oxide gas was released. These samples were further digested with HClO4 at 180 °C, at which point they become transparent. Then, samples were diluted with ultrapure water, and the concentration of metal elements in the digestion solutions were analyzed by using ICP-OES (Inductively Coupled Plasma Optical Emission Spectrometer) (iCAP6300).
4.9. Cloning and cRNA Synthesis of HvNRT2.5, HvNAR2.1, HvNAR2.2, HvNAR2.3, and AtNPF6.3 (CHL1) and Nitrate Uptake Assay in Xenopus Laevis Oocytes
HvNRT2.5 (accession no. DQ539042), HvNAR2.1 (accession no. AY253448), HvNAR2.2 (accession no. AY253449), HvNAR2.3 (accession no. AY2535450) and CHL1 (At1G12110) constructs were as described previously [46]. The cRNA was transcribed by using an Ambion mMessage mMachine®T7 kit. The protocols for oocyte preparation, incubation, and injection of gene cRNA were the same as previously described by Feng et al. 2013 [54]. The measurements of 15NO3− influx in oocytes were performed as described by Feng et al. (2013) [54].
4.10. Statistical Analysis
All data were analyzed using one-way analysis of variance (ANOVA). Different letters showed a significant difference between transgenic barley line and wild types. Statistically significantly differences at the p < 0.05 level (one-way ANOVA) were performed using IBM SPSS Statistics version 20 software (SPSS Inc., Chicago, IL, USA).
5. Conclusions
In conclusion, the present study has demonstrated that the overexpression of OsNRT2.3b in barley affects the transport of N, P, and Fe. Even when the promoters were different, the N/P/Fe contents were similar, showing analogous phenotypes in the transgenic plants. This finding may be due to N/P/Fe synergism in the plant, which was driven by the N use and pH balance in these transgenic plants. This synergistic relationship between nutrients is worthy of further investigation. We have demonstrated a novel mechanism to optimize the gene expression in plants in which a targeted promoter and not a strong promoter is used to drive gene expression. The overexpression of OsNRT2.3b driven by two types of promoter in barley affected the potential to enhance the transport of nutrients and improve NUE. Furthermore, the transgenic data suggest that HvNRT2.5 has an important role in NUE in barley.
Supplementary Materials
Supplementary materials can be found at https://www.mdpi.com/1422-0067/21/4/1320/s1. Table S1. Primers used to amplify the OsNRT2.3b open reading frame and identification primers of hygromycin. Table S2. Primers used for quantitative real-time polymerase chain reaction. Table S3. The effect of 0.2 mM NH4+ treatment on the distribution of total N, P, and Fe in shoots and roots. Table S4. Comparison of the expression of OsNRT2.3b in transgenic barley driven by different promoters under 0.2mM NH4+/NO3− treatment. Figure S1. Identification of transgenic barley lines by Southern blot. Figure S2. The seed concentrations of Mn and Mg in different barley lines. Figure S3. Homology analysis of NRT2s genes. Figure S4. The relative expression of HvNRT2s in different plants parts under 0.2mM NH4+ and 0.2mM NO3− treatments. Figure S5. Phosphorus (P) and iron (Fe) concentrations in different plant parts under 0.2 mM NH4+ and 0.2 mM NO3− treatments. Figure S6. The characterization of all barley lines under 10 mM NH4+ condition after 10 mM NH4+/NO3− condition.
Author Contributions
B.L., A.J.M., and X.F. conceived the study, analyzed the data, and first drafted the manuscript. X.F., W.H., and Y.C. constructed transgenic barley lines. B.L., M.X., L.Z., and P.X. cultivated barley lines and identified transgenic barley lines. B.L., M.X., L.Z., and P.X. extracted RNA and performed the qRT-PCR experiments. B.L. and L.Z. participated in plot and material management. B.L. and M.X. conducted the statistical analysis of raw data. X.F., G.X. and A.J.M. revised the manuscript. All authors read and approved the final manuscript.
Funding
This research was funded by the China National Key Program for Research and Development (2016YFD0100700), the Transgenic Project (Grant 2016ZX08001003-008), Innovation project of basic scientific research in central Universities of Ministry of Education (KYYJ201604, KJJQ201701), Innovative Research Team Development Plan of Ministry of Education of China (IRT17R56; KYT201802), Jiangsu Science and Technology Development Program (Grant BE2019375-1). The generation of the barley transgenic lines at JIC was kindly supported by funding from Plant Bioscience Limited, Norwich, UK. A.J.M and W.H. were funded by the UK Biotechnological and Biological Sciences Research Council (BBSRC) Institute Strategic Program Grants ‘Molecules from Nature’ (BB/P012523/1) and ‘Genes in the Environment’ (BB/P013511/1) and the John Innes Foundation.
Conflicts of Interest
The authors declare no conflict of interest.
References
- Haynes, R.J.; Goh, K.M. Ammonium and nitrate nutrition of plants. Biol. Rev. 1978, 53, 465–510. [Google Scholar] [CrossRef]
- Kronzucker, H.J.; Glass, A.D.M.; Siddiqi, M.Y.; Kirk, G.J.D. Comparative kinetic analysis of ammonium and nitrate acquisition by tropical lowland rice: Implications for rice cultivation and yield potential. New Phytol. 2000, 145, 471–476. [Google Scholar] [CrossRef]
- Miller, A.J.; Cramer, M.D. Root nitrogen acquisition and assimilation. Plant Soil 2005, 274, 1–36. [Google Scholar] [CrossRef]
- Coruzzi, G.; Bush, D.R. Nitrogen and carbon nutrient and metabolite signaling in plants. Plant Physiol. 2001, 125, 61–64. [Google Scholar] [CrossRef]
- Crawford, N.M.; Glass, A.D.M. Molecular and physiological aspects of nitrate uptake in plants. Trends Plant Sci. 1998, 3, 389–395. [Google Scholar] [CrossRef]
- Siddiqi, M.Y.; Glass, A.D.; Ruth, T.J.; Rufty, T.W. Studies of the uptake of nitrate in Barley: I. kinetics of 13NO3− influx. Plant Physiol. 1990, 93, 1426–1432. [Google Scholar] [CrossRef]
- Forde, B.G. Nitrate transporters in plants: Structure, function and regulation. Biochim. Biophys. Acta 2000, 1465, 219–235. [Google Scholar] [CrossRef]
- Fan, X.R.; Shen, Q.R.; Ma, Z.; Zhu, H.; Yin, X.; Miller, A.J. A comparison of nitrate transport in four different rice (Oryza sativa L.) cultivars. Sci. China Ser. C 2005, 48, 897–911. [Google Scholar]
- Miller, A.J.; Fan, X.R.; Orsel, M.; Smith, S.J.; Wells, D.M. Nitrate transport and signaling. J. Exp. Bot. 2007, 58, 2297–2306. [Google Scholar] [CrossRef]
- Fan, X.R.; Naz, M.; Fan, X.R.; Wei, X.; Miller, A.J.; Xu, G.H. Plant nitrate transporter from gene function to application. J. Exp. Bot. 2016, 168, 2463–2475. [Google Scholar] [CrossRef] [PubMed]
- Rayle, D.L.; Cleland, R.E. The Acid Growth Theory of auxin induced cell elongation is alive and well. Plant Physiol. 1992, 99, 1271–1274. [Google Scholar] [CrossRef] [PubMed]
- Forde, B.G. The role of long-distance signalling in plant responses to nitrate and other nutrients. J. Exp. Bot. 2002, 53, 39–43. [Google Scholar] [PubMed]
- Tsay, Y.F.; Chiu, C.C.; Tsai, C.B.; Ho, C.H.; Hsu, P.K. Nitrate transporters and peptide transporters. FEBS Lett. 2007, 581, 2290–2300. [Google Scholar] [CrossRef] [PubMed]
- Liu, K.H.; Tsay, Y.F. Switching between the two action modes of the dual-affinity nitrate transporter CHL1 by phosphorylation. EMBO J. 2003, 22, 1005–1013. [Google Scholar] [CrossRef]
- Guo, F.Q.; Wang, R.; Chen, M.; Crawford, N.M. The Arabidopsis dual-affinity nitrate transporter gene AtNRT1.1 (CHL1) is activated and functions in nascent organ development during vegetative and reproductive growth. Plant Cell 2001, 13, 1761–1777. [Google Scholar] [CrossRef]
- Gojon, A.; Krouk, G.; Perrine-Walker, F.; Laugier, E. Nitrate transceptor(s) in plants. J. Exp. Bot. 2011, 62, 2299–2308. [Google Scholar] [CrossRef]
- Tsay, Y.F.; Schroeder, J.I.; Feldmann, K.A.; Crawford, N.M. The herbicide sensitivity gene CHL1 of Arabidopsis encodes a nitrate-inducible nitrate transporter. Cell 1993, 72, 705–713. [Google Scholar] [CrossRef]
- Ho, C.H.; Lin, S.H.; Hu, H.C.; Tsay, Y.F. CHL1 functions as a nitrate sensor in Plant. Cell 2009, 138, 1184–1194. [Google Scholar] [CrossRef]
- Orsel, M.; Chopin, F.; Leleu, O.; Smith, S.J.; Krapp, A.; Daniel-Vedele, F.; Miller, A.J. Characterization of a two-component high-affinity nitrate uptake system in Arabidopsis. Physiology and protein-protein interaction. Plant Physiol. 2006, 142, 1304–1317. [Google Scholar] [CrossRef]
- Okamoto, M.; Kumar, A.; Li, W.B.; Wang, Y.; Siddiqi, M.Y.; Crawford, N.M.; Glass, A.D.M. High-affinity nitrate transport in roots of Arabidopsis depends on expression of the NAR2-like gene AtNRT3.1. Plant Physiol. 2006, 140, 1036–1046. [Google Scholar] [CrossRef]
- Yong, Z.; Kotur, Z.; Glass, A.D. Characterization of an intact two component high-affinity nitrate transporter from Arabidopsis roots. Plant J. 2010, 63, 739–748. [Google Scholar] [CrossRef] [PubMed]
- Laugier, E.; Bouguyon, E.; Mauriès, A.; Tillard, P.; Gojon, A.; Lejay, L. Regulation of high-affinity nitrate uptake in roots of Arabidopsis depends predominantly on posttranscriptional control of the NRT2.1/NAR2.1 transport system. Plant Physiol. 2012, 158, 1067–1078. [Google Scholar] [CrossRef] [PubMed]
- Kiba, T.; Feria-Bourrellier, A.-B.; Lafouge, F.; Lezhneva, L.; Boutet-Mercey, S.; Orsel, M.; Bréhaut, V.; Miller, A.; Daniel-Vedele, F.; Sakakibara, H.; et al. The Arabidopsis nitrate transporter NRT2.4 plays a double role in roots and shoots of nitrogen-starved plants. Plant Cell Online 2012, 24, 245–258. [Google Scholar] [CrossRef] [PubMed]
- Hsu, P.K.; Tsay, Y.F. Two phloem nitrate transporters, NRT1.11 and NRT1.12, are important for redistributing xylem-borne nitrate to enhance plant growth. Plant Physiol. 2013, 163, 844–856. [Google Scholar] [CrossRef]
- Fan, X.R.; Tang, Z.; Tan, Y.W.; Zhang, Y.; Luo, B.B.; Yang, M.; Lian, X.M.; Shen, Q.; Miller, A.J.; Xu, G. Over expression of a pH sensitive nitrate transporter in rice increases crop yields. Proc. Nat. Acad. Sci. USA 2016, 113, 7118–7123. [Google Scholar] [CrossRef]
- Tang, Z.; Fan, X.R.; Li, Q.; Feng, H.M.; Miller, A.J.; Shen, Q.R.; Shen, Q.; Xu, G. Knockdown of a rice stellar nitrate transporter alters long-distance translocation but not root influx. Plant Physiol. 2012, 160, 2052–2063. [Google Scholar] [CrossRef]
- Araki, R.; Hasegawa, H. Expression of rice (Oryza sativa L.) genes involved in high-affinity nitrate transport during the period of nitrate induction. Breed. Sci. 2006, 56, 295–302. [Google Scholar] [CrossRef]
- Cai, C.; Wang, J.Y.; Zhu, Y.G.; Shen, Q.R.; Li, B.; Tong, Y.P.; Li, Z.S. Gene structure and expression of the high-affinity nitrate transport system in rice roots. J. Integr. Plant Biol. 2008, 50, 443–451. [Google Scholar] [CrossRef]
- Wei, J.; Zheng, Y.; Feng, H.M.; Qu, H.Y.; Fan, X.R.; Yamaji, N.; Ma, J.F.; Xu, G.H. OsNRT2.4 encodes a dual-affinity nitrate transporter and functions in nitrate-regulated root growth and nitrate distribution in rice. J. Exp. Bot. 2018, 69, 1095–1107. [Google Scholar] [CrossRef]
- Yan, M.; Fan, X.R.; Feng, H.M.; Miller, A.J.; Shen, Q.R.; Xu, G.H. Rice OsNAR2.1 interacts with OsNRT2.1, OsNRT2.2 and OsNRT2.3a nitrate transporters to provide uptake over high and low concentration ranges. Plantcell Environ. 2011, 34, 1360–1372. [Google Scholar] [CrossRef]
- Morrell, P.L.; Clegg, M.T. Genetic evidence for a second domestication of barley (Hordeum vulgare) east of the Fertile Crescent. Proc. Nat. Acad. Sci. USA 2007, 104, 3289–3294. [Google Scholar] [CrossRef] [PubMed]
- Anbessa, Y.; Juskiw, P.; Good, A.; Nyachiro, J.; Helm, J. Genetic variability in nitrogen use efficiency of spring barley. Crop Sci. 2009, 49, 1259–1269. [Google Scholar] [CrossRef]
- Mayer, K.F.X.; Waugh, R.; Brown, J.W.; Schulman, A.; Langridge, P.; Platzer, M.; Fincher, G.B.; Muehlbauer, G.J.; Sato, K.; Close, T.J.; et al. A physical, genetic and functional sequence assembly of the barley genome. Nature 2012, 491, 711–716. [Google Scholar] [PubMed]
- Shcherbak, I.; Millar, N.; Robertson, G.P. Global metanalysis of the nonlinear response of soil nitrous oxide (N2O) emissions to fertilizer nitrogen. Proc. Nat. Acad. Sci. USA 2014, 111, 9199–9204. [Google Scholar] [CrossRef]
- Hinchliffe, A.; Harwood, W.A. Agrobacterium-mediated transformation of barley immature embryos. Methods Mol. Biol. 2018, 1900, 115–126. [Google Scholar]
- Luo, B.B.; Chen, J.G.; Zhu, L.L.; Liu, S.H.; Li, B.; Lu, H.; Ye, G.Y.; Xu, G.H.; Fan, X.R. Overexpression of a high-affinity transporter OsNRT2.1 increase yield and manganese accumulation in rice under alternating wet and dry condition. Front. Plant Sci. 2018, 9, 1192. [Google Scholar] [CrossRef]
- Tong, Y.; Zhou, J.J.; Li, Z.; Miller, A.J. A two-component high-affinity nitrate uptake system in barley. Plant J. 2005, 41, 442–450. [Google Scholar] [CrossRef]
- Vidmar, J.J.; Zhuo, D.; Siddiqi, M.Y.; Glass, A.D.M. Isolation and characterization of HvNRT2.3 and HvNRT2.4, cDNAs encoding high-Affinity nitrate transporters from roots of barley. Plant Physiol. 2000, 122, 783–792. [Google Scholar] [CrossRef]
- Xu, G.H.; Fan, X.R.; Miller, A.J. Plant nitrogen assimilation and use efficiency. Annu. Rev. Plant Biol. 2012, 63, 153–182. [Google Scholar] [CrossRef]
- Fu, Y.; Yi, H.; Bao, J.; Gong, J. LeNRT2. 3 functions in nitrate acquisition and long-distance transport in tomato. FEBS Lett. 2015, 589, 1072–1079. [Google Scholar] [CrossRef]
- Li, B.; Xin, W.; Sun, S.; Shen, Q.; Xu, G. Physiological and molecular responses of nitrogen-starved rice plants to re-supply of different nitrogen sources. Plant Soil 2006, 287, 145–159. [Google Scholar] [CrossRef]
- Feng, H.; Yan, M.; Fan, X.; Li, B.; Shen, Q.; Miller, A.J.; Xu, G. Spatial expression and regulation of rice high-affinity nitrate transporters by nitrogen and carbon status. J. Exp. Bot. 2011, 62, 2319–2332. [Google Scholar] [CrossRef] [PubMed]
- Léran, S.; Varala, K.; Boyer, J.C.; Chiurazzi, M.; Crawford, N.; Daniel-Vedele, F.; David, L.; Dickstein, R.; Fernandez, E.; Forde, B.; et al. A unified nomenclature of NITRATE TRANSPORTER 1/PEPTIDE TRANSPORTER family members in plants. Trends Plant Sci. 2015, 19, 5–9. [Google Scholar] [CrossRef] [PubMed]
- Han, M.; Wong, J.; Su, T.; Beatty, H.P.; Good, G.A. Identification of nitrogen use efficiency genes in barley: Searching for QTLs controlling complex physiological traits. Front. Plant Sci. 2016, 7, 1587. [Google Scholar] [CrossRef] [PubMed]
- Fischer, J.J.; Beatty, P.H.; Good, A.G.; Muench, D.G. Manipulation of microRNA expression to improve nitrogen use efficiency. Plant Sci. 2013, 210, 70–81. [Google Scholar] [CrossRef] [PubMed]
- Chen, J.G.; Zhang, Y.; Tan, Y.W.; Zhang, M.; Zhu, L.L.; Xu, G.H.; Fan, X. Agronomic nitrogen-use efficiency of rice can be increased by driving OsNRT2.1 expression with the OsNAR2.1 promoter. Plant Biotechnol. J. 2016, 14, 1705–1715. [Google Scholar] [CrossRef]
- Saha, P.; Chakraborti, D.; Sarkar, A.; Dutta, I.; Basu, D.; Das, S. Characterization of vascular-specific RSs1 and rolC promoters for their utilization in engineering plants to develop resistance against hemipteran insect pests. Planta 2007, 226, 429–442. [Google Scholar] [CrossRef]
- Bartlett, J.G.; Alves, S.C.; Smedley, M.; Snape, J.W.; Harwood, W.A. High-throughput Agrobacterium-mediated barley transformation. Plant Methods 2008, 4, 22. [Google Scholar] [CrossRef]
- Harwood, W.A.; Bartlett, J.G.; Alves, S.C.; Perry, M.; Smedley, M.A.; Leyl, N.; Snape, J.W. Barley transformation using Agrobacterium-mediated techniques. In Transgenic Wheat; Barley and Oats; Humana Press: Totowa, NJ, USA, 2009; pp. 137–147. [Google Scholar]
- Zalewski, W.; Gasparis, S.; Boczkowska, M.; Rajchel, I.K.; Kała, M.; Orczyk, W.; Nadolska-Orczyk, A. Expression patterns of HvCKX genes indicate their role in growth and reproductive development of barley. PLoS ONE 2014, 9, e115729. [Google Scholar] [CrossRef]
- Ausubel, F.M.; Brent, R.E.; Kingston, D. Current Protocols in Molecular Biology; John Wiley and Sons: New York, NY, USA, 1994. [Google Scholar]
- Duan, Y.H.; Zhang, Y.L.; Ye, L.T.; Fan, X.R.; Xu, G.H.; Shen, Q.R. Response of rice cultivars with different nitrogen use efficiency to partial nitrate nutrition. Ann. Bot. 2007, 99, 1153–1160. [Google Scholar] [CrossRef]
- Hu, B.; Wang, W.; Ou, S.; Tang, J.; Li, H.; Che, R.; Zhang, Z.; Chai, X.; Wang, H.; Wang, Y.; et al. Variation in NRT1.1B contributes to nitrate-use divergence between rice subspecies. Nature. Genetics 2015, 47, 834–838. [Google Scholar] [PubMed]
- Feng, H.; Xia, X.; Fan, X.; Xu, G.; Miller, A.J. Optimizing plant transporter expression in Xenopus oocytes. Plant Methods 2013, 9, 48. [Google Scholar] [CrossRef] [PubMed]


© 2020 by the authors. Licensee MDPI, Basel, Switzerland. This article is an open access article distributed under the terms and conditions of the Creative Commons Attribution (CC BY) license (http://creativecommons.org/licenses/by/4.0/).