Abstract
Biodosimetry is a useful method for estimating personal exposure doses to ionizing radiation. Studies have identified metabolites in non-cellular biofluids that can be used as markers in biodosimetry. Levels of metabolites in blood cells may reflect health status or environmental stresses differentially. Here, we report changes in the levels of murine blood cell metabolites following exposure to X-rays in vivo. Levels of blood cell metabolites were measured by capillary electrophoresis time-of-flight mass spectrometry. The levels of 100 metabolites were altered substantially following exposure. We identified 2-aminobutyric acid, 2′-deoxycytidine, and choline as potentially useful markers of radiation exposure and established a potential prediction panel of the exposure dose using stepwise regression. Levels of blood cell metabolites may be useful biomarkers in estimating exposure doses during unexpected radiation incidents.
1. Introduction
Exposure to ionizing radiation during and following radiation and nuclear leaks and explosions may cause acute damage and increase the risk of developing chronic conditions such as cancer, cataracts, and dermatitis [1]. Biodosimetry is a useful tool for estimating personal exposure doses [2]. While the primary objective of biodosimetry is to guide medical intervention following exposure to radiation, the value of this technique extends to supporting epidemiological studies of long-term health risks [3]. Numerous biodosimetric markers have been reported, such as chromosomal aberrations [4], DNA damage [5], free radicals [6], and dysregulation of gene expression [7], antioxidant production [8], and metabolites [9].
Exposure to ionizing radiation affects metabolite concentrations. Abe et al. reported changes in urinary excretion of taurine in irradiated mice in 1968 [10]. More recently, metabolome analysis techniques have enabled the measurement of several dozen to several hundred metabolites simultaneously and are widely used in basic and clinical medical studies [11,12,13]. Numerous studies have measured metabolites following radiation exposure using metabolomic techniques [14], but these studies focused on non-cellular biofluids such as serum [15,16,17], plasma [18], urine [19,20], and saliva [21]. Only a few studies have investigated blood cells; although red blood cells lack nuclei and cellular organelles, they use glycolysis and the pentose phosphate pathway for ATP production and maintain redox homeostasis and osmoregulation [22]. Chaleckis et al. demonstrated that human age-related metabolites were enriched in blood cells [22], and the same group recently reported that the concentrations of a number of metabolites in plasma and blood cells change during fasting [23]. Thus, levels of metabolites in red blood cells may reflect health status or environmental stresses differentially than levels in plasma [22].
Previous studies have used nuclear magnetic resonance [24], gas chromatography–mass spectrometry (GC–MS) [25], or liquid chromatography–mass spectrometry (LC–MS) [26] to measure metabolite levels after irradiation, and only a few employed capillary electrophoresis–mass spectrometry (CE–MS). These techniques have varying sensitivities, specificities, and detection limits. Ramautar et al. analyzed human urine by CE–MS and LC–MS and found that CE–MS detected approximately 500 metabolites while LC–MS detected approximately 300 metabolites [27], and that the metabolite sets detected differed between techniques. The authors concluded that the CE–MS method was highly complementary to LC–MS by providing categorization by metabolite class.
In the present study, we used CE–MS to measure changes in the levels of blood cell metabolites in vivo following exposure to radiation. We applied total-body irradiation (1 or 3 Gy) to mice and collected blood cells 2 and 6 days after irradiation. A non-targeted metabolome analysis was performed using capillary electrophoresis time-of-flight mass spectrometry (CE–TOFMS). We were able to identify 100 metabolites whose levels were significantly altered following irradiation. We found that the levels of several metabolites involved in aspartic acid, urea, and creatinine metabolism and neurotransmitter-related metabolites decreased after exposure. We also found that 2-aminobutyric acid, 2′-deoxycytidine, and choline were potentially useful markers of exposure to ionizing radiation. To establish a prediction biomarker panel of the exposure dose, we performed stepwise regression and identified 10 metabolites for both measurement time points. These findings suggest that the levels of blood cell metabolites can be used as biodosimetric markers of exposure to radiation.
2. Results
2.1. Changes in the Levels of Blood Cell Metabolites Following Exposure to Ionizing Radiation
To identify blood cell radiation-responsive metabolites, we subjected C57BL/6J mice to irradiation (0, 1, or 3 Gy) and collected blood cells 2 and 6 days after exposure. Metabolome analysis was then performed by CE–TOF MS. We detected 306 annotated metabolites and 10 unknown peaks (Table S1). We found that the levels of 38 metabolites increased significantly after exposure, levels of 61 metabolites decreased, and the levels of one metabolite decreased and then increased (Table 1). Notably, the levels of 2-aminobutyric acid increased, and the levels of 2′-deoxycytidine and choline decreased in mice exposed to 1 and 3 Gy of ionizing radiation (Figure 1).

Table 1.
Changes in the levels of blood cell metabolites following exposure to ionizing radiation.
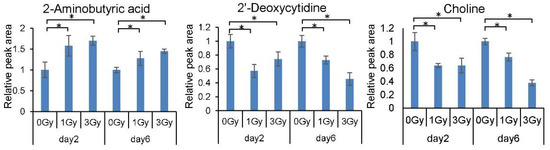
Figure 1.
Dose and time response of levels of 2-aminobutyric acid, 2′-deoxycytidine, and choline in mouse blood cells. All quantitative data are means ± SD. * p < 0.05.
We found that the levels of several metabolites related to aspartic acid, urea, and creatinine metabolism decreased significantly following exposure to ionizing radiation (Figure 2).
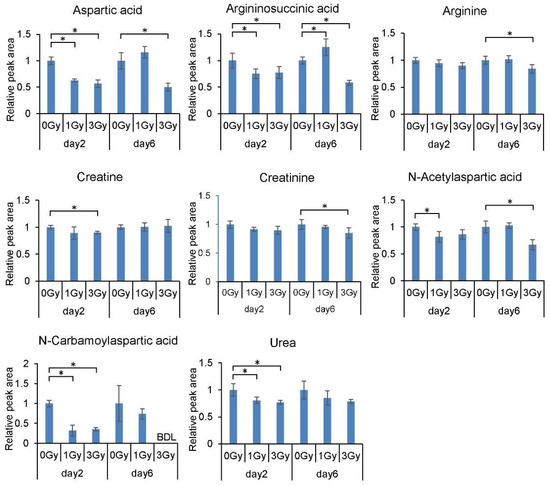
Figure 2.
Dose and time response of levels of metabolites related to aspartic acid, urea, and creatinine metabolism in mouse blood cells. All quantitative data are means ± SD. * p < 0.05.
We also found that the levels of several neurotransmitter-related metabolites decreased significantly following exposure to ionizing radiation, including those of aspartic acid, tyrosine, choline, homovanillic acid, and γ-aminobutyric acid (Figure 3).
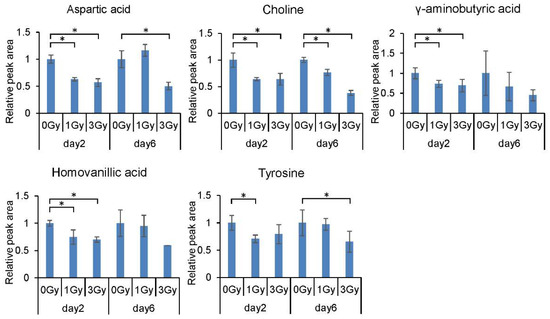
Figure 3.
Dose and time response of levels of neurotransmitter-related metabolites in mouse blood cells. All quantitative data are means ± SD. * p < 0.05, Welch’s t-test.
2.2. Multivariate Analysis of Blood Cell Metabolites Following Exposure to Ionizing Radiation
We performed principal component analysis (PCA) and partial least squares discriminant analysis (PLS–DA). PCA showed that the 95% confidence interval of the control group was separate from that of the mice exposed to 1 or 3 Gy of ionizing radiation, but the 95% confidence intervals of the two exposure groups overlapped on day 2 post-exposure. The 95% confidence intervals of all three groups overlapped on day 6 post-exposure (Figure 4A). PLS–DA clearly separated the 95% confidence intervals of the three groups on both day 2 and day 6 (Figure 4B). The top 15 PLS–DA variable importance in projection scores (Figure 4C) suggested that alterations in the levels of these metabolites were major contributors to class discrimination.
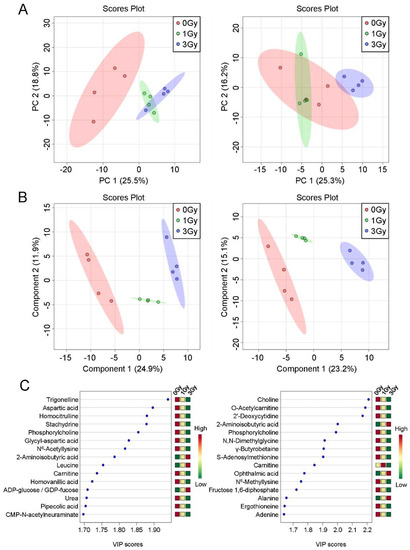
Figure 4.
Multivariate data analysis of the blood cell metabolome from mice exposed to ionizing radiation. Principal component analysis (A) and partial least squares discriminant analysis (B) were performed. Circles indicate the 95% confidence interval. (C) Top 15 variable importance in projection (VIP) scores from partial least squares discriminant analysis of component 1. PC, principal component.
2.3. Establishment of a Potential Exposure Dose Prediction Panel
To establish a potential prediction panel of the exposure dose, we performed stepwise regression, which selected 10 metabolites from both measurement days whose levels differed significantly from levels in the controls and that had good prediction performance (Table 2).
Table 2.
Results of stepwise regression analysis.
3. Discussion
We previously reported that exposure to ionizing radiation decreases antioxidant capacity in whole blood but not in serum [8]. Thus, we hypothesized that the levels of blood cell metabolites would be altered by radiation to a greater extent than in serum or plasma. We irradiated mice with 1 and 3 Gy of X-rays and measured blood cell metabolites after 2 and 6 days. The threshold dose for mortality in human adults exposed acutely to ionizing radiation has been reported as 1 Gy [28], and exposure to 3 Gy has been shown to shorten lifespan in C57BL/6 mice [29]. The recommended time frame for performing biodosimetry assays and triage is within 2 days of exposure for individuals with physical injuries and within 6 days for 1,000,000 victims [30], guiding our choice of doses and measurement points.
We detected 306 metabolites and 10 unknown peaks and found that the levels of 100 of the metabolites increased or decreased significantly following exposure to ionizing radiation. Pannkuk et al. detected 112 compounds in serum from radiation–exposed rhesus monkeys analyzed by GC–MS [25], and most of those differed from the ones we found in the present study, with only 19 overlapping metabolites. The differences may be attributable to the analytical technique or the species studied. Both our study and a recent one in rhesus monkeys found a decrease in the levels of aspartic acid, glycine, and tyrosine [31], but while we observed an increase in the levels of valine and alanine and a decrease in the levels of carnitine, the other study reported opposing findings [31]. These differences may be attributable to blood cell uptake of amino acids to control metabolite levels [32] and suggest that co-analysis of metabolites in blood cells and in serum should increase the accuracy of biodosimetry.
We found an increase in the levels of 2-aminobutyric acid and decreases in the levels of 2′-deoxycytidine and choline following exposure to radiation, indicating that these metabolites are potentially useful markers of exposure to 1 Gy or more of ionizing radiation. To date, however, no studies have reported the use of theses metabolites in biodosimetry; 2′-deoxycytidine is a nucleoside component of DNA, consisting of cytosine and deoxyribose, and our findings suggest that radiation-induced DNA damage decreases its production. Choline deficiency induces oxidative stress [33], suggesting that radiation-induced decreases lead to the production of free radicals.
We found that the levels of several metabolites related to aspartic acid, urea, and creatinine metabolism decreased following exposure. The levels of aspartic acid decreased in serum following exposure to radiation, suggesting that aspartic acid may enter the citric acid cycle via catabolic pathways [34]. Interestingly, we found that the levels of several neurotransmitter-related metabolites (i.e., aspartic acid, tyrosine, choline, homovanillic acid, and γ-aminobutyric acid) decreased in the exposed groups. Levels of aspartic acid, tyrosine, and γ-aminobutyric acid have been reported to decrease in patients with depression [35,36], and ionizing radiation can induce behavioral aberrations and cognitive dysfunction in mice and humans receiving radiotherapy [37,38]. The threshold dose for cognitive defects is considered to be 1 Gy [28], and decreases in the levels of neurotransmission-related metabolites may be a mechanism of ionizing radiation-induced cognitive dysfunction.
We excluded metabolites whose levels were beneath the limits of detection and those that were not identified. Our PLS–DA analysis discriminated between exposure groups at the two measurement time points and suggested that the levels of blood cell metabolites are useful biomarkers of radiation exposure. However, the top 15 variable importance in projection scores differed between the two measurement time points, implying that the metabolic profile was altered substantially over time post-exposure. To assess the exposure dose, we performed stepwise regression, and our analysis suggested that the levels of blood cell metabolites can be useful in estimating exposure doses, but that prediction panels for use in biodosimetry should be time-dependent and vary by days from exposure.
Our study has three limitations. First, the sample number for each group (n = 4), dose (0, 1, and 3 Gy), and time points (two measurements) were small. Second, we collected blood at different times of day and thus were unable to compare day 2 and 6 measurements directly. To resolve these problems, absolute quantification is required. Third, we used mice, and do not know whether similar changes in metabolite levels occur in humans. Future studies should recruit patients who receive clinical radiotherapy, use absolute quantification, and both technical and intra- and inter-individual variations should be accounted for.
In summary, we identified three potential discriminating markers of exposure to ionizing radiation and established potential prediction panels of the exposure dose. Our findings may contribute to biodosimetry of radiation in humans and improve radiation disaster medicine.
4. Materials and Methods
4.1. Animals, Exposure, and Preparation of Blood Cells
Six-week-old male C57BL/6J mice were obtained from Japan SLC (Shizuoka, Japan). Their food and drinking water were sterilized by autoclaving. After at least 1 week of acclimation, mice were subjected to 0, 1, or 3 Gy of X-rays in total-body irradiation (150 kV, 20 mA, filter: 0.2 mm Cu and 0.5 mm Al, MBR-1520R-3, Hitachi Power Solutions, Ibaraki, Japan). The irradiation dose rate was 0.88 Gy/min. Four mice were used per group. Mouse whole blood was collected via cardiac puncture 2 or 6 days after exposure. Whole blood was centrifuged at 3000× g at 4 °C for 10 min to separate plasma from blood cells.
4.2. Metabolite Extraction
A blood cell suspension (200 µL) was collected by pipette and added to 1800 µL methanol containing internal standards (H3304-1002, Human Metabolome Technologies, Inc., Tsuruoka, Japan) at 0 °C to inactivate enzymes. The extract was thoroughly mixed with 2000 µL chloroform and 800 µL Milli-Q water (MilliporeSigma, Burlington, MA, USA) and centrifuged at 2300× g and 4 °C for 5 min. Next, 400 µL of the upper aqueous layer were centrifugally filtered through a Millipore 5-kDa cutoff filter to remove proteins. The filtrate was centrifugally concentrated and resuspended in 50 µL Milli-Q water for metabolome analysis.
4.3. Measurement of Blood Cell Metabolites by CE–TOFMS
Metabolome analysis was conducted using the Basic Scan package (Human Metabolome Technologies, Inc.) using CE–TOFMS and methods described previously [39,40]. Briefly, CE–TOFMS analysis was carried out using an Agilent CE capillary electrophoresis system equipped with an Agilent 6210 time-of-flight mass spectrometer, Agilent 1100 isocratic high-performance liquid chromatography pump, Agilent G1603A CE–MS adapter kit, and Agilent G1607A CE–ESI–MS sprayer kit (Agilent Technologies, Santa Clara, CA, USA). The systems were controlled by Agilent G2201AA ChemStation software version B.03.01 for CE (Agilent Technologies) and connected through a fused silica capillary (50-μm i.d. × 80-cm total length) with commercial electrophoresis buffer (H3301-1001, Human Metabolome Technologies, Inc.) as the electrolyte. The spectrometer was scanned from m/z 50 to 1000 [39]. Peaks were extracted using MasterHands automatic integration software (Keio University, Tsuruoka, Japan) to obtain peak information such as the mass-to-charge ratio, peak area, and migration time [41]. Signal peaks corresponding to isotopomers, adduct ions, and other product ions of known metabolites were excluded, and the remaining peaks were annotated according to the Human Metabolome Technologies metabolite database by their mass-to-charge ratio values and migration time. Areas of the annotated peaks were then normalized by internal standard levels and sample volumes to obtain the relative levels of each metabolite. Since the blood cell preparations were heterogeneous (white blood cells, red blood cells, and platelets), we did not normalize metabolite levels by blood counts.
4.4. Statistical Analysis
The mean and SD were calculated for each data point. One-way ANOVA and post-hoc Dunnett’s tests were used to analyze significant differences between groups using the R statistical package. A p-value < 0.05 was considered statistically significant. Metabolite pathway clusters and categories were derived from the Kyoto Encyclopedia of Genes and Genomes (KEGG) (https://www.genome.jp/kegg/) and the Human Metabolome Database (HMDB) (http://www.hmdb.ca/). PCA and PLS–DA were performed using MetaboAnalyst (https://www.metaboanalyst.ca/MetaboAnalyst/home.xhtml) [42]. Stepwise regression was performed using JMP software (SAS Institute, Cary, NC, USA). We excluded metabolites whose levels were below the detection limit and unidentified peaks. Data were normalized by mean centering and divided by the SD of each variable for PCA, PLS–DA, and stepwise regression.
4.5. Ethical Considerations
All animal experiments were performed in accordance with the Animal Care Guidelines of the University of Occupational and Environmental Health, Japan (UOEH.J.) All animal husbandry procedures and experiments were approved by the Animal Experiment Committee of UOEH.J. (permit number: AE15-009, approval date: 28/March/2017).
Supplementary Materials
Supplementary materials can be found at https://www.mdpi.com/1422-0067/21/3/812/s1.
Author Contributions
T.M. designed research; Y.I. and T.M. performed the experiments; L.S. and N.K. collected and analyzed data; M.B. and K.C. provided critical advice on the research strategy and design; L.S. and T.M. wrote the paper. All authors have read and agreed to the published version of the manuscript.
Funding
This work was supported in part by Research on the Health Effects of Radiation organized by the Ministry of the Environment, Japan (to T.M.), the IRIDeS joint research programme (to K.C. and T.M.), and REA research grants (to L.S.).
Acknowledgments
We thank Tomomi Konari and Kumiko Sato for the experimental assistance and data collection.
Conflicts of Interest
The authors declare no conflict of interest.
References
- Pernot, E.; Hall, J.; Baatout, S.; Benotmane, M.A.; Blanchardon, E.; Bouffler, S.; El Saghire, H.; Gomolka, M.; Guertler, A.; Harms-Ringdahl, M. Ionizing radiation biomarkers for potential use in epidemiological studies. Mutat. Res. 2012, 751, 258–286. [Google Scholar] [CrossRef] [PubMed]
- Williams, B.B.; Flood, A.B.; Demidenko, E.; Swartz, H.M. ROC analysis for evaluation of radiation biodosimetry technologies. Radiat. Prot. Dosim. 2016, 172, 145–151. [Google Scholar] [CrossRef] [PubMed][Green Version]
- Simon, S.L.; Bouville, A. Long-term biodosimetry redux. Radiat. Prot. Dosim. 2016, 172, 244–247. [Google Scholar] [CrossRef] [PubMed]
- Oestreicher, U.; Samaga, D.; Ainsbury, E.; Antunes, A.C.; Baeyens, A.; Barrios, L.; Beinke, C.; Beukes, P.; Blakely, W.F.; Cucu, A. RENEB intercomparisons applying the conventional Dicentric Chromosome Assay (DCA). Int. J. Radiat. Biol. 2017, 93, 20–29. [Google Scholar] [CrossRef] [PubMed]
- Moquet, J.; Barnard, S.; Rothkamm, K. Gamma-H2AX biodosimetry for use in large scale radiation incidents: Comparison of a rapid ‘96 well lyse/fix’protocol with a routine method. PeerJ 2014, 2, e282. [Google Scholar] [CrossRef] [PubMed]
- Williams, B.B.; Dong, R.; Flood, A.B.; Grinberg, O.; Kmiec, M.; Lesniewski, P.N.; Matthews, T.P.; Nicolalde, R.J.; Raynolds, T.; Salikhov, I.K. A deployable in vivo EPR tooth dosimeter for triage after a radiation event involving large populations. Radiat. Meas. 2011, 46, 772–777. [Google Scholar] [CrossRef]
- Grace, M.; McLeland, C.; Blakely, W. Real-time quantitative RT-PCR assay of GADD45 gene expression changes as a biomarker for radiation biodosimetry. Int. J. Radiat. Biol. 2002, 78, 1011–1021. [Google Scholar] [CrossRef]
- Sun, L.; Inaba, Y.; Sato, K.; Hirayama, A.; Tsuboi, K.; Okazaki, R.; Chida, K.; Moritake, T. Dose-dependent decrease in anti-oxidant capacity of whole blood after irradiation: A novel potential marker for biodosimetry. Sci. Rep. 2018, 8, 7425. [Google Scholar] [CrossRef]
- Sproull, M.; Camphausen, K. State-of-the-art advances in radiation biodosimetry for mass casualty events involving radiation exposure. Radiat. Res. 2016, 186, 423–435. [Google Scholar] [CrossRef]
- Abe, M.; Takahashi, M.; Takeuchi, K.; Fukuda, M. Studies on the significance of taurine in radiation injury. Radiat. Res. 1968, 33, 563–573. [Google Scholar] [CrossRef]
- Rist, M.J.; Roth, A.; Frommherz, L.; Weinert, C.H.; Krüger, R.; Merz, B.; Bunzel, D.; Mack, C.; Egert, B.; Bub, A. Metabolite patterns predicting sex and age in participants of the Karlsruhe Metabolomics and Nutrition (KarMeN) study. PLoS ONE 2017, 12, e0183228. [Google Scholar] [CrossRef] [PubMed]
- Nishiumi, S.; Kobayashi, T.; Kawana, S.; Unno, Y.; Sakai, T.; Okamoto, K.; Yamada, Y.; Sudo, K.; Yamaji, T.; Saito, Y. Investigations in the possibility of early detection of colorectal cancer by gas chromatography/triple-quadrupole mass spectrometry. Oncotarget 2017, 8, 17115. [Google Scholar] [CrossRef] [PubMed]
- Vlaanderen, J.; Janssen, N.; Hoek, G.; Keski-Rahkonen, P.; Barupal, D.; Cassee, F.; Gosens, I.; Strak, M.; Steenhof, M.; Lan, Q. The impact of ambient air pollution on the human blood metabolome. Environ. Res. 2017, 156, 341–348. [Google Scholar] [CrossRef] [PubMed]
- Hall, J.; Jeggo, P.A.; West, C.; Gomolka, M.; Quintens, R.; Badie, C.; Laurent, O.; Aerts, A.; Anastasov, N.; Azimzadeh, O. Ionizing radiation biomarkers in epidemiological studies–an update. Mutat. Res. 2017, 771, 59–84. [Google Scholar] [CrossRef]
- Pannkuk, E.L.; Laiakis, E.C.; Authier, S.; Wong, K.; Fornace, A.J., Jr. Targeted Metabolomics of Nonhuman Primate Serum after Exposure to Ionizing Radiation: Potential Tools for High-throughput Biodosimetry. RSC Adv. 2016, 6, 51192–51202. [Google Scholar] [CrossRef]
- Pannkuk, E.L.; Laiakis, E.C.; Mak, T.D.; Astarita, G.; Authier, S.; Wong, K.; Fornace, A.J., Jr. A Lipidomic and Metabolomic Serum Signature from Nonhuman Primates Exposed to Ionizing Radiation. Metabolomics 2016, 12, 80. [Google Scholar] [CrossRef]
- Laiakis, E.C.; Strassburg, K.; Bogumil, R.; Lai, S.; Vreeken, R.J.; Hankemeier, T.; Langridge, J.; Plumb, R.S.; Fornace, A.J., Jr.; Astarita, G. Metabolic phenotyping reveals a lipid mediator response to ionizing radiation. J. Proteome. Res. 2014, 13, 4143–4154. [Google Scholar] [CrossRef]
- Broin, P.Ó.; Vaitheesvaran, B.; Saha, S.; Hartil, K.; Chen, E.I.; Goldman, D.; Fleming, W.H.; Kurland, I.J.; Guha, C.; Golden, A. Intestinal microbiota-derived metabolomic blood plasma markers for prior radiation injury. Int. J. Radiat. Oncol. Biol. Phys. 2015, 91, 360–367. [Google Scholar] [CrossRef]
- Iizuka, D.; Yoshioka, S.; Kawai, H.; Izumi, S.; Suzuki, F.; Kamiya, K. Metabolomic screening using ESI-FT MS identifies potential radiation-responsive molecules in mouse urine. J. Radiat. Res. 2017, 58, 273–280. [Google Scholar] [CrossRef]
- Tyburski, J.B.; Patterson, A.D.; Krausz, K.W.; Slavik, J.; Fornace, A.J., Jr.; Gonzalez, F.J.; Idle, J.R. Radiation metabolomics. 2. Dose- and time-dependent urinary excretion of deaminated purines and pyrimidines after sublethal gamma-radiation exposure in mice. Radiat. Res. 2009, 172, 42–57. [Google Scholar] [CrossRef]
- Laiakis, E.C.; Strawn, S.J.; Brenner, D.J.; Fornace, A.J., Jr. Assessment of Saliva as a Potential Biofluid for Biodosimetry: A Pilot Metabolomics Study in Mice. Radiat. Res. 2016, 186, 92–97. [Google Scholar] [CrossRef] [PubMed]
- Chaleckis, R.; Murakami, I.; Takada, J.; Kondoh, H.; Yanagida, M. Individual variability in human blood metabolites identifies age-related differences. Proc. Natl. Acad. Sci. USA 2016, 113, 4252–4259. [Google Scholar] [CrossRef] [PubMed]
- Teruya, T.; Chaleckis, R.; Takada, J.; Yanagida, M.; Kondoh, H. Diverse metabolic reactions activated during 58-hr fasting are revealed by non-targeted metabolomic analysis of human blood. Sci. Rep. 2019, 9, 854. [Google Scholar] [CrossRef] [PubMed]
- Yushmanov, V.E. Evaluation of radiation injury by 1H and 31P NMR of human urine. Magn. Reson. Med. 1994, 31, 48–52. [Google Scholar] [CrossRef] [PubMed]
- Pannkuk, E.L.; Laiakis, E.C.; Girgis, M.; Dowd, S.E.; Dhungana, S.; Nishita, D.; Bujold, K.; Bakke, J.; Gahagen, J.; Authier, S.; et al. Temporal Effects on Radiation Responses in Nonhuman Primates: Identification of Biofluid Small Molecule Signatures by Gas Chromatography(-)Mass Spectrometry Metabolomics. Metabolites 2019, 9, 98. [Google Scholar] [CrossRef] [PubMed]
- Pannkuk, E.L.; Laiakis, E.C.; Garcia, M.; Fornace, A.J., Jr.; Singh, V.K. Nonhuman Primates with Acute Radiation Syndrome: Results from a Global Serum Metabolomics Study after 7.2 Gy Total-Body Irradiation. Radiat. Res. 2018, 190, 576–583. [Google Scholar] [CrossRef]
- Ramautar, R.; Nevedomskaya, E.; Mayboroda, O.A.; Deelder, A.M.; Wilson, I.D.; Gika, H.G.; Theodoridis, G.A.; Somsen, G.W.; de Jong, G.J. Metabolic profiling of human urine by CE-MS using a positively charged capillary coating and comparison with UPLC-MS. Mol. Biosyst. 2011, 7, 194–199. [Google Scholar] [CrossRef]
- Stewart, F.; Akleyev, A.; Hauer-Jensen, M.; Hendry, J.; Kleiman, N.; Macvittie, T.; Aleman, B.; Edgar, A.; Mabuchi, K.; Muirhead, C. ICRP publication 118: ICRP statement on tissue reactions and early and late effects of radiation in normal tissues and organs–threshold doses for tissue reactions in a radiation protection context. Ann. ICRP 2012, 41, 1–322. [Google Scholar] [CrossRef]
- Carlisle, S.; Burchart, P.; Mitchel, R. Cancer and non-cancer risks in normal and cancer-prone Trp53 heterozygous mice exposed to high-dose radiation. Radiat. Res. 2010, 173, 40–48. [Google Scholar] [CrossRef]
- Flood, A.B.; Ali, A.N.; Boyle, H.K.; Du, G.; Satinsky, V.A.; Swarts, S.G.; Williams, B.B.; Demidenko, E.; Schreiber, W.; Swartz, H.M. Evaluating the Special Needs of The Military for Radiation Biodosimetry for Tactical Warfare Against Deployed Troops: Comparing Military to Civilian Needs for Biodosimetry Methods. Health Phys. 2016, 111, 169–182. [Google Scholar] [CrossRef]
- Pannkuk, E.L.; Laiakis, E.C.; Gill, K.; Jain, S.K.; Mehta, K.Y.; Nishita, D.; Bujold, K.; Bakke, J.; Gahagen, J.; Authier, S.; et al. Liquid Chromatography-Mass Spectrometry-Based Metabolomics of Nonhuman Primates after 4 Gy Total Body Radiation Exposure: Global Effects and Targeted Panels. J. Proteome Res. 2019, 18, 2260–2269. [Google Scholar] [CrossRef] [PubMed]
- Bryk, A.H.; Wiśniewski, J.R. Quantitative analysis of human red blood cell proteome. J. Proteome Res. 2017, 16, 2752–2761. [Google Scholar] [CrossRef] [PubMed]
- Yoshida, Y.; Itoh, N.; Hayakawa, M.; Habuchi, Y.; Inoue, R.; Chen, Z.-H.; Cao, J.; Cynshi, O.; Niki, E. Lipid peroxidation in mice fed a choline-deficient diet as evaluated by total hydroxyoctadecadienoic acid. Nutrition 2006, 22, 303–311. [Google Scholar] [CrossRef] [PubMed]
- Pannkuk, E.L.; Laiakis, E.C.; Authier, S.; Wong, K.; Fornace, A.J., Jr. Gas chromatography/mass spectrometry metabolomics of urine and serum from nonhuman primates exposed to ionizing radiation: Impacts on the tricarboxylic acid cycle and protein metabolism. J. Proteome Res. 2017, 16, 2091–2100. [Google Scholar] [CrossRef] [PubMed]
- Kawamura, N.; Shinoda, K.; Sato, H.; Sasaki, K.; Suzuki, M.; Yamaki, K.; Fujimori, T.; Yamamoto, H.; Osei-Hyiaman, D.; Ohashi, Y. Plasma metabolome analysis of patients with major depressive disorder. Psychiatry Clin. Neurosci. 2018, 72, 349–361. [Google Scholar] [CrossRef]
- Petty, F.; Kramer, G.L.; Gullion, C.M.; Rush, A.J. Low plasma γ-aminobutyric acid levels in male patients with depression. Biol. Psychiatry 1992, 32, 354–363. [Google Scholar] [CrossRef]
- Trivedi, R.; Khan, A.R.; Rana, P.; Haridas, S.; Hemanth Kumar, B.; Manda, K.; Rathore, R.K.; Tripathi, R.P.; Khushu, S. Radiation-induced early changes in the brain and behavior: Serial diffusion tensor imaging and behavioral evaluation after graded doses of radiation. J. Neurosci. Res. 2012, 90, 2009–2019. [Google Scholar] [CrossRef]
- Brown, P.D.; Pugh, S.; Laack, N.N.; Wefel, J.S.; Khuntia, D.; Meyers, C.; Choucair, A.; Fox, S.; Suh, J.H.; Roberge, D. Memantine for the prevention of cognitive dysfunction in patients receiving whole-brain radiotherapy: A randomized, double-blind, placebo-controlled trial. Neuro-Oncology 2013, 15, 1429–1437. [Google Scholar] [CrossRef]
- Ohashi, Y.; Hirayama, A.; Ishikawa, T.; Nakamura, S.; Shimizu, K.; Ueno, Y.; Tomita, M.; Soga, T. Depiction of metabolome changes in histidine-starved Escherichia coli by CE-TOFMS. Mol. BioSyst. 2008, 4, 135–147. [Google Scholar] [CrossRef]
- Ooga, T.; Sato, H.; Nagashima, A.; Sasaki, K.; Tomita, M.; Soga, T.; Ohashi, Y. Metabolomic anatomy of an animal model revealing homeostatic imbalances in dyslipidaemia. Mol. Biosyst. 2011, 7, 1217–1223. [Google Scholar] [CrossRef]
- Sugimoto, M.; Wong, D.T.; Hirayama, A.; Soga, T.; Tomita, M. Capillary electrophoresis mass spectrometry-based saliva metabolomics identified oral, breast and pancreatic cancer-specific profiles. Metabolomics 2010, 6, 78–95. [Google Scholar] [CrossRef] [PubMed]
- Chong, J.; Wishart, D.S.; Xia, J. Using metaboanalyst 4.0 for comprehensive and integrative metabolomics data analysis. Curr. Protoc. Bioinform. 2019, 68, e86. [Google Scholar] [CrossRef] [PubMed]


© 2020 by the authors. Licensee MDPI, Basel, Switzerland. This article is an open access article distributed under the terms and conditions of the Creative Commons Attribution (CC BY) license (http://creativecommons.org/licenses/by/4.0/).