Analysis of Cerebrospinal Fluid Extracellular Vesicles by Proximity Extension Assay: A Comparative Study of Four Isolation Kits


Abstract
1. Introduction
2. Results
3. Discussion
4. Materials and Methods
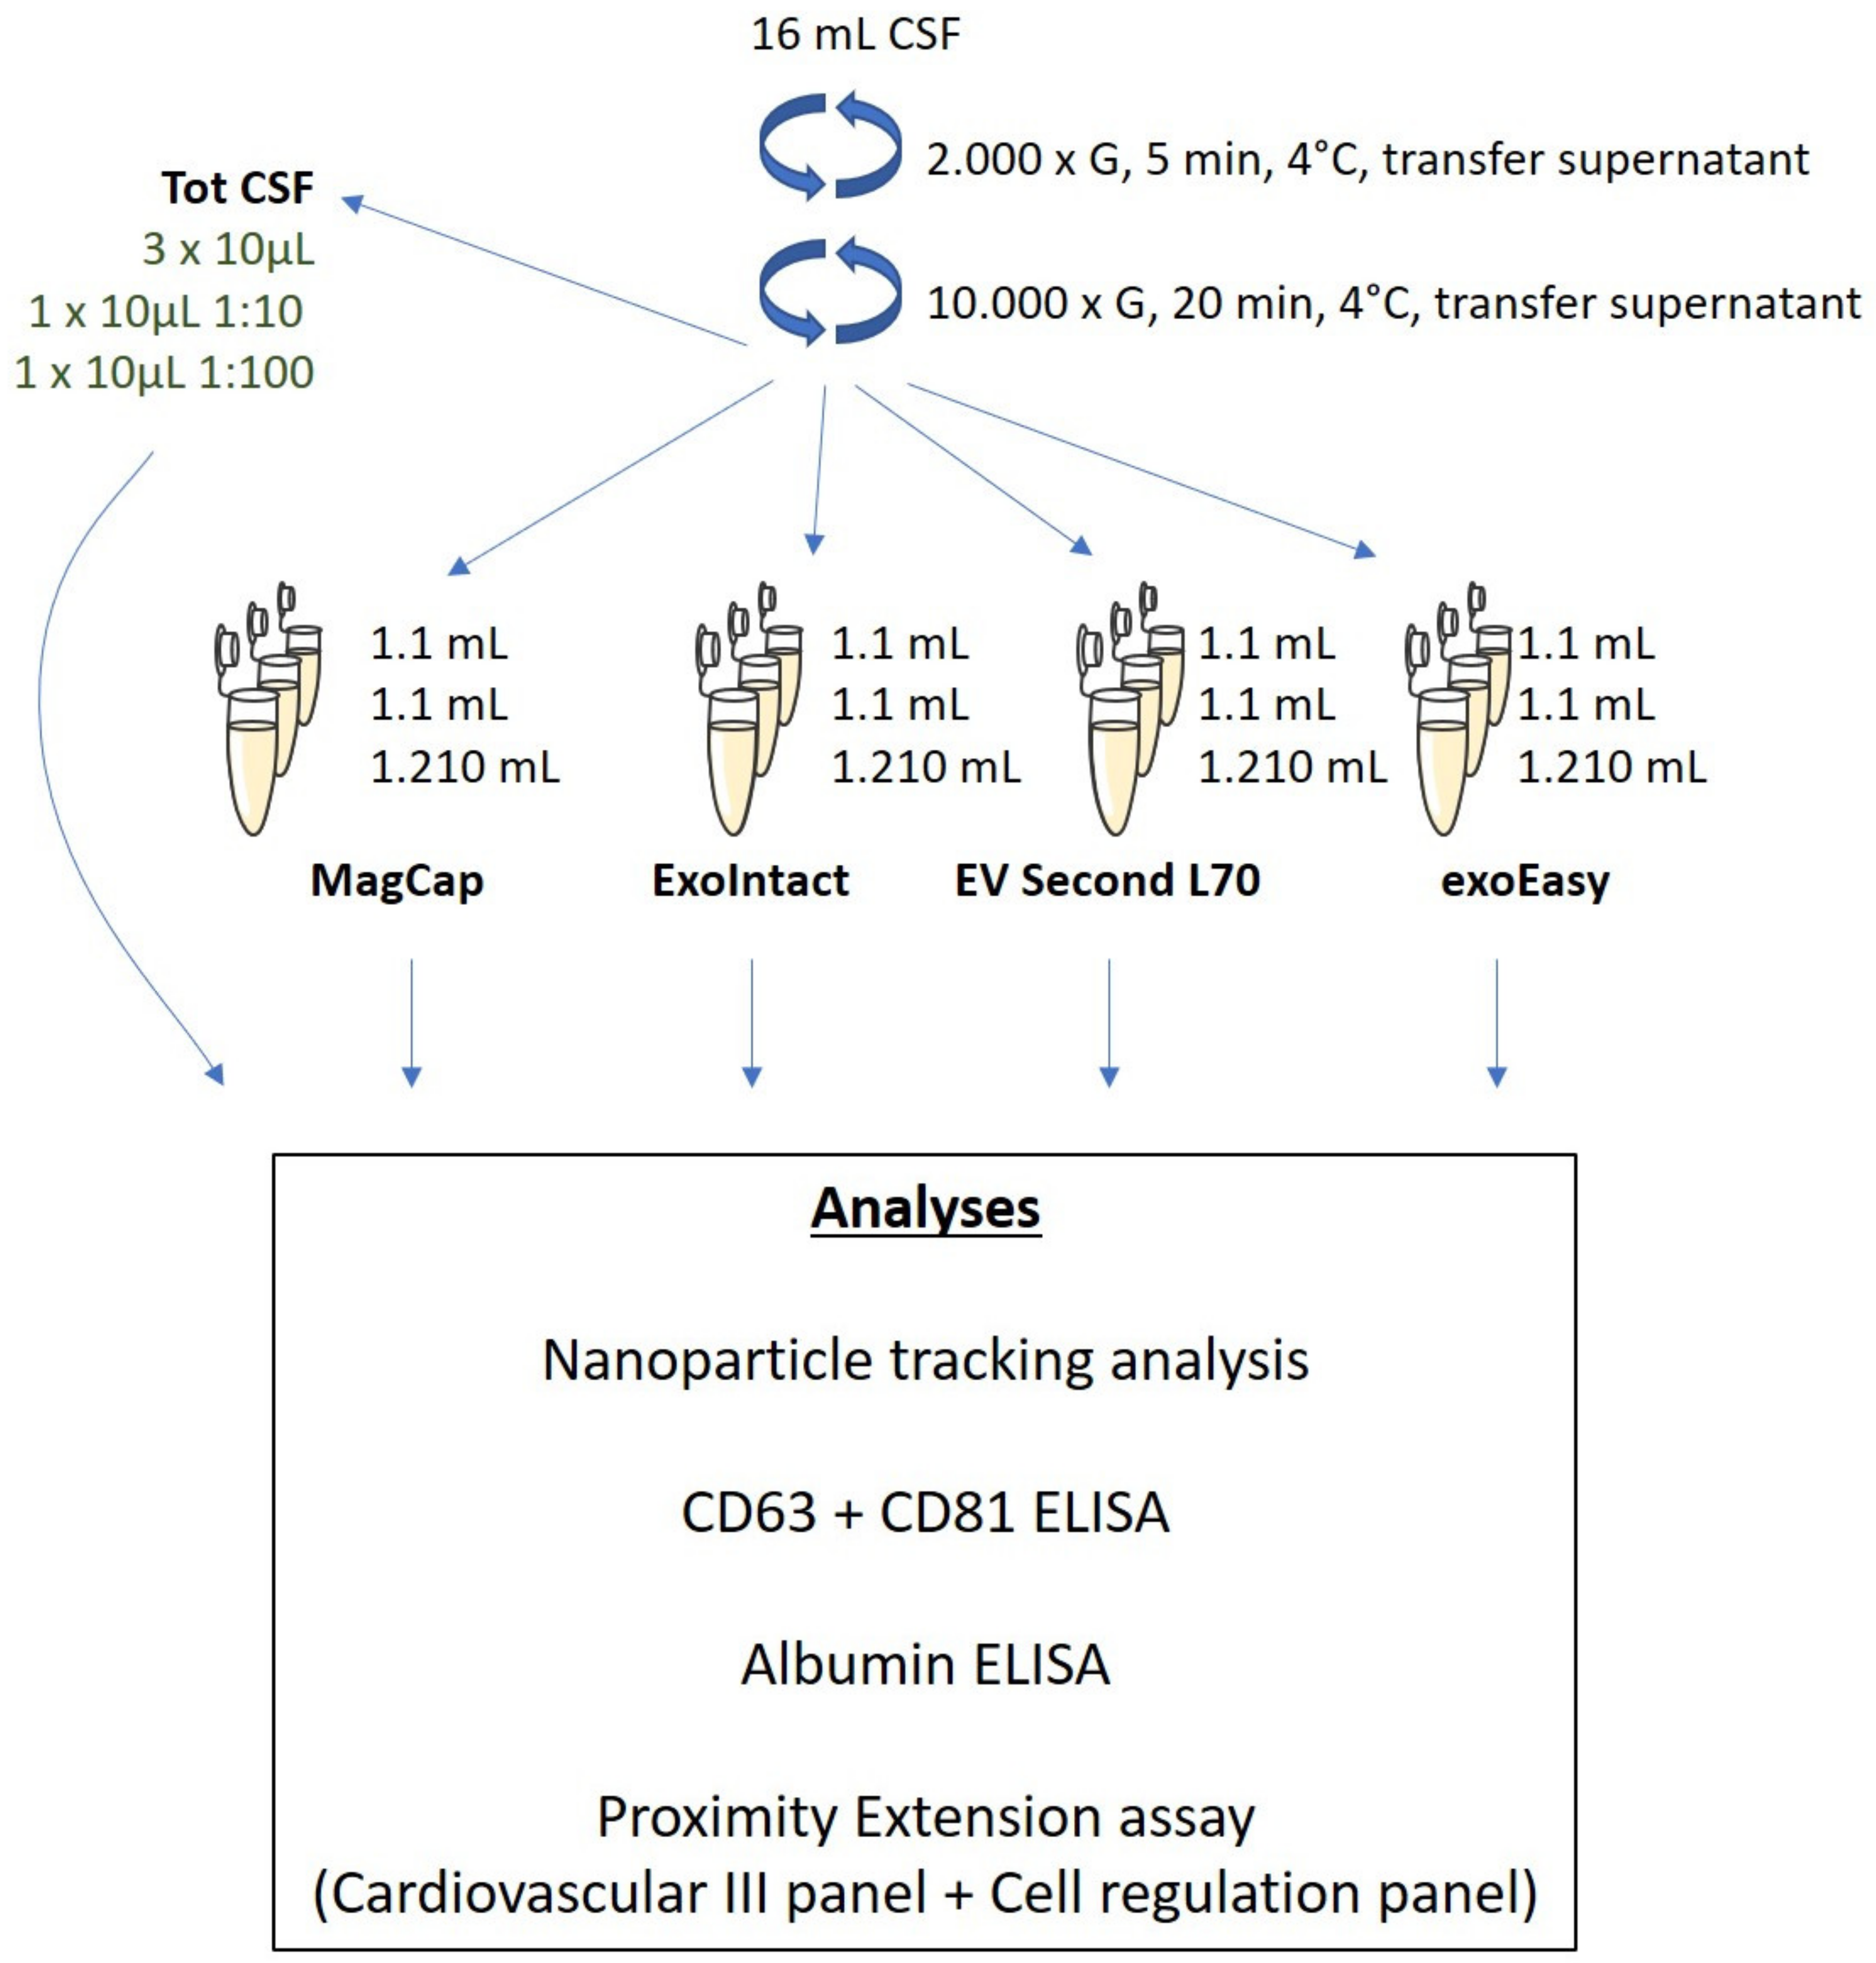
4.1. Extracellular Vesicle Isolation
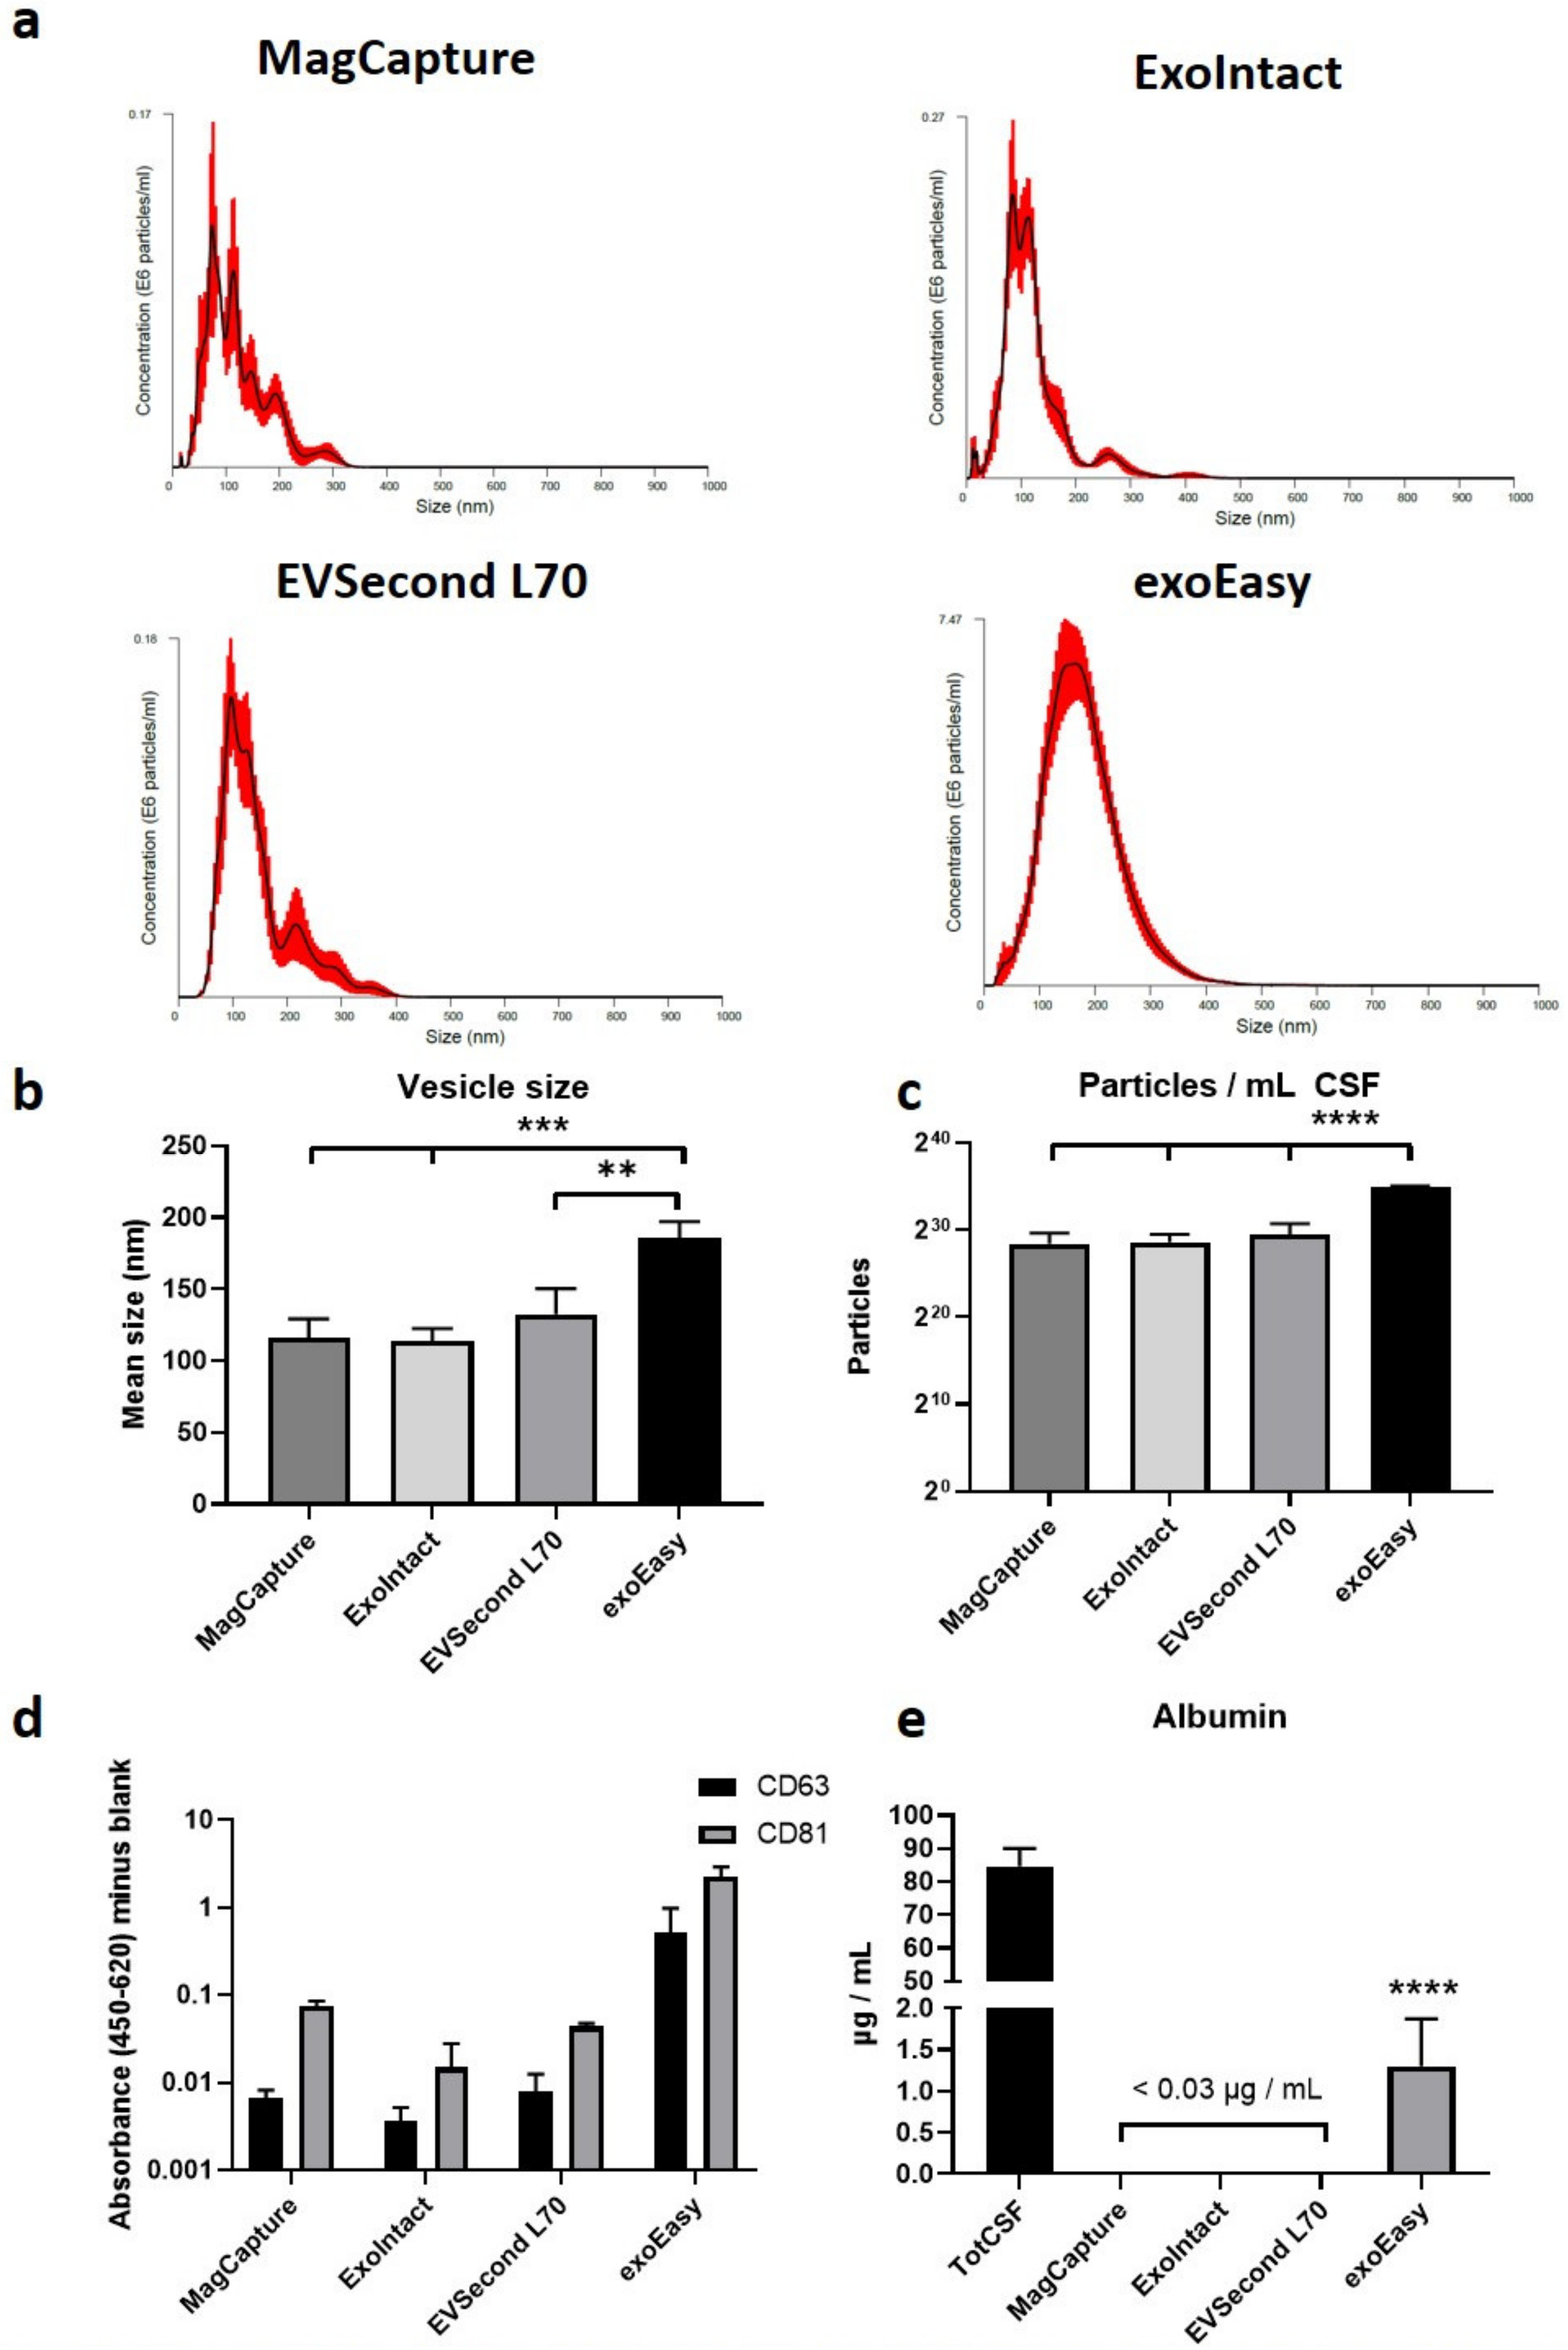
4.2. Nanoparticle Tracking Analysis
4.3. ELISA
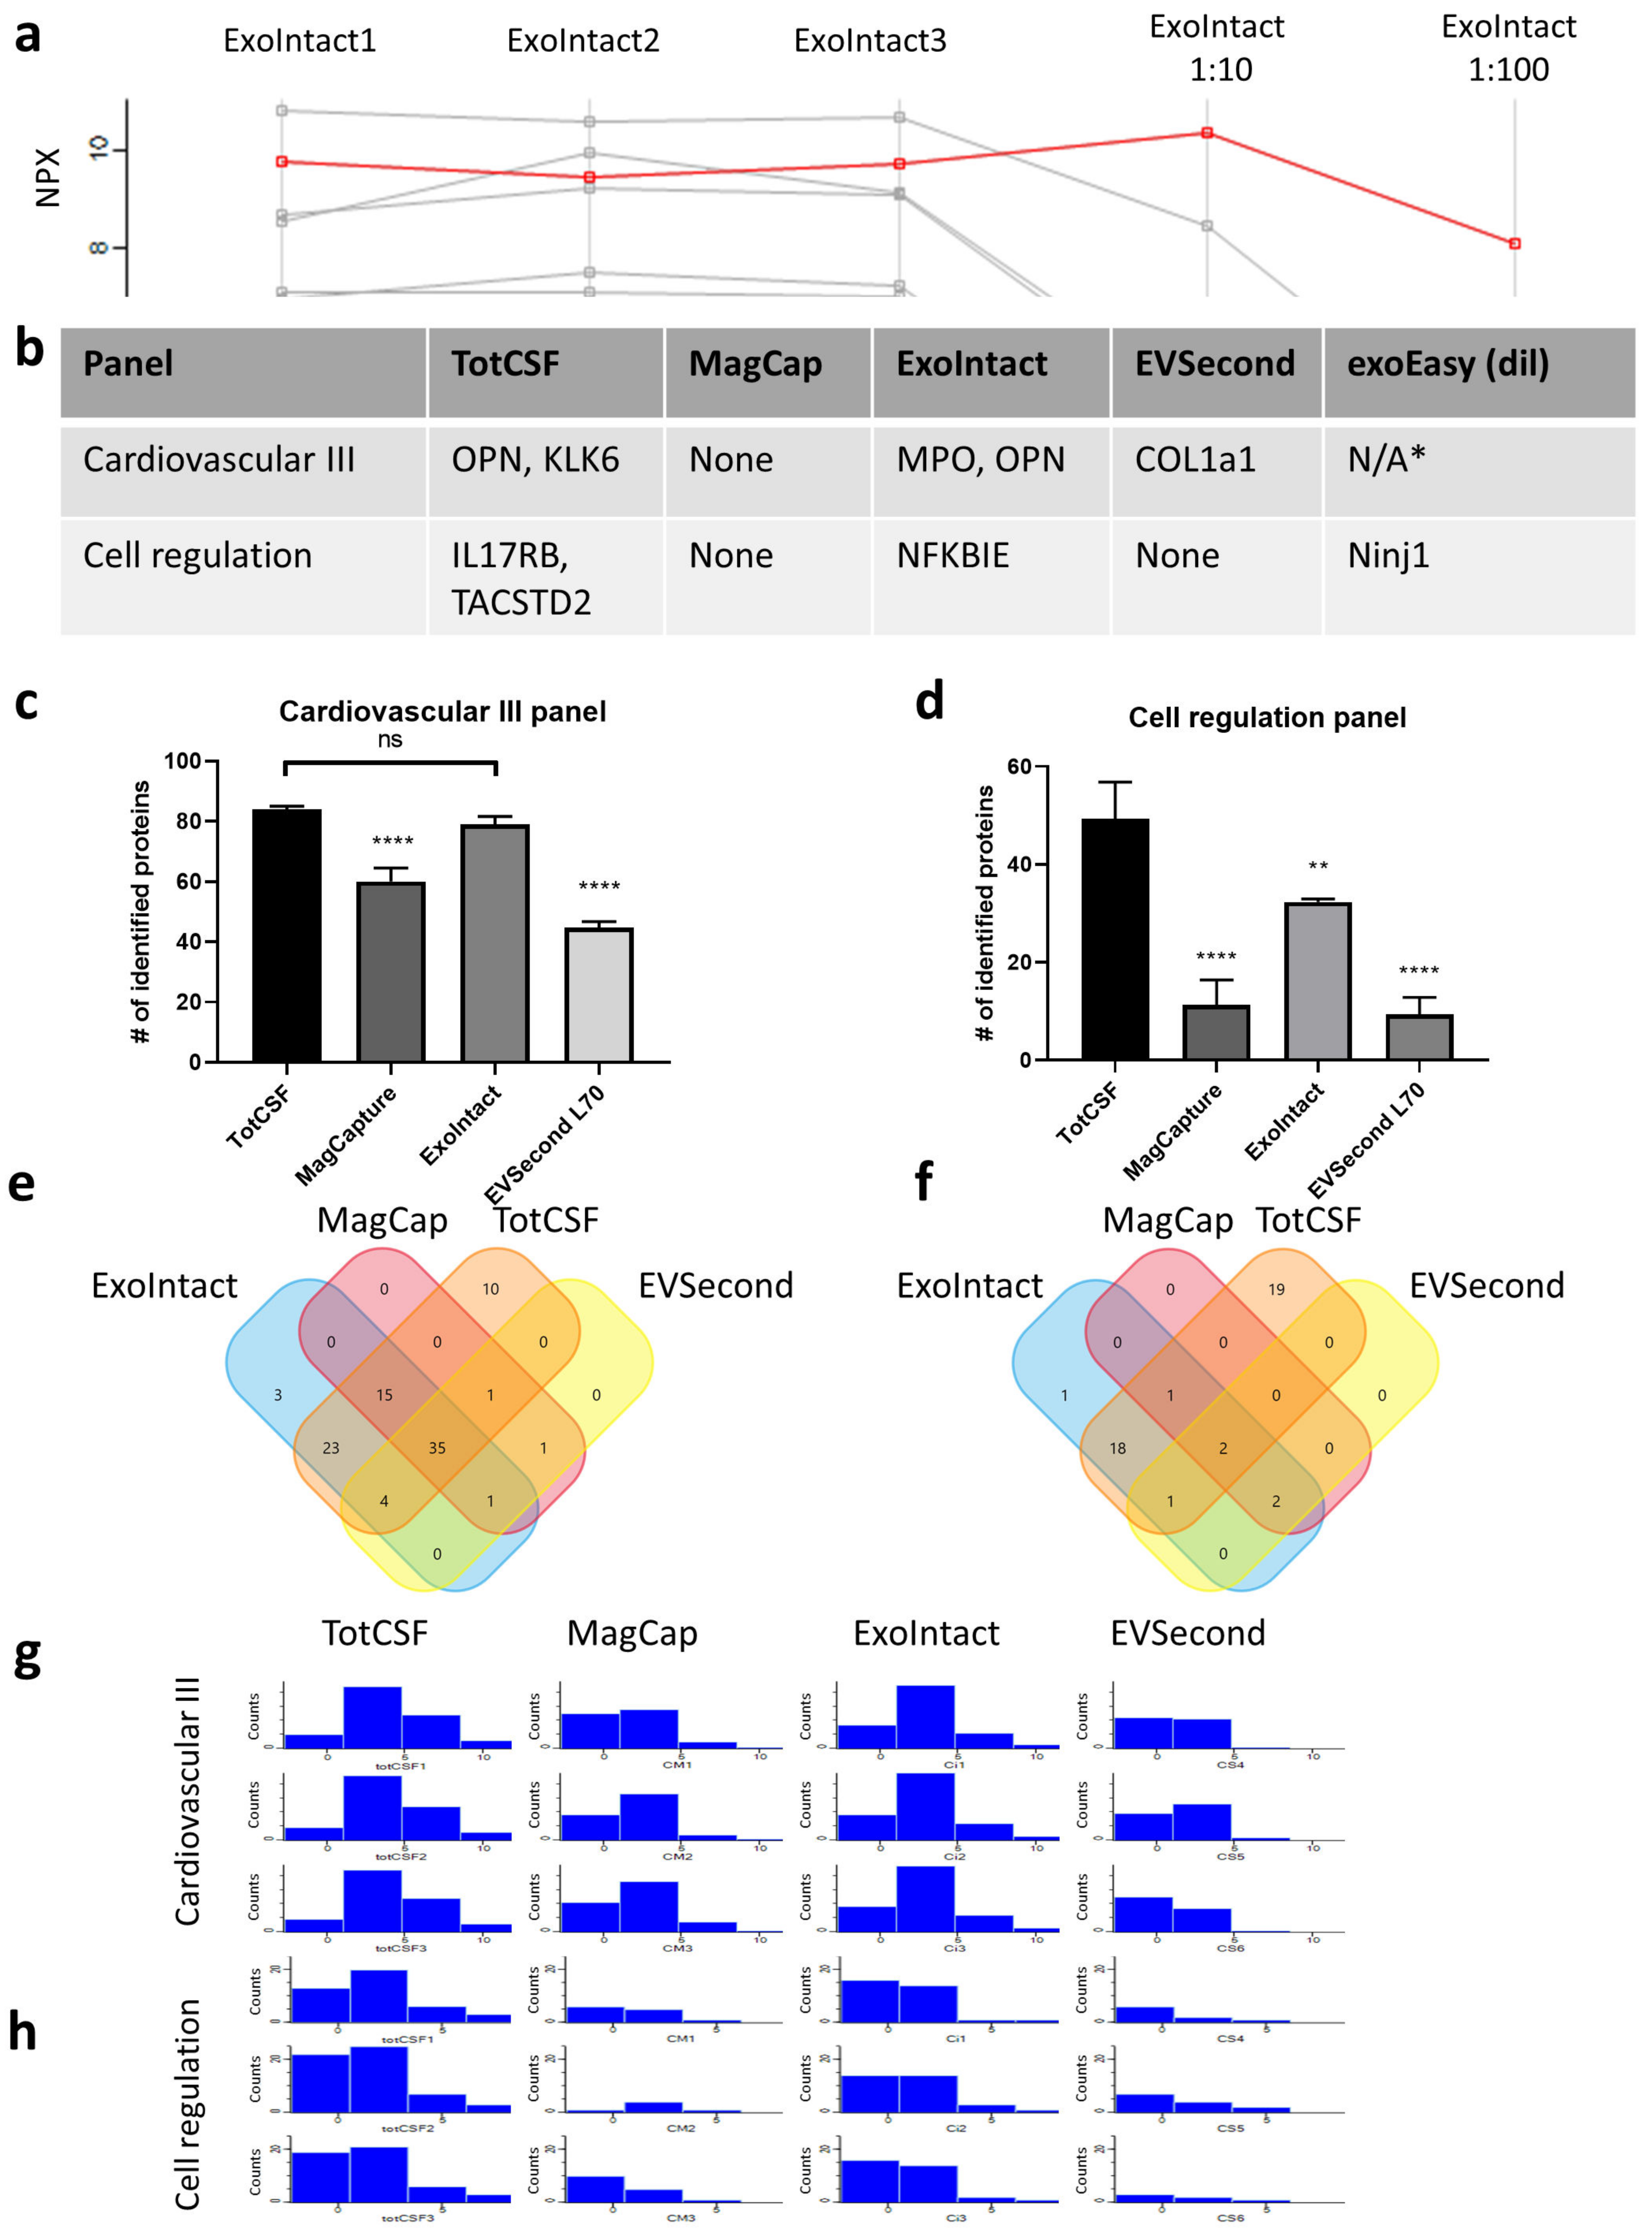
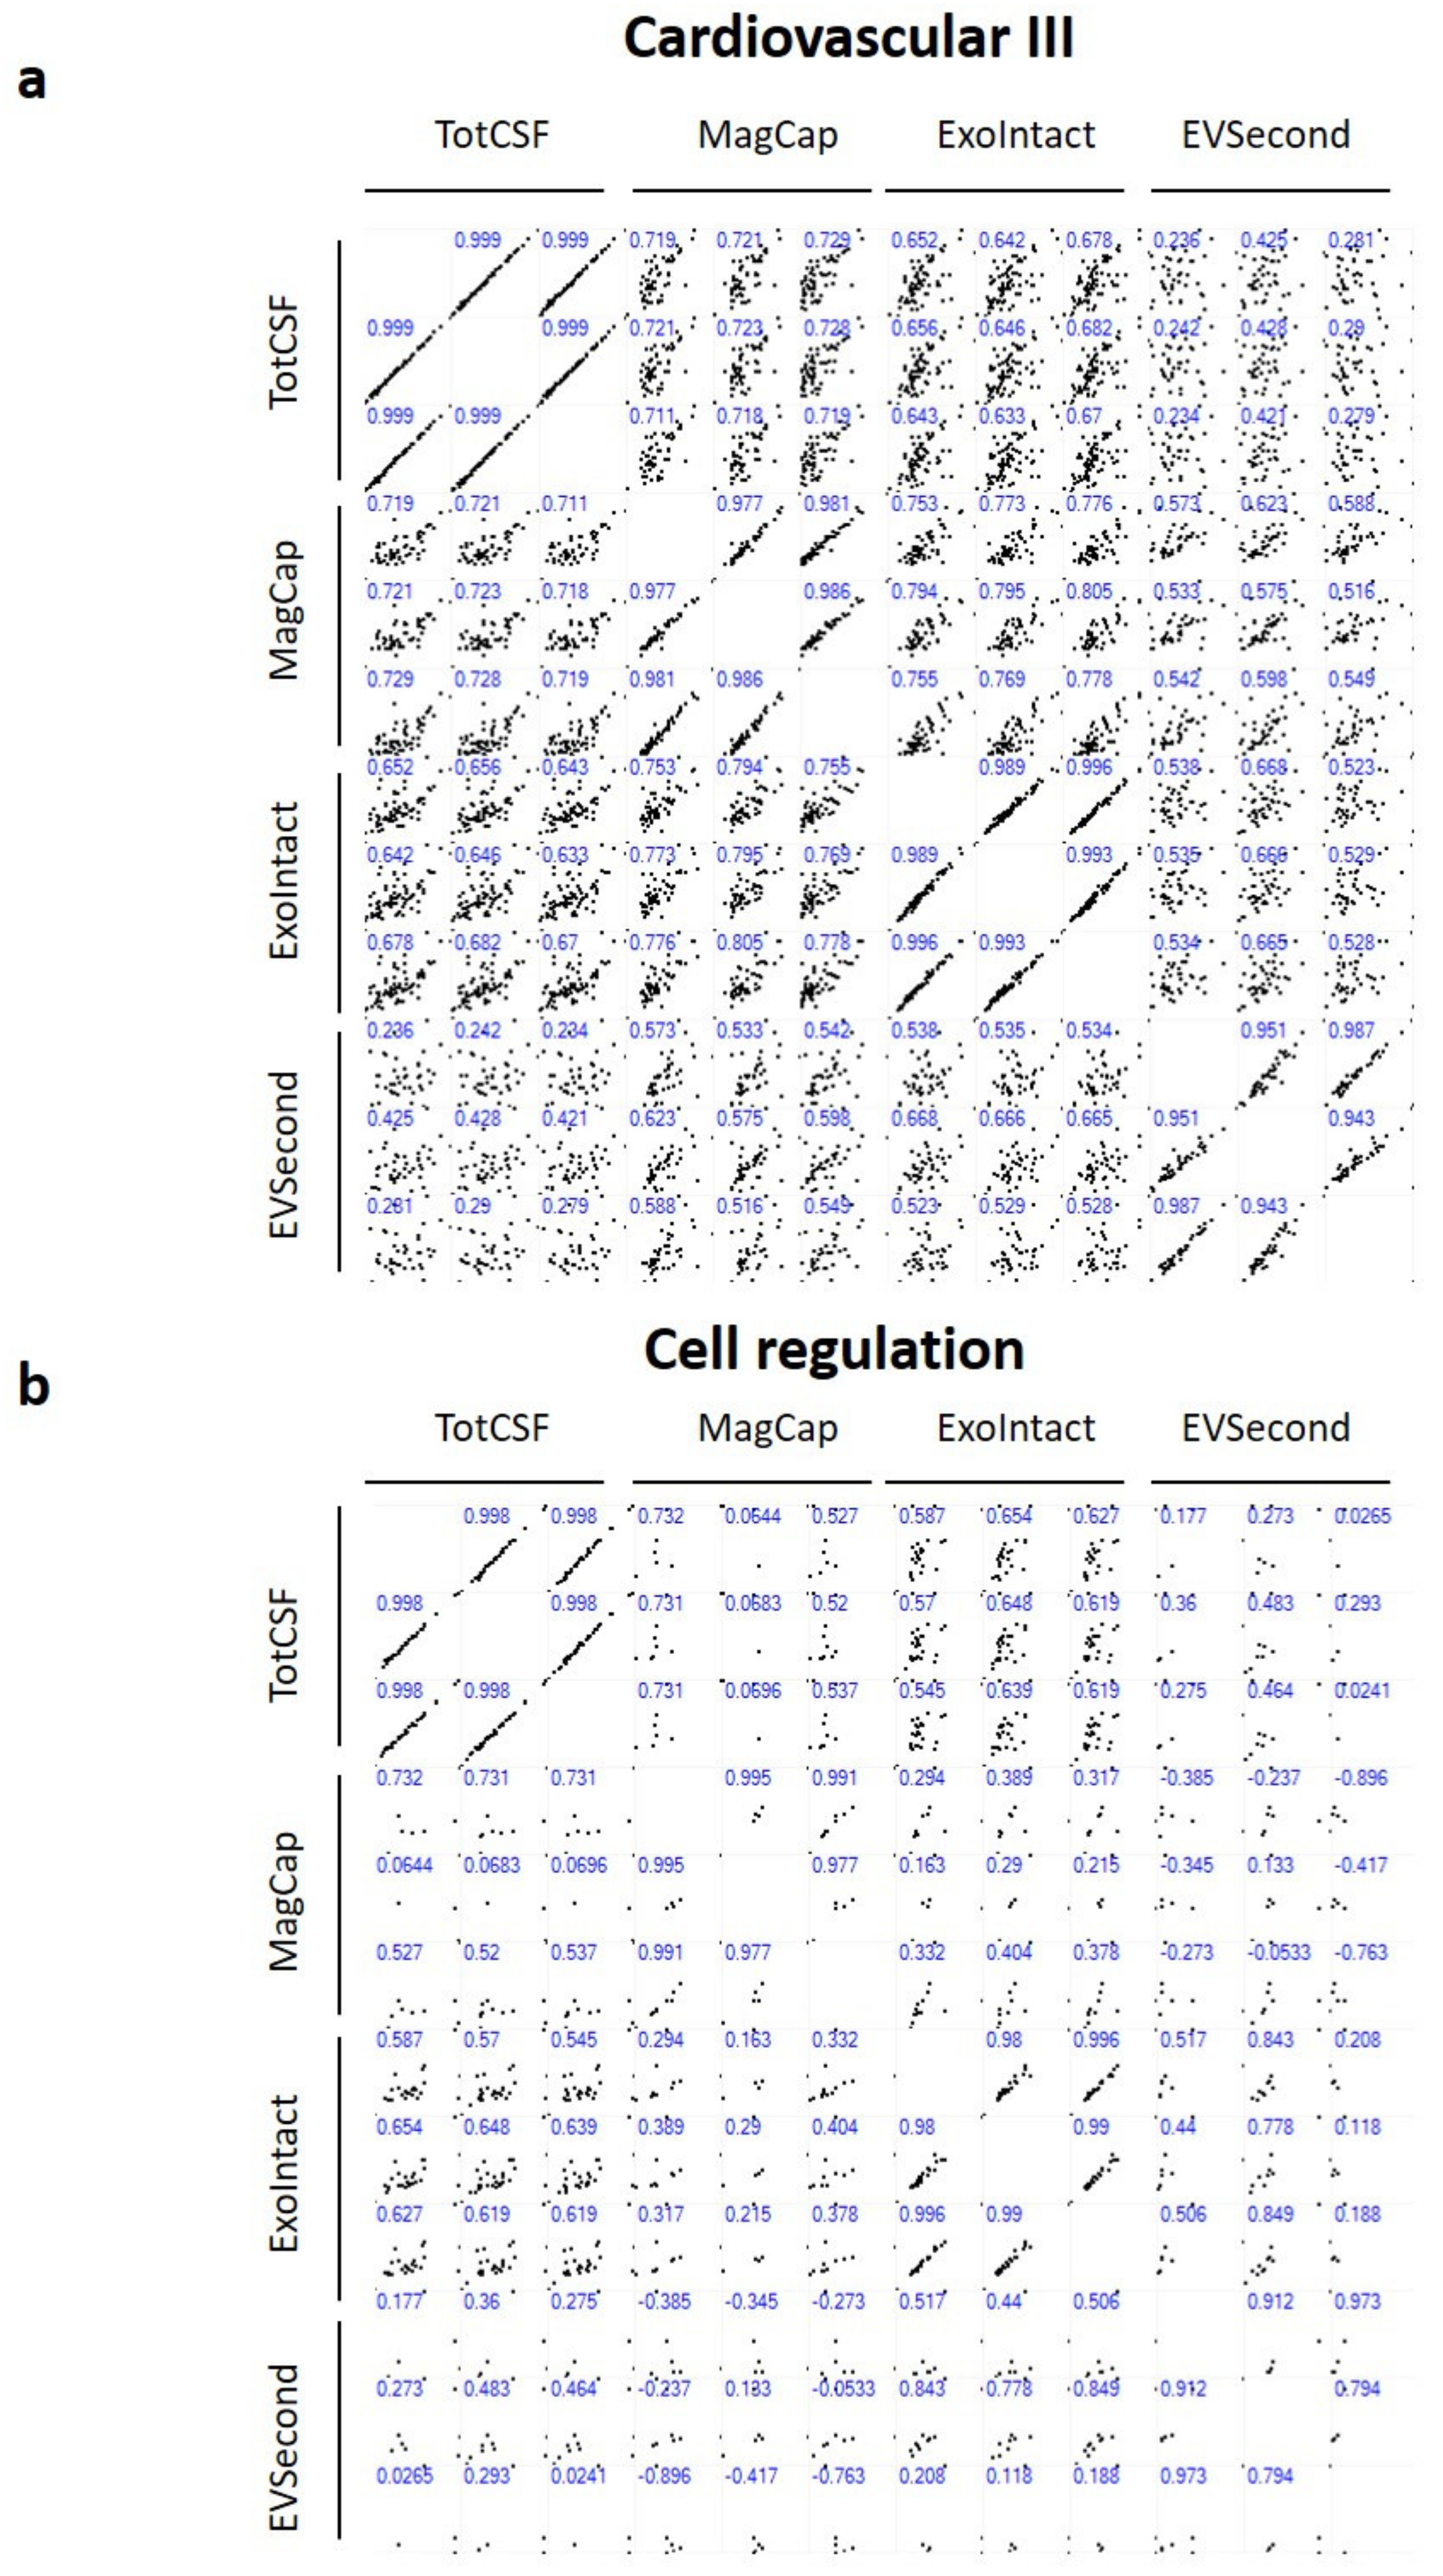
4.4. Data Analysis
Supplementary Materials
Author Contributions
Funding
Conflicts of Interest
Abbreviations
| AD | Alzheimer’s disease |
| BBB | Blood–brain barrier |
| CNS | Central nervous system |
| CSF | Cerebrospinal fluid |
| EV | Extracellular fluid |
| PCA | Principal component analysis |
| PEA | Proximity extension assay |
References
- Filiou, M.D.; Turck, C.W. General overview: Biomarkers in Neuroscience Research. In International Review of Neurobiology; Academic Press Inc.: Cambridge, MA, USA, 2011; Volume 101, pp. 1–17. [Google Scholar]
- Lloret, A.; Esteve, D.; Lloret, M.A.; Cervera-Ferri, A.; Lopez, B.; Nepomuceno, M.; Monllor, P. When does Alzheimer’s disease really start? The role of biomarkers. Int. J. Mol. Sci. 2019, 20, 5536. [Google Scholar] [CrossRef] [PubMed]
- Blennow, K.; Zetterberg, H. Biomarkers for Alzheimer’s disease: Current status and prospects for the future. J. Intern. Med. 2018, 284, 643–663. [Google Scholar] [CrossRef] [PubMed]
- Zetterberg, H.; Hietala, A.M.; Jonsson, M.; Andreasen, N.; Styrud, E.; Karlsson, I.; Edman, A.; Popa, C.; Rasulzada, A.; Wahlund, L.-O.; et al. Neurochemical aftermath of amateur boxing. Arch. Neurol. 2006, 63, 1277–1280. [Google Scholar] [CrossRef] [PubMed]
- Kim, H.J.; Tsao, J.W.; Stanfill, A.G. The current state of biomarkers of mild traumatic brain injury. JCI Insight 2018, 3, e97105. [Google Scholar] [CrossRef]
- Hall, S.; Surova, Y.; Öhrfelt, A.; Zetterberg, H.; Lindqvist, D.; Hansson, O. CSF biomarkers and clinical progression of Parkinson disease. Neurology 2015, 84, 57–63. [Google Scholar] [CrossRef]
- Beridze, M.; Sanikidze, T.; Shakarishvili, R.; Intskirveli, N.; Bornstein, N.M. Selected acute phase CSF factors in ischemic stroke: Findings and prognostic value. BMC Neurol. 2011, 11, 41. [Google Scholar] [CrossRef]
- Stolp, H.B.; Dziegielewska, K.M. Role of developmental inflammation and blood-brain barrier dysfunction in neurodevelopmental and neurodegenerative diseases. Neuropathol. Appl. Neurobiol. 2009, 35, 132–146. [Google Scholar] [CrossRef]
- Théry, C.; Witwer, K.W.; Aikawa, E.; Alcaraz, M.J.; Anderson, J.D.; Andriantsitohaina, R.; Antoniou, A.; Arab, T.; Archer, F.; Atkin-Smith, G.K.; et al. Minimal information for studies of extracellular vesicles 2018 (MISEV2018) A position statement of the INTERNATIONAL Society for Extracellular Vesicles and update of the MISEV2014 guidelines. J. Extracell. Vesicles 2018, 7, 1535750. [Google Scholar] [CrossRef]
- El Andaloussi, S.; Mäger, I.; Breakefield, X.O.; Wood, M.J.A. Extracellular vesicles: Biology and emerging therapeutic opportunities. Nat. Rev. Drug Discov. 2013, 12, 347–357. [Google Scholar] [CrossRef]
- Guha, D.; Mukerji, S.S.; Chettimada, S.; Misra, V.; Lorenz, D.R.; Morgello, S.; Gabuzda, D. Cerebrospinal fluid extracellular vesicles and neurofilament light protein as biomarkers of central nervous system injury in HIV-infected patients on antiretroviral therapy. AIDS 2019, 33, 615–625. [Google Scholar] [CrossRef]
- Théry, C.; Zitvogel, L.; Amigorena, S. Exosomes: Composition, biogenesis and function. Nat. Rev. Immunol. 2002, 2, 569–579. [Google Scholar] [CrossRef] [PubMed]
- Welton, J.L.; Loveless, S.; Stone, T.; von Ruhland, C.; Robertson, N.P.; Clayton, A. Cerebrospinal fluid extracellular vesicle enrichment for protein biomarker discovery in neurological disease; multiple sclerosis. J. Extracell. Vesicles 2017, 6, 1369805. [Google Scholar] [CrossRef] [PubMed]
- Saman, S.; Kim, W.H.; Raya, M.; Visnick, Y.; Miro, S.; Saman, S.; Jackson, B.; McKee, A.C.; Alvarez, V.E.; Lee, N.C.Y.; et al. Exosome-associated tau is secreted in tauopathy models and is selectively phosphorylated in cerebrospinal fluid in early Alzheimer disease. J. Biol. Chem. 2012, 287, 3842–3849. [Google Scholar] [CrossRef] [PubMed]
- Thompson, A.G.; Gray, E.; Mager, I.; Fischer, R.; Thézénas, M.L.; Charles, P.D.; Talbot, K.; El Andaloussi, S.; Kessler, B.M.; Wood, M.; et al. UFLC-Derived CSF Extracellular Vesicle Origin and Proteome. Proteomics 2018, 18, 1800257. [Google Scholar] [CrossRef] [PubMed]
- Larssen, P.; Wik, L.; Czarnewski, P.; Eldh, M.; Lof, L.; Goran Ronquist, K.; Dubois, L.; Freyhult, E.; Gallant, C.J.; Oelrich, J.; et al. Tracing cellular origin of human exosomes using multiplex proximity extension assays. Mol. Cell. Proteom. 2017, 16, 502–511. [Google Scholar] [CrossRef] [PubMed]
- Begum, G.; Reddy, R.; Yakoub, K.M.; Belli, A.; Davies, D.J.; Di Pietro, V. Differential expression of circulating inflammatory proteins following sport-related traumatic brain injury. Int. J. Mol. Sci. 2020, 21, 1216. [Google Scholar] [CrossRef]
- Ghai, V.; Fallen, S.; Baxter, D.; Scherler, K.; Kim, T.K.; Zhou, Y.; Meabon, J.S.; Logsdon, A.F.; Banks, W.A.; Schindler, A.G.; et al. Alterations in plasma microRNA and protein levels in war veterans with chronic mild traumatic brain injury. J. Neurotrauma 2020, 37, 1418–1430. [Google Scholar] [CrossRef]
- Previtali, S.C.; Gidaro, T.; Díaz-Manera, J.; Zambon, A.; Carnesecchi, S.; Roux-Lombard, P.; Spitali, P.; Signorelli, M.; Szigyarto, C.A.K.; Johansson, C.; et al. Rimeporide as a first- in-class NHE-1 inhibitor: Results of a phase Ib trial in young patients with Duchenne Muscular Dystrophy. Pharmacol. Res. 2020, 159, 104999. [Google Scholar] [CrossRef]
- Santaella, A.; Kuiperij, H.B.; Van Rumund, A.; Esselink, R.A.J.; Van Gool, A.J.; Bloem, B.R.; Verbeek, M.M. Inflammation biomarker discovery in Parkinson’s disease and atypical parkinsonisms. BMC Neurol. 2020, 20, 26. [Google Scholar] [CrossRef]
- Andrés-Benito, P.; Domínguez, R.; Colomina, M.J.; Llorens, F.; Povedano, M.; Ferrer, I. YKL40 in sporadic amyotrophic lateral sclerosis: Cerebrospinal fluid levels as a prognosis marker of disease progression. Aging 2018, 10, 2367–2382. [Google Scholar] [CrossRef]
- Kawaguchi-Niida, M.; Yamamoto, T.; Kato, Y.; Inose, Y.; Shibata, N. MCP-1/CCR2 signaling-mediated astrocytosis is accelerated in a transgenic mouse model of SOD1-mutated familial ALS. Acta Neuropathol. Commun. 2014, 2, 21. [Google Scholar] [CrossRef] [PubMed]
- Gille, B.; De Schaepdryver, M.; Dedeene, L.; Goossens, J.; Claeys, K.G.; Van Den Bosch, L.; Tournoy, J.; Van Damme, P.; Poesen, K. Inflammatory markers in cerebrospinal fluid: Independent prognostic biomarkers in amyotrophic lateral sclerosis? J. Neurol. Neurosurg. Psychiatry 2019, 90, 2018–319586. [Google Scholar] [CrossRef] [PubMed]
- Raivich, G.; Bohatschek, M.; Da Costa, C.; Iwata, O.; Galiano, M.; Hristova, M.; Nateri, A.S.; Makwana, M.; Riera-Sans, L.; Wolfer, D.P.; et al. The AP-1 transcription factor c-Jun is required for efficient axonal regeneration. Neuron 2004, 43, 57–67. [Google Scholar] [CrossRef] [PubMed]
- Yoo, M.; Khaled, M.; Gibbs, K.M.; Kim, J.; Kowalewski, B.; Dierks, T.; Schachner, M. Arylsulfatase B improves locomotor function after mouse spinal cord injury. PLoS ONE 2013, 8, e57415. [Google Scholar] [CrossRef]
- Frese, C.K.; Mikhaylova, M.; Stucchi, R.; Gautier, V.; Liu, Q.; Mohammed, S.; Heck, A.J.R.; Altelaar, A.F.M.; Hoogenraad, C.C. Quantitative Map of Proteome Dynamics during Neuronal Differentiation. Cell Rep. 2017, 18, 1527–1542. [Google Scholar] [CrossRef] [PubMed]
- Patel, G.K.; Khan, M.A.; Zubair, H.; Srivastava, S.K.; Khushman, M.; Singh, S.; Singh, A.P. Comparative analysis of exosome isolation methods using culture supernatant for optimum yield, purity and downstream applications. Sci. Rep. 2019, 9. [Google Scholar] [CrossRef] [PubMed]
- Hoofnagle, A.N.; Wener, M.H. The fundamental flaws of immunoassays and potential solutions using tandem mass spectrometry. J. Immunol. Methods 2009, 347, 3–11. [Google Scholar] [CrossRef]
- Helwa, I.; Cai, J.; Drewry, M.D.; Zimmerman, A.; Dinkins, M.B.; Khaled, M.L.; Seremwe, M.; Dismuke, W.M.; Bieberich, E.; Stamer, W.D.; et al. A comparative study of serum exosome isolation using differential ultracentrifugation and three commercial reagents. PLoS ONE 2017, 12, e0170628. [Google Scholar] [CrossRef]
- Macías, M.; Rebmann, V.; Mateos, B.; Varo, N.; Perez-Gracia, J.L.; Alegre, E.; González, Á. Comparison of six commercial serum exosome isolation methods suitable for clinical laboratories. Effect in cytokine analysis. Clin. Chem. Lab. Med. 2019, 57, 1539–1545. [Google Scholar] [CrossRef]
- Sun, B.; Dalvi, P.; Abadjian, L.; Tang, N.; Pulliam, L. Blood neuron-derived exosomes as biomarkers of cognitive impairment in HIV. AIDS 2017, 31, F9–F17. [Google Scholar] [CrossRef]
- Kimes, P.K.; Liu, Y.; Neil Hayes, D.; Marron, J.S. Statistical significance for hierarchical clustering. Biometrics 2017, 73, 811–821. [Google Scholar] [CrossRef] [PubMed]
- Perou, C.M.; Sørile, T.; Eisen, M.B.; Van De Rijn, M.; Jeffrey, S.S.; Ress, C.A.; Pollack, J.R.; Ross, D.T.; Johnsen, H.; Akslen, L.A.; et al. Molecular portraits of human breast tumours. Nature 2000, 406, 747–752. [Google Scholar] [CrossRef] [PubMed]
- Tyanova, S.; Cox, J. Perseus: A bioinformatics platform for integrative analysis of proteomics data in cancer research. In Methods in Molecular Biology; Springer: Berlin, Germany, 2018; Volume 1711, pp. 133–148. ISBN 9781493974931. [Google Scholar]
- Pathan, M.; Keerthikumar, S.; Ang, C.S.; Gangoda, L.; Quek, C.Y.J.; Williamson, N.A.; Mouradov, D.; Sieber, O.M.; Simpson, R.J.; Salim, A.; et al. An open access standalone functional enrichment and interaction network analysis tool. Proteomics 2015, 15, 2597–2601. [Google Scholar] [CrossRef] [PubMed]


Publisher’s Note: MDPI stays neutral with regard to jurisdictional claims in published maps and institutional affiliations. |
© 2020 by the authors. Licensee MDPI, Basel, Switzerland. This article is an open access article distributed under the terms and conditions of the Creative Commons Attribution (CC BY) license (http://creativecommons.org/licenses/by/4.0/).
Share and Cite
Sjoqvist, S.; Otake, K.; Hirozane, Y. Analysis of Cerebrospinal Fluid Extracellular Vesicles by Proximity Extension Assay: A Comparative Study of Four Isolation Kits. Int. J. Mol. Sci. 2020, 21, 9425. https://doi.org/10.3390/ijms21249425
Sjoqvist S, Otake K, Hirozane Y. Analysis of Cerebrospinal Fluid Extracellular Vesicles by Proximity Extension Assay: A Comparative Study of Four Isolation Kits. International Journal of Molecular Sciences. 2020; 21(24):9425. https://doi.org/10.3390/ijms21249425
Chicago/Turabian StyleSjoqvist, Sebastian, Kentaro Otake, and Yoshihiko Hirozane. 2020. "Analysis of Cerebrospinal Fluid Extracellular Vesicles by Proximity Extension Assay: A Comparative Study of Four Isolation Kits" International Journal of Molecular Sciences 21, no. 24: 9425. https://doi.org/10.3390/ijms21249425
APA StyleSjoqvist, S., Otake, K., & Hirozane, Y. (2020). Analysis of Cerebrospinal Fluid Extracellular Vesicles by Proximity Extension Assay: A Comparative Study of Four Isolation Kits. International Journal of Molecular Sciences, 21(24), 9425. https://doi.org/10.3390/ijms21249425