Proteomic Study Identifies Glycolytic and Inflammation Pathways Involved in Recurrent Otitis Media


 , , , , , and
Abstract
1. Introduction
2. Results
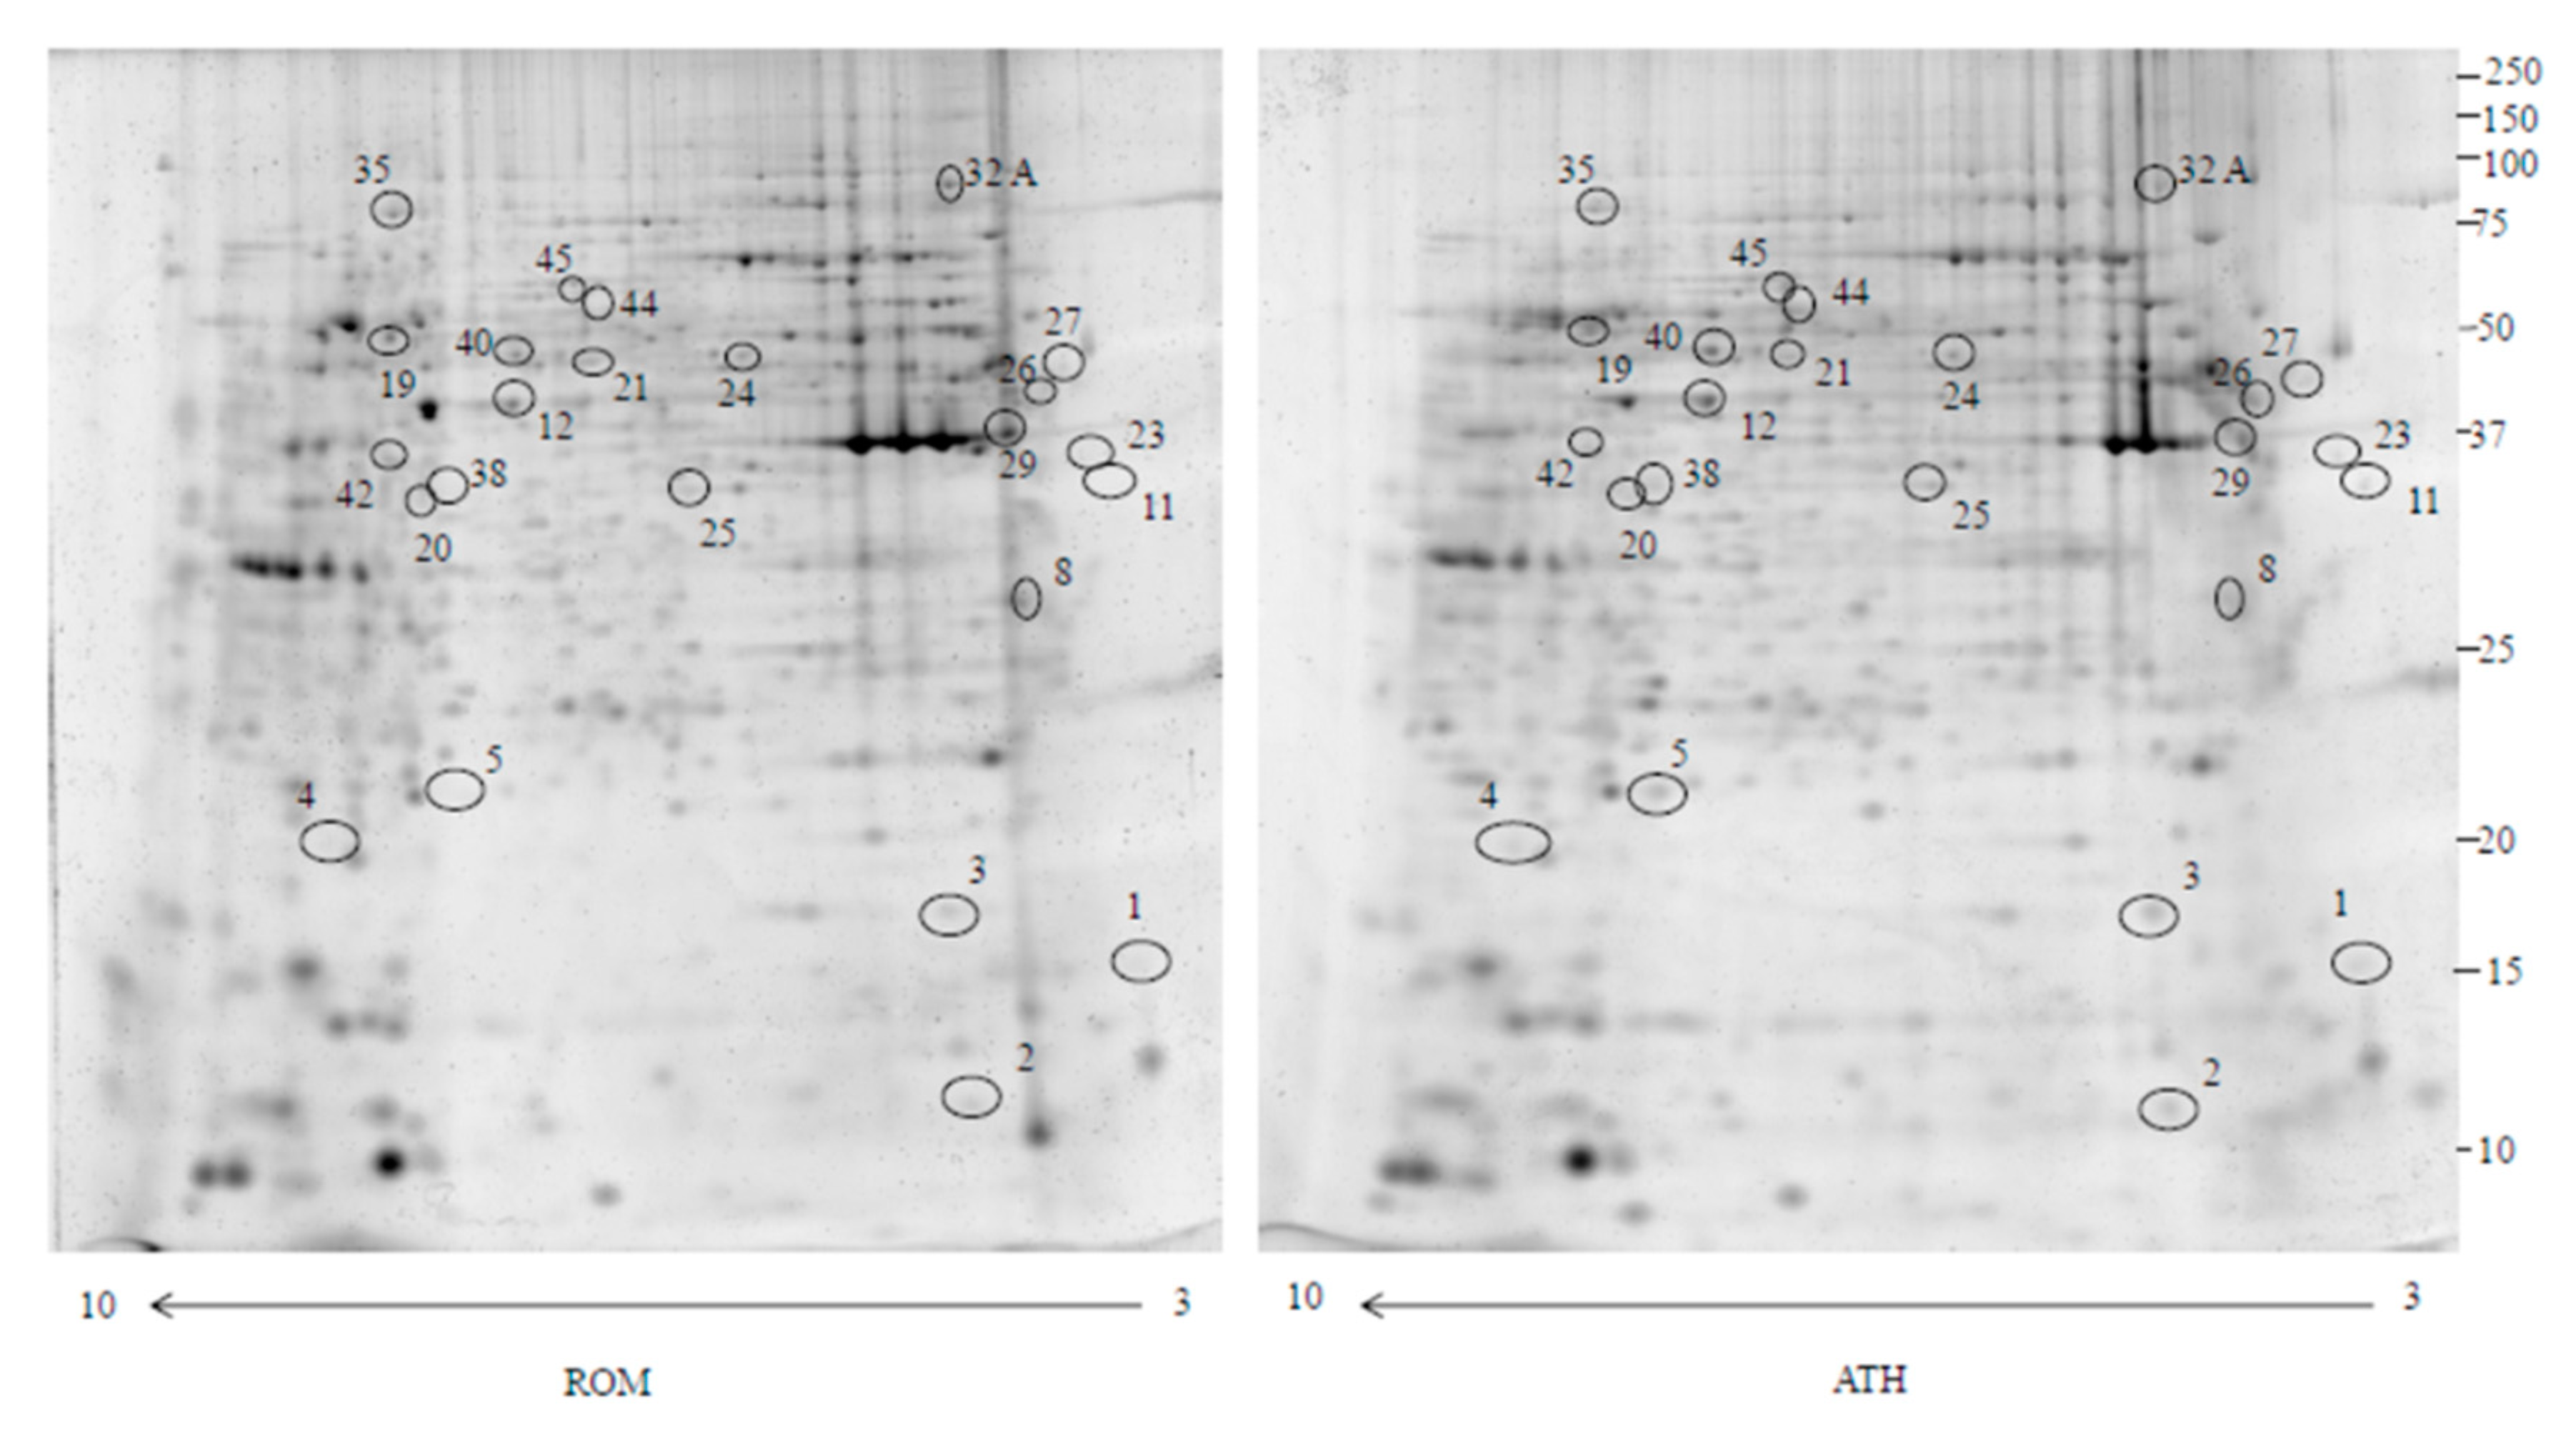
2.1. Proteomics
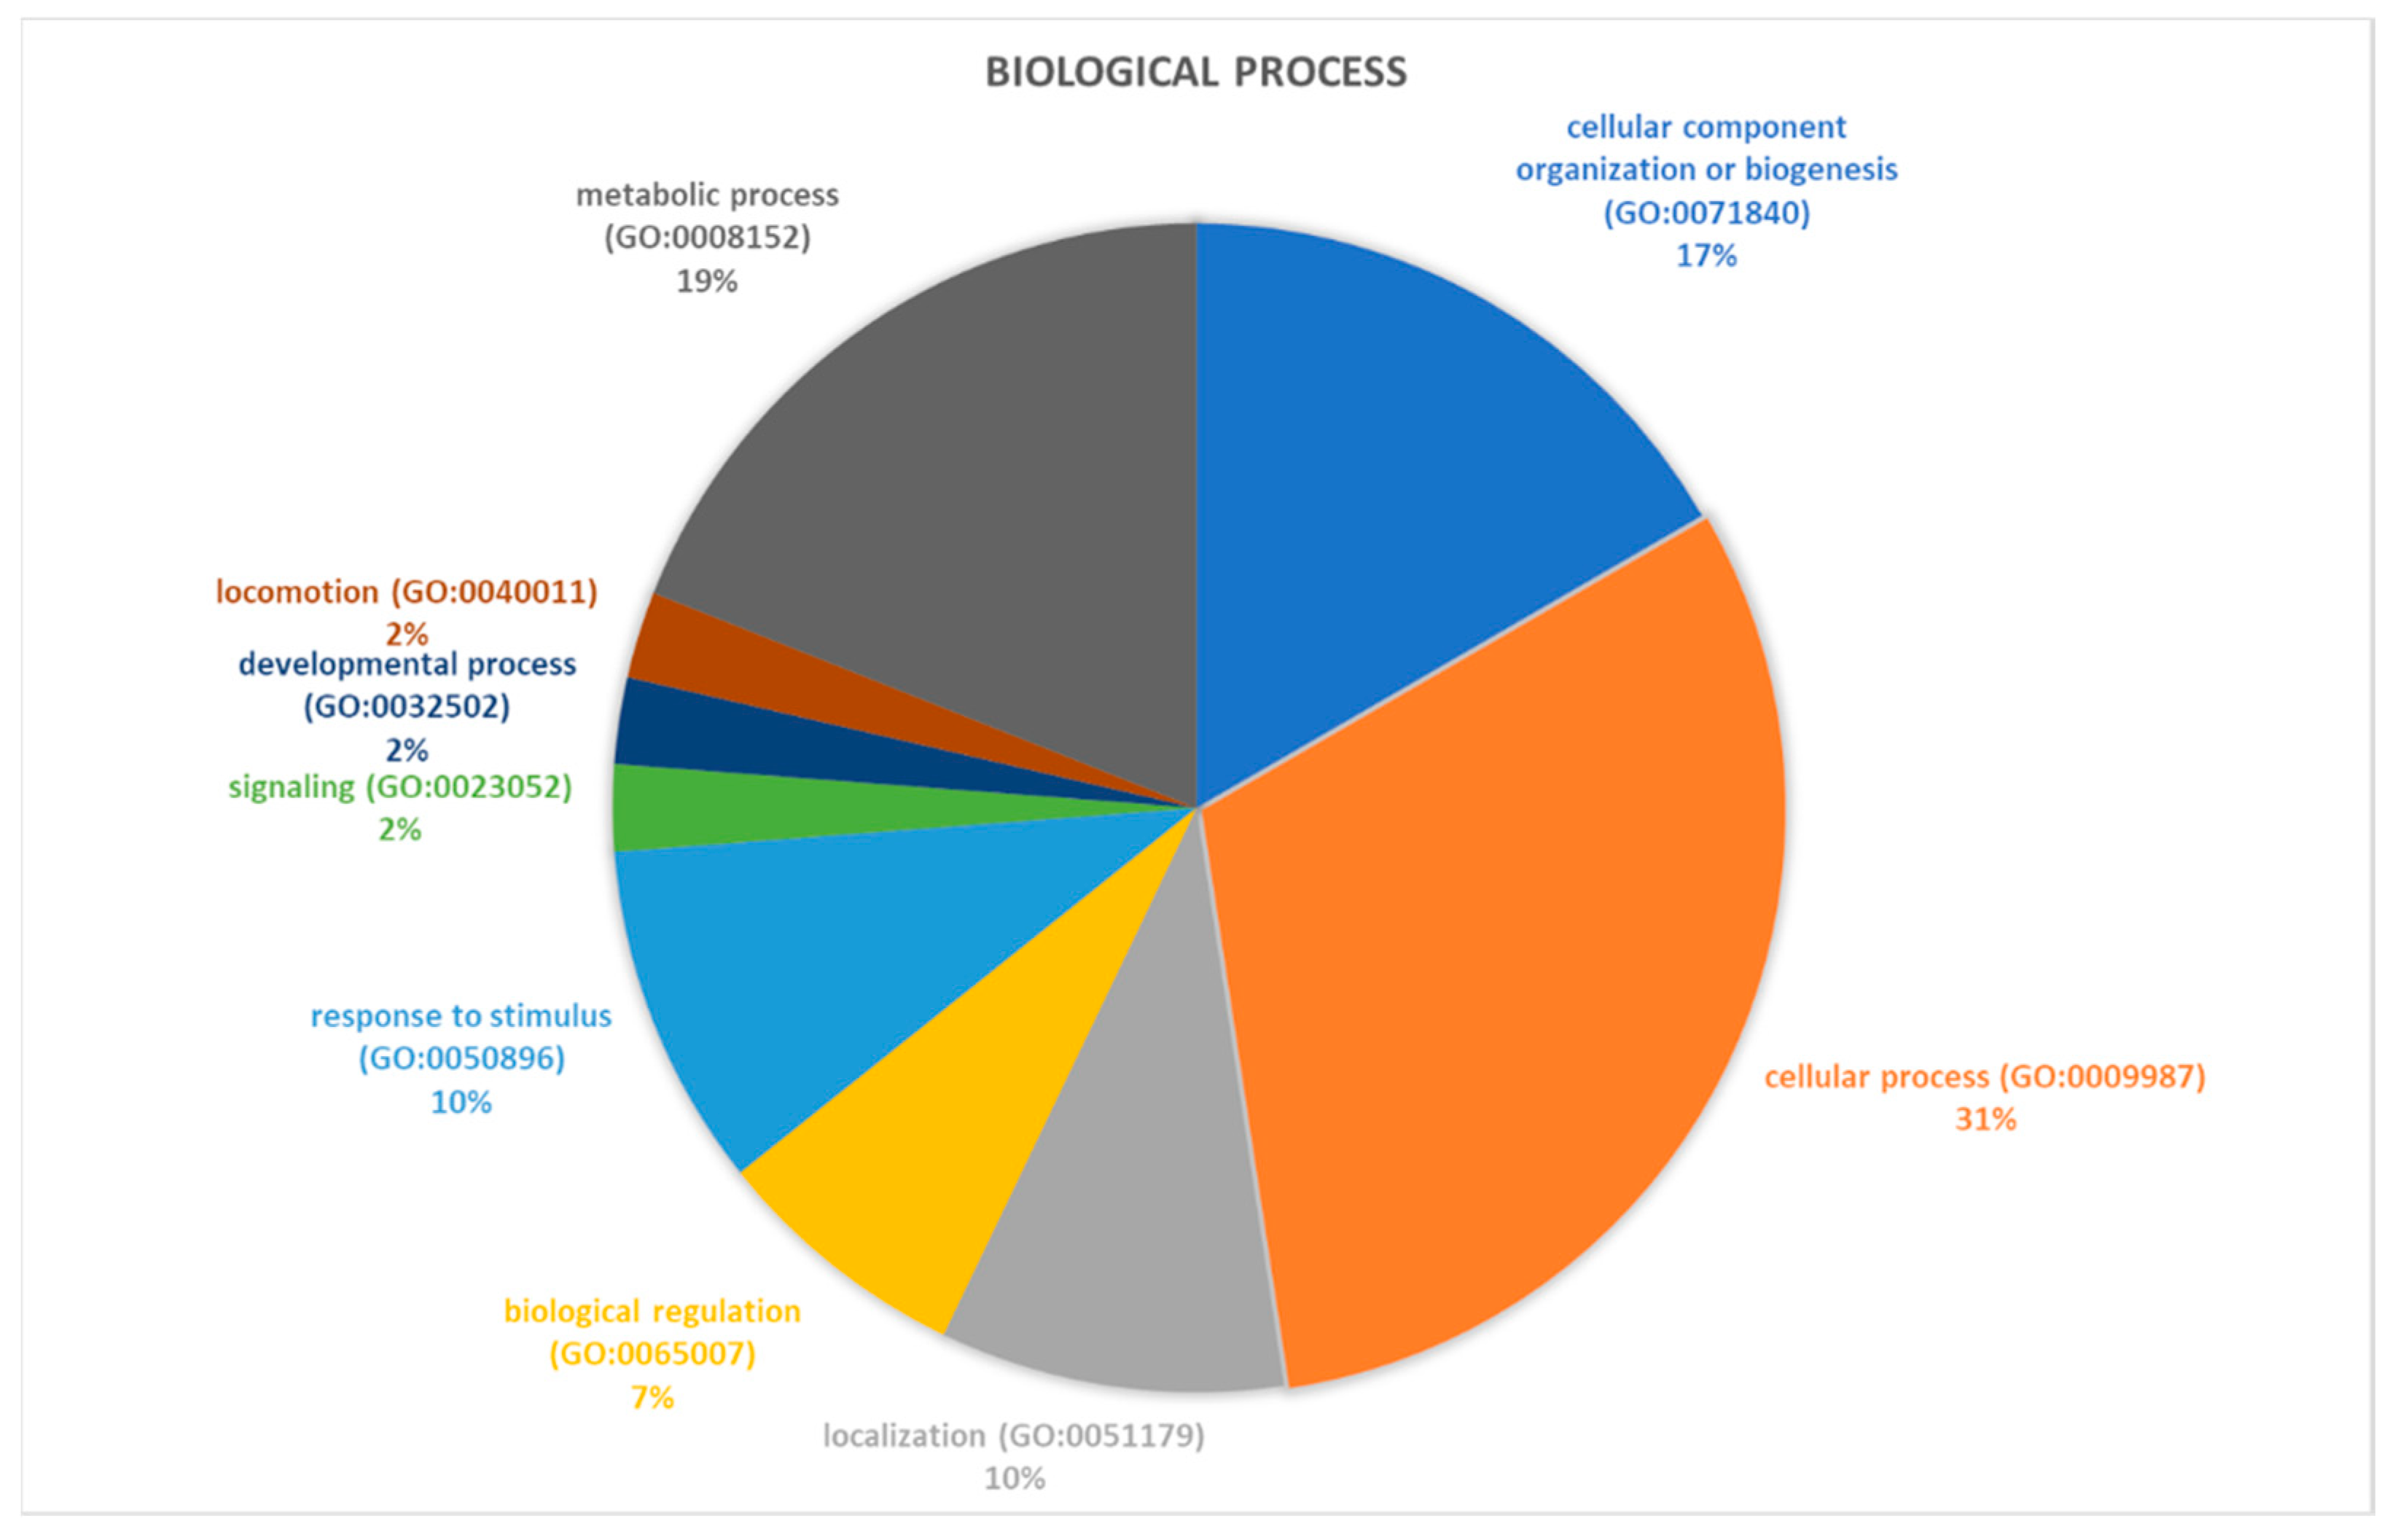
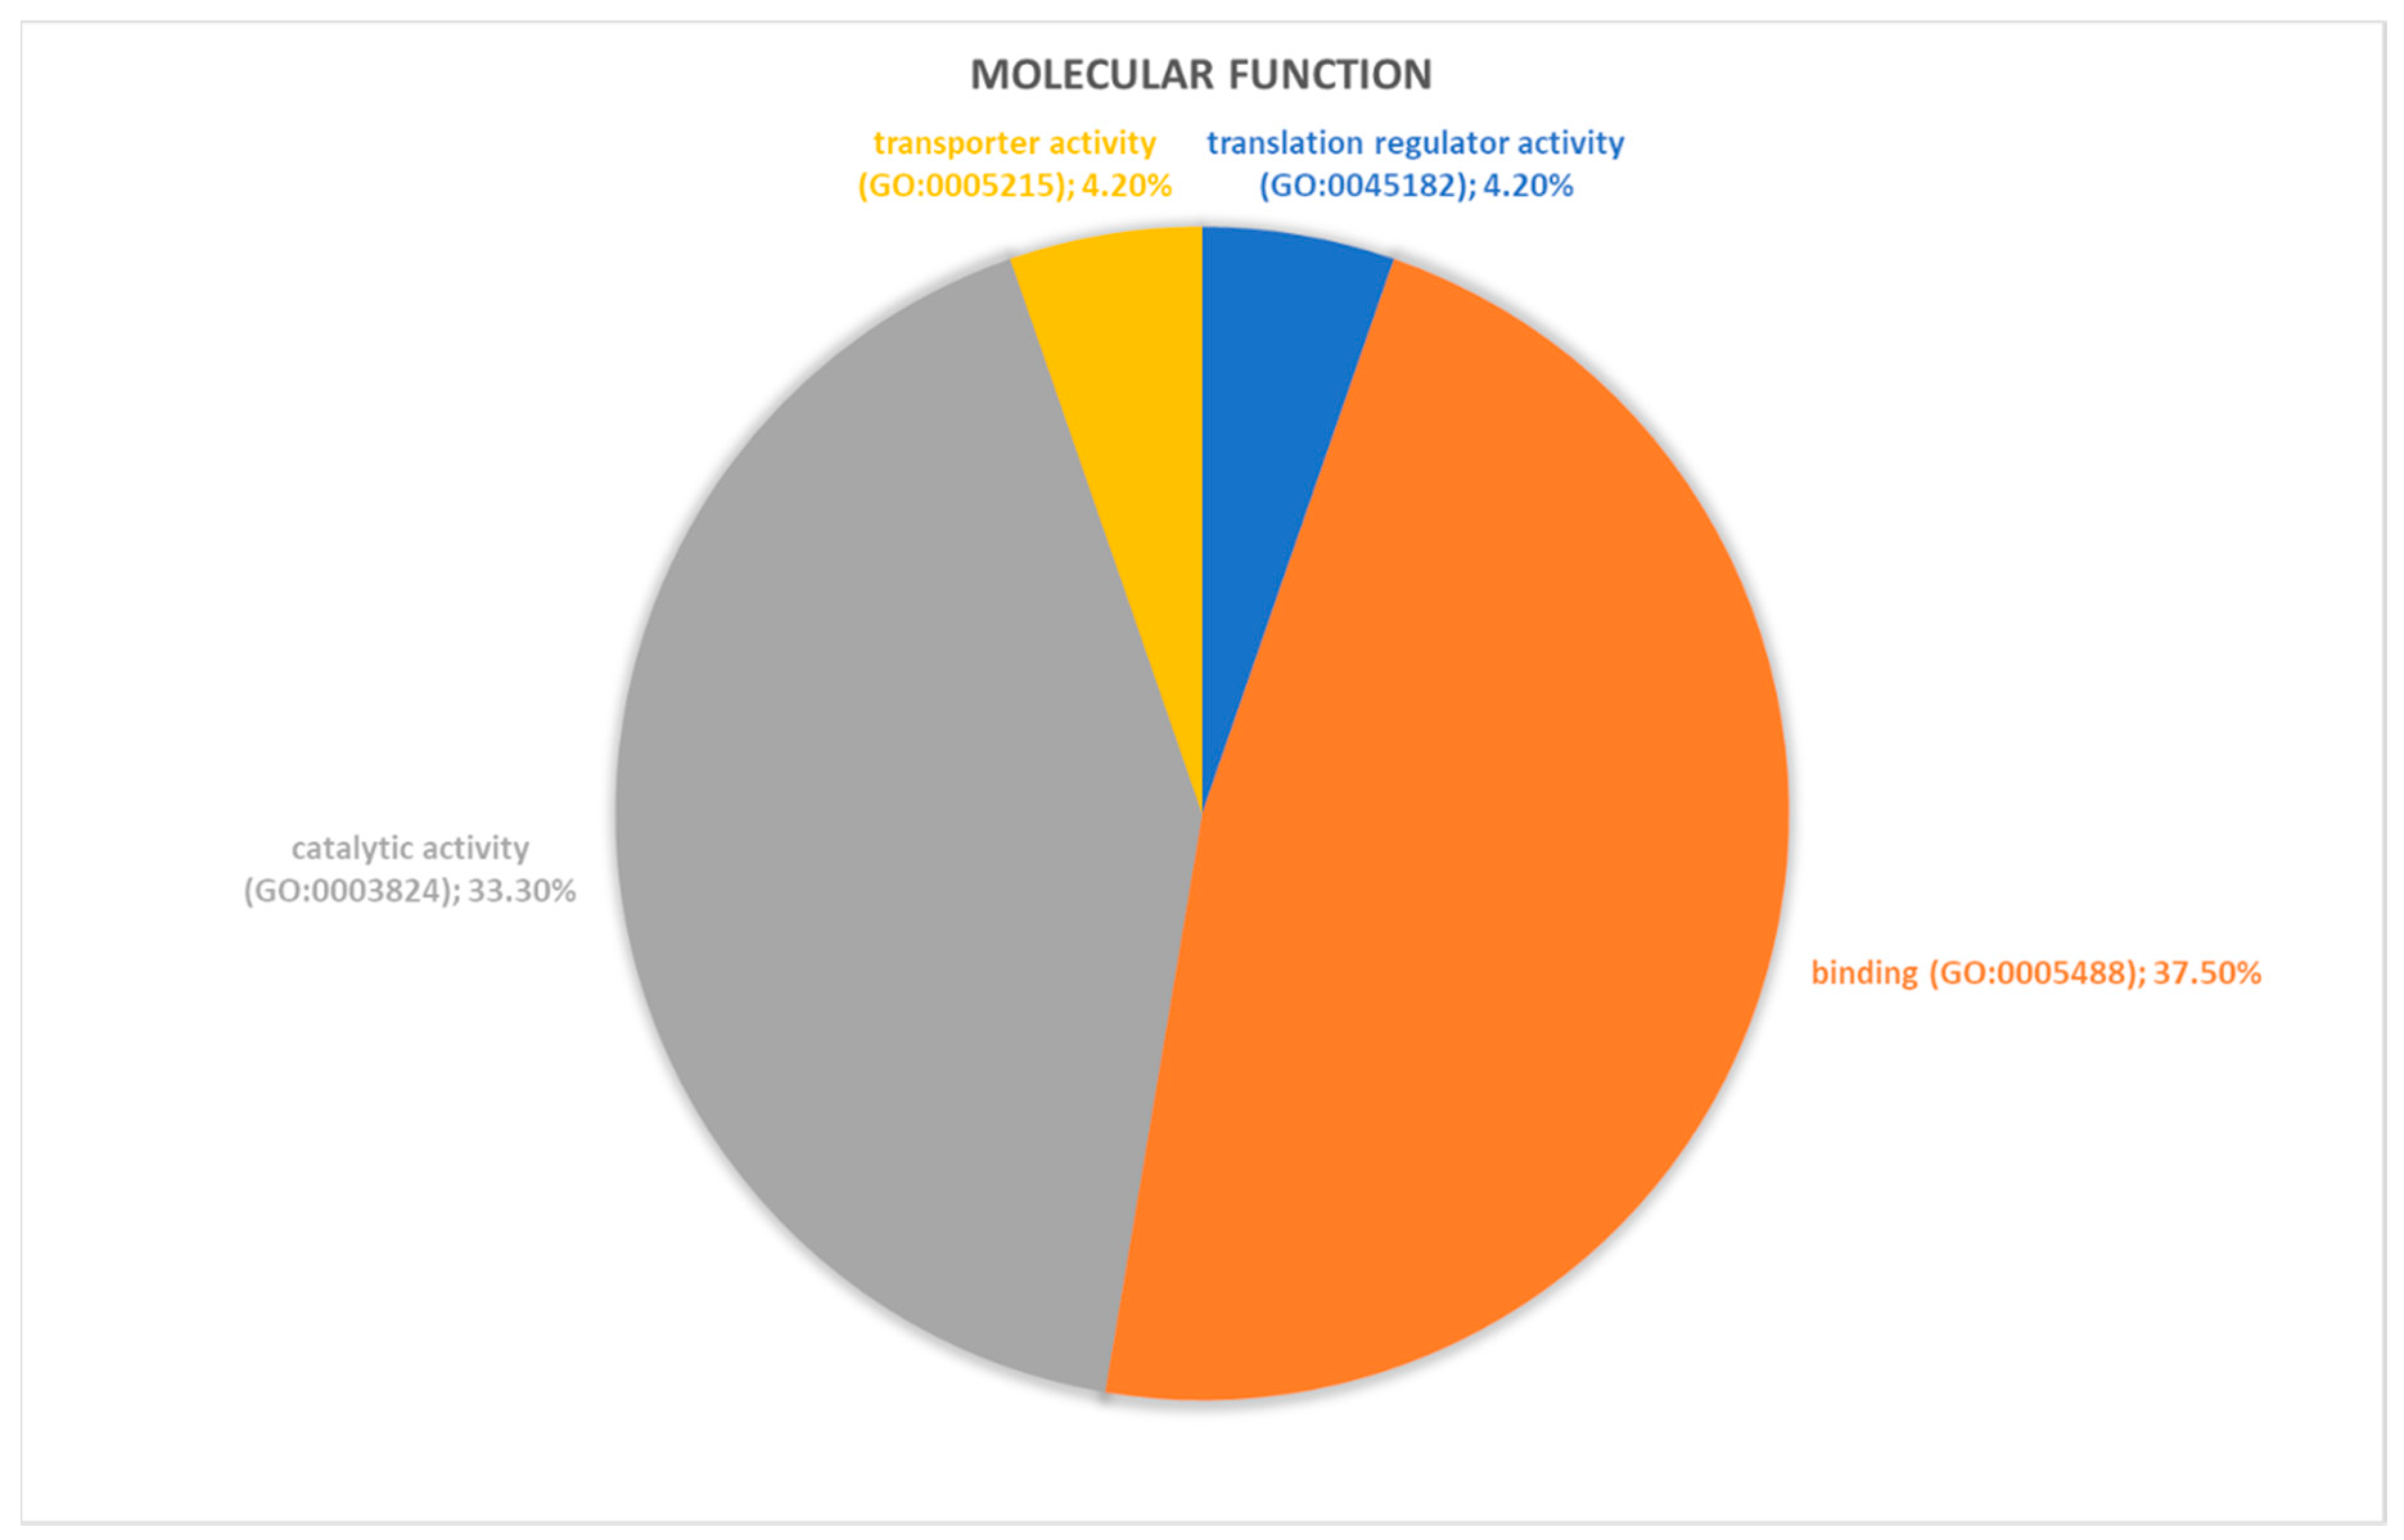
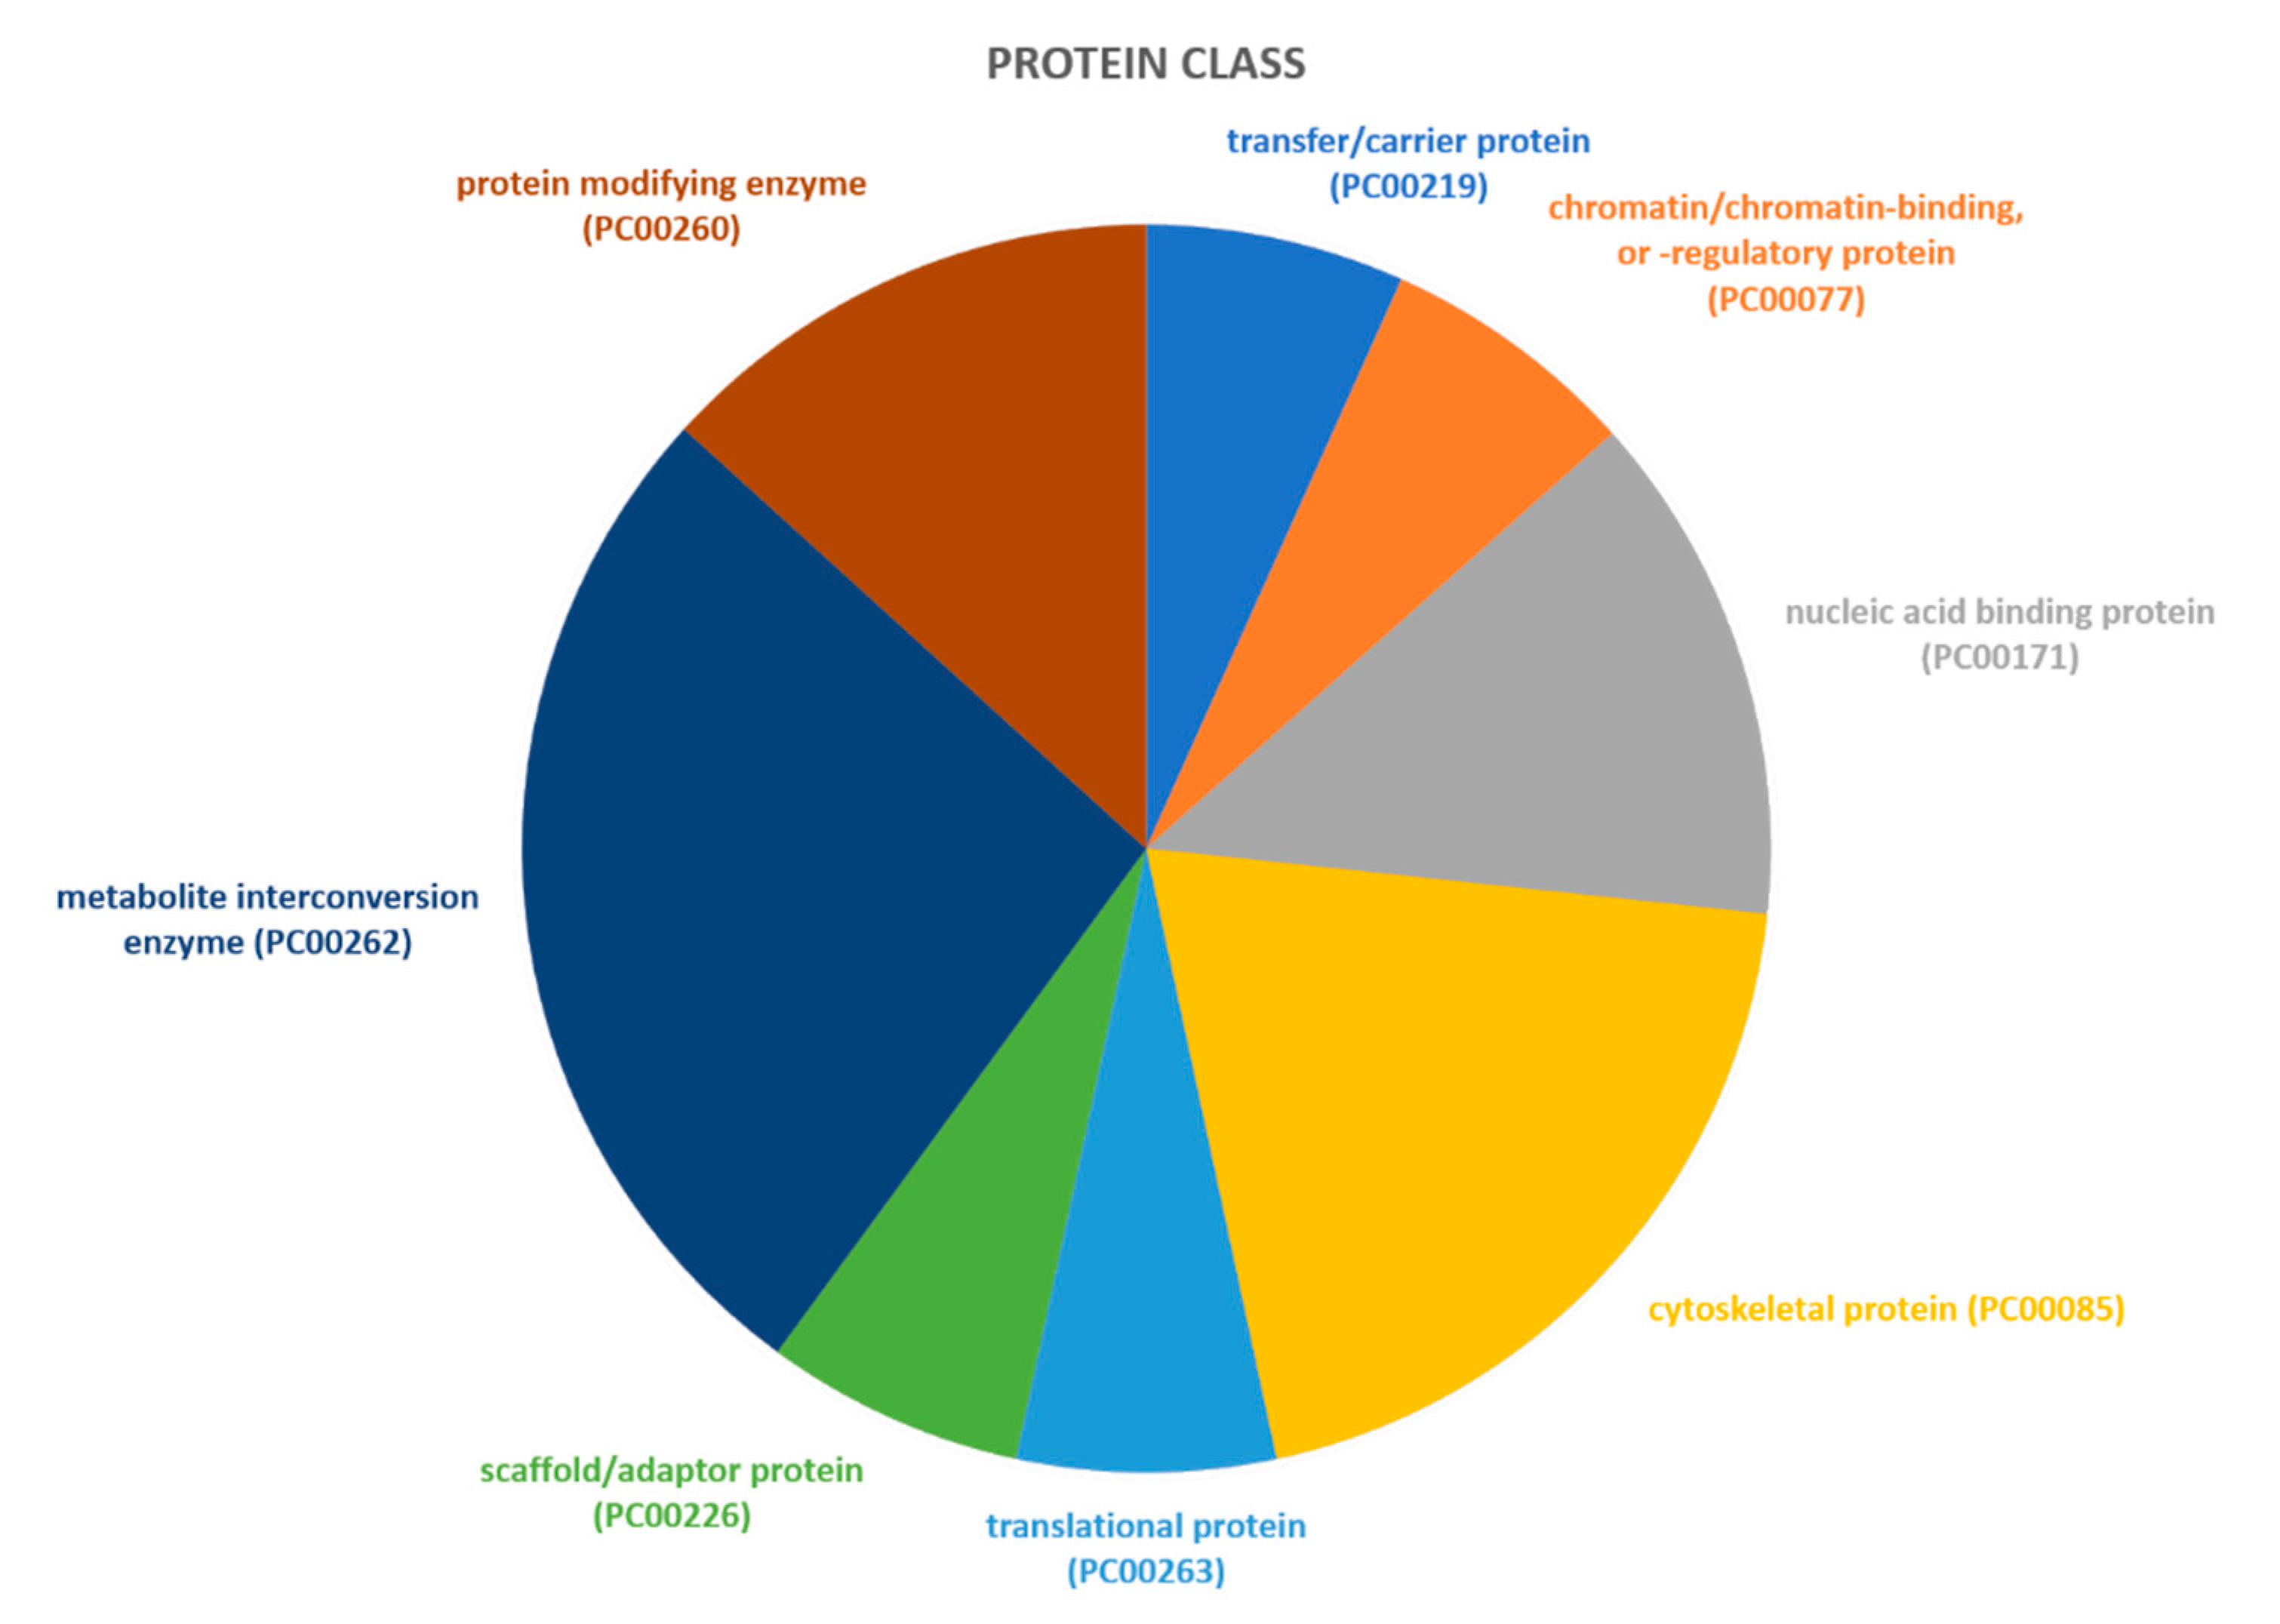
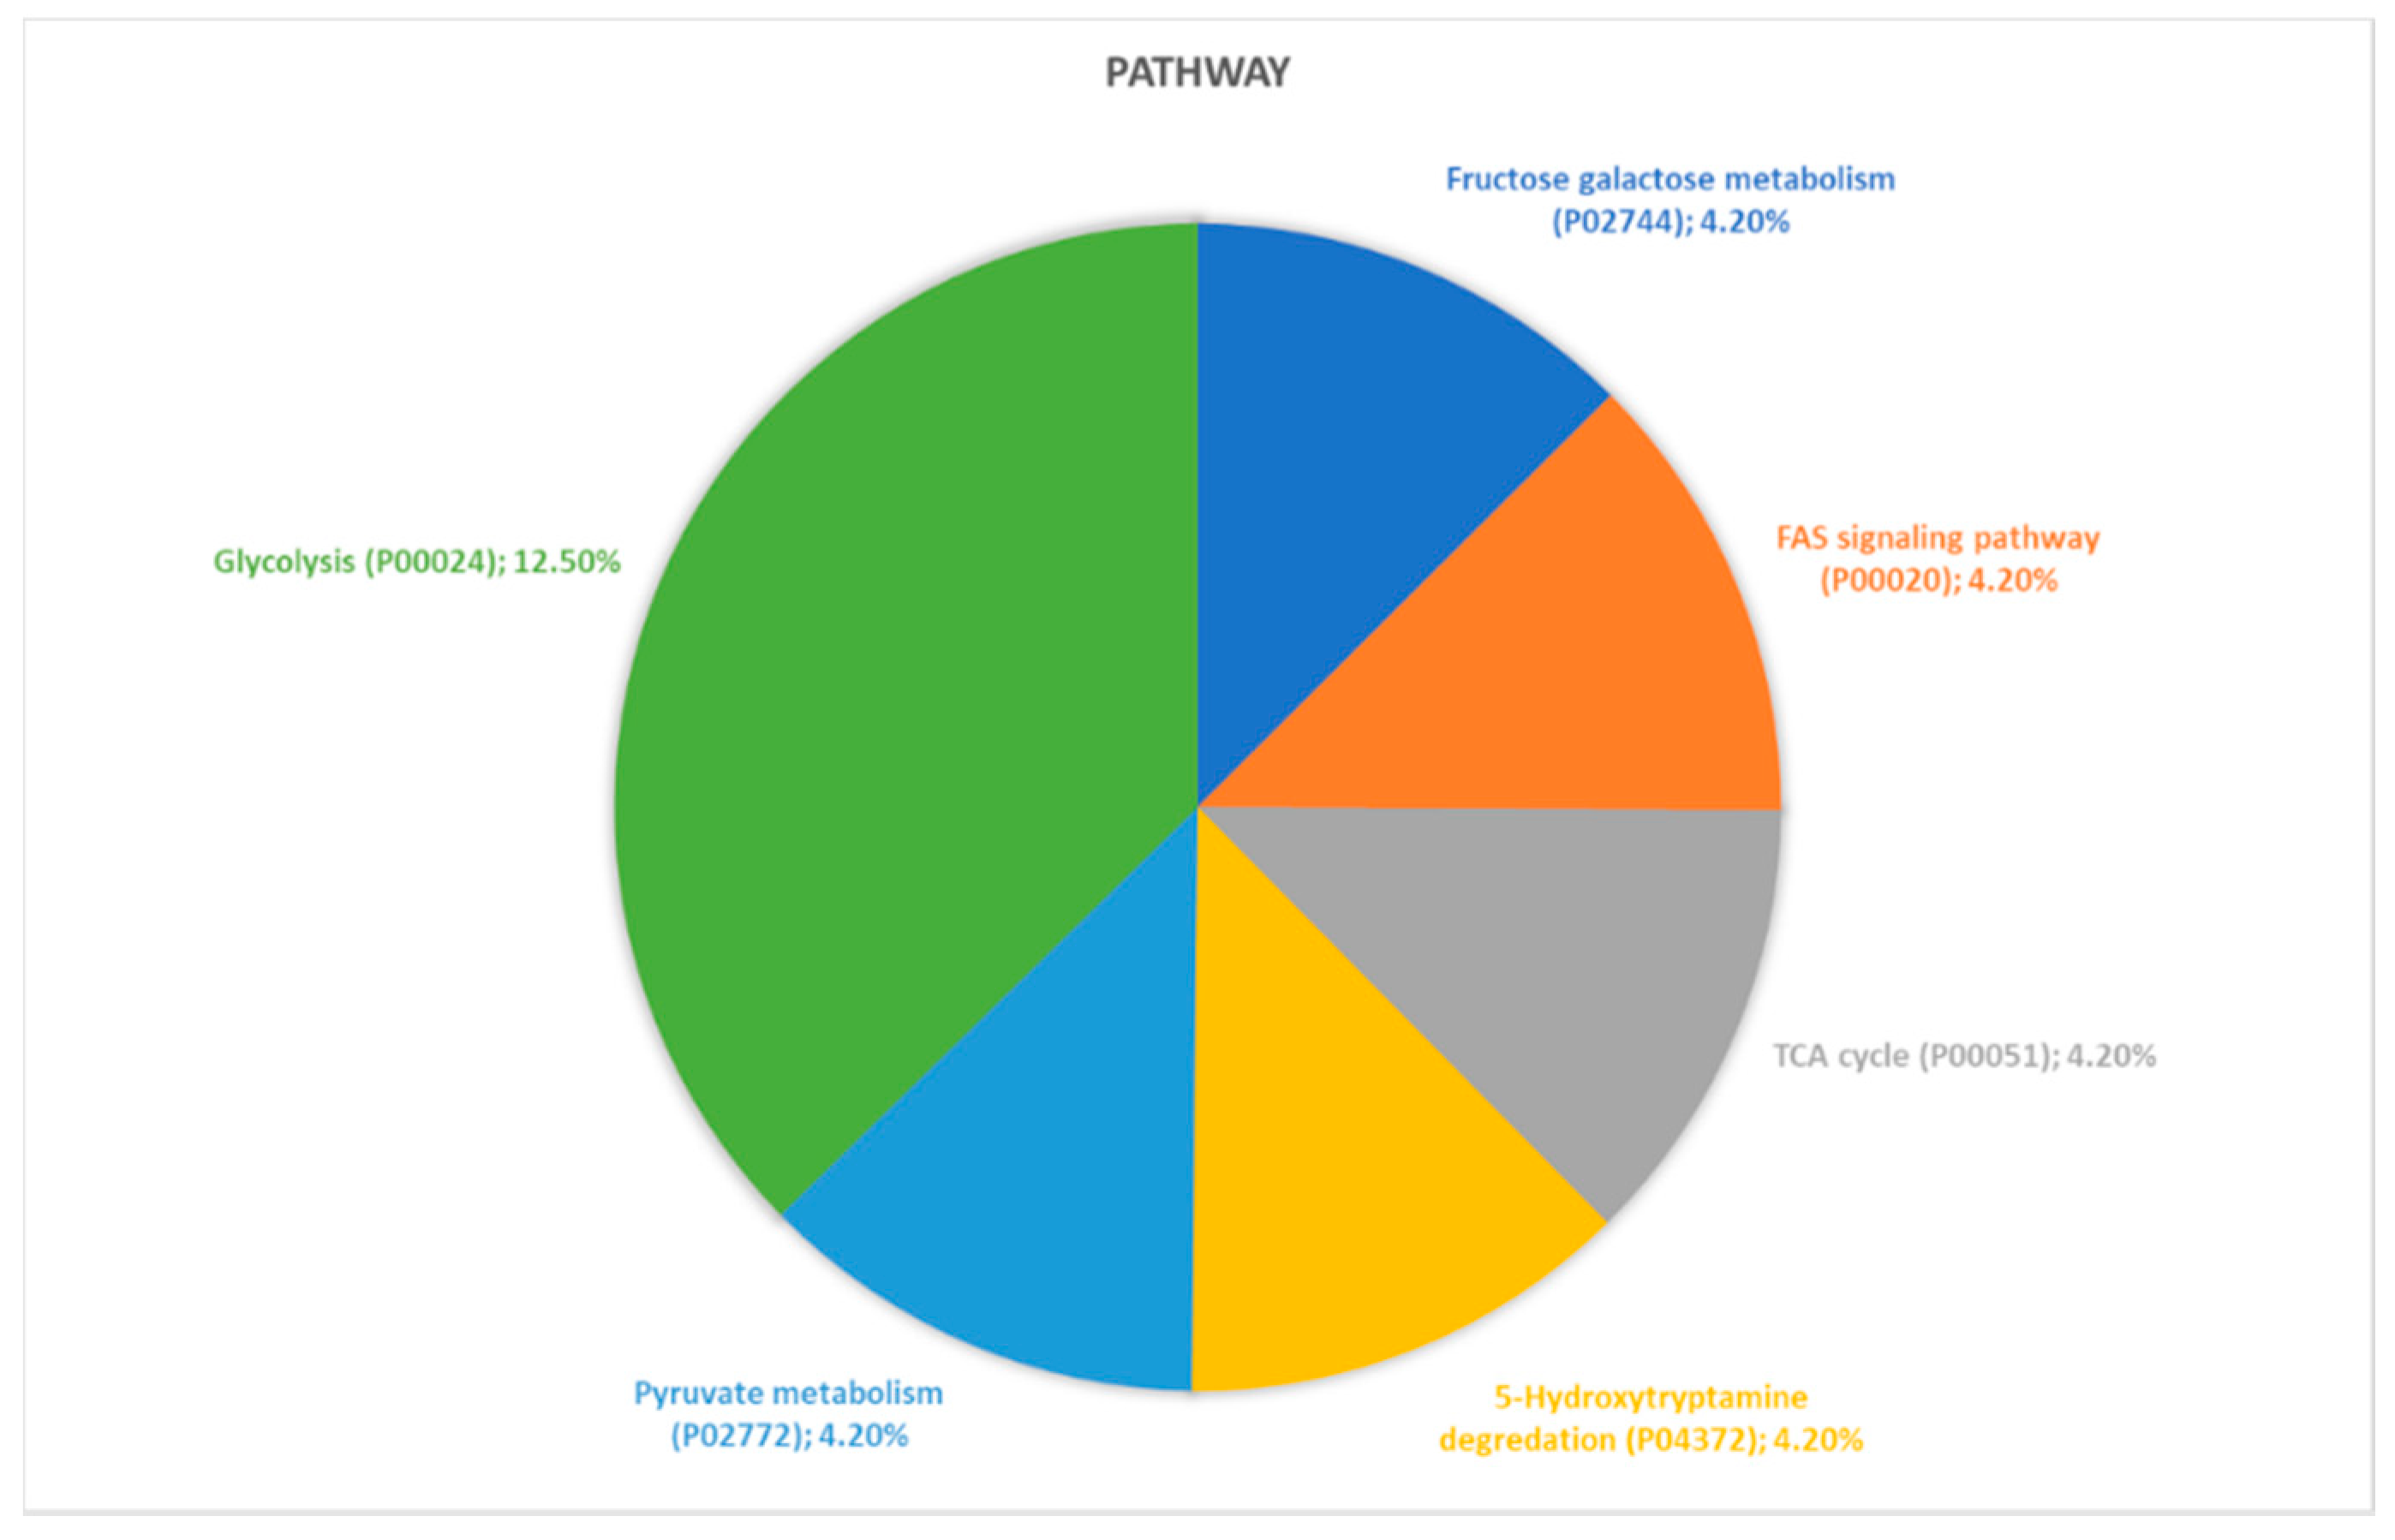
2.2. Identification of Pathways Involved in RAOM and ATH
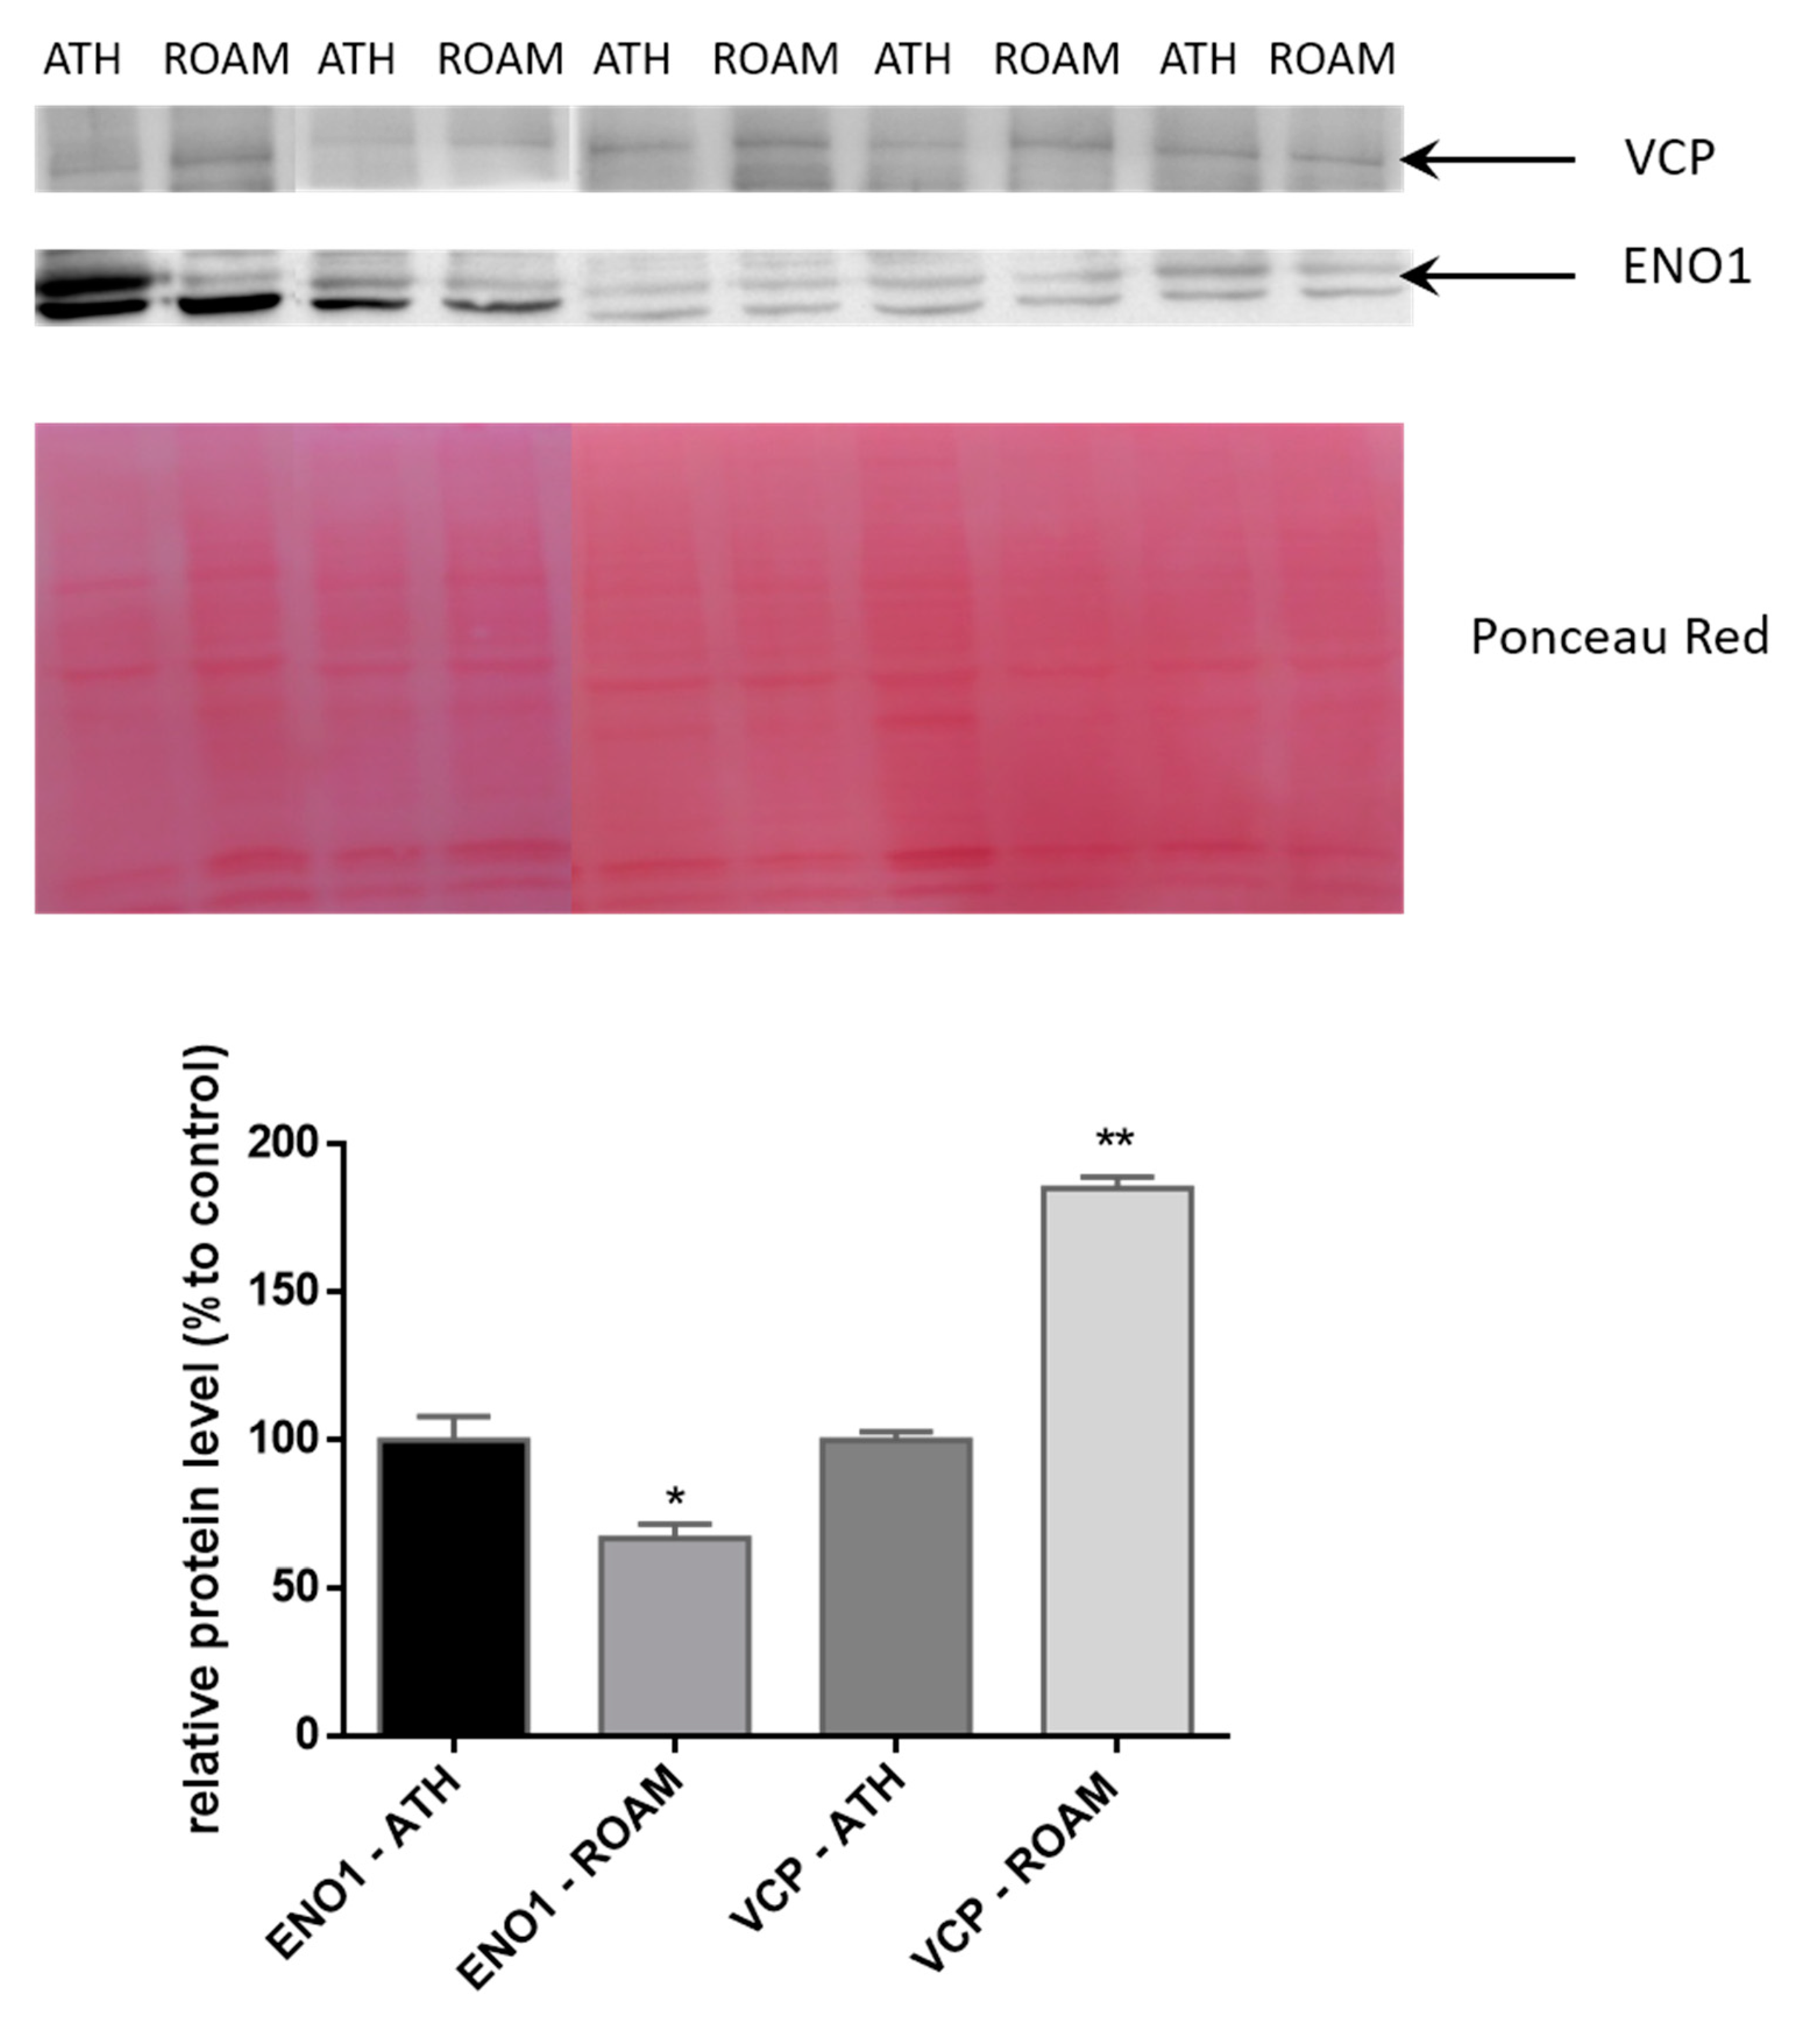
2.3. Western Blot Study of Differentially Modulated Proteins
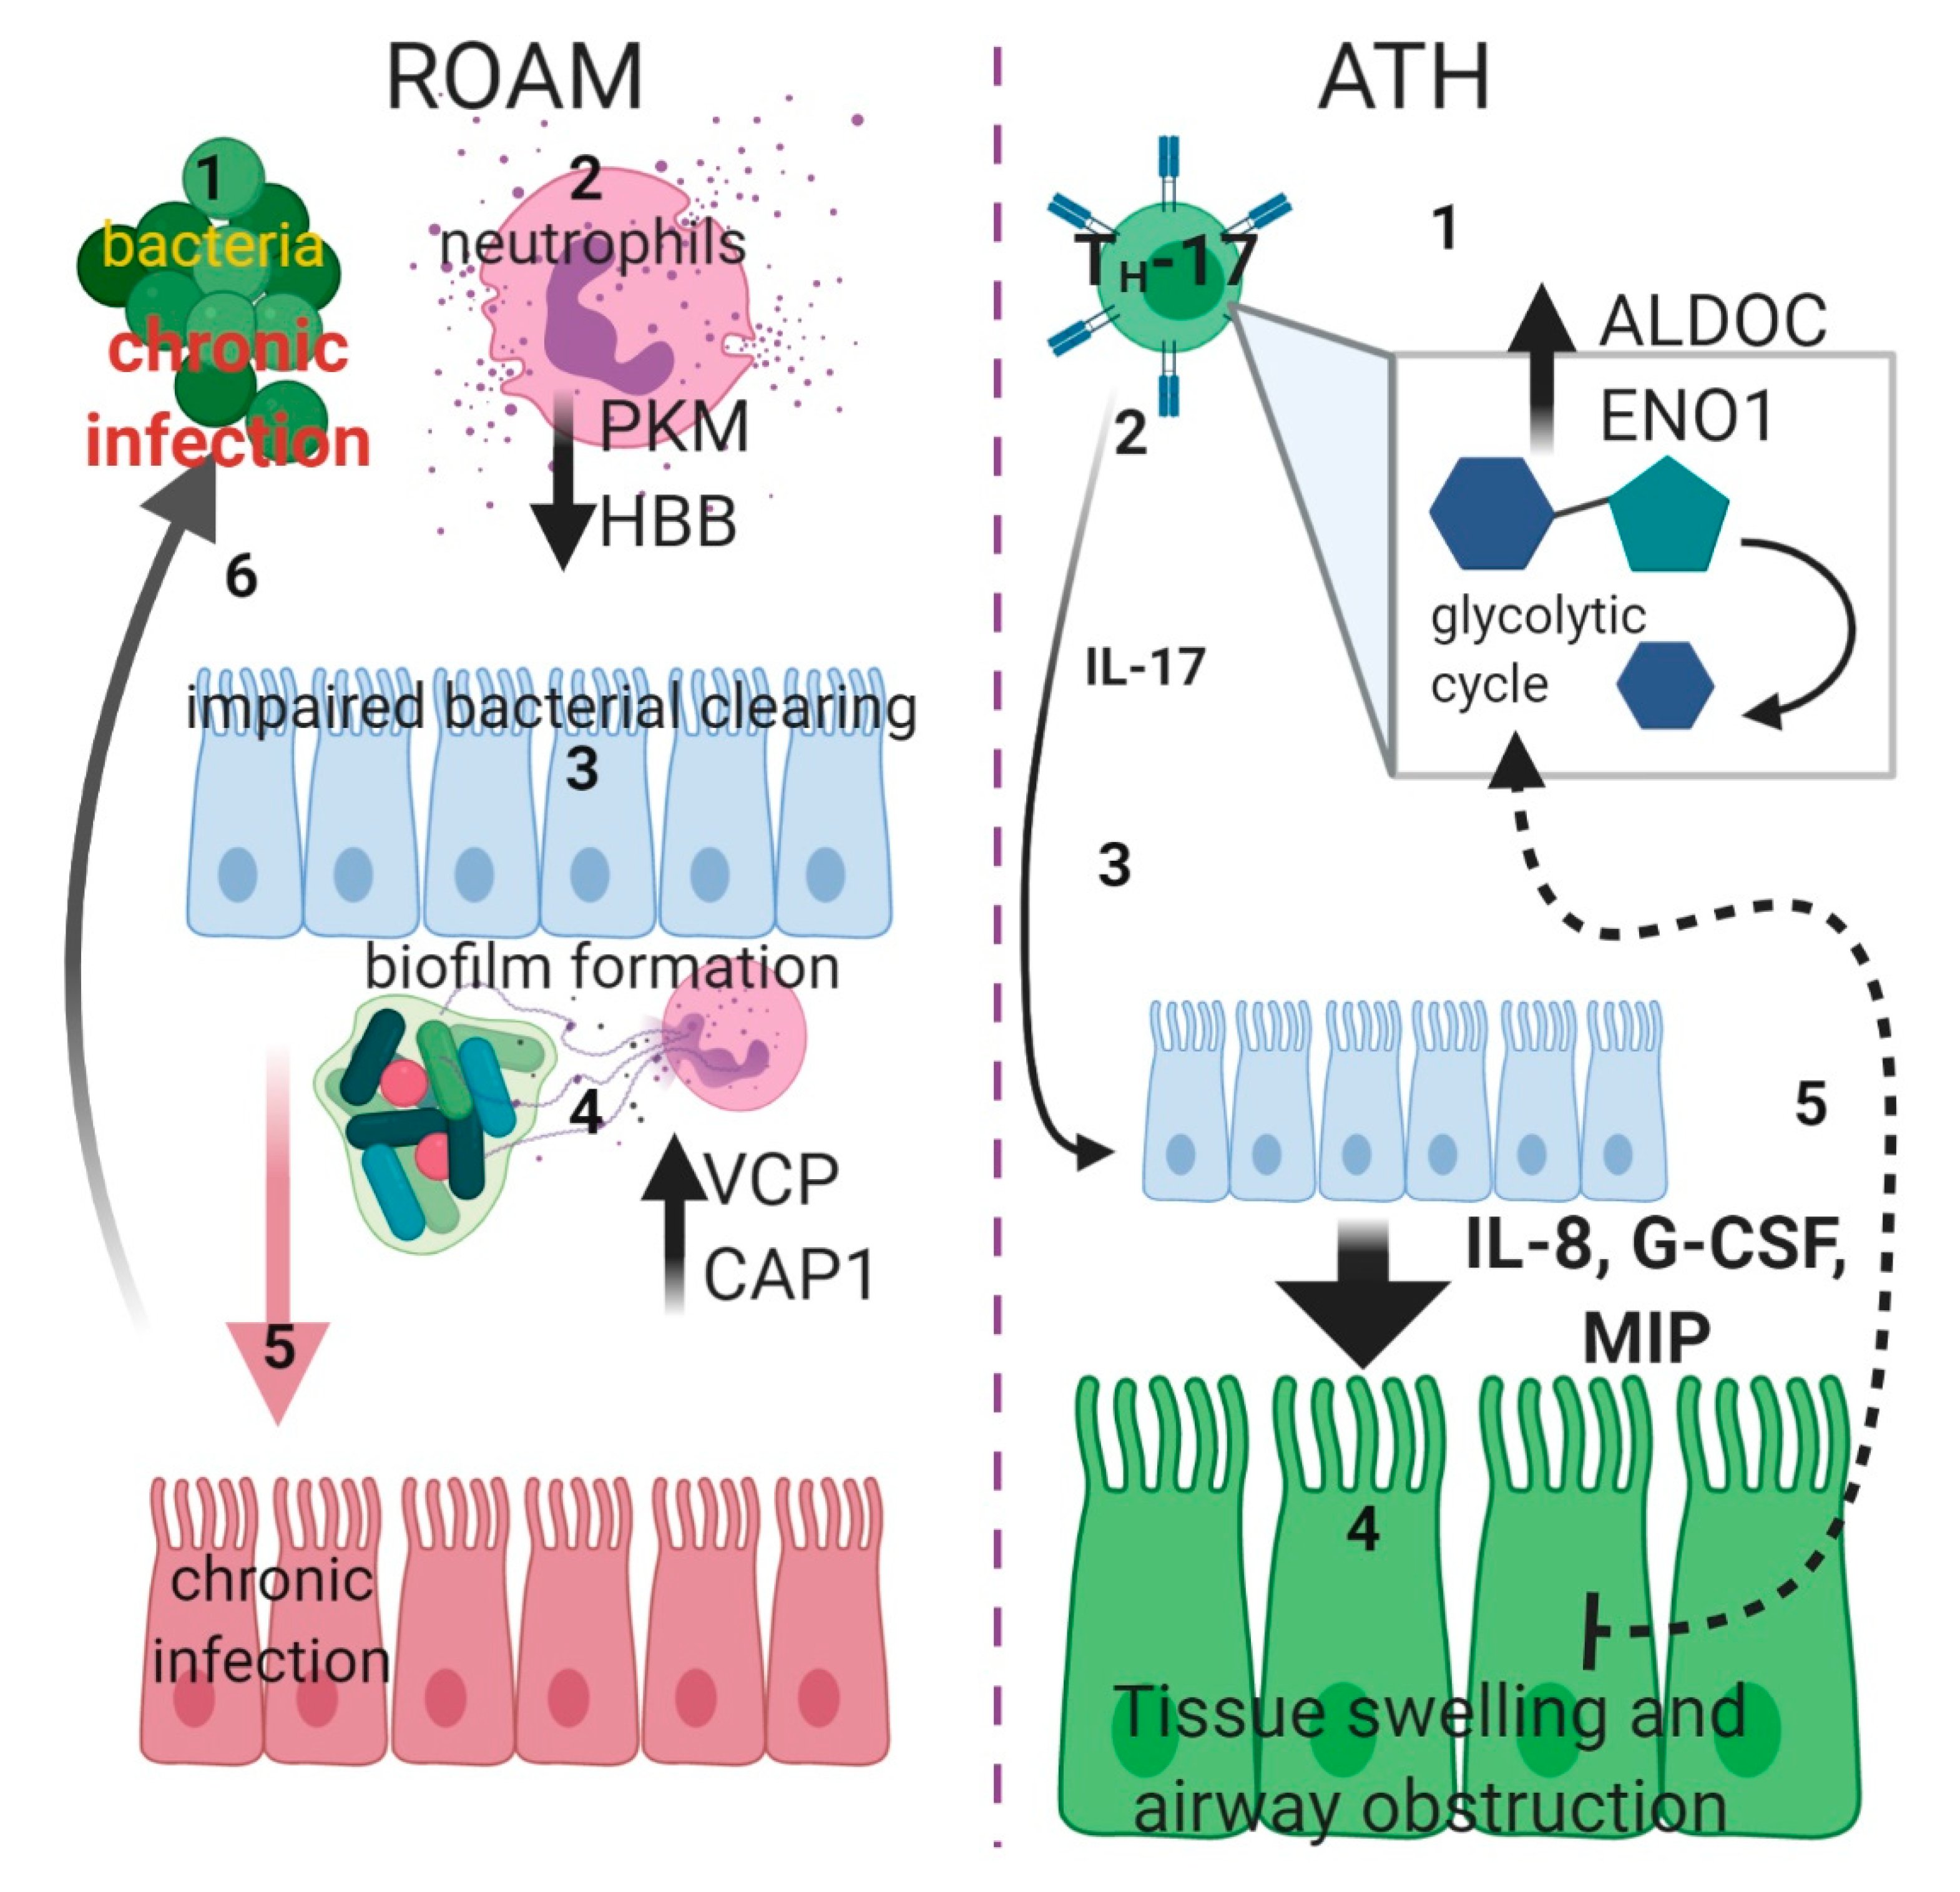
3. Discussion
4. Materials and Methods
4.1. Population Characteristics
4.2. 2-DE and Image Analysis
4.3. Quantification of Spot Levels
4.4. Trypsin Digestion and MS Analysis
4.5. Pathways Analysis
4.6. Western Blotting
4.7. Statistical Analysis
Supplementary Materials
Author Contributions
Funding
Acknowledgments
Conflicts of Interest
Abbreviations
| RAOM | Recurrent Acute Otitis Media |
| ATH | adenotonsillar hypertrophy |
| 2-DE | two-dimensional gel electrophoresis |
| MS | mass spectrometry |
| OSAS | obstructive sleep apnoea syndrome |
| IL-17A | interleukin-17A |
References
- Granath, A. Recurrent Acute Otitis Media: What Are the Options for Treatment and Prevention? Curr. Otorhinolaryngol. Rep. 2017, 5, 93–100. [Google Scholar] [CrossRef]
- Gaddey, H.L.; Wright, M.T.; Nelson, T.N. Otitis Media: Rapid Evidence Review. Am. Fam. Physician 2019, 100, 350–356. [Google Scholar] [PubMed]
- Teele, D.W.; Klein, J.O.; Rosner, B. Greater Boston Otitis Media Study Group Epidemiology of Otitis Media During the First Seven Years of Life in Children in Greater Boston: A Prospective, Cohort Study. J. Infect. Dis. 1989, 160, 83–94. [Google Scholar] [CrossRef]
- Kujala, T.; Alho, O.-P.; Kristo, A.; Uhari, M.; Renko, M.; Pokka, T.; Koivunen, P. Quality of Life after Surgery for Recurrent Otitis Media in a Randomized Controlled Trial. Pediatr. Infect. Dis. J. 2014, 33, 715–719. [Google Scholar] [CrossRef]
- Rosen, C.L. Obstructive Sleep Apnea Syndrome (OSAS) in Children: Diagnostic Challenges. Sleep 1996, 19, S274–S277. [Google Scholar] [CrossRef]
- Krzeski, A.; Burghard, M. Obstructive sleep disordered breathing in children—An important problem in the light of current European guidelines. Otolaryngol. Polska 2018, 72, 9–16. [Google Scholar] [CrossRef] [PubMed]
- Sadeghi-Shabestari, M.; Moghaddam, Y.J.; Ghaharri, H. Is there any correlation between allergy and adenotonsillar tissue hypertrophy? Int. J. Pediatr. Otorhinolaryngol. 2011, 75, 589–591. [Google Scholar] [CrossRef] [PubMed]
- Cho, K.-S.; Kim, S.H.; Hong, S.-L.; Lee, J.; Mun, S.J.; Roh, Y.E.; Kim, Y.M.; Kim, H.-Y. Local Atopy in Childhood Adenotonsillar Hypertrophy. Am. J. Rhinol. Allergy 2018, 32, 160–166. [Google Scholar] [CrossRef] [PubMed]
- Huang, C.-C.; Wu, P.-W.; Chen, C.-L.; Wang, C.-H.; Lee, T.-J.; Tsai, C.-N.; Chiu, C.-H. IL-17A expression in the adenoid tissue from children with sleep disordered breathing and its association with pneumococcal carriage. Sci. Rep. 2018, 8, 16770. [Google Scholar] [CrossRef] [PubMed]
- Ramakrishnan, R.K.; Al Heialy, S.; Hamid, Q. Role of IL-17 in asthma pathogenesis and its implications for the clinic. Expert Rev. Respir. Med. 2019, 13, 1057–1068. [Google Scholar] [CrossRef]
- Sakarya, E.U.; Muluk, N.B.; Sakalar, E.G.; Senturk, M.; Aricigil, M.; A Bafaqeeh, S.; Cingi, C. Use of intranasal corticosteroids in adenotonsillar hypertrophy. J. Laryngol. Otol. 2017, 131, 384–390. [Google Scholar] [CrossRef] [PubMed]
- Brockbank, J.C. Update on pathophysiology and treatment of childhood obstructive sleep apnea syndrome. Paediatr. Respir. Rev. 2017, 24, 21–23. [Google Scholar] [CrossRef] [PubMed]
- Duncan, R.D.; Prucka, S.; Wiatrak, B.J.; Smith, R.J.H.; Robin, N.H. Pediatric Otolaryngologists’ Use of Genetic Testing. Arch. Otolaryngol. Head Neck Surg. 2007, 133, 231. [Google Scholar] [CrossRef] [PubMed][Green Version]
- Peng, Y.; Zi, X.-X.; Tian, T.-F.; Lee, B.; Lum, J.; Tang, S.A.; Tan, K.S.; Qiu, Q.-H.; Ye, J.; Shi, L.; et al. Whole-transcriptome sequencing reveals heightened inflammation and defective host defence responses in chronic rhinosinusitis with nasal polyps. Eur. Respir. J. 2019, 54, 1900732. [Google Scholar] [CrossRef] [PubMed]
- Sande, C.J.; Mutunga, M.; Muteti, J.; Berkley, J.A.; Nokes, D.J.; Njunge, J. Untargeted analysis of the airway proteomes of children with respiratory infections using mass spectrometry based proteomics. Sci. Rep. 2018, 8, 1–9. [Google Scholar] [CrossRef]
- Xu, H.; Li, X.; Zheng, X.; Xia, Y.; Fu, Y.; Li, X.; Qian, Y.; Zou, J.; Zhao, A.; Guan, J.; et al. Pediatric Obstructive Sleep Apnea is Associated With Changes in the Oral Microbiome and Urinary Metabolomics Profile: A Pilot Study. J. Clin. Sleep Med. 2018, 14, 1559–1567. [Google Scholar] [CrossRef]
- Hafrén, L.; Kentala, E.; Jarvinen, T.M.; Leinonen, E.; Onkamo, P.; Kere, J.; Mattila, P.S. Genetic background and the risk of otitis media. Int. J. Pediatr. Otorhinolaryngol. 2012, 76, 41–44. [Google Scholar] [CrossRef]
- Giese, A.P.; Ali, S.; Isaiah, A.; Aziz, I.; Riazuddin, S.; Ahmed, Z.M. Genomics of Otitis Media (OM): Molecular Genetics Approaches to Characterize Disease Pathophysiology. Front. Genet. 2020, 11, 11. [Google Scholar] [CrossRef]
- Bhutta, M.F.; Lambie, J.; Hobson, L.; Williams, D.; Tyrer, H.E.; Nicholson, G.; Brown, S.D.; Brown, H.; Piccinelli, C.; Devailly, G.; et al. Transcript Analysis Reveals a Hypoxic Inflammatory Environment in Human Chronic Otitis Media With Effusion. Front. Genet. 2020, 10, 1327. [Google Scholar] [CrossRef]
- Val, S.; Poley, M.; Brown, K.; Choi, R.; Jeong, S.; Colberg-Poley, A.; Rose, M.C.; Panchapakesan, K.C.; Devaney, J.C.; Pérez-Losada, M.; et al. Proteomic Characterization of Middle Ear Fluid Confirms Neutrophil Extracellular Traps as a Predominant Innate Immune Response in Chronic Otitis Media. PLoS ONE 2016, 11, e0152865. [Google Scholar] [CrossRef]
- Conte, L.; Greco, M.; Toraldo, D.M.; Arigliani, M.; Maffia, M.; Benedetto, M.D. A review of the “OMICS” for management of patients with obstructive sleep apnoea. Acta Otorhinolaryngol. Ital. 2020, 40, 164–172. [Google Scholar] [CrossRef] [PubMed]
- Just, T.; Gafumbegete, E.; Gramberg, J.; Prüfer, I.; Mikkat, S.; Ringel, B.; Pau, H.W.; Glocker, M.O. Differential proteome analysis of tonsils from children with chronic tonsillitis or with hyperplasia reveals disease-associated protein expression differences. Anal. Bioanal. Chem. 2006, 384, 1134–1144. [Google Scholar] [CrossRef] [PubMed]
- Witko-Sarsat, V.; Rieu, P.; Descamps-Latscha, B.; Lesavre, P.; Halbwachs-Mecarelli, L. Neutrophils: Molecules, Functions and Pathophysiological Aspects. Lab. Investig. 2000, 80, 617–653. [Google Scholar] [CrossRef] [PubMed]
- Uhlén, M.; Fagerberg, L.; Hallström, B.M.; Lindskog, C.; Oksvold, P.; Mardinoglu, A.; Sivertsson, Å.; Kampf, C.; Sjöstedt, E.; Asplund, A.; et al. Tissue-based map of the human proteome. Science 2015, 347, 1260419. [Google Scholar] [CrossRef] [PubMed]
- Seppanen, E.J.; Thornton, R.B.; Corscadden, K.J.; Granland, C.M.; Hibbert, J.; Fuery, A.; Wiertsema, S.P.; Vijayasekaran, S.; Coates, H.L.; Jacoby, P.; et al. High concentrations of middle ear antimicrobial peptides and proteins and proinflammatory cytokines are associated with detection of middle ear pathogens in children with recurrent acute otitis media. PLoS ONE 2019, 14, e0227080. [Google Scholar] [CrossRef] [PubMed]
- Val, S.; Poley, M.; Anna, K.; Nino, G.; Brown, K.; Pérez-Losada, M.; Gordish-Dressman, H.; Preciado, D. Characterization of mucoid and serous middle ear effusions from patients with chronic otitis media: Implication of different biological mechanisms? Pediatr. Res. 2018, 84, 296–305. [Google Scholar] [CrossRef]
- Thiede, B.; Koehler, C.J.; Strozynski, M.; Treumann, A.; Stein, R.; Zimny-Arndt, U.; Schmid, M.; Jungblut, P.R. High Resolution Quantitative Proteomics of HeLa Cells Protein Species Using Stable Isotope Labeling with Amino Acids in Cell Culture(SILAC), Two-Dimensional Gel Electrophoresis(2DE) and Nano-Liquid Chromatograpohy Coupled to an LTQ-OrbitrapMass Spectrometer. Mol. Cell. Proteom. 2013, 12, 529–538. [Google Scholar] [CrossRef]
- Zhan, X.; Huang, Y.; Long, Y. Two-dimensional Gel Electrophoresis Coupled with Mass Spectrometry Methods for an Analysis of Human Pituitary Adenoma Tissue Proteome. J. Vis. Exp. 2018, 2, e56739. [Google Scholar] [CrossRef]
- Dosselli, R.; Grassl, J.; Boer, S.P.A.D.; Kratz, M.; Moran, J.; Boomsma, J.J.; Baer, B. Protein-Level Interactions as Mediators of Sexual Conflict in Ants. Mol. Cell. Proteom. 2019, 18, S34–S45. [Google Scholar] [CrossRef]
- Van Wijk, R.; Van Solinge, W.W. The energy-less red blood cell is lost: Erythrocyte enzyme abnormalities of glycolysis. Blood 2005, 106, 4034–4042. [Google Scholar] [CrossRef]
- Louis, M.; Punjabi, N.M. Effects of acute intermittent hypoxia on glucose metabolism in awake healthy volunteers. J. Appl. Physiol. 2009, 106, 1538–1544. [Google Scholar] [CrossRef] [PubMed]
- Ucar, Z.Z.; Taymaz, Z.; Erbaycu, A.E.; Kirakli, C.; Tuksavul, F.; Güçlü, S.Z. Nocturnal Hypoxia and Arterial Lactate Levels in Sleep-Related Breathing Disorders. South. Med J. 2009, 102, 693–700. [Google Scholar] [CrossRef] [PubMed]
- Xu, H.; Zheng, X.; Qian, Y.; Guan, J.; Yi, H.; Zou, J.; Wang, Y.; Meng, L.; Zhao, A.; Yin, S.; et al. Metabolomics Profiling for Obstructive Sleep Apnea and Simple Snorers. Sci. Rep. 2016, 6, 30958. [Google Scholar] [CrossRef]
- Li, M.; Li, X.; Lu, Y. Obstructive Sleep Apnea Syndrome and Metabolic Diseases. Endocrinology 2018, 159, 2670–2675. [Google Scholar] [CrossRef] [PubMed]
- Wright, H.L.; Moots, R.J.; Bucknall, R.C.; Edwards, S.W. Neutrophil function in inflammation and inflammatory diseases. Rheumatology 2010, 49, 1618–1631. [Google Scholar] [CrossRef]
- Skendros, P.; Mitroulis, I.; Ritis, K. Autophagy in Neutrophils: From Granulopoiesis to Neutrophil Extracellular Traps. Front. Cell Dev. Biol. 2018, 6, 6. [Google Scholar] [CrossRef]
- Juneau, R.A.; Pang, B.; Weimer, K.E.D.; Armbruster, C.E.; Swords, W.E. Nontypeable Haemophilus influenza Initiates Formation of Neutrophil Extracellular Traps. Infect. Immun. 2010, 79, 431–438. [Google Scholar] [CrossRef]
- Intakorn, P.; Sonsuwan, N.; Noknu, S.; Moungthong, G.; Pirçon, J.-Y.; Liu, Y.; Van Dyke, M.K.; Hausdorff, W.P. Haemophilus influenzae type b as an important cause of culture-positive acute otitis media in young children in Thailand: A tympanocentesis-based, multi-center, cross-sectional study. BMC Pediatr. 2014, 14, 157. [Google Scholar] [CrossRef]
- Dirain, C.O.; Silva, R.C.; Collins, W.O.; Antonelli, P.J. The Adenoid Microbiome in Recurrent Acute Otitis Media and Obstructive Sleep Apnea. J. Int. Adv. Otol. 2017, 13, 333–339. [Google Scholar] [CrossRef]
- Pashevin, D.O.; Nagibin, V.S.; Tumanovska, L.V.; Moibenko, A.A.; Dosenko, V.E. Proteasome Inhibition Diminishes the Formation of Neutrophil Extracellular Traps and Prevents the Death of Cardiomyocytes in Coculture with Activated Neutrophils during Anoxia-Reoxygenation. Pathobiology 2015, 82, 290–298. [Google Scholar] [CrossRef]
- Mizrahi, A.; Cohen, R.; Varon, E.; Bonacorsi, S.; Béchet, S.; Poyart, C.; Levy, C.; Raymond, J. Non typable-Haemophilus influenzae biofilm formation and acute otitis media. BMC Infect. Dis. 2014, 14, 400. [Google Scholar] [CrossRef] [PubMed]
- Shen, H.; Shi, L.Z. Metabolic regulation of TH17 cells. Mol. Immunol. 2019, 109, 81–87. [Google Scholar] [CrossRef] [PubMed]
- Potsic, W.P. Assessment and treatment of adenotonsillar hypertrophy in children. Am. J. Otolaryngol. 1992, 13, 259–264. [Google Scholar] [CrossRef]
- Zupin, L.; Celsi, F.; Bresciani, M.; Orzan, E.; Grasso, D.L.; Crovella, S. Human beta defensin-1 is involved in the susceptibility to adeno-tonsillar hypertrophy. Int. J. Pediatr. Otorhinolaryngol. 2018, 107, 135–139. [Google Scholar] [CrossRef] [PubMed]
- Ura, B.; Scrimin, F.; Franchin, C.; Arrigoni, G.; Licastro, D.; Monasta, L.; Ricci, G. Identification of proteins with different abundance associated with cell migration and proliferation in leiomyoma interstitial fluid by proteomics. Oncol. Lett. 2017, 13, 3912–3920. [Google Scholar] [CrossRef] [PubMed]
- Perez-Riverol, Y.; Csordas, A.; Bai, J.; Bernal-Llinares, M.; Hewapathirana, S.; Kundu, D.J.; Inuganti, A.; Griss, J.; Mayer, G.; Eisenacher, M.; et al. The PRIDE database and related tools and resources in 2019: Improving support for quantification data. Nucleic Acids Res. 2019, 47, D442–D450. [Google Scholar] [CrossRef] [PubMed]
- Thomas, P.D.; Muruganujan, A.; Ebert, D.; Huang, X.; Thomas, P.D. PANTHER version 14: More genomes, a new PANTHER GO-slim and improvements in enrichment analysis tools. Nucleic Acids Res. 2019, 47, D419–D426. [Google Scholar] [CrossRef]
- Huang da, W.; Sherman, B.T.; Lempicki, R.A. Systematic and integrative analysis of large gene lists using DAVID bioinformatics resources. Nat. Protoc. 2009, 4, 44–57. [Google Scholar] [CrossRef]
- Jassal, B.; Matthews, L.; Viteri, G.; Gong, C.; Lorente, P.; Fabregat, A.; Sidiropoulos, K.; Cook, J.; Gillespie, M.; Haw, R.; et al. The reactome pathway knowledgebase. Nucleic Acids Res. 2019, 48, D498–D503. [Google Scholar] [CrossRef]
- Handler, D.C.; Pascovici, D.; Mirzaei, M.; Gupta, V.; Salekdeh, G.H.; Haynes, P.A. The Art of Validating Quantitative Proteomics Data. Proteomics 2018, 18, e1800222. [Google Scholar] [CrossRef]


| Accession Number | Spot Number | Protein Description | Gene Symbol | Peptide Number | Protein Score | Fold Change * | Standard Deviation | p-Value |
|---|---|---|---|---|---|---|---|---|
| Q5HYB6 | 8 | Epididymis luminal protein 189 | DKFZp686J1372 | 9 | 558.97 | 6.3 | ±0.9 | 0.03 |
| P62333 | 21 | 26S proteasome regulatory subunit 10B | PSMC6 | 6 | 202.21 | 3.16 | ±0.47 | 0.016 |
| Q01518-2 | 35 | Isoform 2 of adenylyl cyclase-associated protein 1 | CAP1 | 11 | 357.54 | 2.6 | ±0.31 | 0.016 |
| P55072 | 29 | Transitional endoplasmic reticulum ATPase | VCP | 9 | 307.23 | 2.45 | ±0.44 | 0.04 |
| P05091-2 | 45 | Isoform 2 of aldehyde dehydrogenase, mitochondrial | ALDH2 | 7 | 323.91 | 1.75 | ±0.16 | 0.016 |
| Q99798 | 32 A (other spots not considered) | Aconitate hydratase, mitochondrial | ACO2 | 10 | 301.94 | 1.57 | ±0.28 | 0.016 |
| A0A2R8Y6G6 | 23 | Alpha-enolase | ENO1 | 12 | 755.18 | 0.63 | ±0.25 | 0.031 |
| P14618 | 38 | Pyruvate kinase PKM | PKM | 14 | 707.25 | 0.62 | ±0.22 | 0.031 |
| P31146 | 40 | Coronin-1A | CORO1A | 15 | 456.89 | 0.62 | ±0.13 | 0.032 |
| Q15365 | 20 | Poly(rC)-binding protein 1 | PCBP1 | 5 | 200.50 | 0.6 | ±0.04 | 0.022 |
| P40121-2 | 25 | Isoform 2 of Macrophage-capping protein | CAPG | 5 | 193.65 | 0.6 | ±0.07 | 0.033 |
| P08670 | 26 | Vimentin | VIM | 15 | 624.65 | 0.52 | ±0.08 | 0.015 |
| P31146 | 44 | Coronin-1A | CORO1A | 15 | 208.24 | 0.48 | ±0.11 | 0.032 |
| P68871 | 12 | Hemoglobin subunit beta | HBB | 4 | 250.80 | 0.43 | ±0.07 | 0.015 |
| O75368 | 2 | SH3 domain-binding glutamic acid-rich-like protein | SH3BGRL | 3 | 167.54 | 0.4 | ±0.65 | 0.03 |
| P81605 | 27 | Dermicidin | DCD | 3 | 77.39 | 0.39 | ±0.12 | 0.016 |
| A0A087WWT3 | 3 | Serum albumin | ALB | 3 | 0.36 | ±0.14 | 0.015 | |
| A8MVZ9 | 19 | Fructose-bisphosphate aldolase | ALDOC | 4 | 149.95 | 0.31 | ±0.07 | 0.045 |
| A0A0C4DG56 | 5 | Superoxide dismutase (Mn), mitochondrial | SOD2 | 3 | 125.89 | 0.3 | ±0.12 | 0.015 |
| P40121-2 | 1 | Isoform 2 of Macrophage-capping protein | CAPG | 5 | 193.65 | 0.3 | ±0.06 | 0.016 |
| A0A087WVQ9 | 4 | Elongation factor 1-alpha 1 | EEF1A1 | 3 | 90.64 | 0.15 | ±0.05 | 0.03 |
| P62805 | 42 | Histone H4 | H4C1 | 5 | 210.83 | 0.11 | ±0.04 | 0.03 |
| Q01105-2 | 11 | Isoform 2 of Protein SET | SET | 6 | 124.37 | 0.038 | ±0.01 | 0.03 |
| Term | Count | p-Value | FDR |
|---|---|---|---|
| hsa00010: Glycolysis/Gluconeogenesis | 4 | 2.3 × 10⁻⁴ | 6.8 × 10⁻³ |
| hsa01230: Biosynthesis of amino acids | 4 | 2.9 × 10⁻⁴ | 6.9 × 10⁻³ |
| hsa01130: Biosynthesis of antibiotics | 5 | 5.1 × 10⁻⁴ | 7.8 × 10⁻³ |
| hsa01200: Carbon metabolism | 4 | 0.001 | 0.013 |
| Pathway Name | Entities Found | Ratio | p-Value | FDR |
|---|---|---|---|---|
| Neutrophil degranulation | 7/480 | 0.023 | 9.40 × 10⁻⁵ | 0.06 |
| Glycolysis | 4/124 | 0.006 | 1.80 × 10⁻⁴ | 0.06 |
| Glucose metabolism | 4/197 | 0.009 | 0.001 | 0.226 |
| Hh mutants that don′t undergo autocatalytic processing are degraded by ERAD | 2/63 | 0.003 | 0.009 | 0.402 |
| Hh mutants abrogate ligand secretion | 2/67 | 0.003 | 0.01 | 0.402 |
| Chaperone Mediated Autophagy | 3/200 | 0.01 | 0.01 | 0.402 |
| HSF1 activation | 2/79 | 0.004 | 0.014 | 0.402 |
| Role of ABL in ROBO-SLIT signaling | 1/10 | 4.78 × 10⁻⁴ | 0.022 | 0.402 |
| Late endosomal microautophagy | 2/109 | 0.005 | 0.025 | 0.402 |
| Post-translational protein phosphorylation | 2/109 | 0.005 | 0.025 | 0.402 |
Publisher’s Note: MDPI stays neutral with regard to jurisdictional claims in published maps and institutional affiliations. |
© 2020 by the authors. Licensee MDPI, Basel, Switzerland. This article is an open access article distributed under the terms and conditions of the Creative Commons Attribution (CC BY) license (http://creativecommons.org/licenses/by/4.0/).
Share and Cite
Ura, B.; Celsi, F.; Zupin, L.; Arrigoni, G.; Battisti, I.; Gaita, B.; Grasso, D.L.; Orzan, E.; Sagredini, R.; Barbi, E.; et al. Proteomic Study Identifies Glycolytic and Inflammation Pathways Involved in Recurrent Otitis Media. Int. J. Mol. Sci. 2020, 21, 9291. https://doi.org/10.3390/ijms21239291
Ura B, Celsi F, Zupin L, Arrigoni G, Battisti I, Gaita B, Grasso DL, Orzan E, Sagredini R, Barbi E, et al. Proteomic Study Identifies Glycolytic and Inflammation Pathways Involved in Recurrent Otitis Media. International Journal of Molecular Sciences. 2020; 21(23):9291. https://doi.org/10.3390/ijms21239291
Chicago/Turabian StyleUra, Blendi, Fulvio Celsi, Luisa Zupin, Giorgio Arrigoni, Ilaria Battisti, Bartolomea Gaita, Domenico Leonardo Grasso, Eva Orzan, Raffaella Sagredini, Egidio Barbi, and et al. 2020. "Proteomic Study Identifies Glycolytic and Inflammation Pathways Involved in Recurrent Otitis Media" International Journal of Molecular Sciences 21, no. 23: 9291. https://doi.org/10.3390/ijms21239291
APA StyleUra, B., Celsi, F., Zupin, L., Arrigoni, G., Battisti, I., Gaita, B., Grasso, D. L., Orzan, E., Sagredini, R., Barbi, E., & Crovella, S. (2020). Proteomic Study Identifies Glycolytic and Inflammation Pathways Involved in Recurrent Otitis Media. International Journal of Molecular Sciences, 21(23), 9291. https://doi.org/10.3390/ijms21239291