Early Transcriptomic Response to OxLDL in Human Retinal Pigment Epithelial Cells


Abstract
1. Introduction
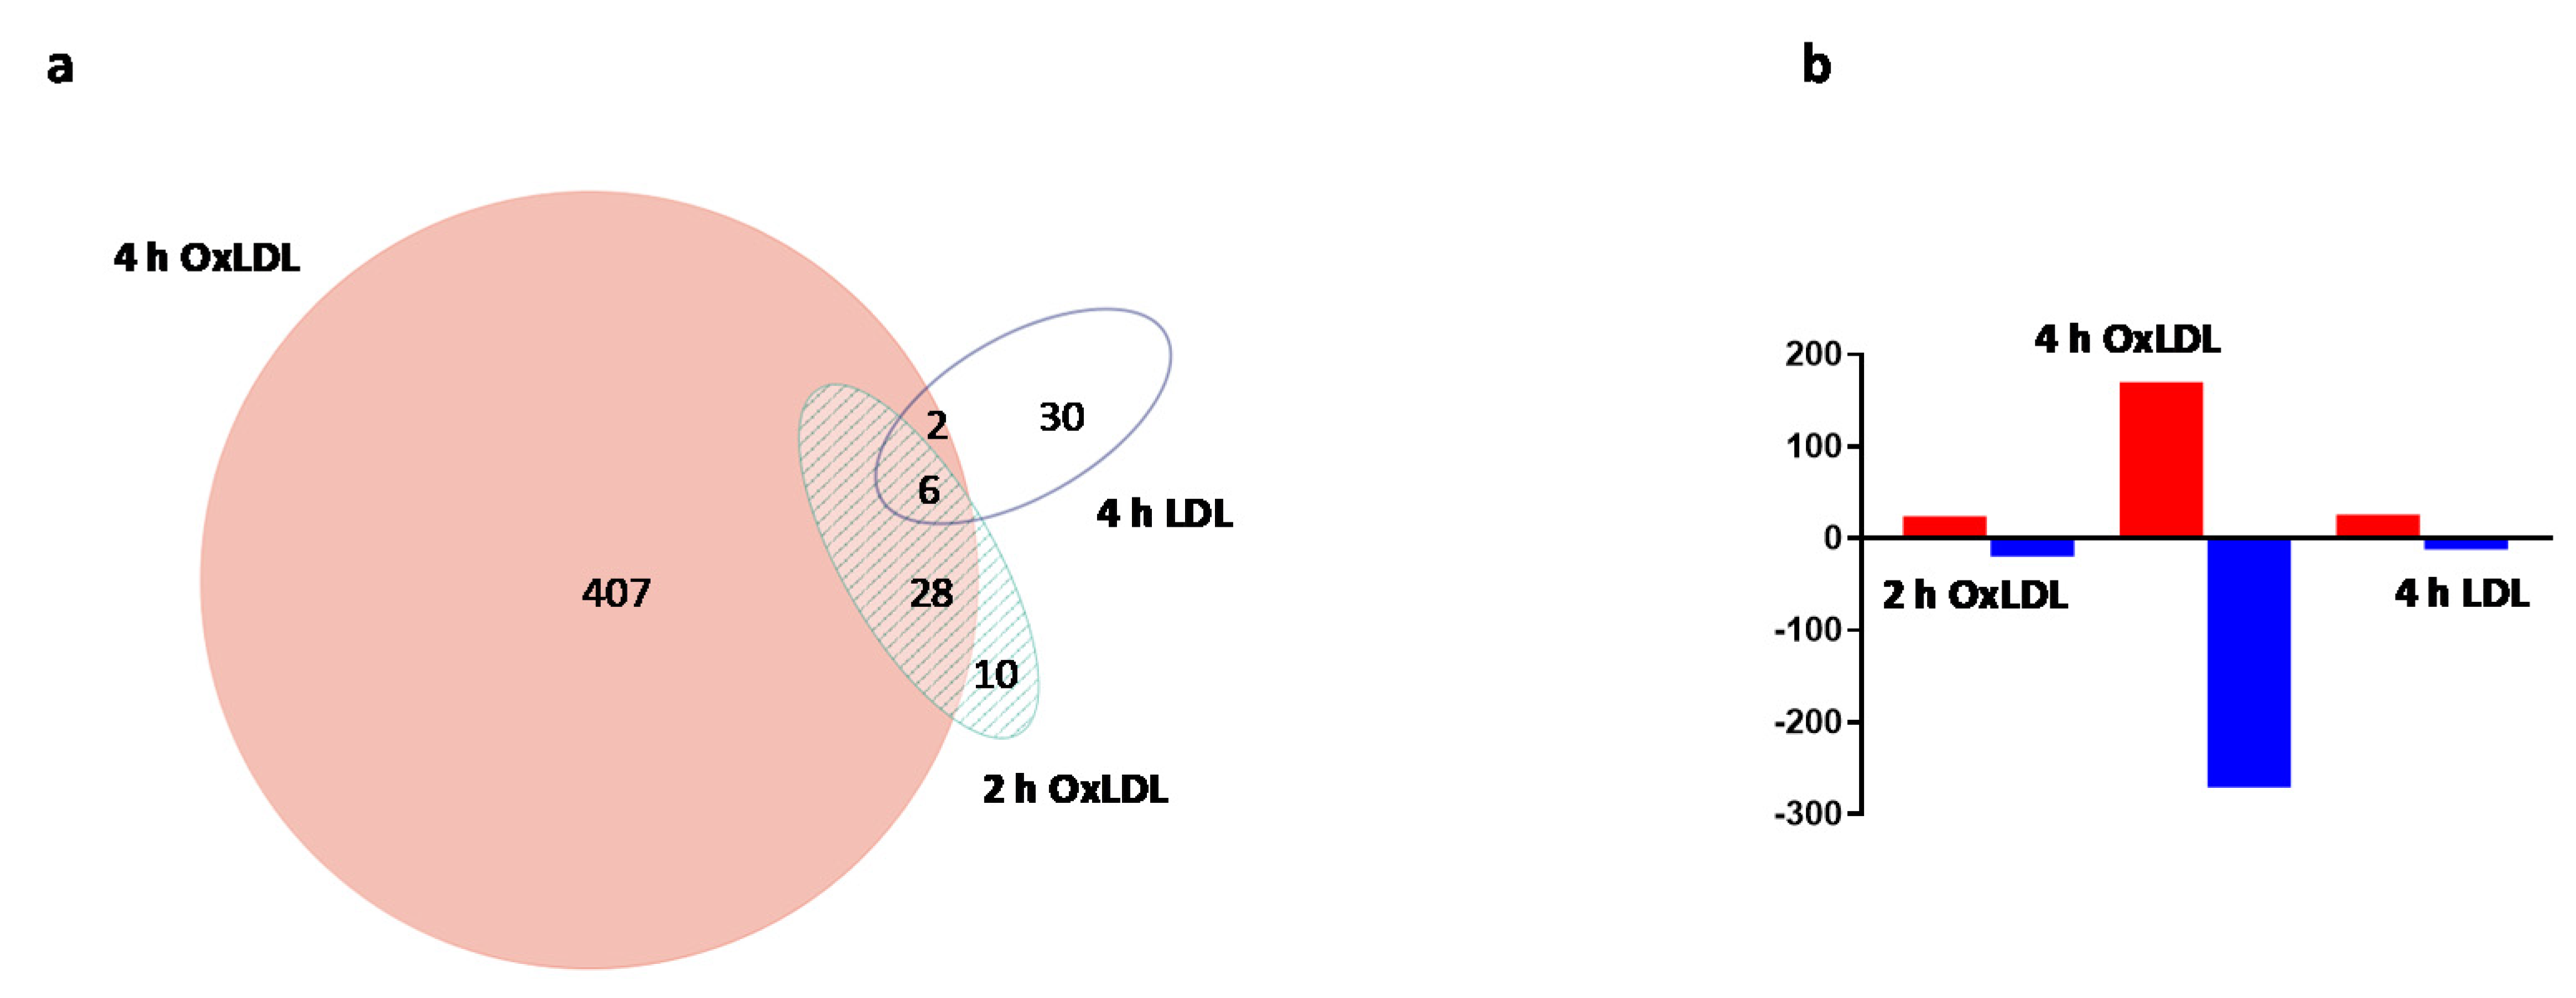
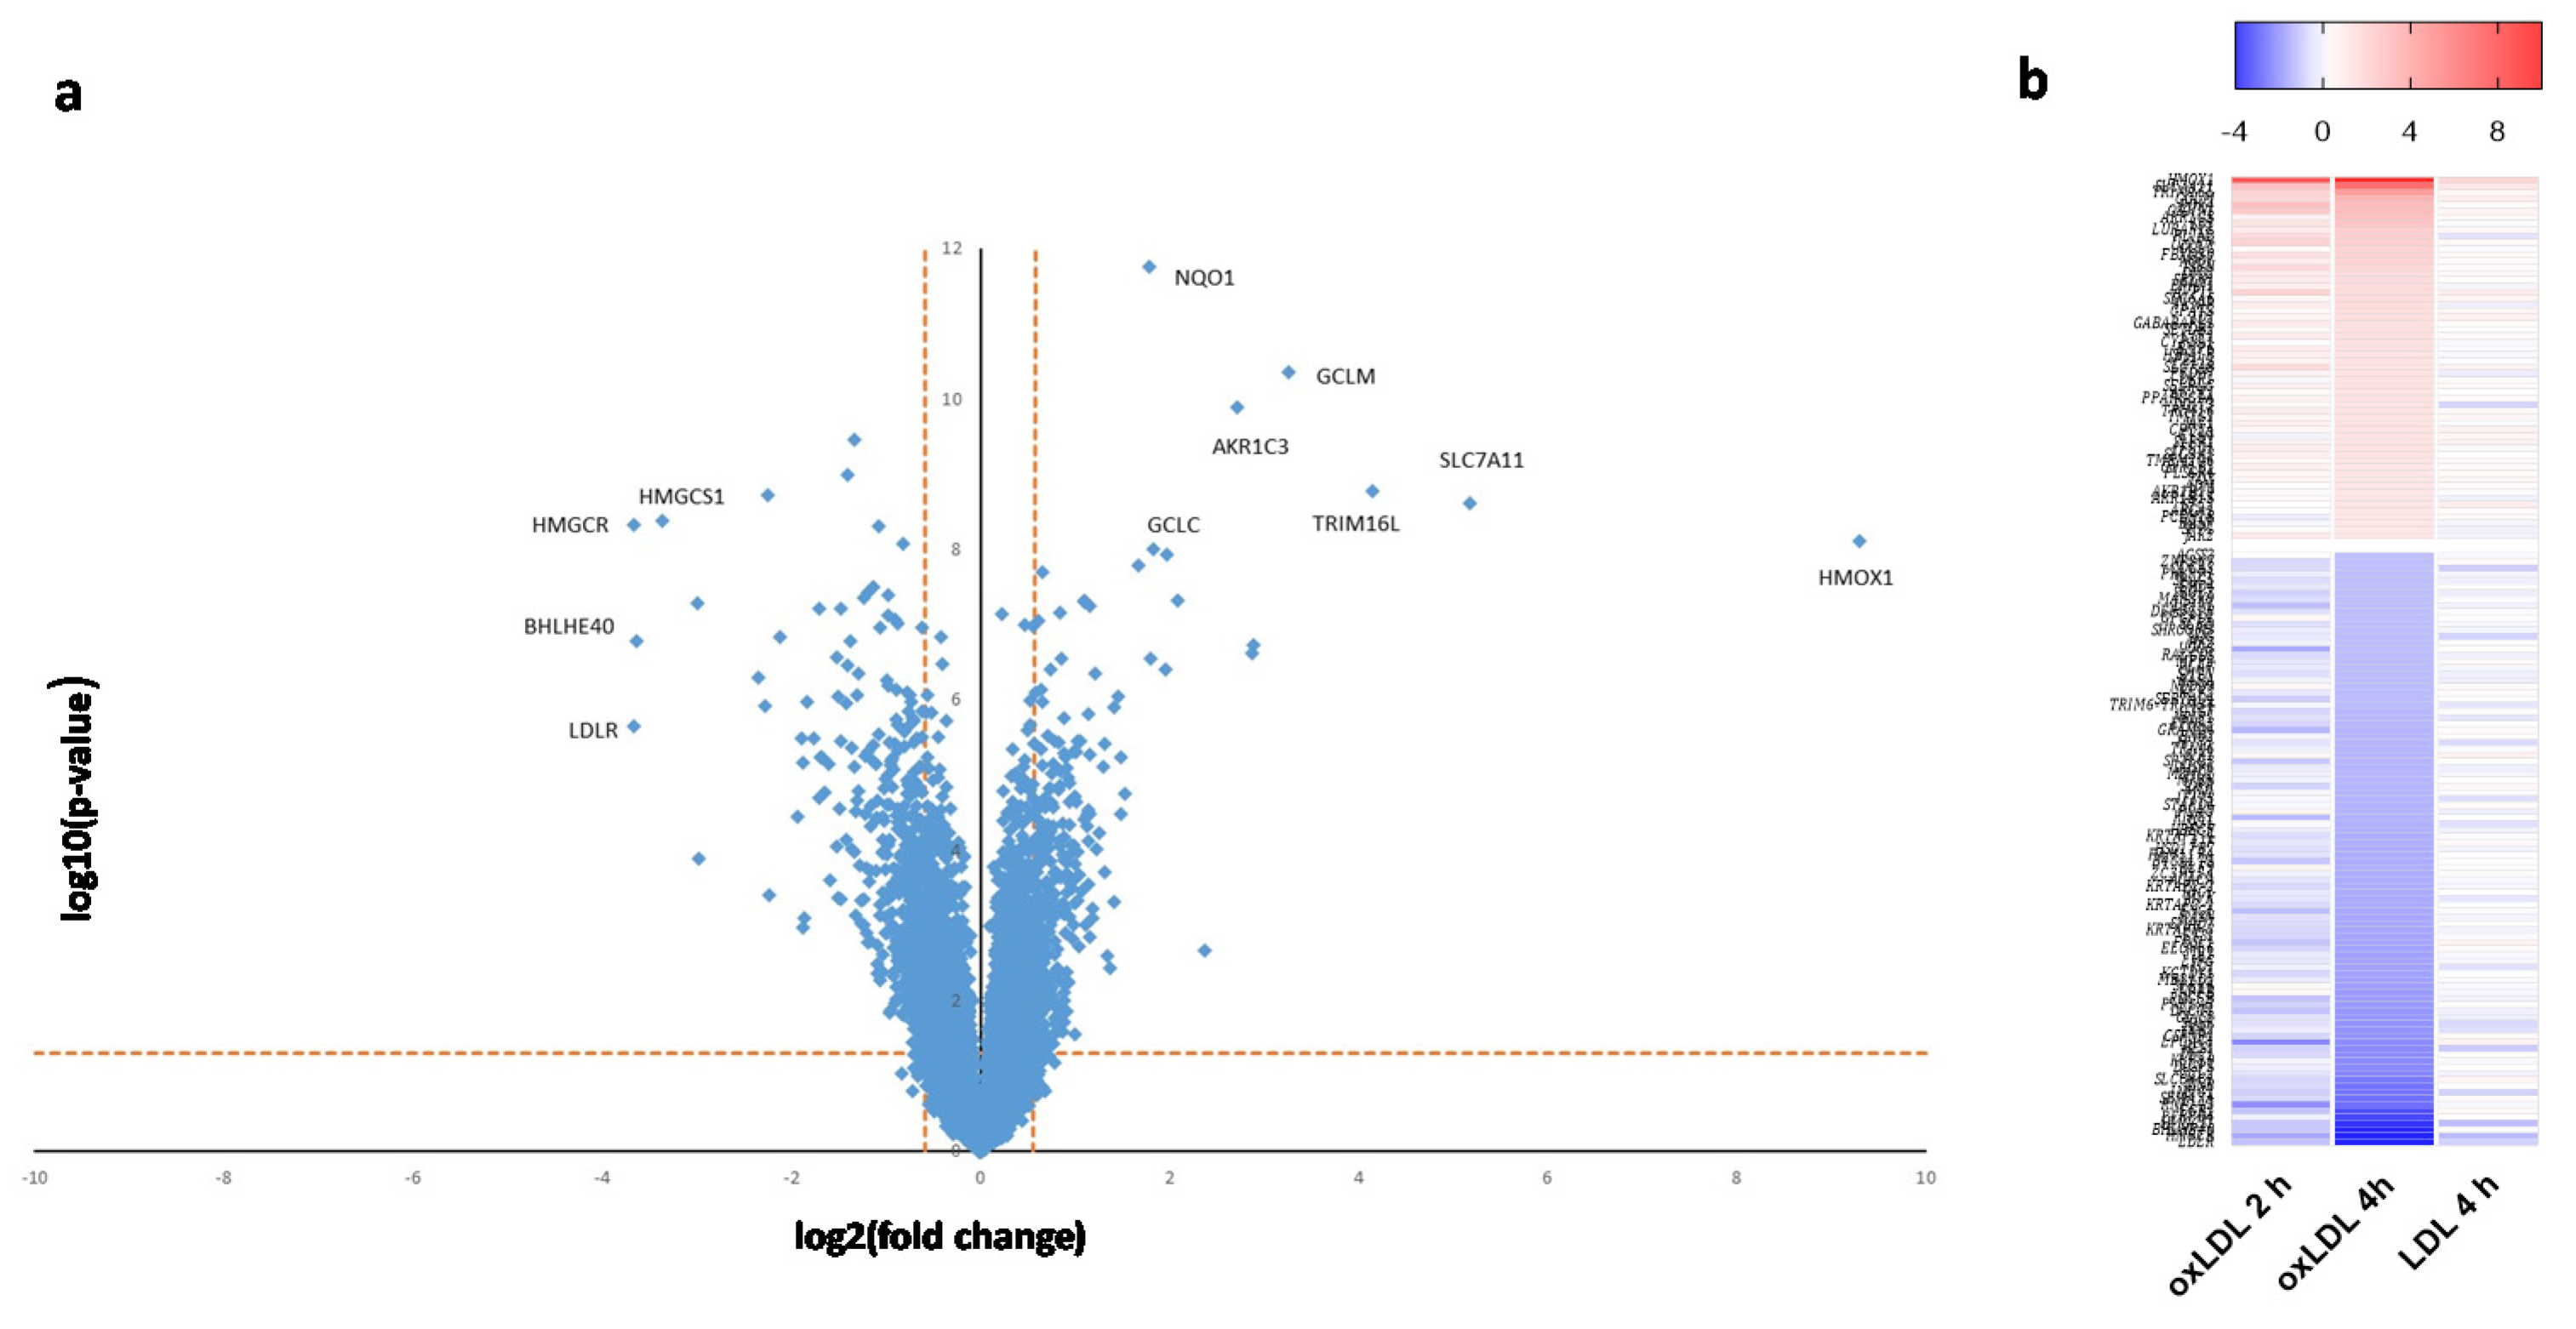
2. Results
3. Discussion
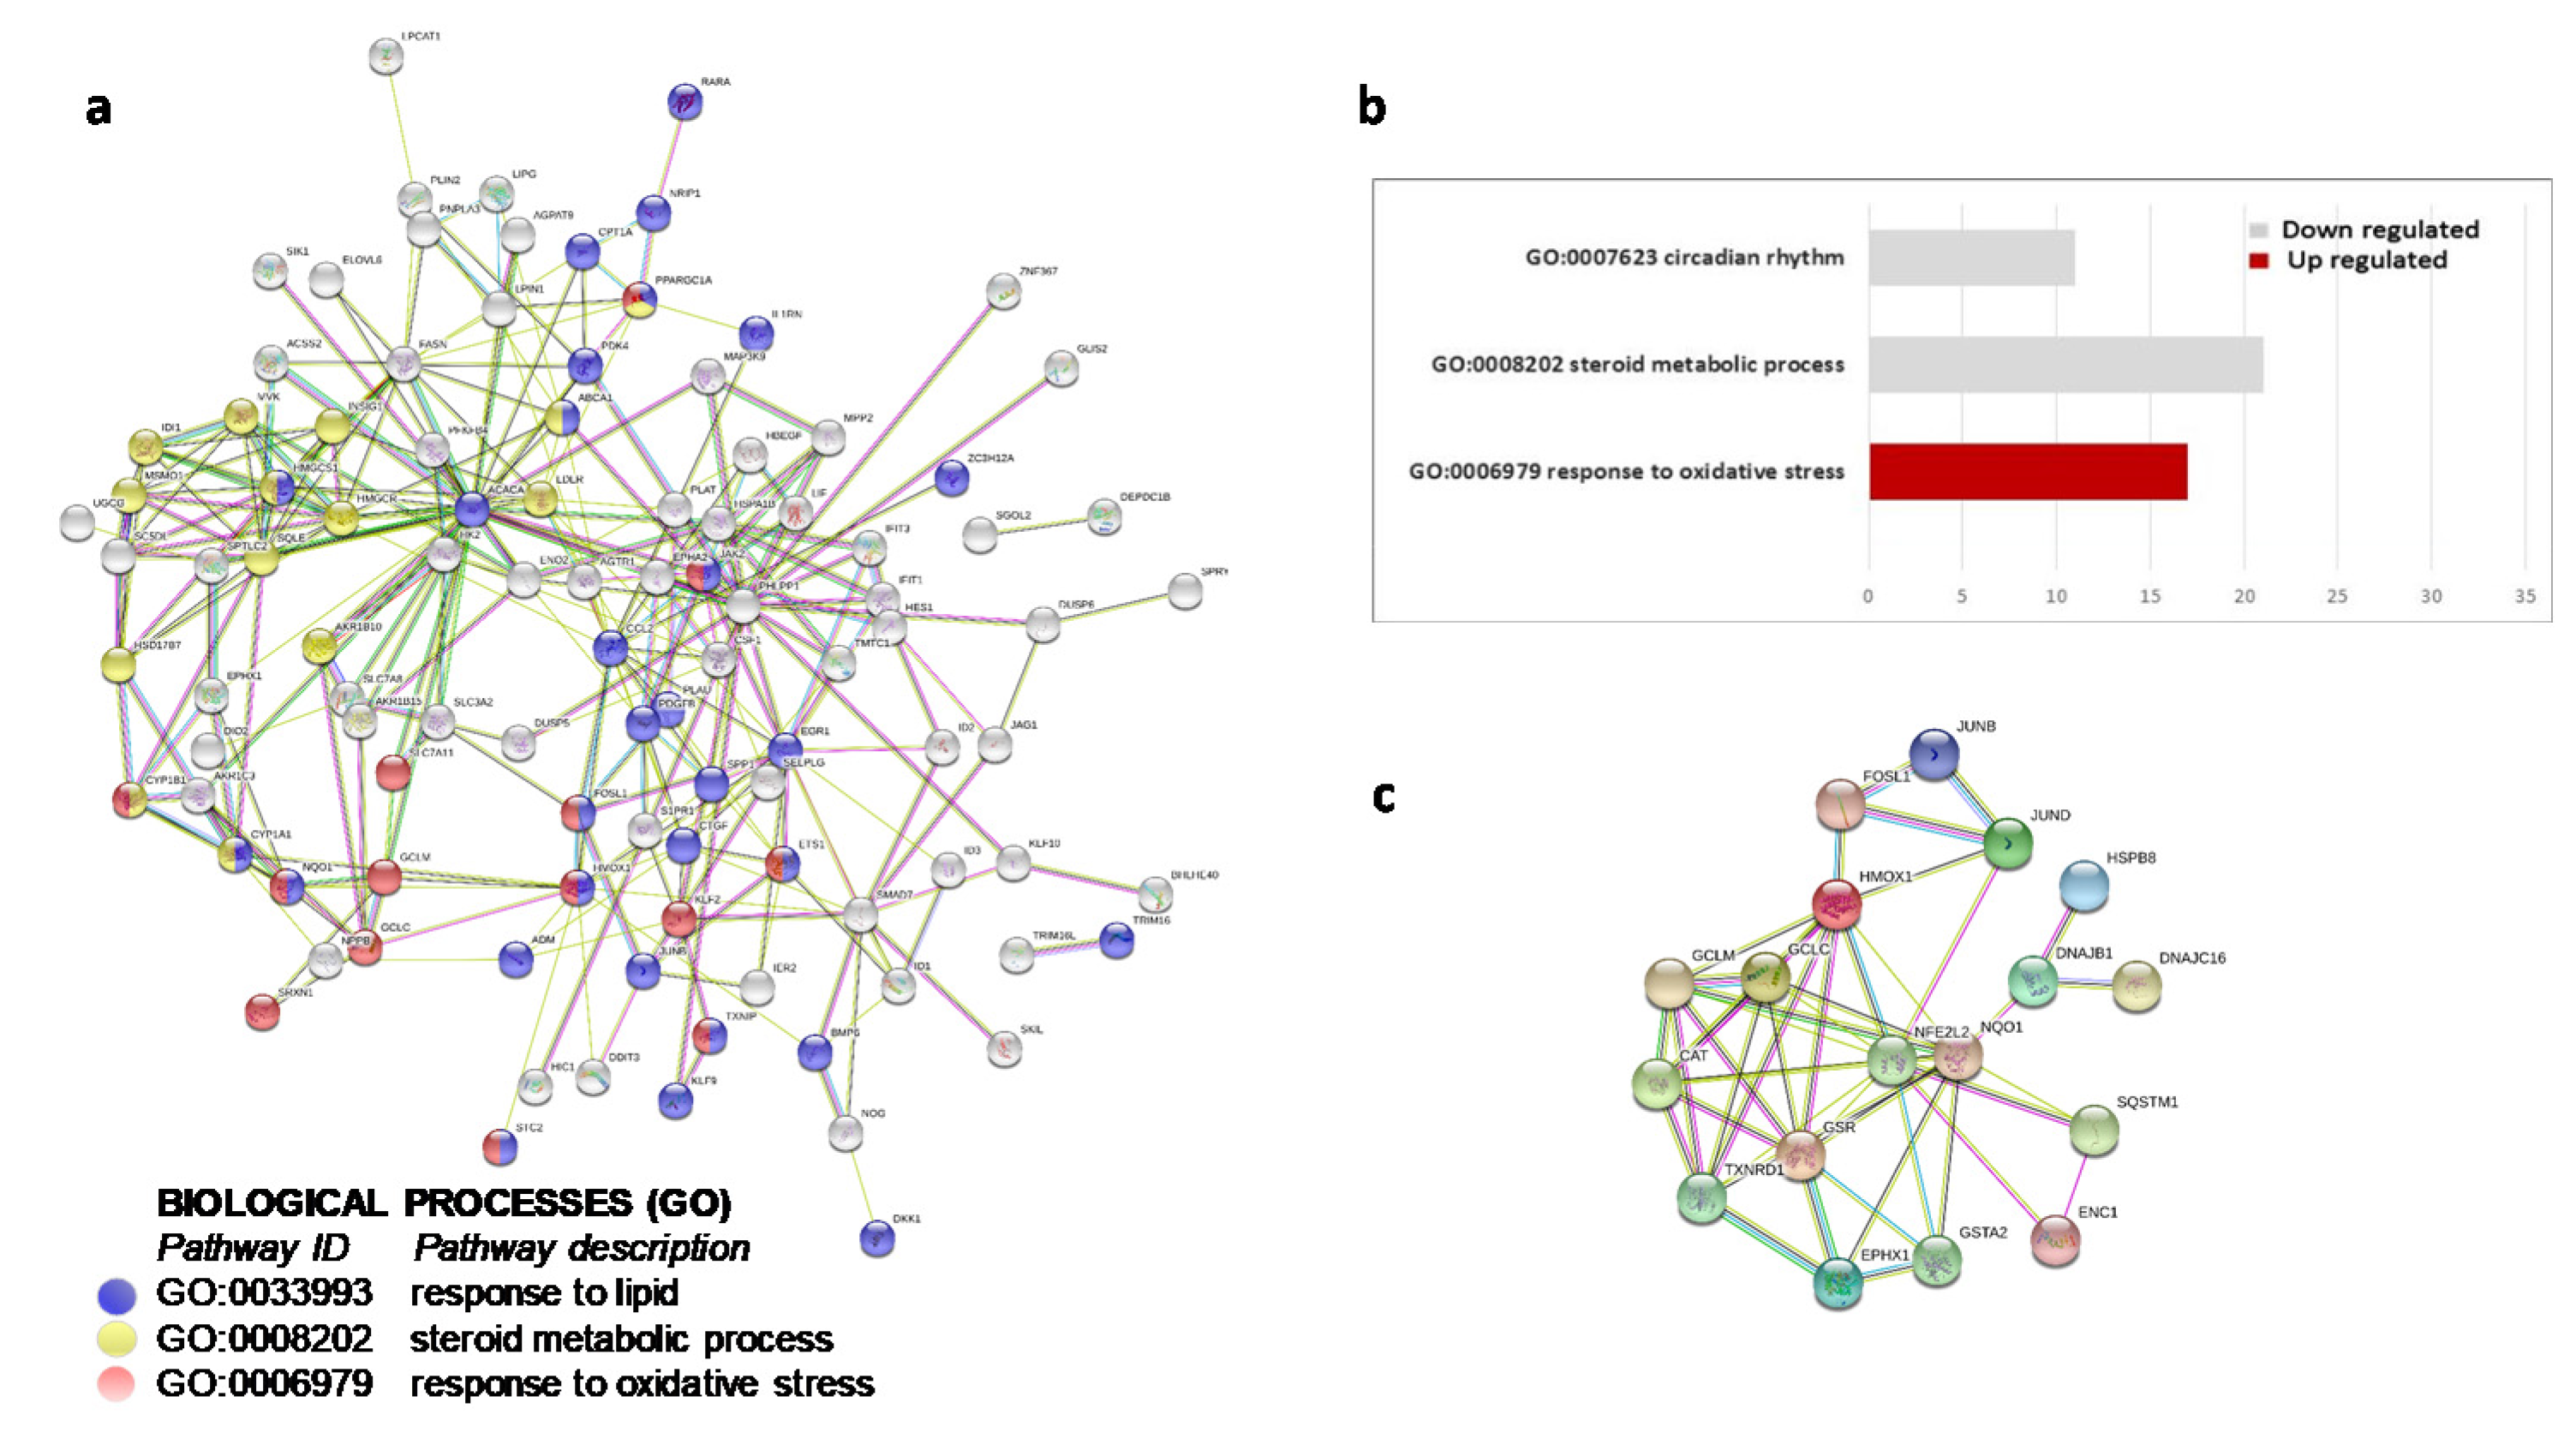
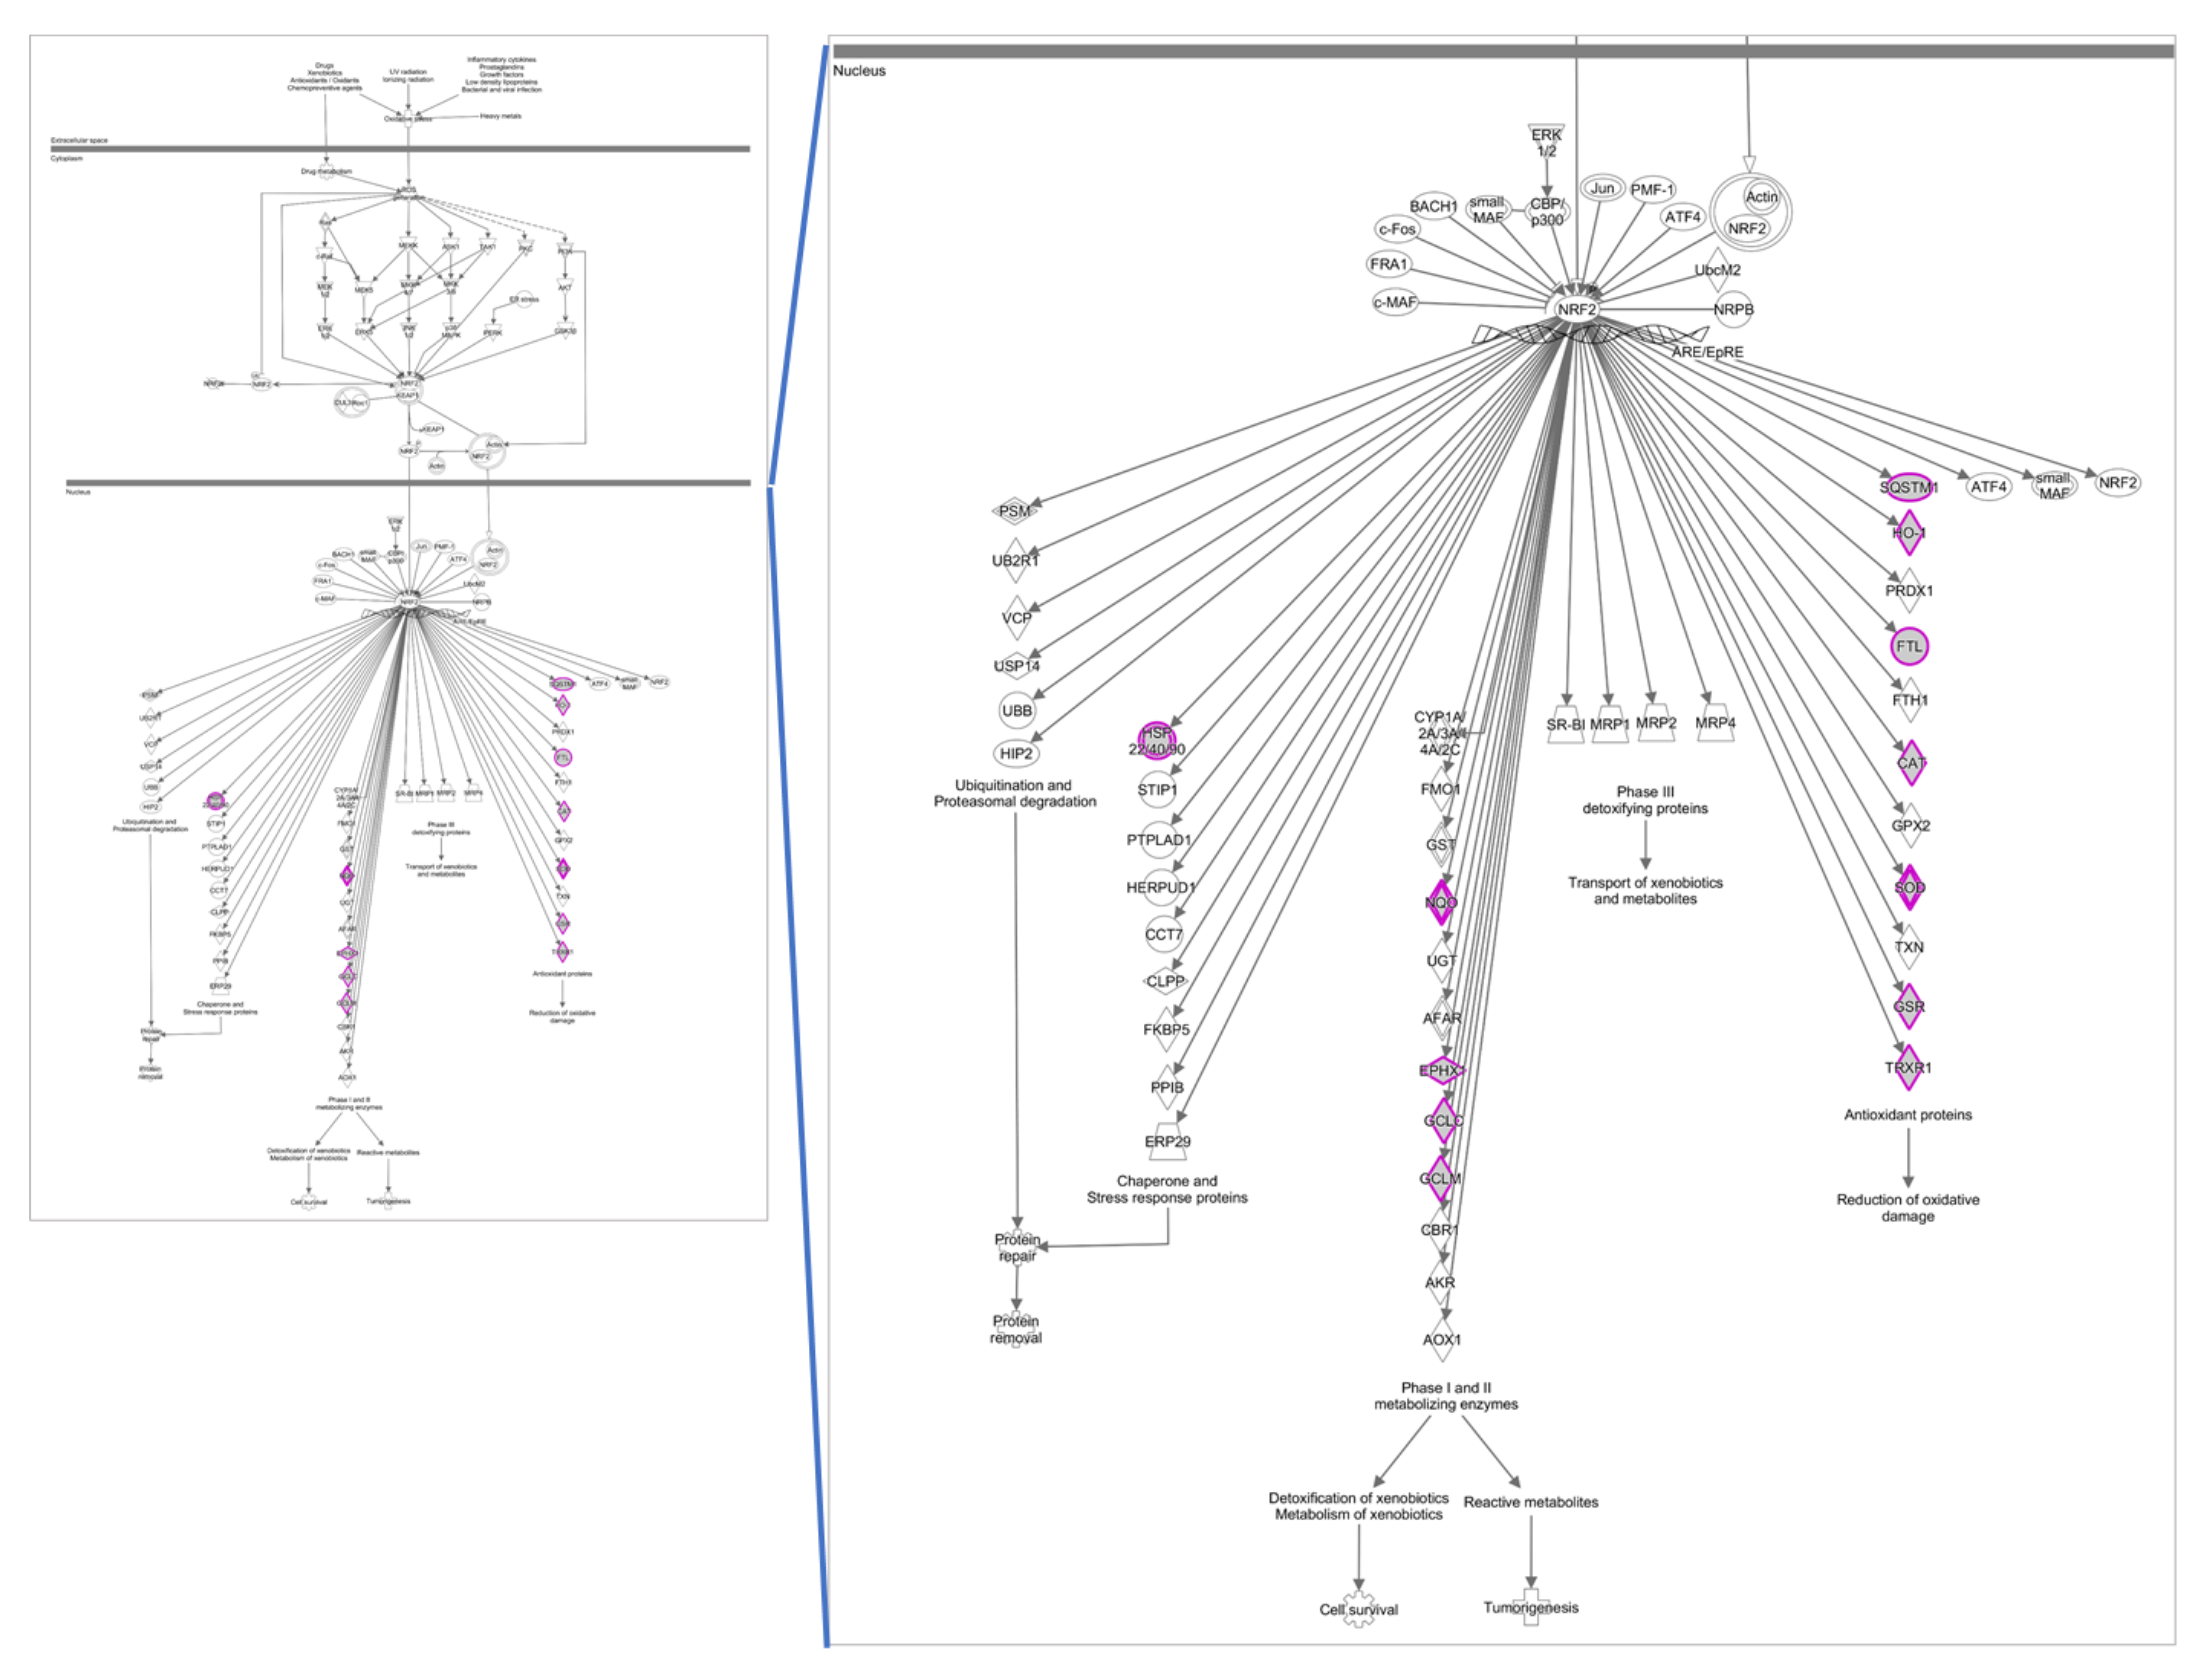
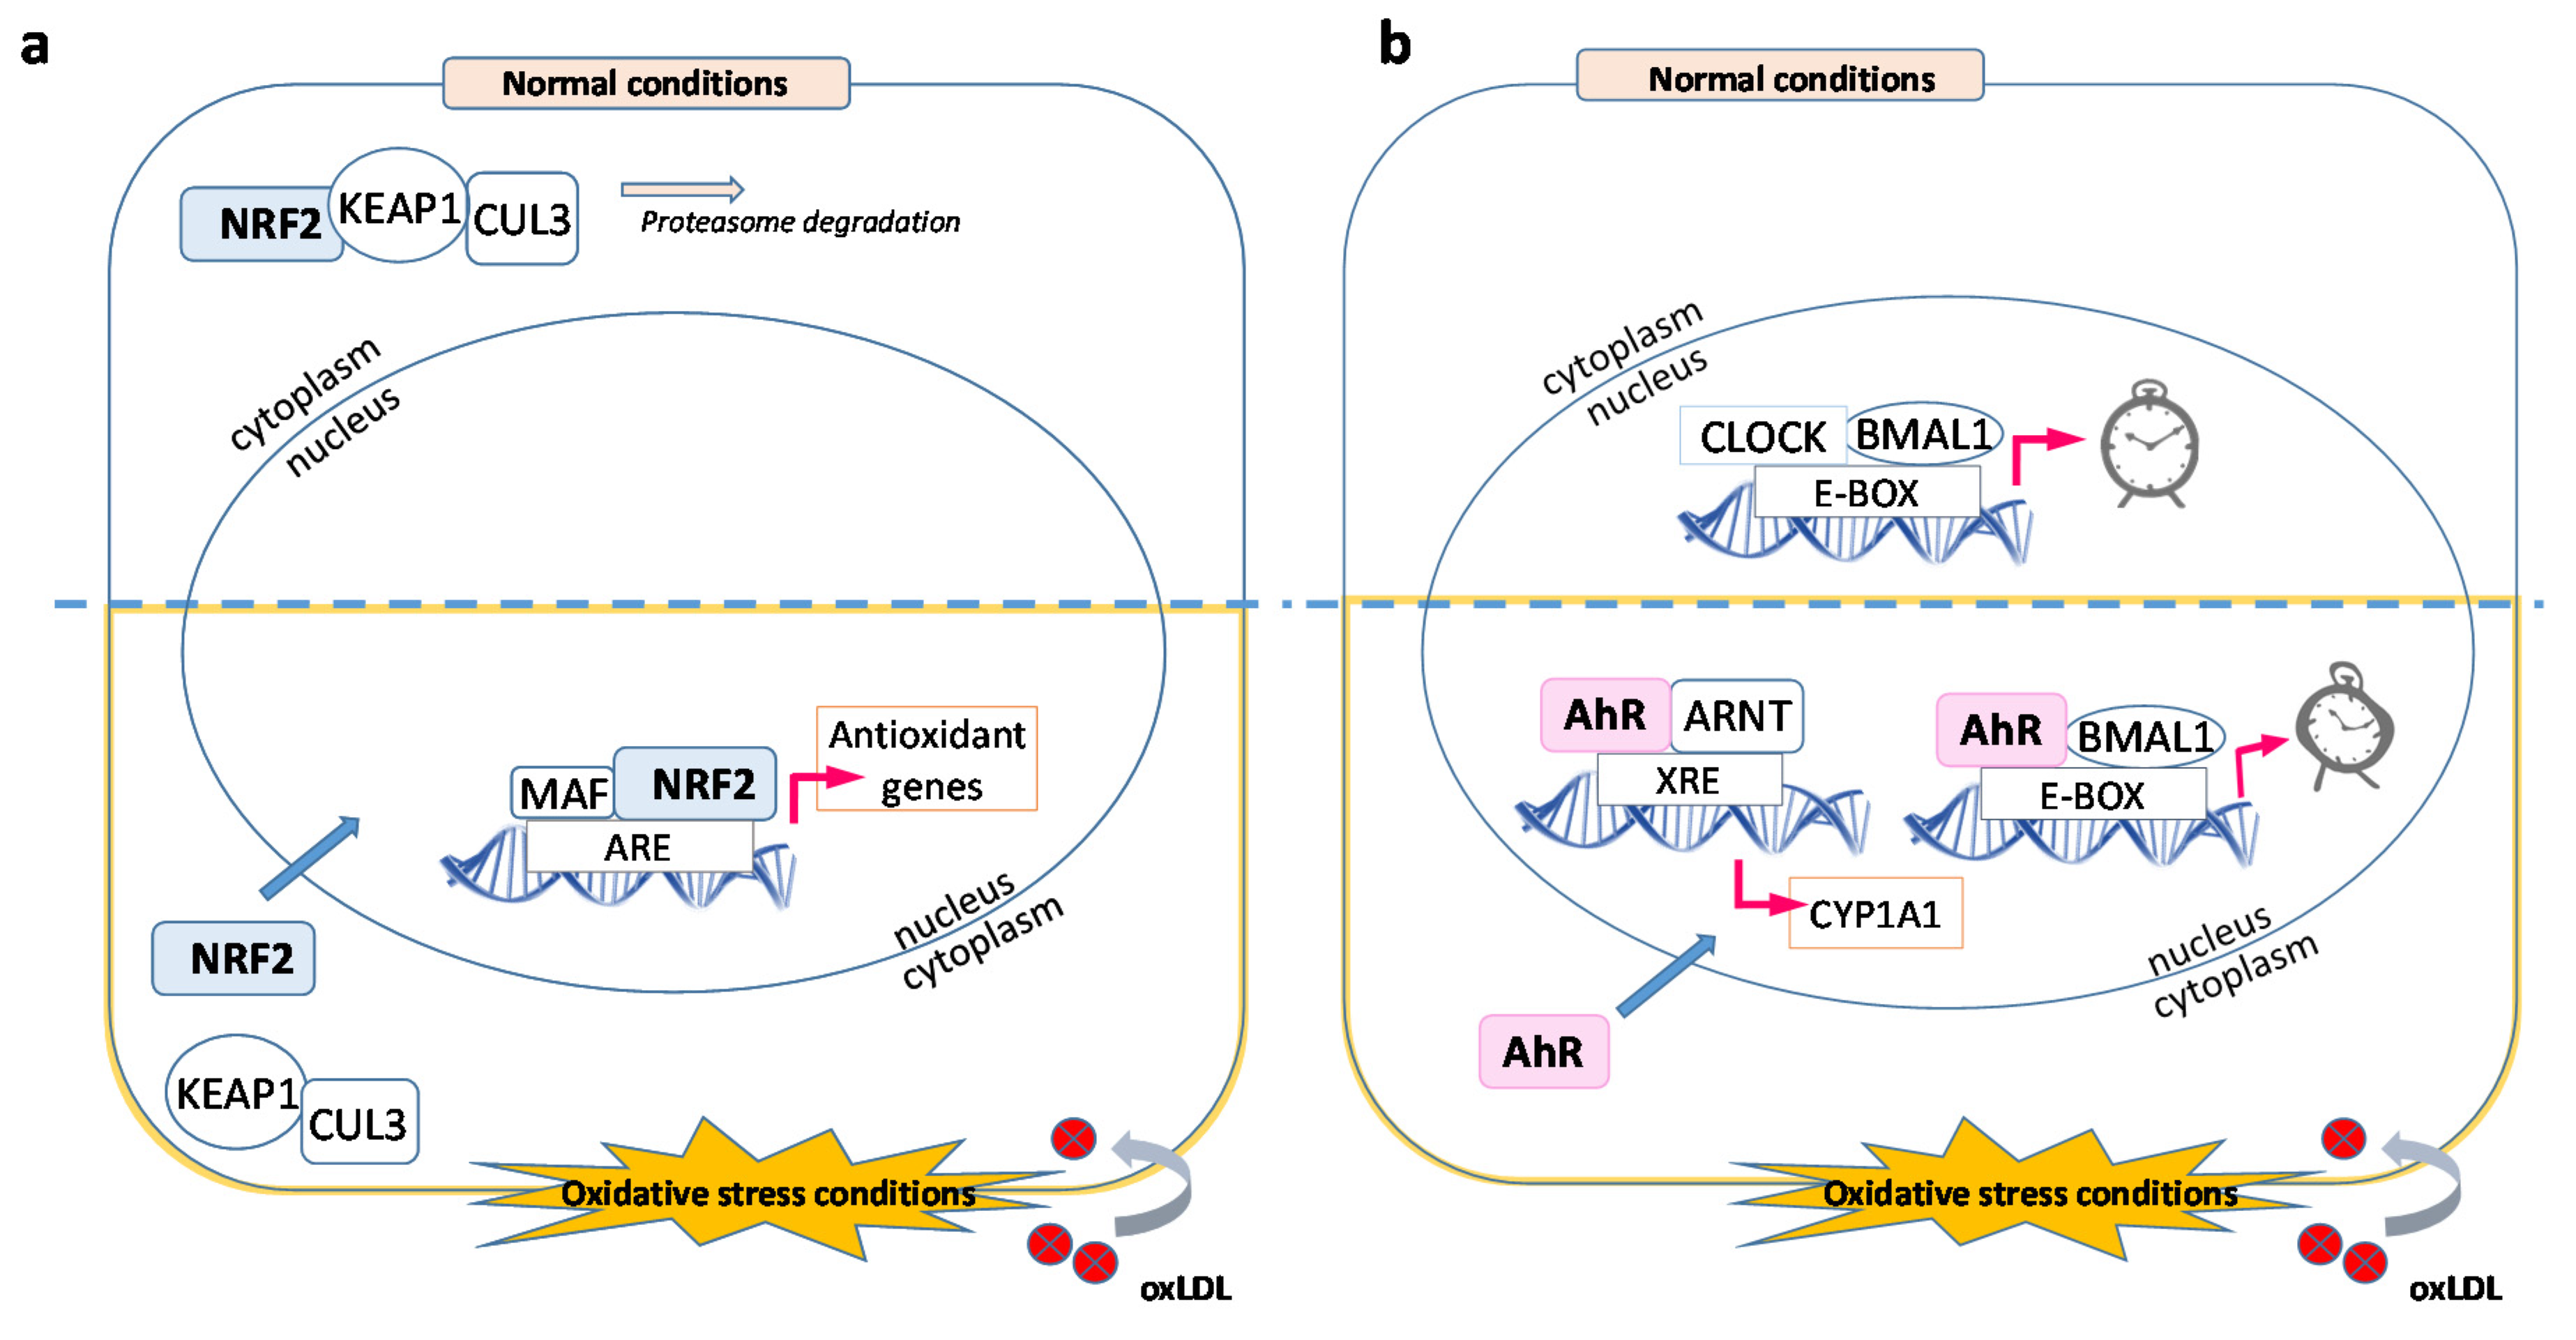
3.1. OxLDL and Antioxidative Stress Response
3.2. OxLDL and Circadian Rhythms
3.3. OxLDL and Autophagy
3.4. OxLDL and Lipid Metabolism
4. Materials and Methods
4.1. Cell Culture and RNA Preparation
4.2. Microarray Analysis
4.3. qPCR
4.4. Bioinformatics and Statistical Analysis
5. Conclusions
Supplementary Materials
Author Contributions
Funding
Acknowledgments
Conflicts of Interest
Abbreviations
| RPE | Retinal pigment epithelium |
| OxLDL | Oxidized low-density lipoprotein |
| LDL | Low-density lipoprotein |
| AMD | Age-related macular degeneration |
| FDR | False discovery rate |
| NRF2 | Nuclear factor erythroid-2 related factor 2 |
| AhR | Aryl hydrocarbon receptor |
Appendix A


| Gene | Forward Primer Sequences (5′-3′) |
|---|---|
| Reverse Primer Sequence (5′-3′) | |
| HMOX1 | AGA CTG CGT TCC TGC TCA ACA T |
| GGG GCA GAA TCT TGC ACT TTG T | |
| GCLM | CAT TTA CAG CCT TAC TGG GAG G |
| CGT GCG CTT GAA TGT CAG G | |
| NQO1 | AAA AGA AGC TGG AAG CCG CA |
| AGG ATT TGA ATT CGG GCG TC | |
| HMGCR | TCA AAG GGT ACA GAG AAA GCA C |
| TAT GCT CCC AGC CAT GGC AG | |
| ABCA1 | GCA CTG AGG AAG ATG CTG AAA |
| AGT TCC TGG AAG GTC TTG TTC AC | |
| LDLR | CTG GAC CGG AGC GAG TAC AC |
| TGG GTG CTG CAG ATC ATT CTC | |
| SQLE | TGG GCA TTG CCA CTT TCA C |
| GGC CTG AGA GAA TAT CCG AGA AG | |
| BHLHE40 | AAT CAT TGC CCT GCA GAG TG |
| CGA AGA CTT CAG GTC CCG AG | |
| PER1 | CTG CTA CAG GCA CGT TCA AG |
| CTC AGG GAC CAA GGC TAG TG |
References
- Friedman, D.S.; O’Colmain, B.J.; Muñoz, B.; Tomany, S.C.; Mccarty, C.; De Jong, P.T.V.M.; Nemesure, B.; Mitchell, P.; Kempen, J. Prevalence of Age-Related Macular Degeneration in the United States. Arch. Ophthalmol. 2004, 122, 564–572. [Google Scholar] [CrossRef] [PubMed]
- Nowak, J.Z. Age-related macular degeneration (AMD): Pathogenesis and therapy. Pharmacol. Rep. 2006, 58, 353–363. [Google Scholar] [PubMed]
- Al-Zamil, W.M.; Yassin, S.A. Recent developments in age-related macular degeneration: A review. Clin. Interv. Aging 2017, 12, 1313–1330. [Google Scholar] [CrossRef] [PubMed]
- Jang, K.-H.; Do, Y.-J.; Son, D.; Son, E.; Choi, J.-S.; Kim, E. AIF-independent parthanatos in the pathogenesis of dry age-related macular degeneration. Cell Death Dis. 2018, 8, e2526. [Google Scholar] [CrossRef] [PubMed]
- DeAngelis, M.M.; Owen, L.A.; Morrison, M.A.; Morgan, D.J.; Li, M.; Shakoor, A.; Vitale, A.; Iyengar, S.; Stambolian, D.; Kim, I.K.; et al. Genetics of age-related macular degeneration (AMD). Hum. Mol. Genet. 2017, 26, R246. [Google Scholar] [CrossRef]
- Rodriguez, I.R.; Larráyoz, I.M. Cholesterol oxidation in the retina: Implications of 7KCh formation in chronic inflammation and age-related macular degeneration. J. Lipid Res. 2010, 51, 2847–2862. [Google Scholar] [CrossRef]
- Handa, J.T.; Cano, M.; Wang, L.; Datta, S.; Liu, T. Lipids, oxidized lipids, oxidation-specific epitopes, and Age-related Macular Degeneration. Biochim. et Biophys. Acta Mol. Cell Biol. Lipids 2017, 1862, 430–440. [Google Scholar] [CrossRef]
- Ratnayaka, J.A.; Serpell, L.C.; Lotery, A.J. Dementia of the eye: The role of amyloid beta in retinal degeneration. Eye 2015, 29, 1013–1026. [Google Scholar] [CrossRef]
- Levitan, I.; Volkov, S.; Subbaiah, P.V. Oxidized LDL: Diversity, Patterns of Recognition, and Pathophysiology. Antioxidants Redox Signal. 2010, 13, 39–75. [Google Scholar] [CrossRef]
- Binder, C.J.; Papac-Milicevic, C.J.B.N.; Witztum, J.L. Innate sensing of oxidation-specific epitopes in health and disease. Nat. Rev. Immunol. 2016, 16, 485–497. [Google Scholar] [CrossRef]
- Weigel, A.L.; Handa, J.T.; Hjelmeland, L.M. Microarray analysis of H2O2-, HNE-, or tBH-treated ARPE-19 cells. Free. Radic. Biol. Med. 2002, 33, 1419–1432. [Google Scholar] [CrossRef]
- Cano, M.; Wang, L.; Wan, J.; Barnett, B.P.; Ebrahimi, K.; Qian, J.; Handa, J.T. Oxidative stress induces mitochondrial dysfunction and a protective unfolded protein response in RPE cells. Free. Radic. Biol. Med. 2014, 69, 1–14. [Google Scholar] [CrossRef] [PubMed]
- Yamada, Y.; Tian, J.; Yang, Y.; Cutler, R.G.; Wu, T.; Telljohann, R.S.; Mattson, M.P.; Handa, J.T. Oxidized low density lipoproteins induce a pathologic response by retinal pigmented epithelial cells. J. Neurochem. 2008, 105, 1187–1197. [Google Scholar] [CrossRef] [PubMed]
- Gnanaguru, G.; Choi, A.R.; Amarnani, D.; D’Amore, P.A. Oxidized Lipoprotein Uptake Through the CD36 Receptor Activates the NLRP3 Inflammasome in Human Retinal Pigment Epithelial Cells. Investig. Ophthalmol. Vis. Sci. 2016, 57, 4704–4712. [Google Scholar] [CrossRef]
- Gordiyenko, N.; Campos, M.; Lee, J.W.; Fariss, R.N.; Sztein, J.; Rodriguez, I.R. RPE Cells Internalize Low-Density Lipoprotein (LDL) and Oxidized LDL (oxLDL) in Large Quantities In Vitro and In Vivo. Investig. Ophthalmol. Vis. Sci. 2004, 45, 2822–2829. [Google Scholar] [CrossRef]
- Kuda, O.; Pietka, T.A.; Demianova, Z.; Kudova, E.; Cvacka, J.; Kopecky, J.; Abumrad, N.A. Sulfo-N-succinimidyl Oleate (SSO) Inhibits Fatty Acid Uptake and Signaling for Intracellular Calcium via Binding CD36 Lysine 164 SSO ALSO INHIBITS OXIDIZED LOW DENSITY LIPOPROTEIN UPTAKE BY MACROPHAGES. J. Biol. Chem. 2013, 288, 15547–15555. [Google Scholar] [CrossRef]
- Weismann, D.; Hartvigsen, K.; Lauer, N.; Bennett, K.L.; Scholl, H.P.N.; Issa, P.C.; Cano, M.; Brandstätter, H.; Tsimikas, S.; Skerka, C.; et al. Complement factor H binds malondialdehyde epitopes and protects from oxidative stress. Nat. Cell Biol. 2011, 478, 76–81. [Google Scholar] [CrossRef]
- Tonelli, C.; Chio, I.I.C.; Tuveson, D.A. Transcriptional Regulation by Nrf2. Antioxidants Redox Signal. 2018, 29, 1727–1745. [Google Scholar] [CrossRef]
- Krönke, G.; Bochkov, V.N.; Huber, J.; Gruber, F.; Blüml, S.; Fürnkranz, A.; Kadl, A.; Binder, B.R.; Leitinger, N. Oxidized Phospholipids Induce Expression of Human Heme Oxygenase-1 Involving Activation of cAMP-responsive Element-binding Protein. J. Biol. Chem. 2003, 278, 51006–51014. [Google Scholar] [CrossRef]
- Maines, M.D. THE HEME OXYGENASE SYSTEM:A Regulator of Second Messenger Gases. Annu. Rev. Pharmacol. Toxicol. 1997, 37, 517–554. [Google Scholar] [CrossRef]
- Wang, L.J.; Lee, T.S.; Lee, F.Y.; Pai, R.C.; Chau, L.Y. Expression of heme oxygenase-1 in atherosclerotic lesions. Am. J. Pathol. 1998, 152, 711–720. [Google Scholar] [PubMed]
- Willis, D.; Moore, A.R.; Willoughby, D.A. Heme oxygenase isoform expression in cellular and antibody-mediated models of acute inflammation in the rat. J. Pathol. 2000, 190, 627–634. [Google Scholar] [CrossRef]
- Bauer, M.; Bauer, I. Heme Oxygenase-1: Redox Regulation and Role in the Hepatic Response to Oxidative Stress. Antioxidants Redox Signal. 2002, 4, 749–758. [Google Scholar] [CrossRef] [PubMed]
- Bucolo, C.; Drago, F.; Maisto, R.; Romano, G.L.; D’Agata, V.; Maugeri, G.; Giunta, S. Curcumin prevents high glucose damage in retinal pigment epithelial cells through ERK1/2-mediated activation of the Nrf2/HO-1 pathway. J. Cell. Physiol. 2019, 234, 17295–17304. [Google Scholar] [CrossRef] [PubMed]
- Lee, T.-S.; Chau, L.-Y. Heme oxygenase-1 mediates the anti-inflammatory effect of interleukin-10 in mice. Nat. Med. 2002, 8, 240–246. [Google Scholar] [CrossRef] [PubMed]
- Pittalà, V.; Fidilio, A.; Lazzara, F.; Platania, C.B.M.; Salerno, L.; Foresti, R.; Drago, F.; Bucolo, C. Effects of Novel Nitric Oxide-Releasing Molecules against Oxidative Stress on Retinal Pigmented Epithelial Cells. Oxidative Med. Cell. Longev. 2017, 2017, 1–11. [Google Scholar] [CrossRef] [PubMed]
- Synowiec, E.; Szaflik, J.; Chmielewska, M.; Wozniak, K.; Sklodowska, A.; Waszczyk, M.; Dorecka, M.; Blasiak, J.; Szaflik, J.P. An association between polymorphism of the heme oxygenase-1 and -2 genes and age-related macular degeneration. Mol. Biol. Rep. 2012, 39, 2081–2087. [Google Scholar] [CrossRef]
- Finnemann, S.C.; Chang, Y. Photoreceptor—RPE Interactions. In Visual Transduction and Non-Visual Light Perception; Springer: New York, NY, USA, 2008; pp. 67–86. [Google Scholar]
- Lavail, M.M. Rod outer segment disk shedding in rat retina: Relationship to cyclic lighting. Science 1976, 194, 1071–1074. [Google Scholar] [CrossRef]
- Young, R.W.; Bok, D. Participation of the retinal pigment epithelium in the rod outer segment renewal process. J. Cell Biol. 1969, 42, 392–403. [Google Scholar] [CrossRef]
- Guido, M.E.; Pico, E.G.; Contín, M.A.; Valdez, D.; Nieto, P.S.; Verra, D.M.; Acosta-Rodriguez, V.A.; De Zavalía, N.; Rosenstein, R.E. Inner retinal circadian clocks and non-visual photoreceptors: Novel players in the circadian system. Prog. Neurobiol. 2010, 92, 484–504. [Google Scholar] [CrossRef]
- Mazzoni, F.; Safa, H.; Finnemann, S.C. Understanding photoreceptor outer segment phagocytosis: Use and utility of RPE cells in culture. Exp. Eye Res. 2014, 126, 51–60. [Google Scholar] [CrossRef] [PubMed]
- Karan, G.; Lillo, C.; Yang, Z.; Cameron, D.J.; Locke, K.G.; Zhao, Y.; Thirumalaichary, S.; Li, C.; Birch, D.G.; Vollmer-Snarr, H.R.; et al. Lipofuscin accumulation, abnormal electrophysiology, and photoreceptor degeneration in mutant ELOVL4 transgenic mice: A model for macular degeneration. Proc. Natl. Acad. Sci. USA 2005, 102, 4164–4169. [Google Scholar] [CrossRef] [PubMed]
- Dorey, C.K.; Wu, G.; Ebenstein, D.; Garsd, A.; Weiter, J.J. Cell loss in the aging retina. Relationship to lipofuscin accumulation and macular degeneration. Investig. Ophthalmol. Vis. Sci. 1989, 30, 1691–1699. [Google Scholar]
- Villegas-Perez, M.P. [Light exposure, lipofuscin and age-related macular degeneration]. Arch. de la Soc. Esp. de Oftalmol. 2005, 80, 565–568. [Google Scholar]
- Fanjul-Moles, M.L.; López-Riquelme, G.O. Relationship between Oxidative Stress, Circadian Rhythms, and AMD. Oxidative Med. Cell. Longev. 2016, 2016, 1–18. [Google Scholar] [CrossRef]
- Trammell, R.A.; Verhulst, S.; Toth, L. Effects of Sleep Fragmentation on Sleep and Markers of Inflammation in Mice. Comp. Med. 2014, 64, 13–24. [Google Scholar]
- Leproult, R.; Holmbäck, U.; Van Cauter, E. Circadian Misalignment Augments Markers of Insulin Resistance and Inflammation, Independently of Sleep Loss. Diabetes 2014, 63, 1860–1869. [Google Scholar] [CrossRef]
- Maury, E.; Hong, H.; Bass, J. Circadian disruption in the pathogenesis of metabolic syndrome. Diabetes Metab. 2014, 40, 338–346. [Google Scholar] [CrossRef]
- Wang, Q.; Bozack, S.N.; Yan, Y.; Boulton, M.E.; Grant, M.B.; Busik, J.V. Regulation of Retinal Inflammation by Rhythmic Expression of MiR-146a in Diabetic Retina. Investig. Ophthalmol. Vis. Sci. 2014, 55, 3986–3994. [Google Scholar] [CrossRef]
- Smit-McBride, Z.; Moisseiev, E.; Modjtahedi, S.P.; Telander, D.G.; Hjelmeland, L.M.; Morse, L.S. Comparison of In Vivo Gene Expression Profiling of RPE/Choroid following Intravitreal Injection of Dexamethasone and Triamcinolone Acetonide. J. Ophthalmol. 2016, 2016, 1–13. [Google Scholar] [CrossRef]
- Honma, S.; Kawamoto, T.; Takagi, Y.; Fujimoto, K.; Sato, F.; Noshiro, M.; Kato, Y.; Honma, K.-I. Dec1 and Dec2 are regulators of the mammalian molecular clock. Nat. Cell Biol. 2002, 419, 841–844. [Google Scholar] [CrossRef] [PubMed]
- Yin, L.; Wu, N.; Curtin, J.C.; Qatanani, M.; Szwergold, N.R.; Reid, R.A.; Waitt, G.M.; Parks, D.J.; Pearce, K.H.; Wisely, G.B.; et al. Rev-erb, a Heme Sensor That Coordinates Metabolic and Circadian Pathways. Science 2007, 318, 1786–1789. [Google Scholar] [CrossRef] [PubMed]
- Guillaumond, F.; Grechez-Cassiau, A.; Subramaniam, M.; Brangolo, S.; Peteri-Brunback, B.; Staels, B.; Fievet, C.; Spelsberg, T.C.; Delaunay, F.; Teboul, M. Kruppel-like factor KLF10 is a link between the circadian clock and metabolism in liver. Mol. Cell. Biol. 2010, 30, 3059–3070. [Google Scholar] [CrossRef] [PubMed]
- Spörl, F.; Korge, S.; Jürchott, K.; Wunderskirchner, M.; Schellenberg, K.; Heins, S.; Specht, A.; Stoll, C.; Klemz, R.; Maier, B.; et al. Kruppel-like factor 9 is a circadian transcription factor in human epidermis that controls proliferation of keratinocytes. Proc. Natl. Acad. Sci. USA 2012, 109, 10903–10908. [Google Scholar] [CrossRef]
- Duguay, D.; Cermakian, N. The crosstalk between physiology and circadian clock proteins. Chronobiol. Int. 2009, 26, 1479–1513. [Google Scholar] [CrossRef]
- Ward, S.M.; Fernando, S.J.; Hou, T.Y.; Duffield, G.E. The Transcriptional Repressor ID2 Can Interact with the Canonical Clock Components CLOCK and BMAL1 and Mediate Inhibitory Effects onmPer1Expression. J. Biol. Chem. 2010, 285, 38987–39000. [Google Scholar] [CrossRef]
- Ko, G.Y. Circadian regulation in the retina: From molecules to network. Eur. J. Neurosci. 2020, 51, 194–216. [Google Scholar] [CrossRef]
- Ko, C.H.; Takahashi, J.S. Molecular components of the mammalian circadian clock. Hum. Mol. Genet. 2006, 15, R271–R277. [Google Scholar] [CrossRef]
- Lowrey, P.L.; Takahashi, J.S. Genetics of Circadian Rhythms in Mammalian Model Organisms. Genet. Circadian Rhythm. 2011, 74, 175–230. [Google Scholar] [CrossRef]
- Jaeger, C.; Tischkau, S.A. Role of Aryl Hydrocarbon Receptor in Circadian Clock Disruption and Metabolic Dysfunction. Environ. Health Insights 2016, 10, EHI.S38343–41. [Google Scholar] [CrossRef]
- Dikic, I. Proteasomal and Autophagic Degradation Systems. Annu. Rev. Biochem. 2017, 86, 193–224. [Google Scholar] [CrossRef] [PubMed]
- Jain, A.; Lamark, T.; Sjøttem, E.; Larsen, K.B.; Awuh, J.A.; Øvervatn, A.; McMahon, M.; Hayes, J.D.; Johansen, T. p62/SQSTM1 is a target gene for transcription factor NRF2 and creates a positive feedback loop by inducing antioxidant response element-driven gene transcription. J. Biol. Chem. 2010, 285, 22576–22591. [Google Scholar] [CrossRef] [PubMed]
- Viiri, J.; Hyttinen, J.M.; Ryhanen, T.; Rilla, K.; Paimela, T.; Kuusisto, E.; Siitonen, A.; Urtti, A.; Salminen, A.; Kaarniranta, K. p62/sequestosome 1 as a regulator of proteasome inhibitor-induced autophagy in human retinal pigment epithelial cells. Mol. Vis. 2010, 16, 1399–1414. [Google Scholar] [PubMed]
- Park, S.; Ha, S.D.; Coleman, M.; Meshkibaf, S.; Kim, S.O. p62/SQSTM1 enhances NOD2-mediated signaling and cytokine production through stabilizing NOD2 oligomerization. PLoS ONE 2013, 8, e57138. [Google Scholar] [CrossRef] [PubMed]
- Neale, B.M.; Fagerness, J.; Reynolds, R.; Sobrin, L.; Parker, M.; Raychaudhuri, S.; Tan, P.L.; Oh, E.C.; Merriam, J.E.; Souied, E.; et al. Genome-wide association study of advanced age-related macular degeneration identifies a role of the hepatic lipase gene (LIPC). Proc. Natl. Acad. Sci. USA 2010, 107, 7395–7400. [Google Scholar] [CrossRef]
- Reynolds, R.; Rosner, B.; Seddon, J.M. Serum Lipid Biomarkers and Hepatic Lipase Gene Associations with Age-Related Macular Degeneration. Ophthalmology 2010, 117, 1989–1995. [Google Scholar] [CrossRef]
- Fritsche, L.G.; Chen, W.; Schu, M.; Yaspan, B.L.; Yu, Y.; Thorleifsson, G.; Zack, D.J.; Arakawa, S.; Cipriani, V.; Ripke, S.; et al. Seven new loci associated with age-related macular degeneration. Nat. Genet. 2013, 45, 433–439. [Google Scholar] [CrossRef]
- Klein, R.; Myers, C.E.; Buitendijk, G.H.; Rochtchina, E.; Gao, X.; de Jong, P.T.; Sivakumaran, T.A.; Burlutsky, G.; McKean-Cowdin, R.; Hofman, A.; et al. Lipids, lipid genes, and incident age-related macular degeneration: The three continent age-related macular degeneration consortium. Am. J. Ophthalmol. 2014, 158, 513–524. [Google Scholar] [CrossRef]
- Zhang, Y.; Ma, K.L.; Ruan, X.Z.; Liu, B.C. Dysregulation of the Low-Density Lipoprotein Receptor Pathway Is Involved in Lipid Disorder-Mediated Organ Injury. Int. J. Biol. Sci. 2016, 12, 569–579. [Google Scholar] [CrossRef]
- Janowski, B.A. The hypocholesterolemic agent LY295427 up-regulates INSIG-1, identifying the INSIG-1 protein as a mediator of cholesterol homeostasis through SREBP. Proc. Natl. Acad. Sci. USA 2002, 99, 12675–12680. [Google Scholar] [CrossRef]
- Sherman, B.T.; Lempicki, R.A. Systematic and integrative analysis of large gene lists using DAVID bioinformatics resources. Nat. Protoc. 2009, 4, 44–57. [Google Scholar]
- Szklarczyk, D.; Gable, A.L.; Lyon, D.; Junge, A.; Wyder, S.; Huerta-Cepas, J.; Simonovic, M.; Doncheva, N.T.; Morris, J.H.; Bork, P.; et al. STRING v11: Protein–protein association networks with increased coverage, supporting functional discovery in genome-wide experimental datasets. Nucleic Acids Res. 2019, 47, D607–D613. [Google Scholar] [CrossRef] [PubMed]
- Krämer, A.; Green, J.; Pollard, J.; Tugendreich, S. Causal analysis approaches in Ingenuity Pathway Analysis. Bioinformatics 2014, 30, 523–530. [Google Scholar] [CrossRef] [PubMed]
- Silverstein, R.L.; Li, W.; Park, Y.M.; Rahaman, S.O. Mechanisms of Cell Signaling by the Scavenger Receptor CD36: Implications in Atherosclerosis and Thrombosis. Trans. Am. Clin. Clim. Assoc. 2010, 121, 206–220. [Google Scholar]
- Yan, G.; Jiang, S.; Yu, L.; Liu, S. Oxidized low density lipoprotein (oxLDL) promotes mitochondrial dysfunction and induces apoptosis in retinal pigmented epithelium cells. Int. J. Clin. Exp. Pathol. 2017, 10, 1619–1626. [Google Scholar]


| Gene | 2-h OxLDL/Con 1,2 | 4-h OxLDL/Con |
|---|---|---|
| Response to oxidative stress | ||
| HMOX1 | 129.6 | 624.7 |
| SLC7A11 | 6.1 | 36.0 |
| TRIM16L | 3.3 | 17.6 |
| GCLM | 3.1 | 9.6 |
| GCLC | - | 3.5 |
| NQO1 | 1.7 | 3.4 |
| AKR1C3 | 1.4 | 6.5 |
| CYP1A1 | - | 2.4 |
| SQSTM1 | 1.4 | 1.8 |
| FTL | 1.2 | 1.8 |
| CAT | 1.4 | 1.6 |
| GSR | - | 1.7 |
| TXNRD1 | 1.2 | 1.8 |
| EPHX1 | - | 2.8 |
| Lipid metabolism | ||
| ABCA1 | - | 2.0 |
| ACACA | −1.3 | −2.5 |
| FASN | −1.4 | −2.7 |
| IDI1 | −1.3 | −2.8 |
| SQLE | −1.4 | −3.2 |
| INSIG1 | −1.7 | −4.7 |
| HMGCS1 | −1.8 | −10.2 |
| HMGCR | −2.6 | −12.6 |
| HSD17B7 | −1.4 | −2.5 |
| MVK | −1.4 | −2.6 |
| SC5D | −1.4 | −2.1 |
| NSDHL | −1.4 | −2.0 |
| MVD | - | −2.0 |
| LDLR | −2.0 | −12.7 |
| Circadian rhythm | ||
| PPARGC1A | 1.6 | 2.2 |
| PHLPP1 | −1.2 | −2.0 |
| NRIP1 | −1.4 | −2.2 |
| KLF9 | −1.4 | −2.5 |
| ETS1 | −1.6 | −2.7 |
| ID1 | - | −2.8 |
| KLF10 | - | −3.7 |
| EGR1 | −1.9 | −7.9 |
| PER1 | - | −1.8 |
| BHLHE40 | −1.8 | −12.5 |
| NR1D1 | - | −1.6 |
| Gene | 4-h LDL/Con 1 |
|---|---|
| Response to oxidative stress | |
| HMOX1 | 3.2 |
| GCLM | 1.6 |
| Lipid metabolism | |
| HMGCS1 | −2.0 |
| HMGCR | −2.1 |
| LDLR | −1.7 |
| Other | |
| PORCN | 2.3 |
| EHD3 | 2.0 |
| NUDT6 | −2.2 |
| Gene | 2-h OxLDL/Con 1 | 4-h OxLDL/Con 1 | 4-h LDL/Con 1 |
|---|---|---|---|
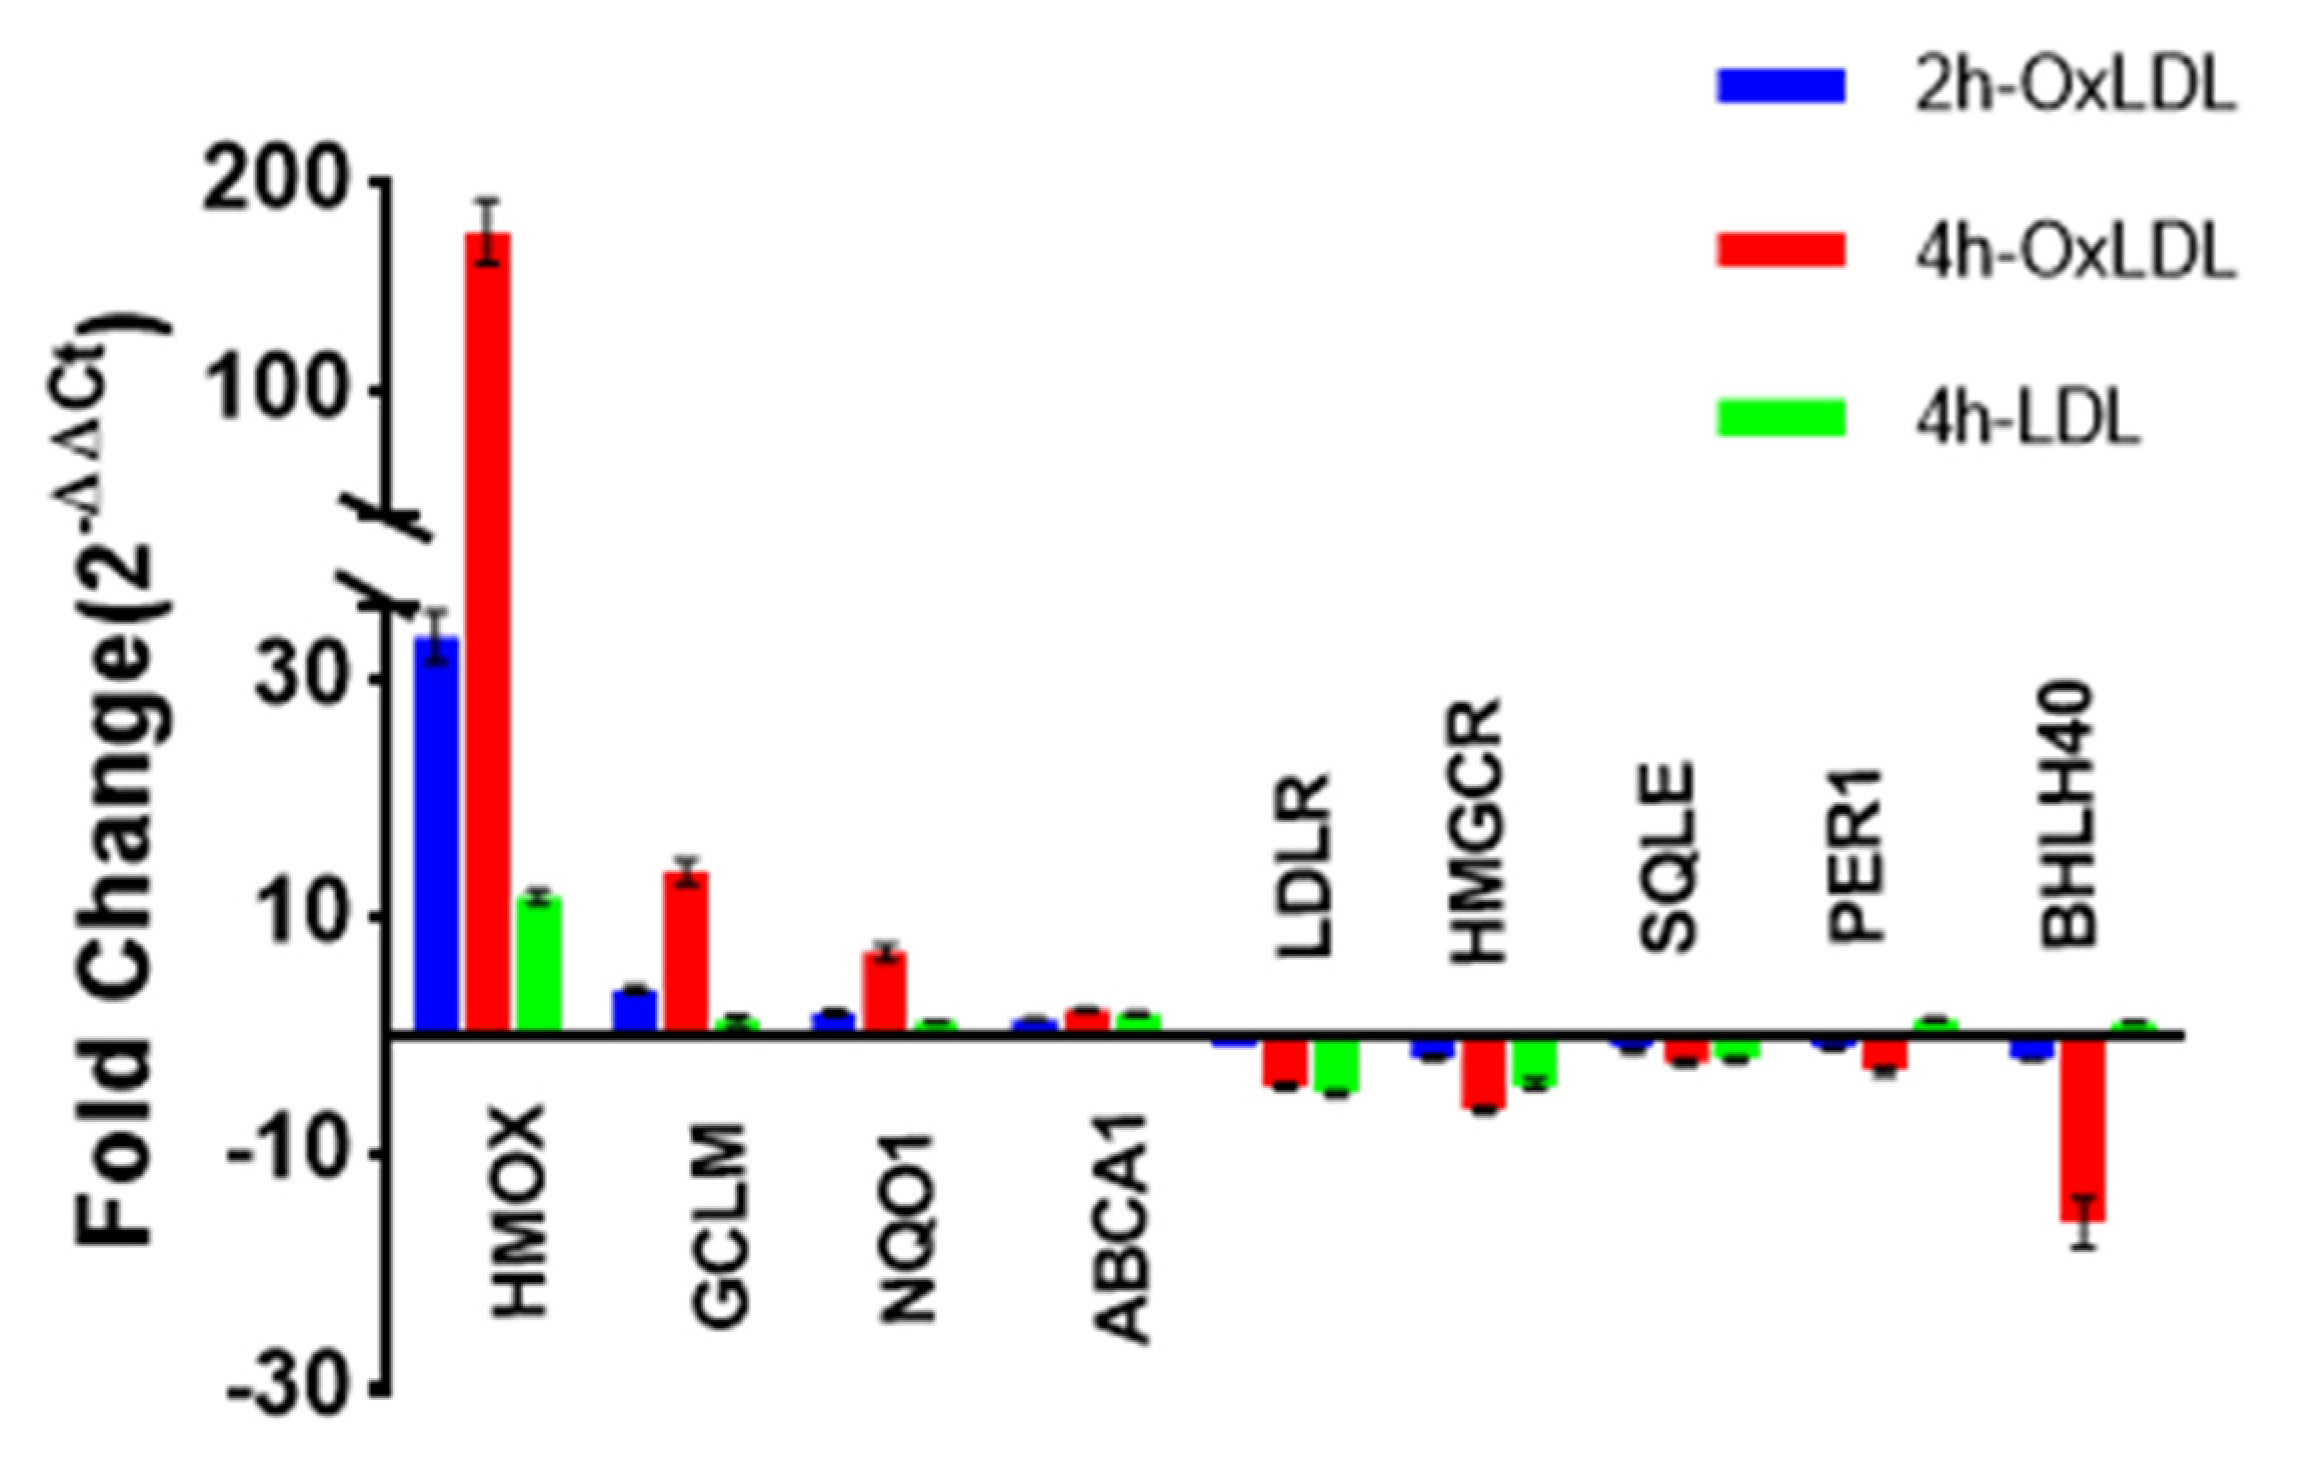
| HMOX1 | 34.3 *** | 175.7 *** | 11.9 *** |
| GCLM | 4.4 *** | 12.6 *** | 1.8 ** |
| NQO1 | 2.0 *** | 6.8 *** | 1.1 |
| HMGCR | −2.3 *** | −7.9 *** | −5.1 *** |
| ABCA1 | 1.3 *** | 2.1 *** | 1.9 *** |
| LDLR | −1.2 * | −4.7 *** | −5.4 *** |
| SQLE | −1.2 *** | −2.3 *** | −2.1 *** |
| BHLHE40 | −2.1 * | −15.9 *** | 1.0 * |
| PER1 | −1.1 *** | −3.1 *** | 1.2 |
Publisher’s Note: MDPI stays neutral with regard to jurisdictional claims in published maps and institutional affiliations. |
© 2020 by the authors. Licensee MDPI, Basel, Switzerland. This article is an open access article distributed under the terms and conditions of the Creative Commons Attribution (CC BY) license (http://creativecommons.org/licenses/by/4.0/).
Share and Cite
Koirala, D.; Beranova-Giorgianni, S.; Giorgianni, F. Early Transcriptomic Response to OxLDL in Human Retinal Pigment Epithelial Cells. Int. J. Mol. Sci. 2020, 21, 8818. https://doi.org/10.3390/ijms21228818
Koirala D, Beranova-Giorgianni S, Giorgianni F. Early Transcriptomic Response to OxLDL in Human Retinal Pigment Epithelial Cells. International Journal of Molecular Sciences. 2020; 21(22):8818. https://doi.org/10.3390/ijms21228818
Chicago/Turabian StyleKoirala, Diwa, Sarka Beranova-Giorgianni, and Francesco Giorgianni. 2020. "Early Transcriptomic Response to OxLDL in Human Retinal Pigment Epithelial Cells" International Journal of Molecular Sciences 21, no. 22: 8818. https://doi.org/10.3390/ijms21228818
APA StyleKoirala, D., Beranova-Giorgianni, S., & Giorgianni, F. (2020). Early Transcriptomic Response to OxLDL in Human Retinal Pigment Epithelial Cells. International Journal of Molecular Sciences, 21(22), 8818. https://doi.org/10.3390/ijms21228818