New In Vitro Model of Oxidative Stress: Human Prostate Cells Injured with 2,2-diphenyl-1-picrylhydrazyl (DPPH) for the Screening of Antioxidants


Abstract
1. Introduction
2. Results
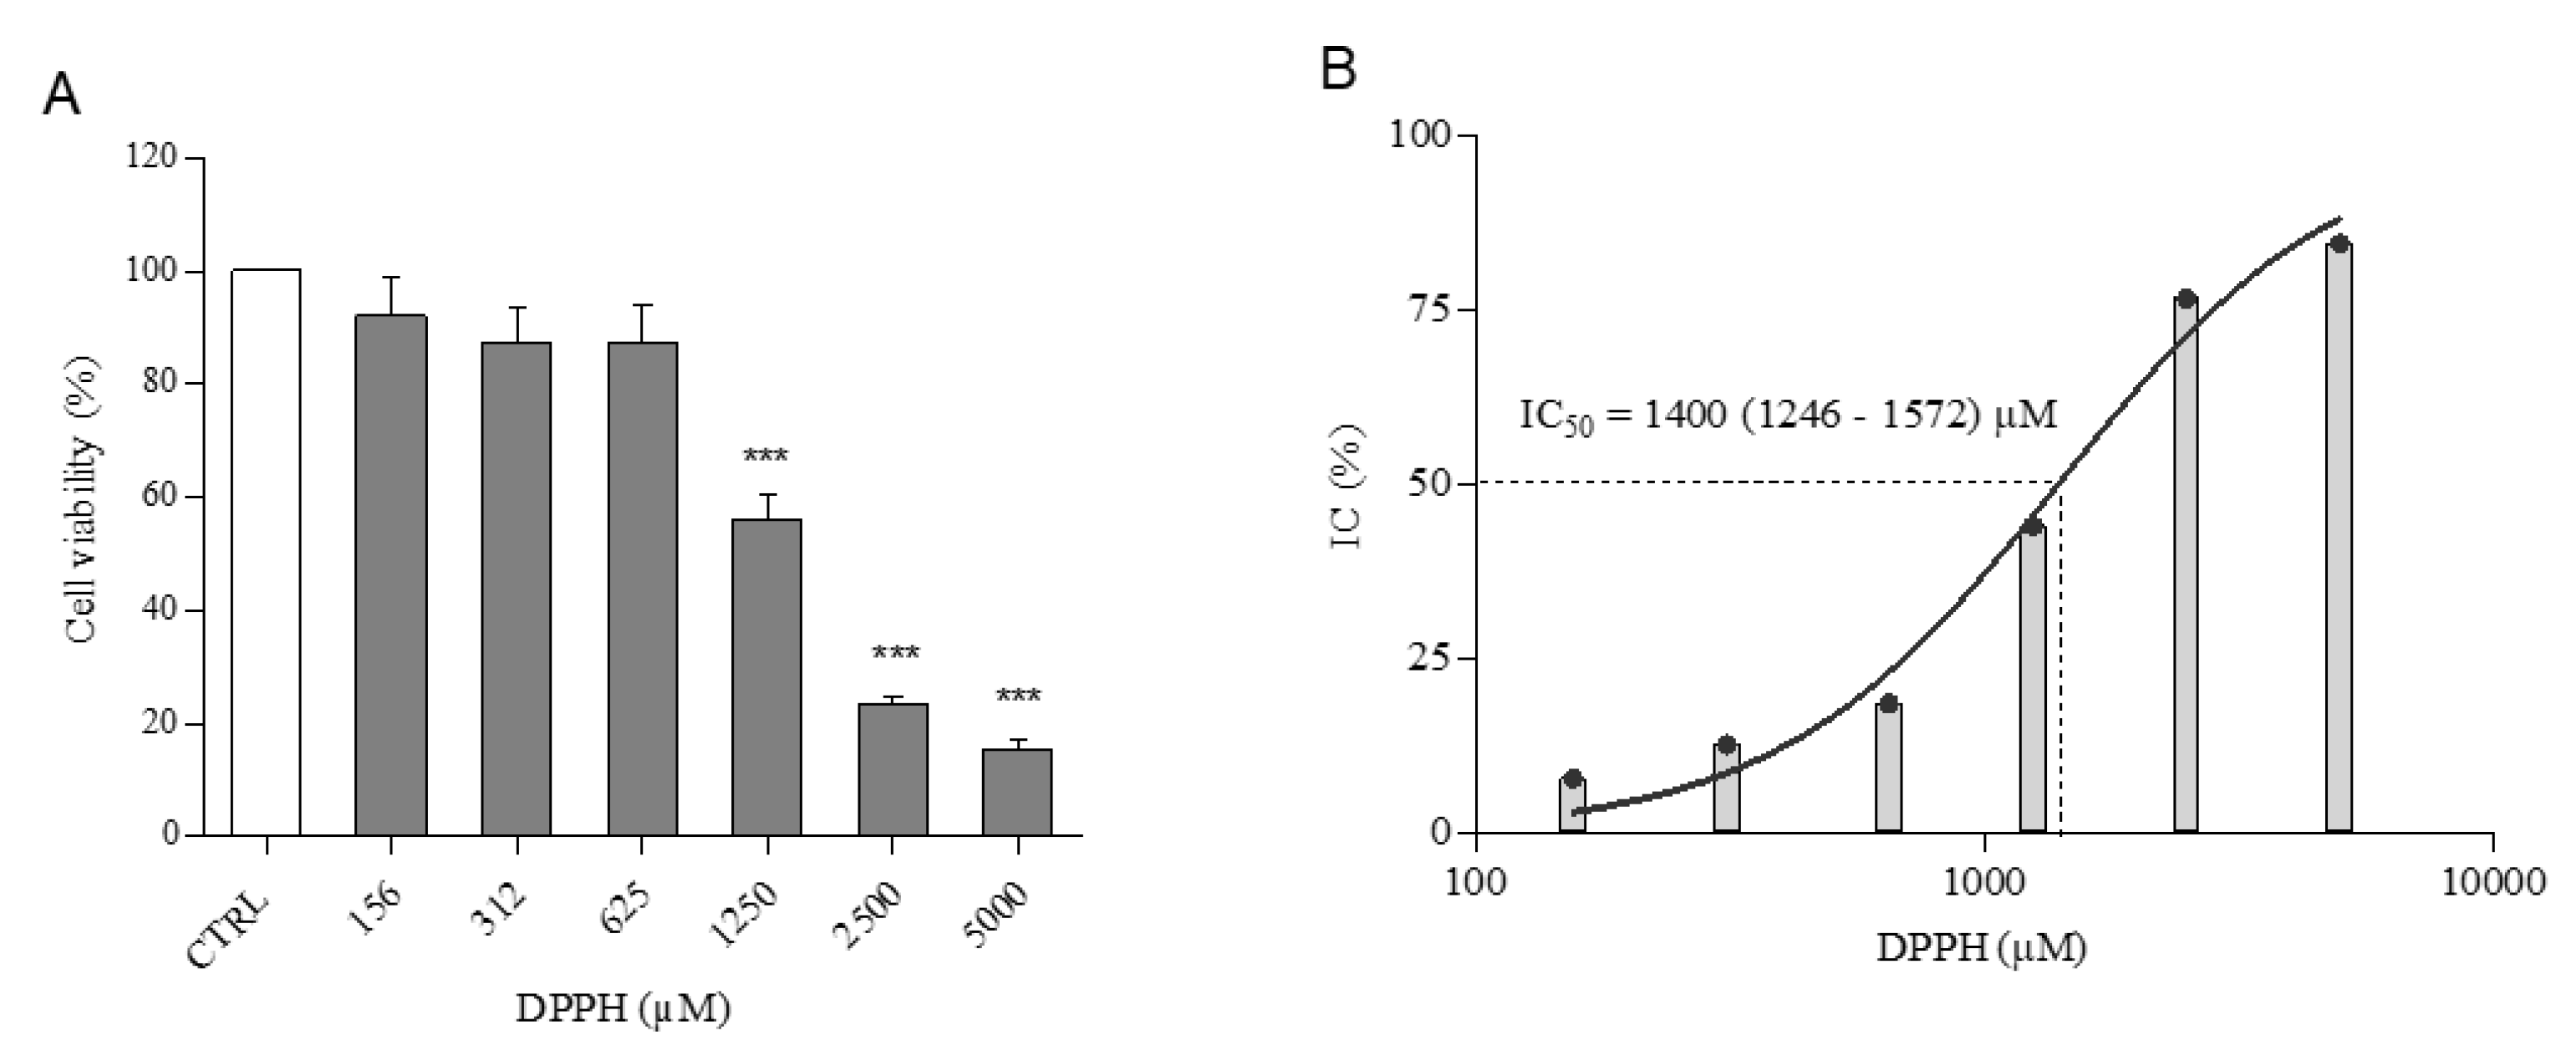
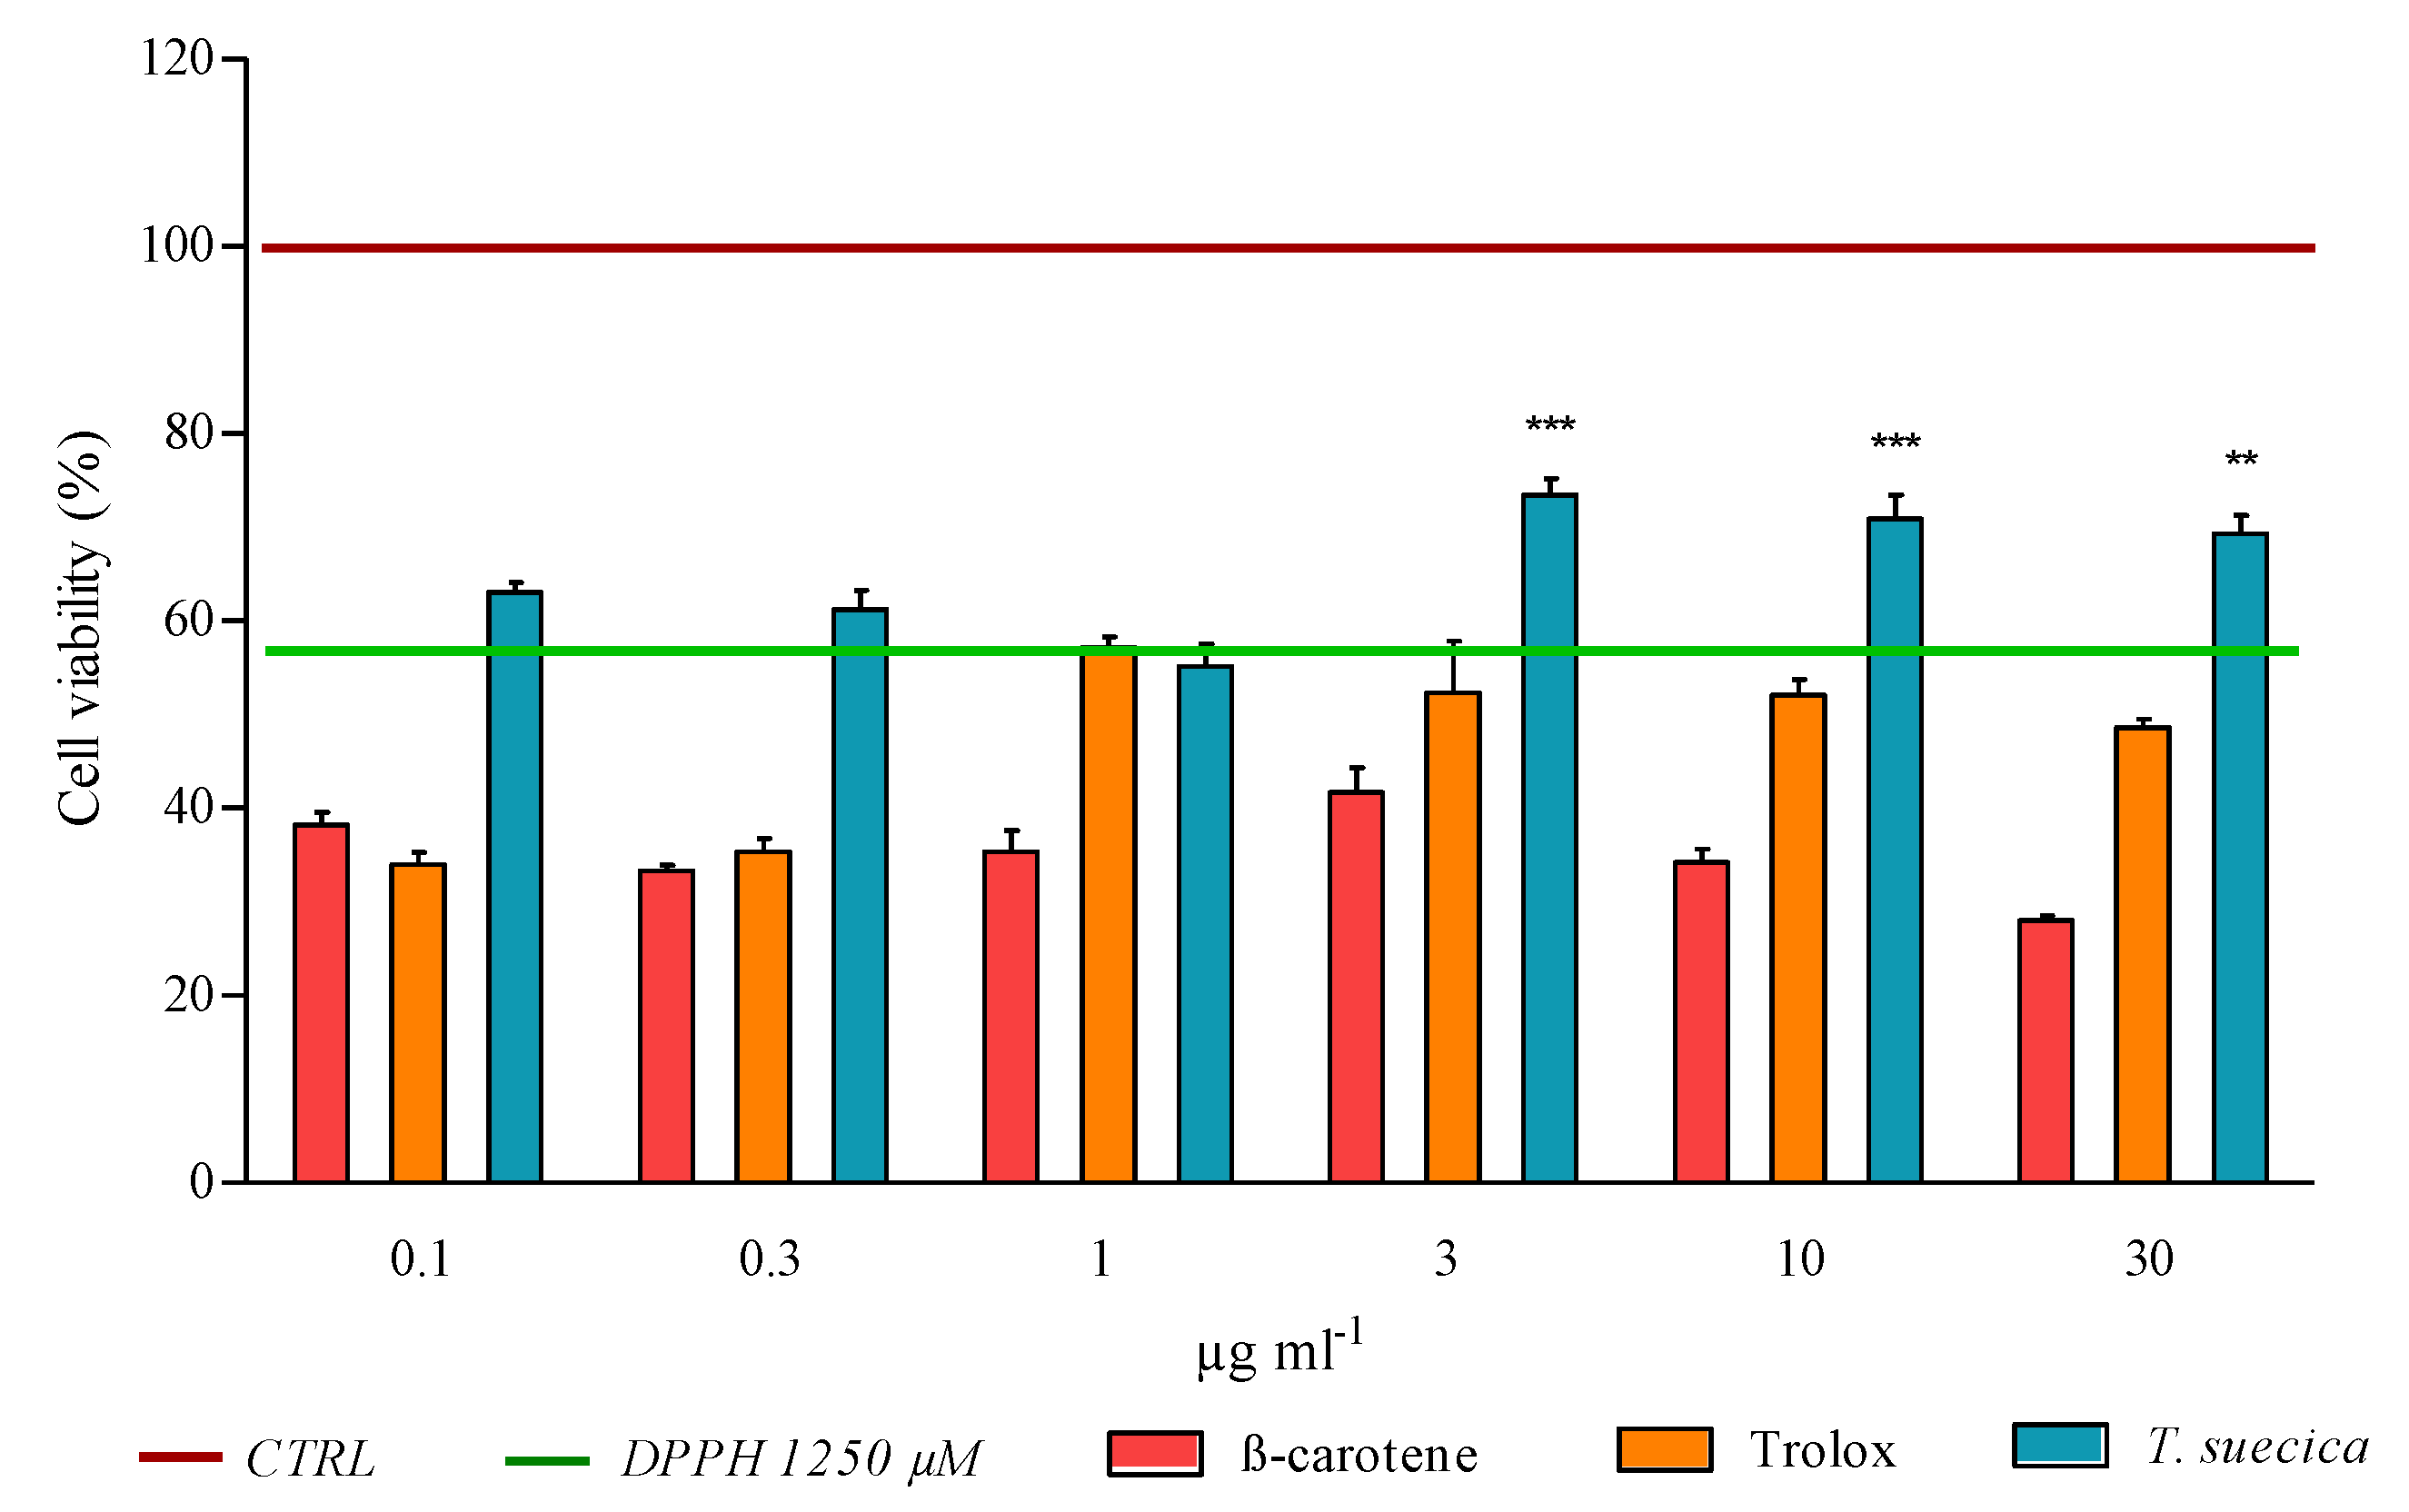
2.1. Cell Viability
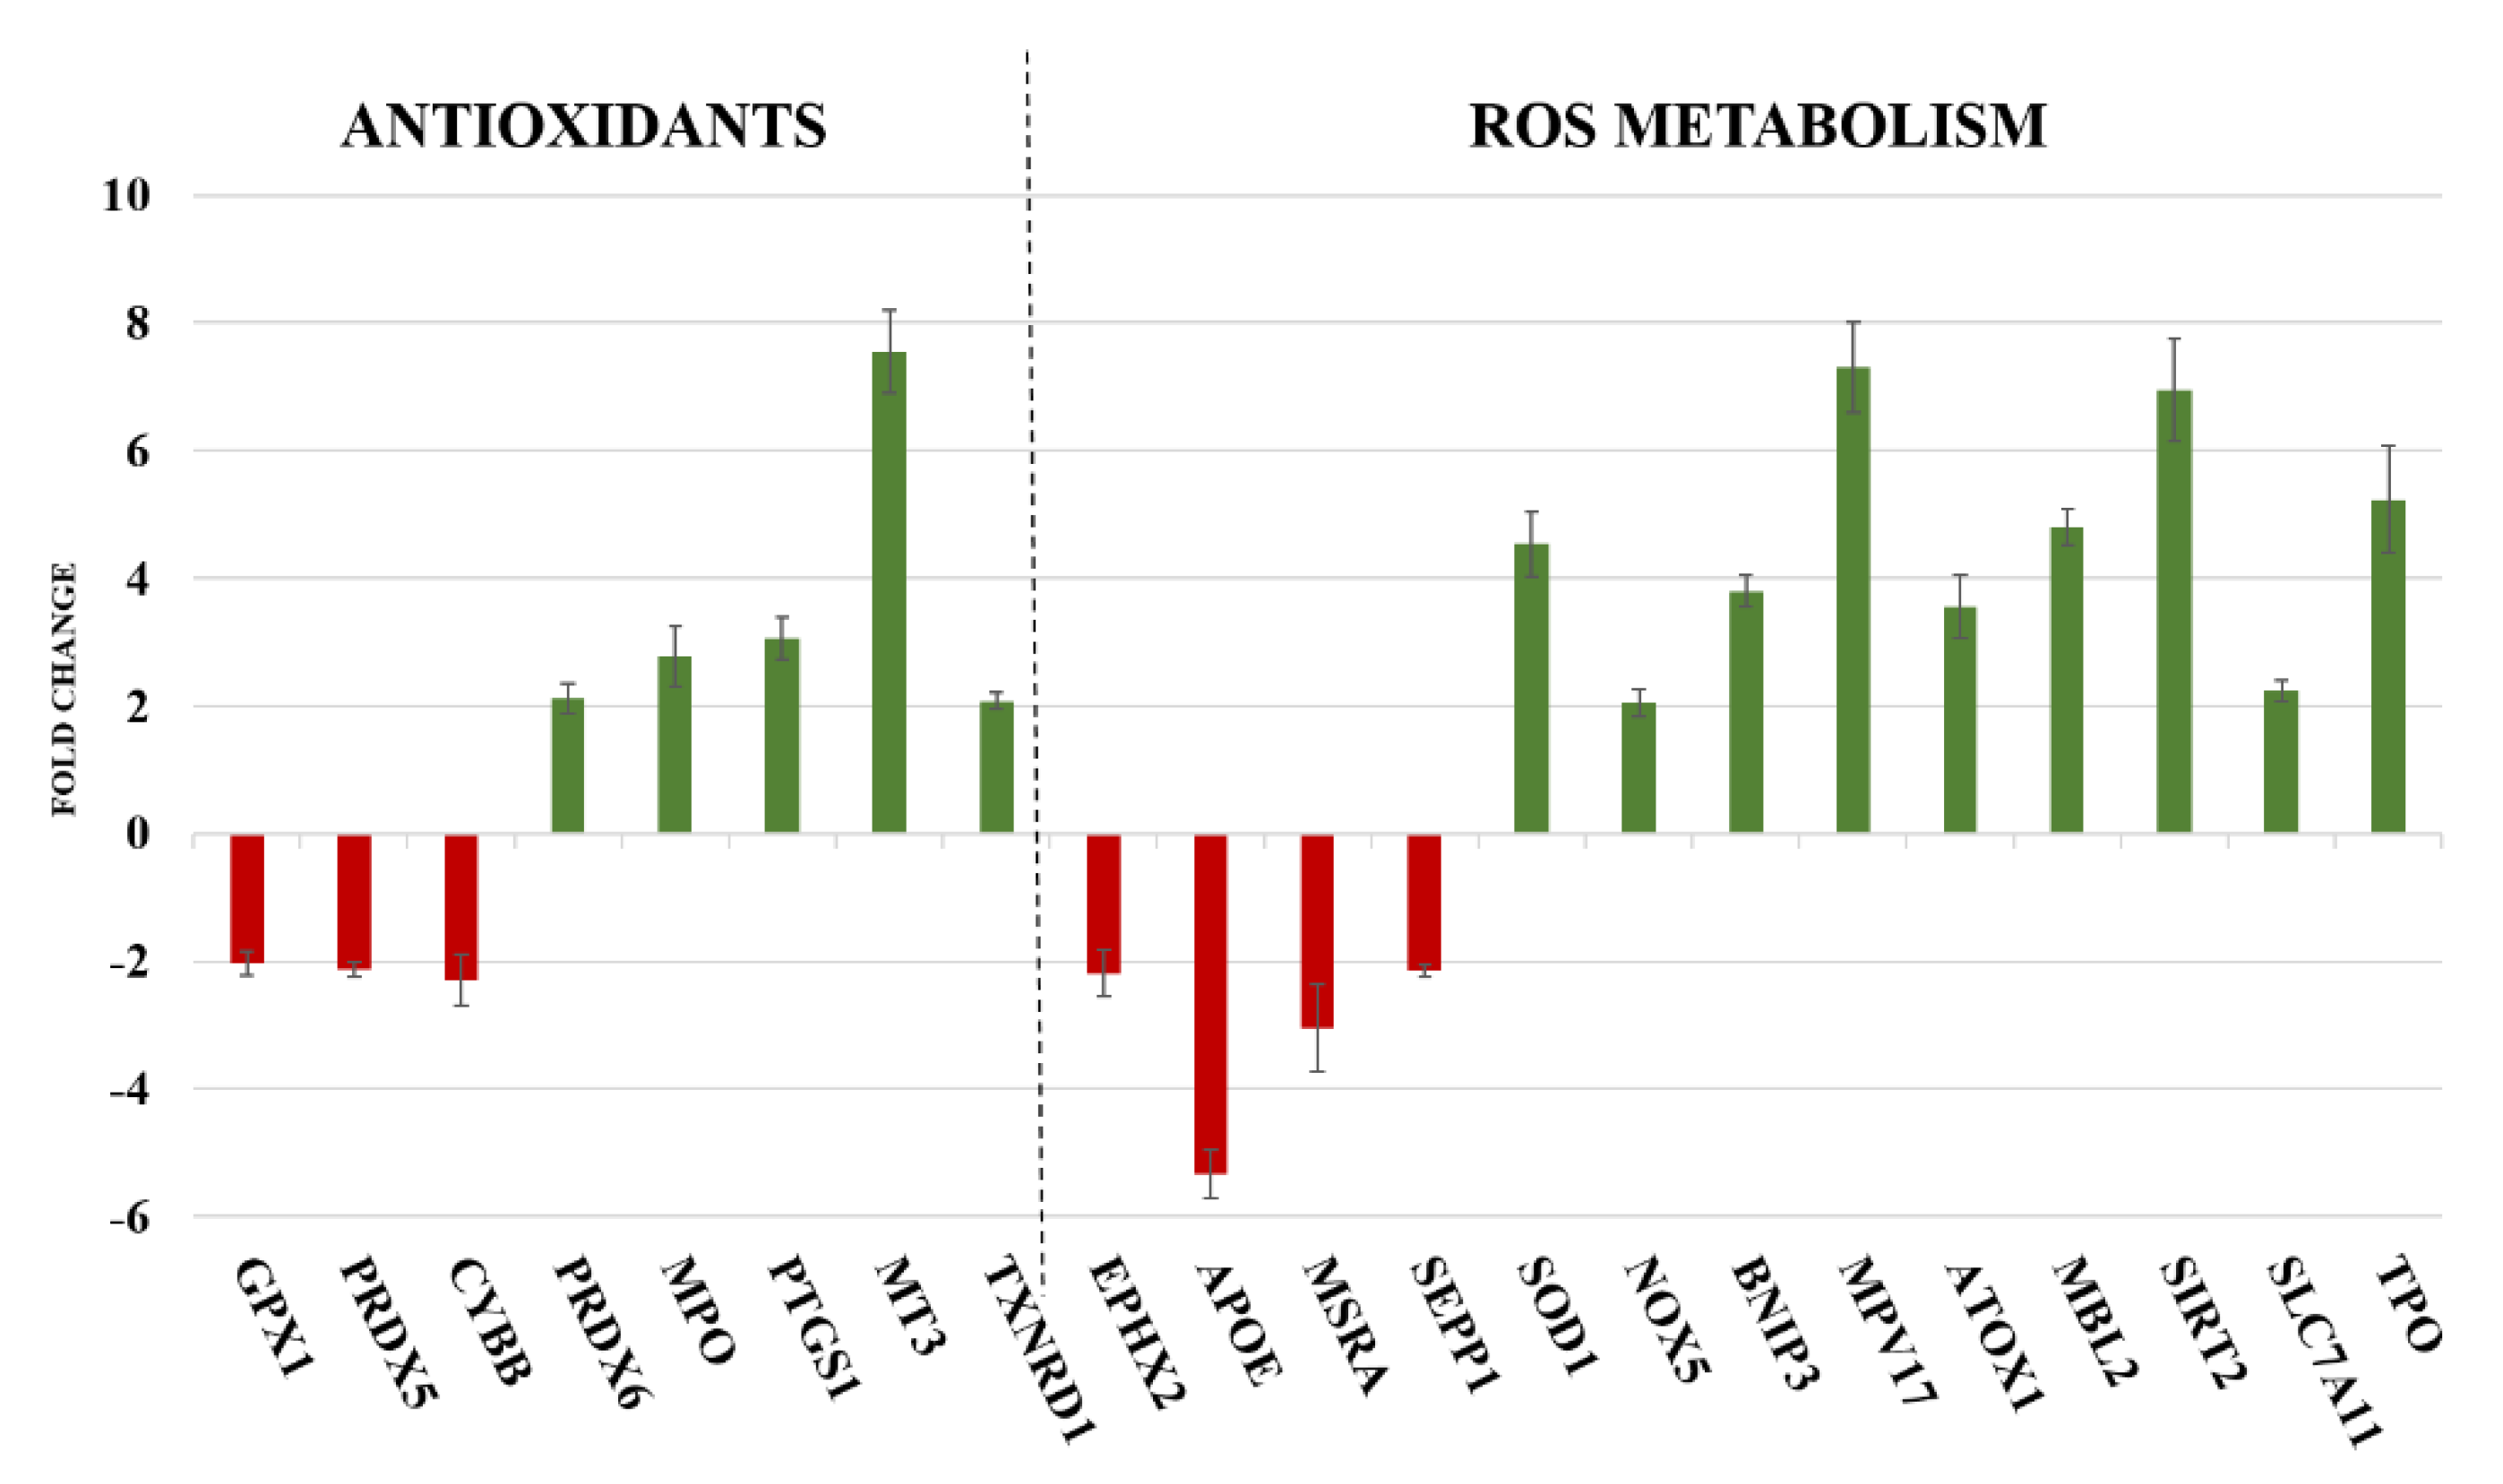
2.2. Gene Expression
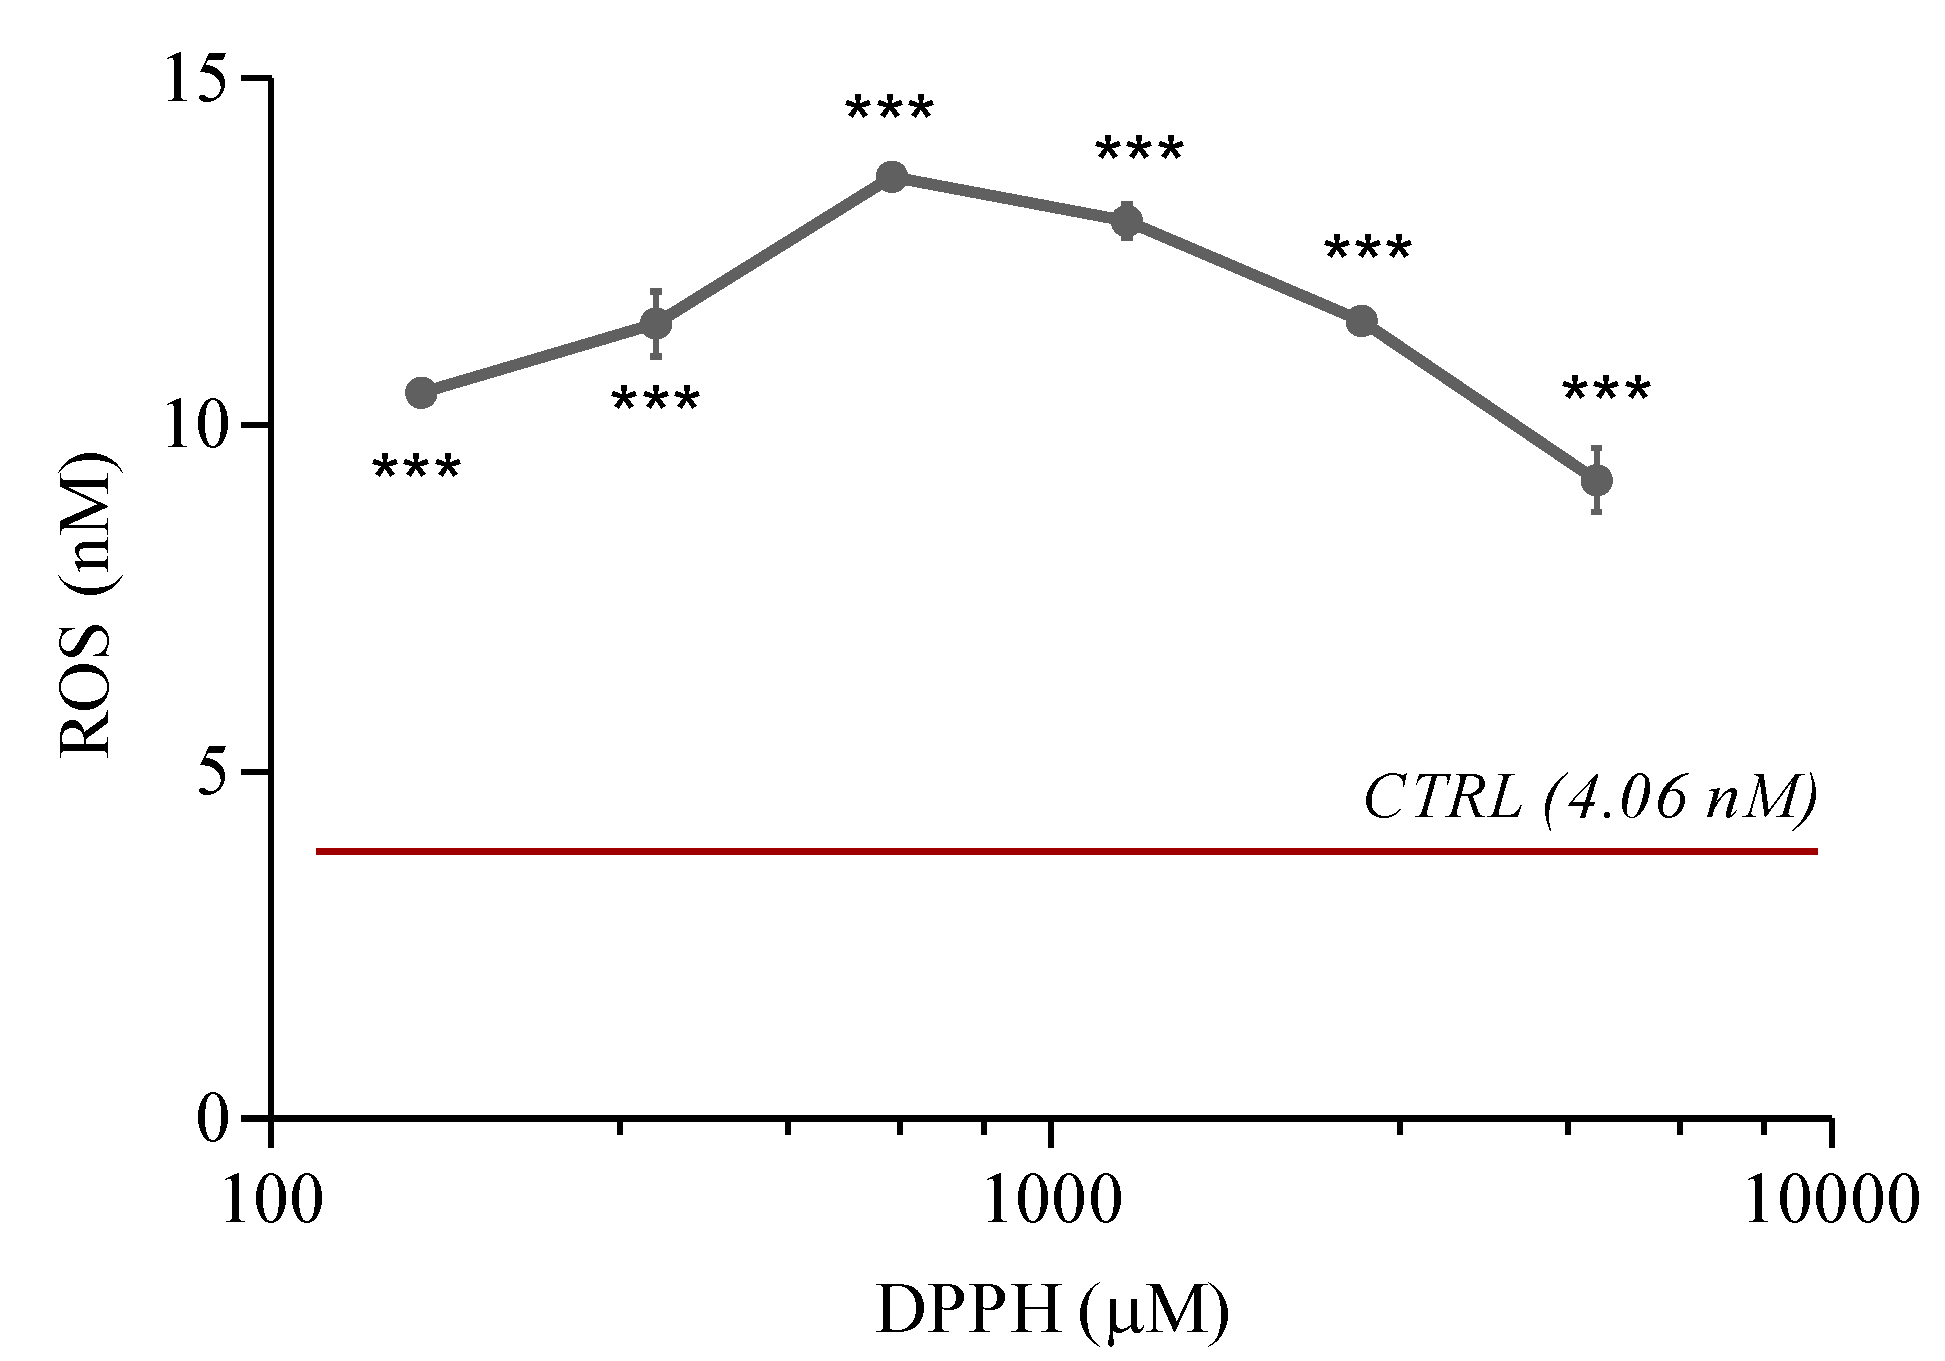
2.3. ROS Levels
2.4. Prostaglandin E2 Levels
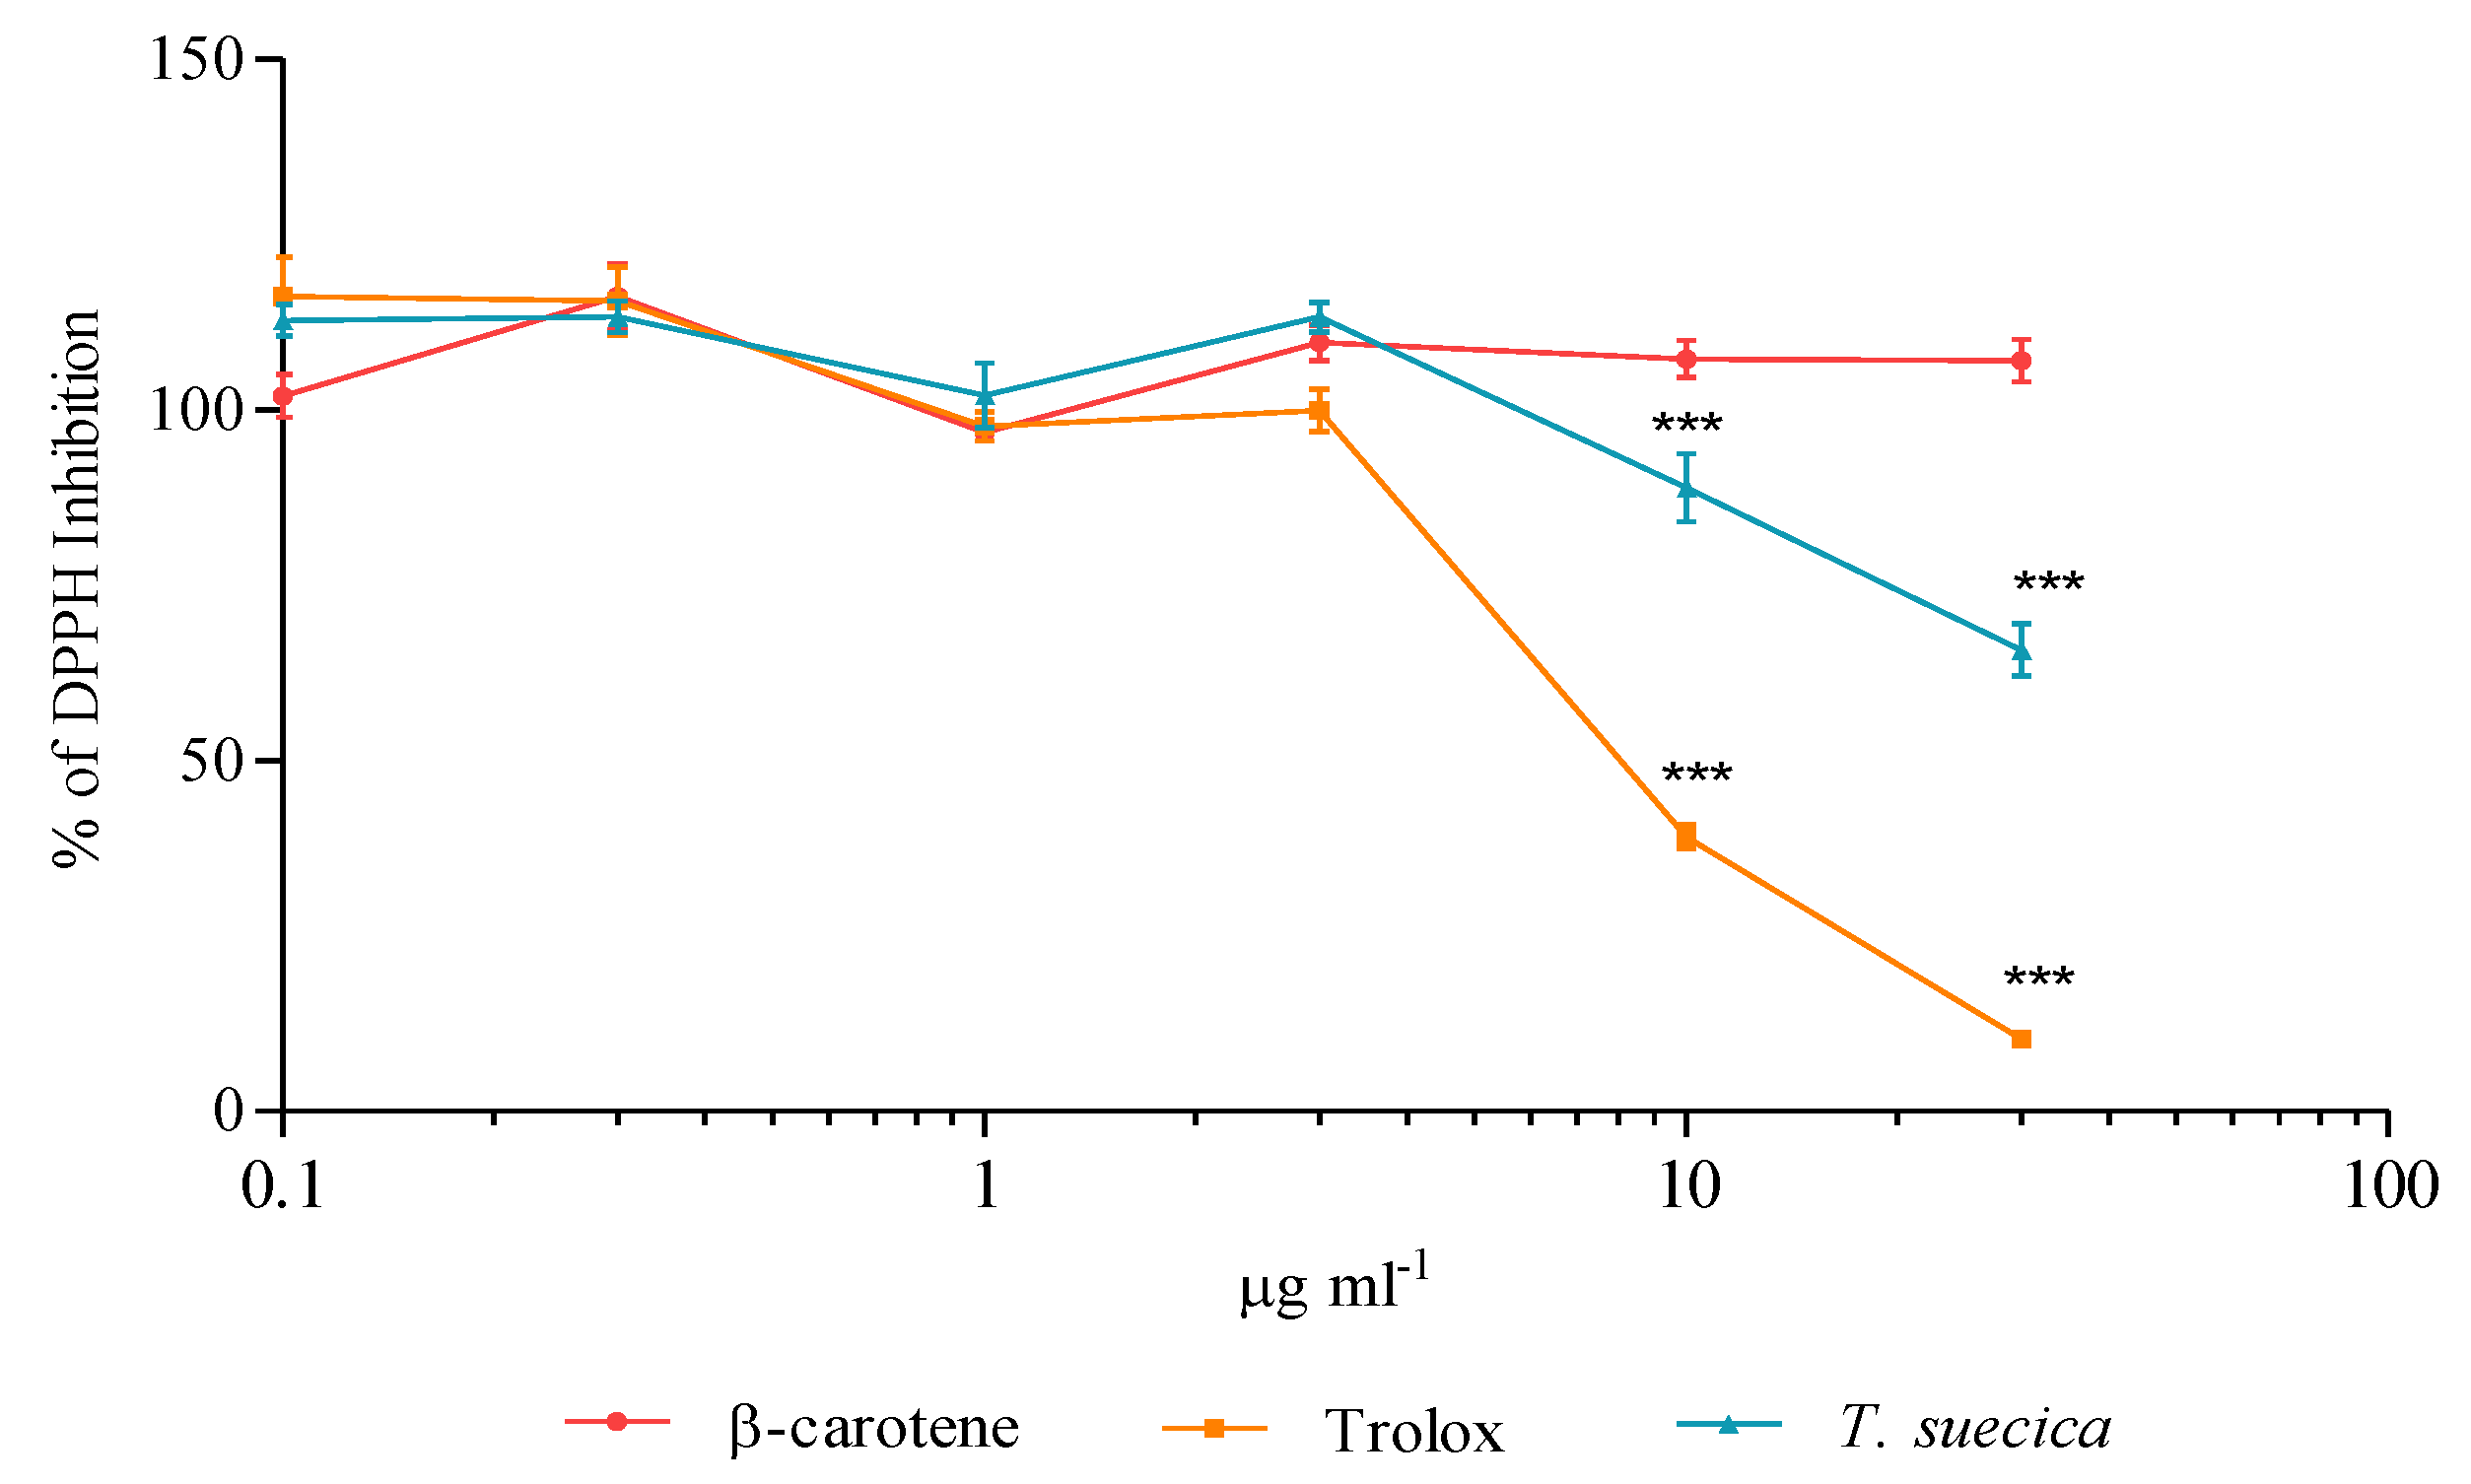
2.5. Radical Scavenging Capacity
2.6. In Vitro Scavenging Effect
2.7. Reduction in ROS Generation by the Treatments
3. Discussion
4. Materials and Methods
4.1. Preparation of the Samples for Treatments
4.2. Scavenging Activity against DPPH Radical
4.3. Culture and Treatments of Human Cells
4.4. MTT Viability Assays
4.5. RNA Extraction and Real-Time qPCR
4.6. ROS Assay
4.7. ELISA Assay for PGE2
4.8. Statistical Analysis
5. Conclusions
Supplementary Materials
Author Contributions
Funding
Conflicts of Interest
References
- Phaniendra, A.; Jestadi, D.B.; Periyasamy, L. Free Radicals: Properties, Sources, Targets, and Their Implication in Various Diseases. Indian J. Clin. Biochem. 2015, 30, 11–26. [Google Scholar] [CrossRef] [PubMed]
- Sena, L.A.; Chandel, N.S. Physiological Roles of Mitochondrial Reactive Oxygen Species. Mol. Cell 2012, 48, 158–167. [Google Scholar] [CrossRef] [PubMed]
- Gorrini, C.; Harris, I.S.; Mak, T.W. Modulation of oxidative stress as an anticancer strategy. Nat. Rev. Drug Discov. 2013, 12, 931–947. [Google Scholar] [CrossRef] [PubMed]
- Redza-Dutordoir, M.; Averill-Bates, D.A. Activation of apoptosis signalling pathways by reactive oxygen species. Biochim. Biophys. Acta (BBA) Bioenerg. 2016, 1863, 2977–2992. [Google Scholar] [CrossRef] [PubMed]
- Holzerová, E.; Prokisch, H. Mitochondria: Much ado about nothing? How dangerous is reactive oxygen species production? Int. J. Biochem. Cell Biol. 2015, 63, 16–20. [Google Scholar] [CrossRef]
- Bouayed, J.; Bohn, T. Exogenous Antioxidants—Double-Edged Swords in Cellular Redox State: Health Beneficial Effects at Physiologic Doses versus Deleterious Effects at High Doses. Oxidative Med. Cell. Longev. 2010, 3, 228–237. [Google Scholar] [CrossRef] [PubMed]
- Galasso, C.; Corinaldesi, C.; Sansone, C. Carotenoids from Marine Organisms: Biological Functions and Industrial Applications. Antioxidants 2017, 6, 96. [Google Scholar] [CrossRef]
- Galasso, C.; Nuzzo, G.; Brunet, C.; Ianora, A.; Sardo, A.; Fontana, A.; Sansone, C. The Marine Dinoflagellate Alexandrium minutum Activates a Mitophagic Pathway in Human Lung Cancer Cells. Mar. Drugs 2018, 16, 502. [Google Scholar] [CrossRef]
- Tan, B.L.; Norhaizan, M.E.; Liew, W.-P.-P.; Rahman, H.S. Antioxidant and Oxidative Stress: A Mutual Interplay in Age-Related Diseases. Front. Pharmacol. 2018, 9, 1162. [Google Scholar] [CrossRef]
- Galasso, C.; Gentile, A.; Orefice, I.; Ianora, A.; Bruno, A.; Noonan, D.M.; Sansone, C.; Albini, A.; Brunet, C. Microalgal Derivatives as Potential Nutraceutical and Food Supplements for Human Health: A Focus on Cancer Prevention and Interception. Nutrients 2019, 11, 1226. [Google Scholar] [CrossRef]
- Huang, D.; Boxin, O.U.; Prior, R.L. The Chemistry behind Antioxidant Capacity Assays. J. Agric. Food Chem. 2005, 53, 1841–1856. [Google Scholar] [CrossRef] [PubMed]
- Craft, B.D.; Kerrihard, A.L.; Amarowicz, R.; Pegg, R.B. Phenol-Based Antioxidants and the In Vitro Methods Used for Their Assessment. Compr. Rev. Food Sci. Food Saf. 2012, 11, 148–173. [Google Scholar] [CrossRef]
- Kedare, S.B.; Singh, R.P. Genesis and development of DPPH method of antioxidant assay. J. Food Sci. Technol. 2011, 48, 412–422. [Google Scholar] [CrossRef] [PubMed]
- Jones, D.P. Redefining Oxidative Stress. Antioxid. Redox Signal. 2006, 8, 1865–1879. [Google Scholar] [CrossRef] [PubMed]
- López-Alarcón, C.; DeNicola, A. Evaluating the antioxidant capacity of natural products: A review on chemical and cellular-based assays. Anal. Chim. Acta 2013, 763, 1–10. [Google Scholar] [CrossRef]
- Kellett, M.E.; Greenspan, P.; Pegg, R.B. Modification of the cellular antioxidant activity (CAA) assay to study phenolic antioxidants in a Caco-2 cell line. Food Chem. 2018, 244, 359–363. [Google Scholar] [CrossRef]
- Akanitapichat, P.; Phraibung, K.; Nuchklang, K.; Prompitakkul, S. Antioxidant and hepatoprotective activities of five eggplant varieties. Food Chem. Toxicol. 2010, 48, 3017–3021. [Google Scholar] [CrossRef]
- Halliwell, B. Oxidative stress and cancer: Have we moved forward? Biochem. J. 2007, 401, 1–11. [Google Scholar] [CrossRef]
- Mahmoud, E.A.; Sankaranarayanan, J.; Morachis, J.M.; Kim, G.; Almutairi, A. Inflammation Responsive Logic Gate Nanoparticles for the Delivery of Proteins. Bioconjugate Chem. 2011, 22, 1416–1421. [Google Scholar] [CrossRef]
- De Gracia Lux, C.D.G.; Joshi-Barr, S.; Nguyen, T.; Mahmoud, E.; Schopf, E.; Fomina, N.; Almutairi, A. Biocompatible Polymeric Nanoparticles Degrade and Release Cargo in Response to Biologically Relevant Levels of Hydrogen Peroxide. J. Am. Chem. Soc. 2012, 134, 15758–15764. [Google Scholar] [CrossRef]
- Sansone, C.; Galasso, C.; Orefice, I.; Nuzzo, G.; Luongo, E.; Cutignano, A.; Romano, G.; Brunet, C.; Fontana, A.; Esposito, F.; et al. The green microalga Tetraselmis suecica reduces oxidative stress and induces repairing mechanisms in human cells. Sci. Rep. 2017, 7, 41215. [Google Scholar] [CrossRef]
- Wang, S.; Sun, N.N.; Zhang, J.; Watson, R.R.; Witten, M.L. Immunomodulatory effects of high-dose α-tocopherol acetate on mice subjected to sidestream cigarette smoke. Toxicology 2002, 175, 235–245. [Google Scholar] [CrossRef]
- Messier, E.M.; Bahmed, K.; Tuder, R.M.; Chu, H.W.; Bowler, R.P.; Kosmider, B. Trolox contributes to Nrf2-mediated protection of human and murine primary alveolar type II cells from injury by cigarette smoke. Cell Death Dis. 2013, 4, e573. [Google Scholar] [CrossRef]
- Müller, L.; Fröhlich, K.; Böhm, V. Comparative antioxidant activities of carotenoids measured by ferric reducing antioxidant power (FRAP), ABTS bleaching assay (αTEAC), DPPH assay and peroxyl radical scavenging assay. Food Chem. 2011, 129, 139–148. [Google Scholar] [CrossRef]
- Liguori, I.; Russo, G.; Curcio, F.; Bulli, G.; Aran, L.; Della-Morte, D.; Gargiulo, G.; Testa, G.; Cacciatore, F.; Bonaduce, D.; et al. Oxidative stress, aging, and diseases. Clin. Interv. Aging 2018, 13, 757–772. [Google Scholar] [CrossRef]
- Roumeguère, T.; Sfeir, J.; El Rassy, E.; Albisinni, S.; Van Antwerpen, P.; Boudjeltia, K.Z.; Farès, N.; Kattan, J.; Aoun, F. Oxidative stress and prostatic diseases. Mol. Clin. Oncol. 2017, 7, 723–728. [Google Scholar] [CrossRef]
- Ruscica, M.; Botta, M.; Ferri, N.; Giorgio, E.; Macchi, C.; Franceschini, G.; Magni, P.; Calabresi, L.; Gomaraschi, M. High Density Lipoproteins Inhibit Oxidative Stress-Induced Prostate Cancer Cell Proliferation. Sci. Rep. 2018, 8, 1–12. [Google Scholar] [CrossRef] [PubMed]
- Fatma, N.; Kubo, E.; Toris, C.B.; Stamer, W.D.; Camras, C.B.; Singh, D.P. PRDX6 attenuates oxidative stress- and TGFbeta-induced abnormalities of human trabecular meshwork cells. Free. Radic. Res. 2009, 43, 783–795. [Google Scholar] [CrossRef] [PubMed]
- Dato, S.; De Rango, F.; Crocco, P.; Passarino, G.; Rose, G. Antioxidants and Quality of Aging: Further Evidences for a Major Role of TXNRD1 Gene Variability on Physical Performance at Old Age. Oxidative Med. Cell. Longev. 2015, 2015, 1–7. [Google Scholar] [CrossRef] [PubMed]
- Yu, J.-T.; Liu, Y.; Dong, P.; Cheng, R.-E.; Ke, S.-X.; Chen, K.-Q.; Wang, J.-J.; Shen, Z.-S.; Tang, Q.-Y.; Zhang, Z. Up-regulation of antioxidative proteins TRX1, TXNL1 and TXNRD1 in the cortex of PTZ kindling seizure model mice. PLoS ONE 2019, 14, e0210670. [Google Scholar] [CrossRef]
- Tsang, C.K.; Liu, Y.; Thomas, J.; Zhang, Y.; Zheng, X.F.S. Superoxide dismutase 1 acts as a nuclear transcription factor to regulate oxidative stress resistance. Nat. Commun. 2014, 5, 3446. [Google Scholar] [CrossRef] [PubMed]
- Smyth, P.P.A. Role of iodine in antioxidant defence in thyroid and breast disease. BioFactors 2003, 19, 121–130. [Google Scholar] [CrossRef] [PubMed]
- Basu, A.; Drame, A.; Muñoz, R.; Gijsbers, R.; Debyser, Z.; De Leon, M.; Casiano, C.A. Pathway specific gene expression profiling reveals oxidative stress genes potentially regulated by transcription co-activator LEDGF/p75 in prostate cancer cells. Prostate 2011, 72, 597–611. [Google Scholar] [CrossRef] [PubMed]
- Li, J.; Luo, J.; Zhang, Y.; Tang, C.; Wang, J.; Chen, C. Silencing of soluble epoxide hydrolase 2 gene reduces H2O2-induced oxidative damage in rat intestinal epithelial IEC-6 cells via activating PI3K/Akt/GSK3β signaling pathway. Cytotechnology 2020, 72, 23–36. [Google Scholar] [CrossRef] [PubMed]
- Ruttkay-Nedecky, B.; Nejdl, L.; Gumulec, J.; Zitka, O.; Masarik, M.; Eckschlager, T.; Stiborová, M.; Adam, V.; Kizek, R. The Role of Metallothionein in Oxidative Stress. Int. J. Mol. Sci. 2013, 14, 6044–6066. [Google Scholar] [CrossRef]
- Anatoliotakis, N.; Deftereos, S.; Bouras, G.; Giannopoulos, G.; Tsounis, D.; Angelidis, C.; Kaoukis, A.; Stefanadis, C. Myeloperoxidase: Expressing Inflammation and Oxidative Stress in Cardiovascular Disease. Curr. Top. Med. Chem. 2013, 13, 115–138. [Google Scholar] [CrossRef]
- Knoops, B.; Argyropoulou, V.; Becker, S.; Ferté, L.; Kuznetsova, O. Multiple Roles of Peroxiredoxins in Inflammation. Mol. Cells 2016, 39, 60–64. [Google Scholar] [CrossRef]
- Hatori, Y.; Lutsenko, S. The Role of Copper Chaperone Atox1 in Coupling Redox Homeostasis to Intracellular Copper Distribution. Antioxidants 2016, 5, 25. [Google Scholar] [CrossRef]
- Kim, S.-H.; Bae, S.-J.; Palikhe, S.; Ye, Y.-M.; Park, H.-S. Effects of MBL2 polymorphisms in patients with diisocyanate-induced occupational asthma. Exp. Mol. Med. 2015, 47, e157. [Google Scholar] [CrossRef]
- Burton, T.R.; Gibson, S.B. The role of Bcl-2 family member BNIP3 in cell death and disease: NIPping at the heels of cell death. Cell Death Differ. 2009, 16, 515–523. [Google Scholar] [CrossRef]
- Koppula, P.; Zhang, Y.; Zhuang, L.; Gan, B. Amino acid transporter SLC7A11/xCT at the crossroads of regulating redox homeostasis and nutrient dependency of cancer. Cancer Commun. 2018, 38, 12–13. [Google Scholar] [CrossRef]
- Casalena, G.; Krick, S.; Daehn, I.S.; Yu, L.; Ju, W.; Shi, S.; Tsai, S.-Y.; D’Agati, V.; Lindenmeyer, M.; Cohen, C.D.; et al. Mpv17 in mitochondria protects podocytes against mitochondrial dysfunction and apoptosis in vivo and in vitro. Am. J. Physiol. Physiol. 2014, 306, F1372–F1380. [Google Scholar] [CrossRef]
- Singh, C.K.; Chhabra, G.; Ndiaye, M.A.; Garcia-Peterson, L.M.; Mack, N.J.; Ahmad, N. The Role of Sirtuins in Antioxidant and Redox Signaling. Antioxid. Redox Signal. 2018, 28, 643–661. [Google Scholar] [CrossRef]
- Gallelli, L.; Falcone, D.; Scaramuzzino, M.; Pelaia, G.; D’Agostino, B.; Mesuraca, M.; Terracciano, R.; Spaziano, G.; Maselli, R.; Navarra, M.; et al. Effects of simvastatin on cell viability and proinflammatory pathways in lung adenocarcinoma cells exposed to hydrogen peroxide. BMC Pharmacol. Toxicol. 2014, 15, 67. [Google Scholar] [CrossRef] [PubMed]
- Wang, W.; Zheng, J.; Zhu, S.-X.; Guan, W.-J.; Chen, M.; Zhong, N.-S. Carbocisteine attenuates hydrogen peroxide-induced inflammatory injury in A549 cells via NF-κB and ERK1/2 MAPK pathways. Int. Immunopharmacol. 2015, 24, 306–313. [Google Scholar] [CrossRef]
- Nenadis, N.; Lazaridou, A.O.; Tsimidou, M.Z. Use of Reference Compounds in Antioxidant Activity Assessment. J. Agric. Food Chem. 2007, 55, 5452–5460. [Google Scholar] [CrossRef] [PubMed]
- Kawata, A.; Murakami, Y.; Suzuki, S.; Fujisawa, S. Anti-inflammatory Activity of β-Carotene, Lycopene and Tri-n-butylborane, a Scavenger of Reactive Oxygen Species. Vivo 2018, 32, 255–264. [Google Scholar] [CrossRef]
- Caesar, J.; Tamm, A.; Ruckteschler, N.; Leifke, A.L.; Weber, B. Revisiting chlorophyll extraction methods in biological soil crusts—Methodology for determination of chlorophyll a and chlorophyll a + b as compared to previous methods. Biogeosciences 2018, 15, 1415–1424. [Google Scholar] [CrossRef]
- Sricharoen, P.; Techawongstein, S.; Chanthai, S. A high correlation indicating for an evaluation of antioxidant activity and total phenolics content of various chilli varieties. J. Food Sci. Technol. 2015, 52, 8077–8085. [Google Scholar] [CrossRef]
- PCR Array Data Analysis Online Software by, Qiagen. Available online: https://geneglobe.qiagen.com/it/analyze/ (accessed on 10 November 2020).


| GENE | Function | References |
|---|---|---|
| OXIDATIVE STRESS | ||
| PRDX6 | It encodes for an enzyme able to reduce hydroperoxides, protecting cells against oxidative injuries | [28] |
| TXNRD1 | It reduces thioredoxins and other small redox proteins, contributing to redox homoeostasis | [29,30] |
| SOD1 | It encodes for one of the three members of superoxide dismutases family, able to initiate the elimination of superoxide radicals in cells | [31] |
| NOX5 | It encodes for an oxidase involved in the production of ROS | [30] |
| TPO | It is a thyroid specific gene connected with peroxiredoxin gene family members and SODs genes, involved in the reduction of deleterious effects of ROS | [32,33] |
| EPHX2 | It belongs to epoxide hydrolase family and silenced gene prevents prooxidants-induced cell damages | [34] |
| MT3 | It reacts with oxidising agents, reducing levels of these harmful molecules | [35] |
| INFLAMMATION | ||
| MPO | It is implicated in the induction of inflammatory process and is connected with PTGS1 gene | [36] |
| PTGS1 | It is involved in the synthesis of prostaglandin E2 (PGE2), an inflammatory mediator with cytoprotective and antioxidant functions | [37] |
| ATOX1 | It contributes to inflammatory response and to defend cells against many free radical species | [38] |
| MBL2 | It interconnects oxidative stress, inflammation and activation of immune system | [39] |
| SURVIVAL/CELL DEATH | ||
| BNIP3 | It controls survival/death mechanisms; it can promote cell survival if cell reduce oxidative stress or trigger necrosis, autophagy or apoptosis when oxidative injuries compromise cell functions | [40] |
| SLC7A11 | It is responsible of glutathione biosynthesis and participates of protection mechanisms against oxidative injuries and regulation of ferroptotic cell death | [41] |
| MPV17 | It activates peroxisomal ROS metabolism; its activity is essential to avoid mitochondrial dysfunction and cell death | [42] |
| SIRT2 | It protects mitochondria and DNA from oxidative damages; if oxidative stress causes severe damages, it act as pro-apoptotic factor | [43] |
Publisher’s Note: MDPI stays neutral with regard to jurisdictional claims in published maps and institutional affiliations. |
© 2020 by the authors. Licensee MDPI, Basel, Switzerland. This article is an open access article distributed under the terms and conditions of the Creative Commons Attribution (CC BY) license (http://creativecommons.org/licenses/by/4.0/).
Share and Cite
Galasso, C.; Piscitelli, C.; Brunet, C.; Sansone, C. New In Vitro Model of Oxidative Stress: Human Prostate Cells Injured with 2,2-diphenyl-1-picrylhydrazyl (DPPH) for the Screening of Antioxidants. Int. J. Mol. Sci. 2020, 21, 8707. https://doi.org/10.3390/ijms21228707
Galasso C, Piscitelli C, Brunet C, Sansone C. New In Vitro Model of Oxidative Stress: Human Prostate Cells Injured with 2,2-diphenyl-1-picrylhydrazyl (DPPH) for the Screening of Antioxidants. International Journal of Molecular Sciences. 2020; 21(22):8707. https://doi.org/10.3390/ijms21228707
Chicago/Turabian StyleGalasso, Christian, Concetta Piscitelli, Christophe Brunet, and Clementina Sansone. 2020. "New In Vitro Model of Oxidative Stress: Human Prostate Cells Injured with 2,2-diphenyl-1-picrylhydrazyl (DPPH) for the Screening of Antioxidants" International Journal of Molecular Sciences 21, no. 22: 8707. https://doi.org/10.3390/ijms21228707
APA StyleGalasso, C., Piscitelli, C., Brunet, C., & Sansone, C. (2020). New In Vitro Model of Oxidative Stress: Human Prostate Cells Injured with 2,2-diphenyl-1-picrylhydrazyl (DPPH) for the Screening of Antioxidants. International Journal of Molecular Sciences, 21(22), 8707. https://doi.org/10.3390/ijms21228707