Article

Respiratory Burst Oxidase Homologs RBOHD and RBOHF as Key Modulating Components of Response in Turnip Mosaic Virus—Arabidopsis thaliana (L.) Heyhn System

by
Katarzyna Otulak-Kozieł
1,*,
Edmund Kozieł
1,*,
Józef Julian Bujarski
2,
Justyna Frankowska-Łukawska
1 and
Miguel Angel Torres
3,4
1
Department of Botany, Institute of Biology, Warsaw University of Life Sciences—SGGW, Nowoursynowska Street 159, 02-776 Warsaw, Poland
2
Department of Biological Sciences, Northern Illinois University, DeKalb, IL 60115, USA
3
Centro de Biotecnología y Genómica de Plantas (CBGP), Universidad Politécnica de Madrid (UPM)—Instituto Nacional de Investigacióny Tecnología Agraria y Alimentaria (INIA), Campus de Montegancedo, 28223 Pozuelo de Alarcón (Madrid), Spain
4
Departamento deBiotecnología-Biología Vegetal, Escuela Técnica Superior de Ingeniería Agronómica, Alimentaria y de Biosistemas, 28040 Madrid, Spain
*
Authors to whom correspondence should be addressed.
Int. J. Mol. Sci. 2020, 21(22), 8510; https://doi.org/10.3390/ijms21228510
Submission received: 24 September 2020 / Revised: 7 November 2020 / Accepted: 10 November 2020 / Published: 12 November 2020

Abstract

:
Turnip mosaic virus (TuMV) is one of the most important plant viruses worldwide. It has a very wide host range infecting at least 318 species in over 43 families, such as Brassicaceae, Fabaceae, Asteraceae, or Chenopodiaceae from dicotyledons. Plant NADPH oxidases, the respiratory burst oxidase homologues (RBOHs), are a major source of reactive oxygen species (ROS) during plant–microbe interactions. The functions of RBOHs in different plant–pathogen interactions have been analyzed using knockout mutants, but little focus has been given to plant–virus responses. Therefore, in this work we tested the response after mechanical inoculation with TuMV in Arabidopsis rbohD and rbohF transposon knockout mutants and analyzed ultrastructural changes after TuMV inoculation. The development of the TuMV infection cycle was promoted in rbohD plants, suggesting that RbohD plays a role in the Arabidopsis resistance response to TuMV. rbohF and rbohD/F mutants display less TuMV accumulation and a lack of virus cytoplasmic inclusions were observed; these observations suggest that RbohF promotes viral replication and increases susceptibility to TuMV. rbohD/F displayed a reduction in H2O2 but enhanced resistance similarly to rbohF. This dominant effect of the rbohF mutation could indicate that RbohF acts as a susceptibility factor. Induction of hydrogen peroxide by TuMV was partially compromised in rbohD mutants whereas it was almost completely abolished in rbohD/F, indicating that these oxidases are responsible for most of the ROS produced in this interaction. The pattern of in situ H2O2 deposition after infection of the more resistant rbohF and rbohD/F genotypes suggests a putative role of these species on systemic signal transport. The ultrastructural localization and quantification of pathogenesis-related protein 1 (PR1) indicate that ROS produced by these oxidases also influence PR1 distribution in the TuMV-A. thaliana pathosystem. Our results revealed the highest activation of PR1 in rbohD and Col-0. Thus, our findings indicate a correlation between PR1 accumulation and susceptibility to TuMV. The specific localization of PR1 in the most resistant genotypes after TuMV inoculation may indicate a connection of PR1 induction with susceptibility, which may be characteristic for this pathosystem. Our results clearly indicate the importance of NADPH oxidases RbohD and RbohF in the regulation of the TuMV infection cycle in Arabidopsis. These findings may help provide a better understanding of the mechanisms modulating A. thaliana–TuMV interactions.

1. Introduction

Turnip mosaic virus (TuMV) belongs to the genus Potyvirus (family Potyviridae), a virus with a single (+) RNA of approximately 10 kb encoding a polyprotein, which is processed by three virus endogenous proteinases into 12 proteins [1]. TuMV has an unusually wide host range, which is of particular importance to Brassicaceae plants including Arabidopsis, but this is the most damaging in Brassica rapa subsp. pekinensis and chinensis (L.), H. Bailey, Brassica rapa (L.), Sinapis sp. and Raphanus sativus (L.). It also attacks Beta vulgaris (L.), Spinacia oleracea (L.) and Nicotiana tabacum (L.) [2]. TuMV’s economic importance varies depending on crop and location. It has a devastating effect on crops in China, where infection with it is widespread [3,4,5]. Examples of quantified yield losses include 30% in B. napobrassica crops in Southern Ontario [5,6] and 70% in infected B. napus in England and Wales [5,7]. TuMV also causes quality defects such as internal necrotic disorders which account for around 10% of losses in stored B. oleracea var. capitata [5].
Potyvirus particles are organized as a flexous rod in length and are between 11 and 15 nm in diameter. Akin to other (+) RNA viruses, at the ultrastructural level TuMV causes remodeling of the host cellular membranes to create viral structures called “viral factories” [8]. In the case of TuMV, Cotton et al. [9] documented that infection leads to the formation of vesicles originating from the ER. Virus protein 6K2 induces the formation of these vesicles containing the viral RNA as well as several replication-related host and virus proteins that as a whole are able to act as potential replication sites [10]. Moreover, Grangeon et al. [11] and Wan et al. [12] also postulated that vesicles are associated with TuMV cell-to-cell as well as long distance movement. Furthermore, Movahed et al. [13] demonstrated the presence of host factors participating in the plant immune response in purified vesicles from N. benthamiana and Arabidopsis, together with viral proteins. Secondly, important ultrastructural changes observed during TuMV infection are due to the presence of filamentous viral particles (VPs) and viral cytoplasmatic inclusion (CI) [2]. Generally, TuMV isolates have been frequently characterized using a variety of differential plant lines from various brassica species [2,14]. However, the first resistance gene against TuMV to be mapped, Tu, was identified in lettuce cv. Cobbham Green [15]. TuRB01 was the first TuMV resistance gene to be mapped in brassicas, in the Brassica napus line N-o-1 [16]. Among the four B.napus lines used by Jenner and Walsh [2,17], line R4 contains a single dominant resistance gene effective against the isolate TuMV UK1 [18] and other pathotype 1 isolates [16]. Coutts et al. [19] identified, in Australian varieties of a population of Brassica napus and Brassica juncea plants, TuMV resistance genes TuRB01, TuRB03, TuRB04 and TuRB05. In the case of Arabidopsis, resistance is acquired mostly by the generation of different types of mutants. TuMV infection is not supported efficiently after silencing of HSP70 [20,21]. Knockout mutation in the DNA-binding protein phosphatase 1 (DBP1) gene does not influence plant growth in Arabidopsis, but does result in resistance to two potyviruses—TuMV and plum pox virus (PPV) [22]. Despite known resistance genes, TuMV is still serious and a current danger for crop production [21].
The formation of reactive oxygen species (ROS; superoxide anion, hydrogen peroxide, hydroxyl radical and singlet oxygen) is a regular process in the metabolism of aerobic organisms [16]. These ROS were initially thought to be also harmful molecules [17], inducing irreversible cell damage or even cause cell death [23]. To prevent damage, plants and other organisms have developed effective antioxidant systems, and the dynamic balance of ROS is maintained through multiple pathways and approaches [24,25]. However, plants and other organisms harbor enzymes for a regulated generation of superoxide and hydrogen peroxide that have been postulated as signals to react to abiotic and biotic stresses [26]. The generation of ROS during the pathogen response is mainly dependent upon different respiratory bursts of oxidase homologs, which are activated by pathogen recognition, leading to the establishment of the immune response often associated with the hypersensitive response [27]. Similarly to other pathogens, virus infection leads to a rapid production of reactive oxygen species (ROS). A plant–virus interaction was one of the first pathosystems where this so called oxidative burst was discovered—the Nicotiana-Tobacco mosaic virus pathosystem [28]. Plant NADPH oxidases, known as Respiratory Burst Oxidase Homologs (RBOHs) are responsible for this ROS generation [29]. RBOHs constitute a family of plasma membrane–localized enzymes with homology to the mammalian phagocyte NADPH oxidase, NOX2 [30]. They generate superoxide anions (O2-) in the apoplast which are rapidly dismutated to hydrogen peroxide (H2O2). The model plant Arabidopsis thaliana presents a multiple family of 10 Rboh genes [31]. Analyses by Suzuki et al. [32] demonstrated that Rboh genes control a wide range of developmental as well as environmental processes. Two of these genes, RbohD and RbohF, are pleiotropic and function together, mediating diverse functions in abiotic stress signaling as well in pathogen responses. These two genes present a different expression pattern during plant development and are differentially modulated during the immune response [29]. Moreover, RBOHD and RBOHF proteins are differentially activated by different protein kinases [33,34]. Furthermore, RBOH-derived ROS appear to trigger local and/or systemic reprogramming to activate plant immunity [35].
Even though the roles of RbohD and RbohF have been extensively documented in many plant–pathogen interactions, the potential function(s) of Rboh-mediated responses during plant–virus interactions remain poorly investigated. The aim of this research was to perform Turnip mosaic virus inoculation on Arabidopsis rbohD and rbohF mutant plants to assess the role of these NADPH oxidases in this pathosystem. We want to examine whether RbohD and RbohF contribute to signal transduction crosstalk in TuMV–Arabidopsis interactions.

2. Results

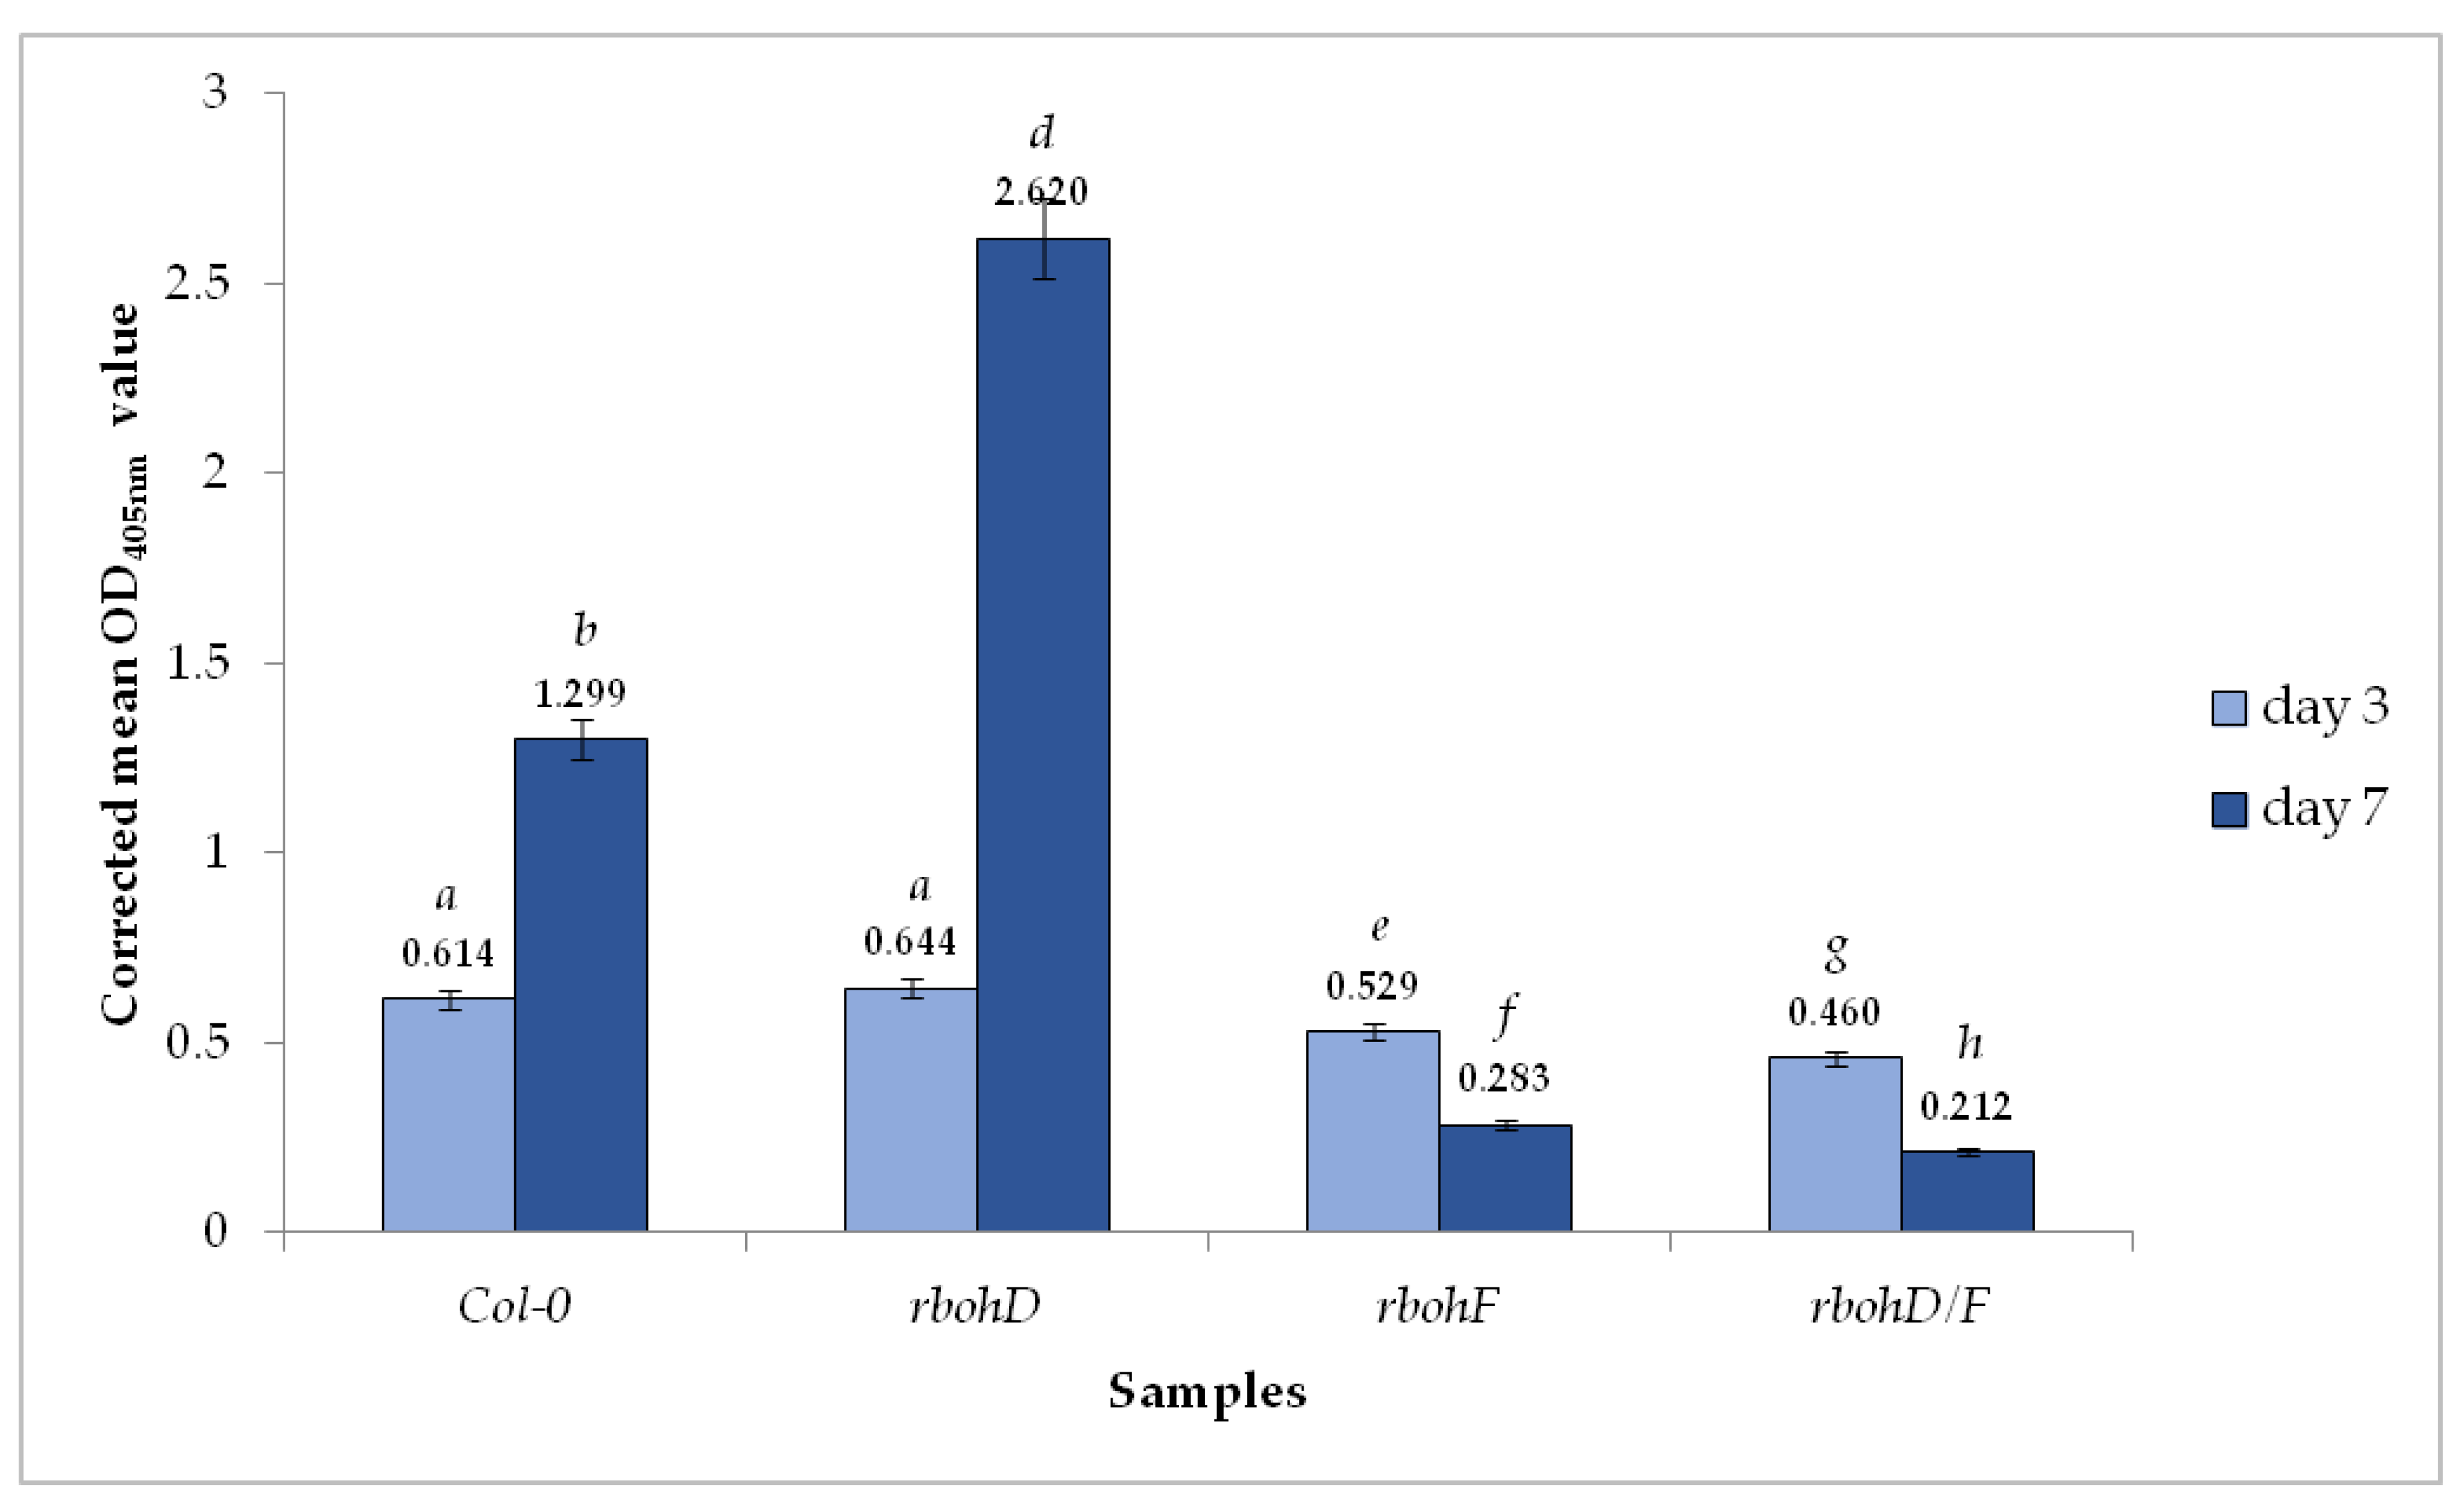
2.1. Accumulation of TuMV in Wild Type and Mutant Arabidopsis thaliana Plants

The double antibody sandwich enzyme-linked immunosorbent assay (DAS-ELISA) clearly showed the presence of TuMV in all Arabidopsis thaliana wild type Col-0 and the three rboh mutants at 3 and 7 days post-inoculation (dpi). However, OD405 values were higher in the Col-0 and rbohD plants than in rbohF and double rbohD/F mutants (Table 1). Moreover, whereas the values for Col-0 and rbohD increased between 3 and 7 dpi (to 1.379 and 2.701, respectively), the rbohF and double mutant rbohD/F OD405 values significantly decreased at a later time (Table 1). Analyses using the corrected OD405nm mean values confirmed the increase in relative concentration of TuMV by 2.11-fold in Col-0 plants and over 4.0-fold in rbohD, and the decrease in the relative virus amount between 3 and 7 dpi, the decrease in rbohF by 1.86-fold and by 2.16-fold in rbohD/F (Figure 1). Moreover, the virus concentration at the 3-dpi time point was lower in rbohF, and especially in rbohD/F than in Col-0 or rbohD mutants. These results with a boosted TuMV infection cycle in rbohD mutants suggest that this oxidase contributes to stopping virus progression.

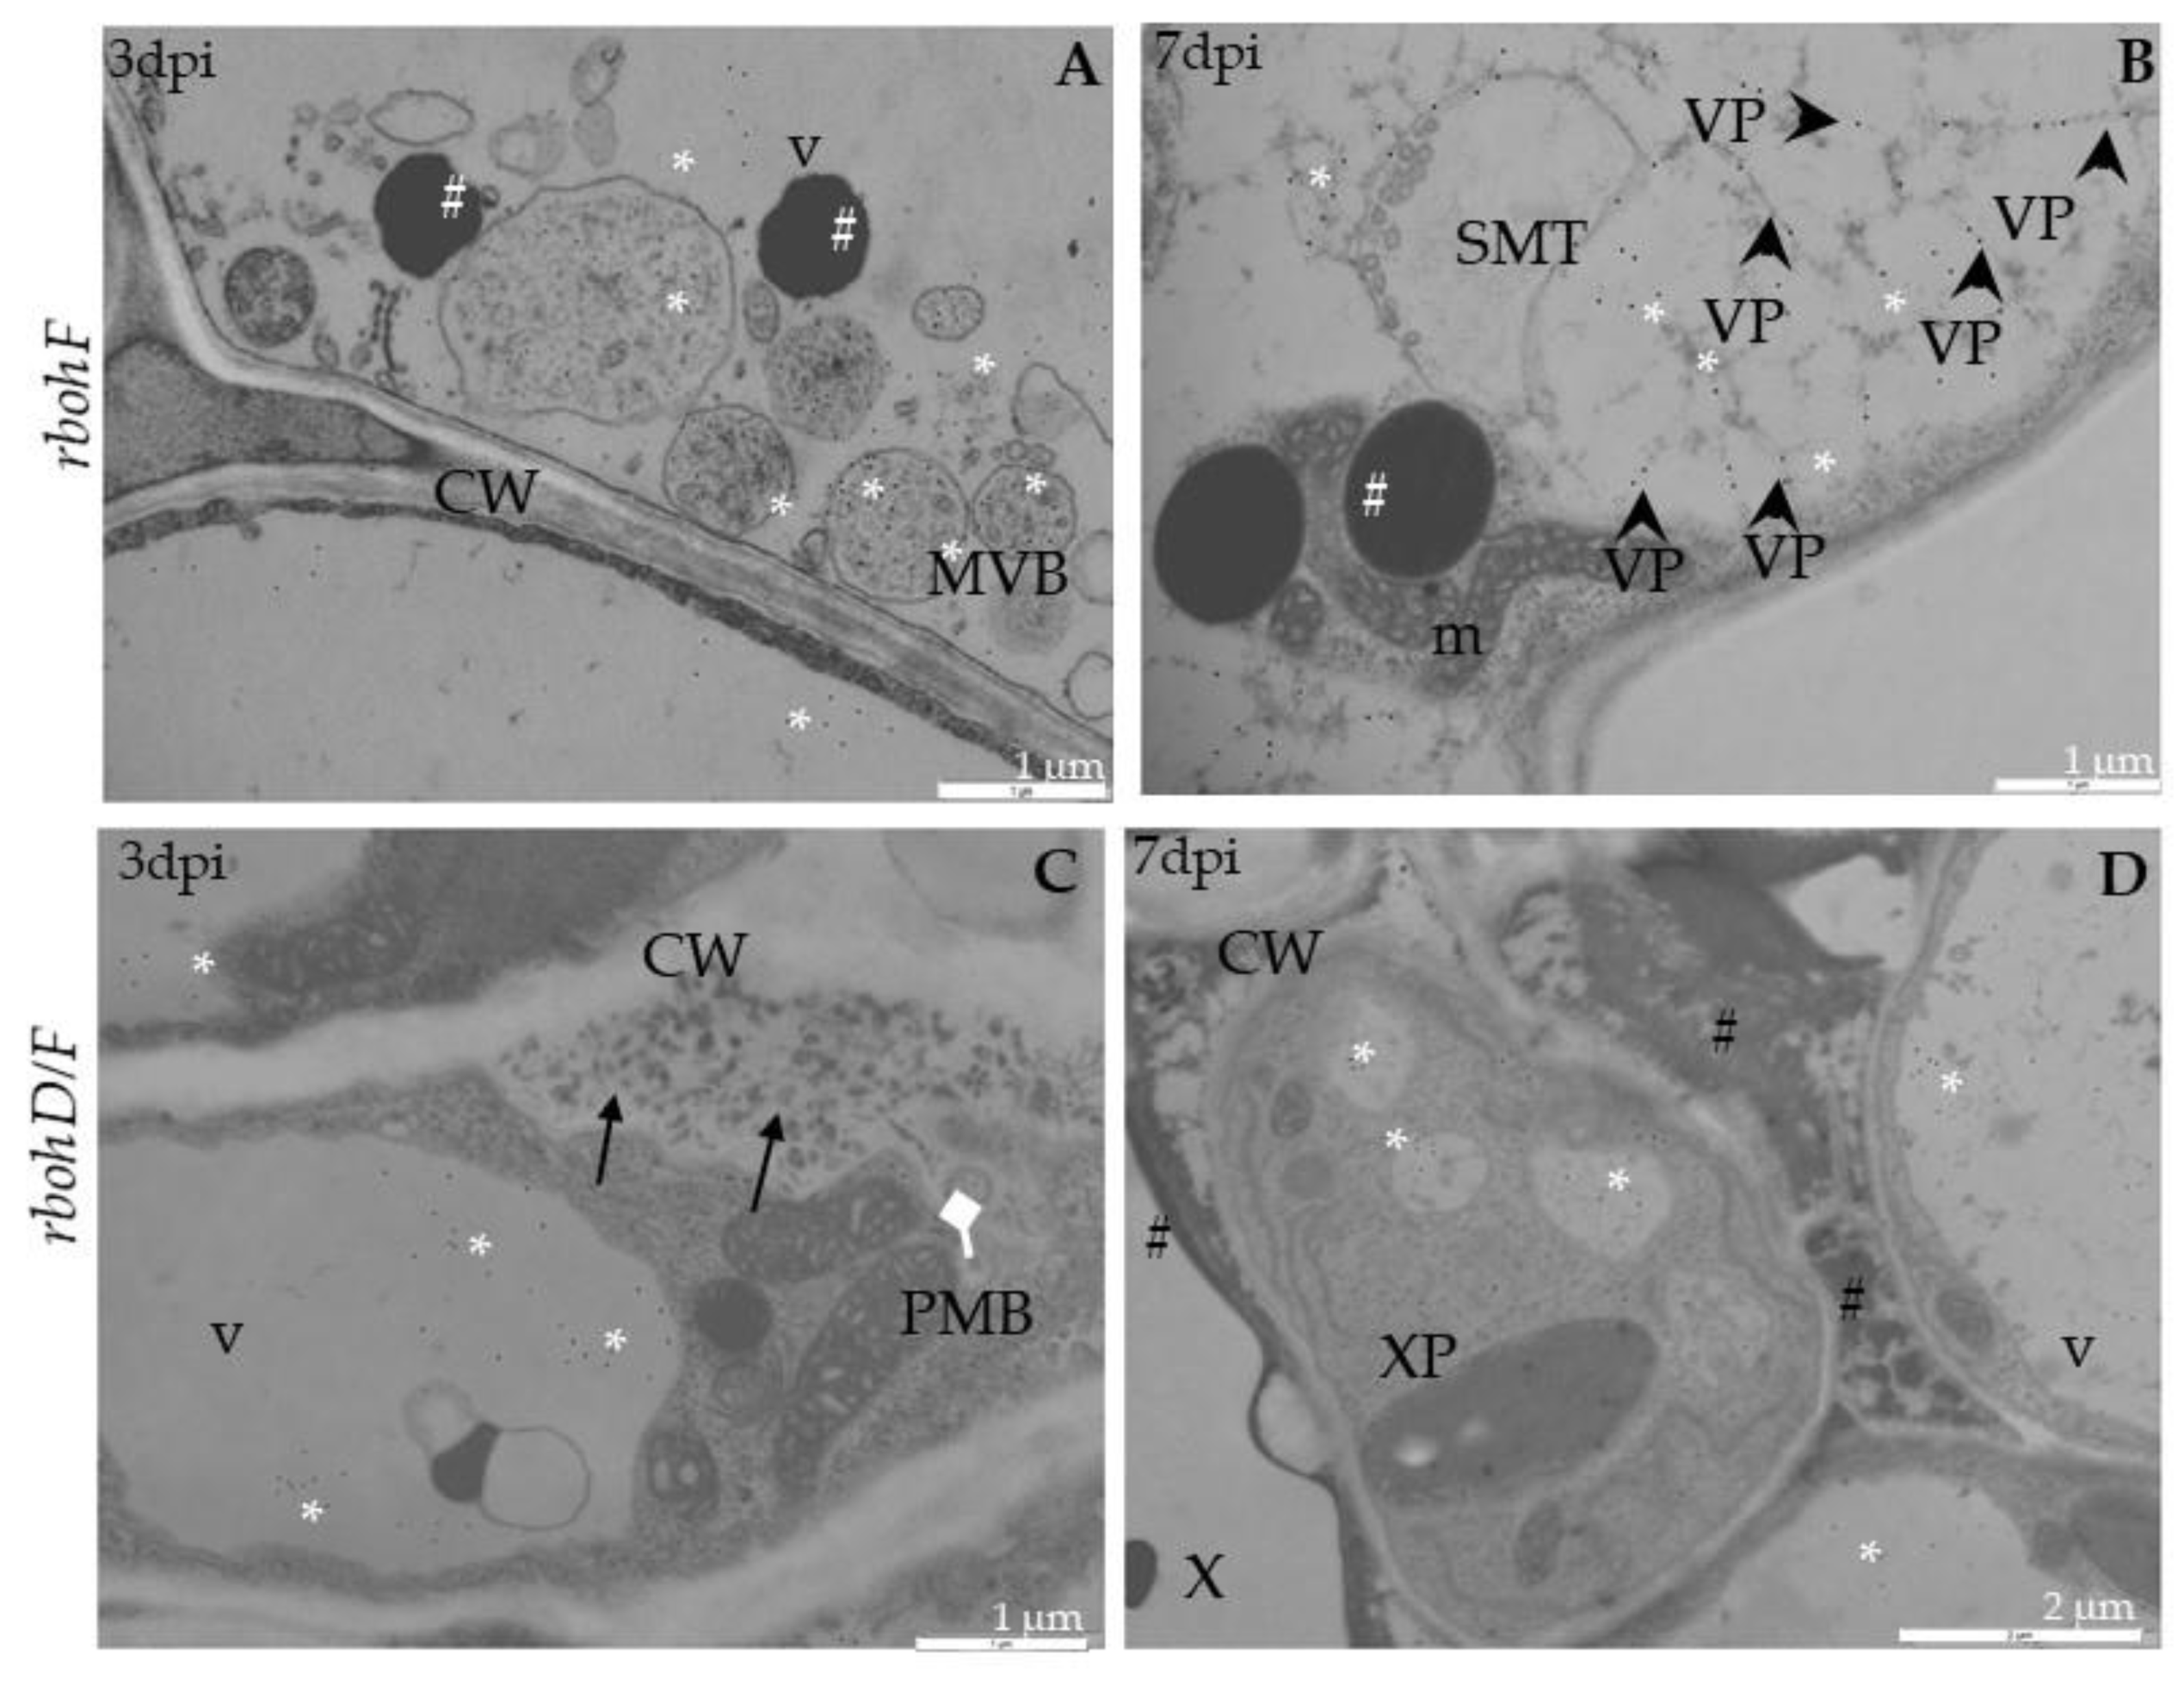
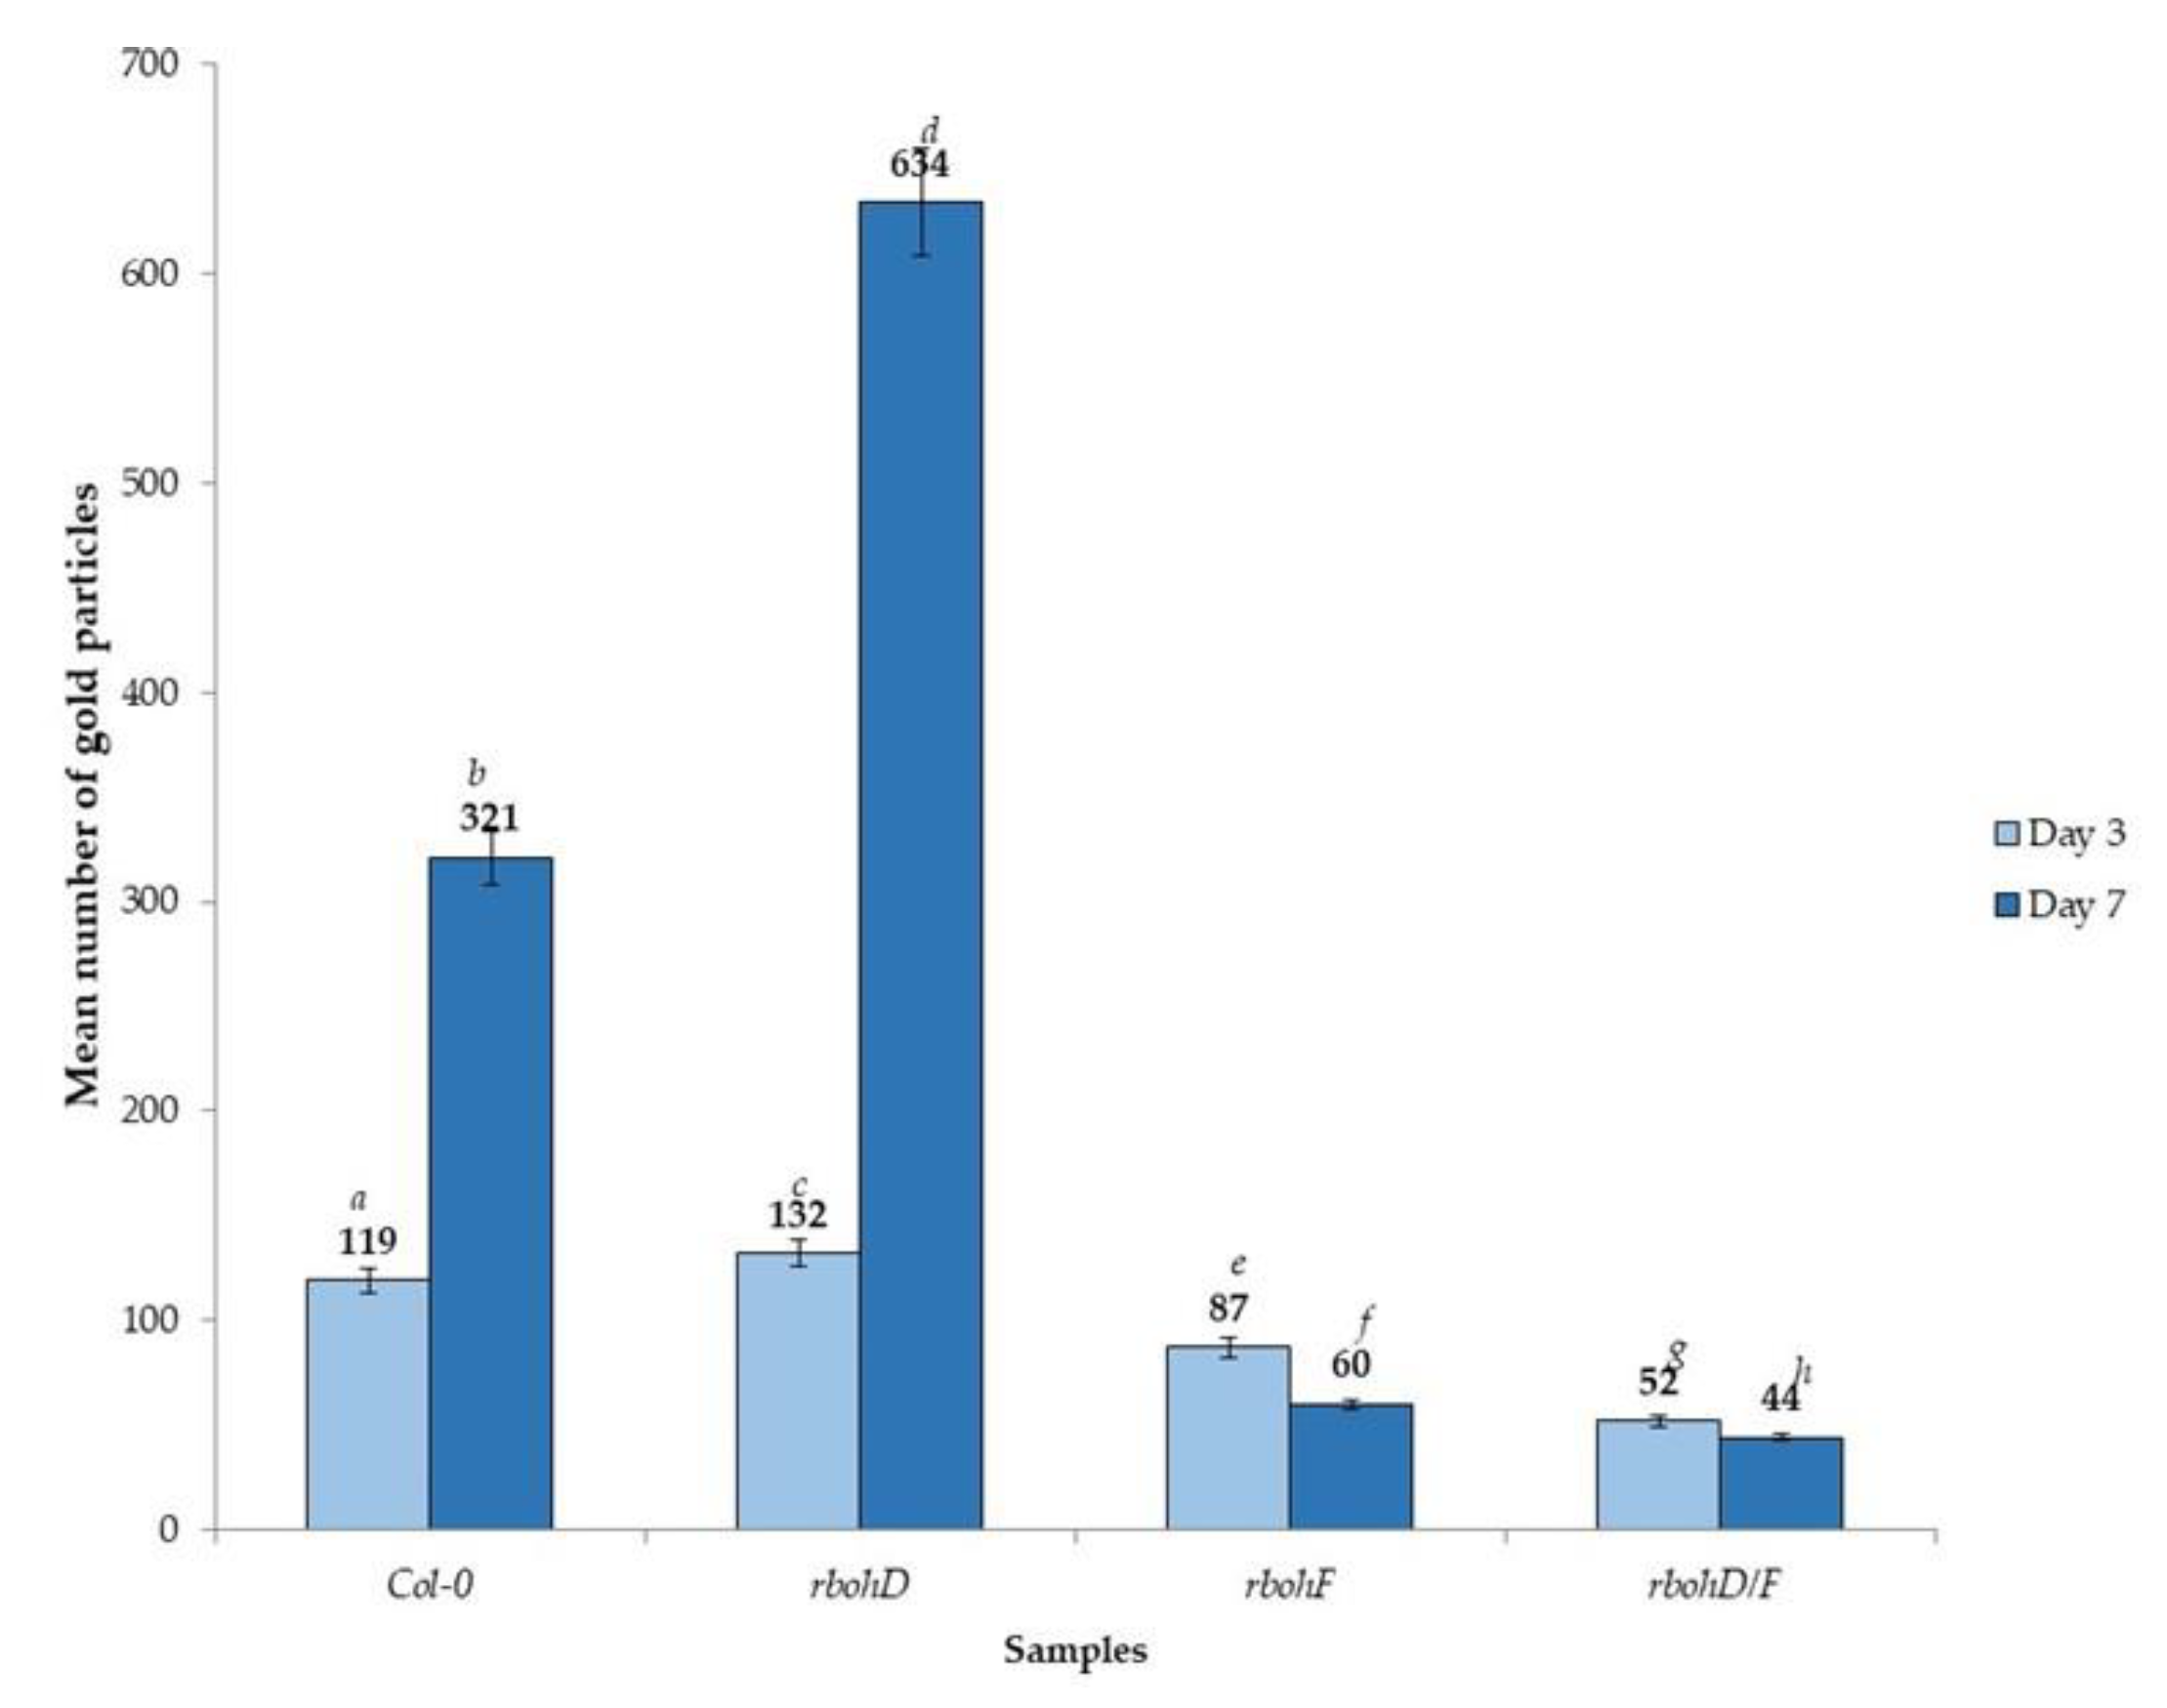
2.2. RbohD and RbohF in TuMV Infection

Ultrastructural analyses of Col-0, rbohD, rbohF and double mutant rbohD/F at 0 to 7 days after TuMV inoculation, as well as in mock-inoculated plants, were examined. In Col-0, inoculated plants’ virus particles were first noticed starting from 3 dpi, and were mainly located inside the vacuoles of mesophyll cells (Figure 2A). This accumulation was accompanied by the appearance of multivesicular structures in mesophyll and phloem tissues (Figure 2B). In vascular tissues of inoculated rosette leaves, a few virus cytoplasmic inclusions in xylem parenchyma (Figure 2C) as well as in phloem cells were observed (Figure 2D). Phloem cells very often revealed necrotization at 7 days after inoculation, whereas in xylem parenchyma cells virus particles in vacuoles were presented. The analysis of rbohD mutants confirmed important disorders in chloroplast structures. Curved structures of thylakoids in chloroplasts were observed compared with mock-inoculated leaves (Figure 3A); at 7 dpi the alterations were more intense than in Col-0.
These changes were accompanied by cell wall invagination as well as paramular body induction, especially in palisade mesophyll cells (Figure 3A). Moreover, virus particles and virus-induced cytoplasmic inclusions were the most frequently presented in rbohD mesophyll as well as in phloem parenchyma cells 7 days after virus inoculation (Figure 3B,C). Furthermore, in rbohD mesophyll cells virus particles were attached to the tonoplast, which was usually accompanied by disorganized chloroplast structures (with curved thylakoids stacks) and virus cytoplasmic inclusion present in cytoplasm (Figure 3C). Chloroplast changes in rbohD were definitely more intense than in Col-0 leaves’ mesophyll cells. Moreover, contrary to the Col-0 xylem cells, virus inclusions occurred commonly inside xylem tracheary elements (Figure 3D). These observations indicated that rbohD displays more viral particles and ultrastructural alterations in response to TuMV inoculation than Col-0.
In rbohF-TuMV-inoculated plants, starting from 3 dpi, a slight curve of chloroplast thylakoids was noticed compared with mock-inoculated plants (Figure 4A). Moreover, membranous structures and single membranes with tubules or paramular bodies in the apoplast were induced 3 days after TuMV inoculation (Figure 4B). In rbohF, a lower presence of virus particles’ compared with rbohD or even with Col-0 tissues was noticed (Figure 4C), whereas cell wall rebuilding (such as reinforcing) was clearly more visible at 7dpi than in Col-0 and rbohD tissues (Figure 4D). On the contrary, in rbohD/F, a double mutant structural alteration in the cell wall compared with mock-rbohD/F was already presented starting at 3 dpi (Figure 5A). At day 7 in this mutant, the multivesicular bodies were induced in phloem parenchyma cells (Figure 5A,B). Moreover, only a few virus particles were noticed, with a lower frequency, inside small vacuoles in mesophyll cells (Figure 5C). As for the cell wall structure, it was more intensively rebuilt (reinforced) at 7 dpi (Figure 5C) than at 3 dpi as well as than it was in rbohF tissues. Furthermore, along cell walls, phenolic-like compounds were detected in rbohD/F at the 7-dpi time point (Figure 5D). Neither virus particles nor virus cytoplasmic inclusions were observed in rbohD/F’s phloem (Figure 5A,B) and xylem cells (Figure 5D).
These observations indicated that rbohF displays fewer virus particles than rbohD tissues and Col-0. Although double mutant rbohD/F revealed the same phenotype as rbohF, it seems rbohF supports fewer TuMV proliferations. Therefore, taking into account the relative virus concentration as well as ultrastructural analyses, it can be summarized that RbohD is required to limit virus proliferation, whereas RbohF must have a different role allowing virus proliferation and acts dominantly toward RbohD.

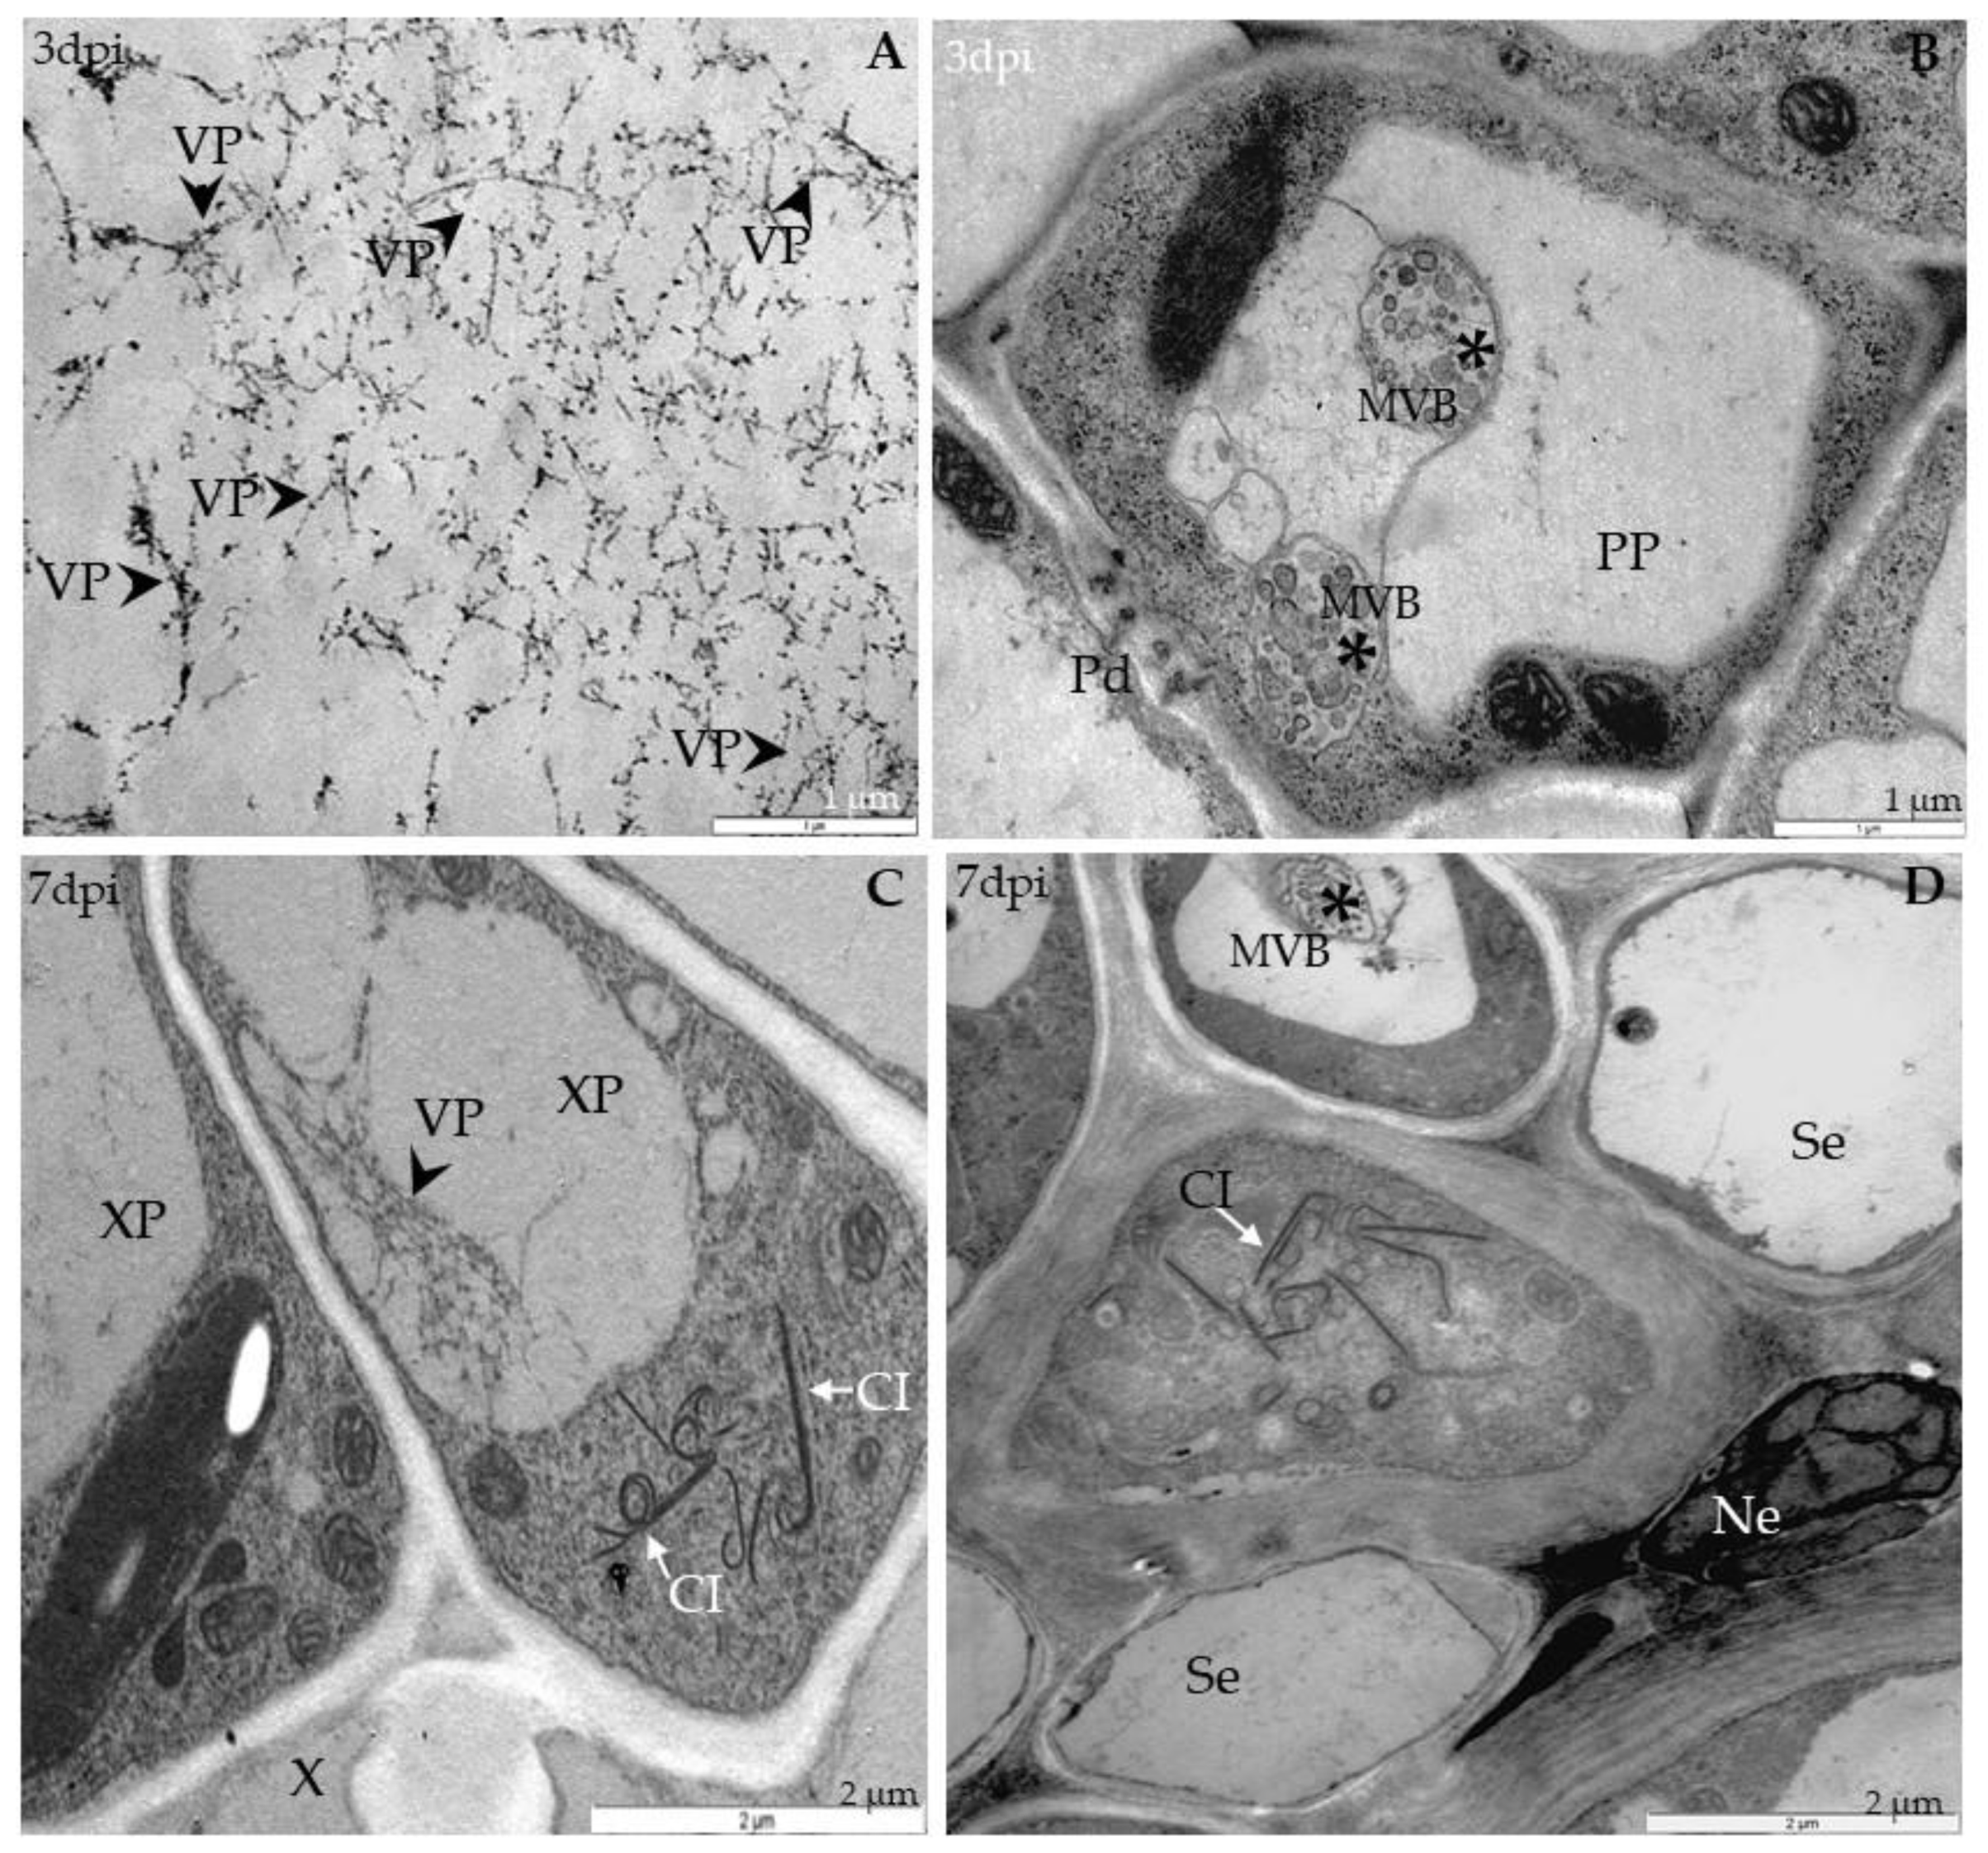
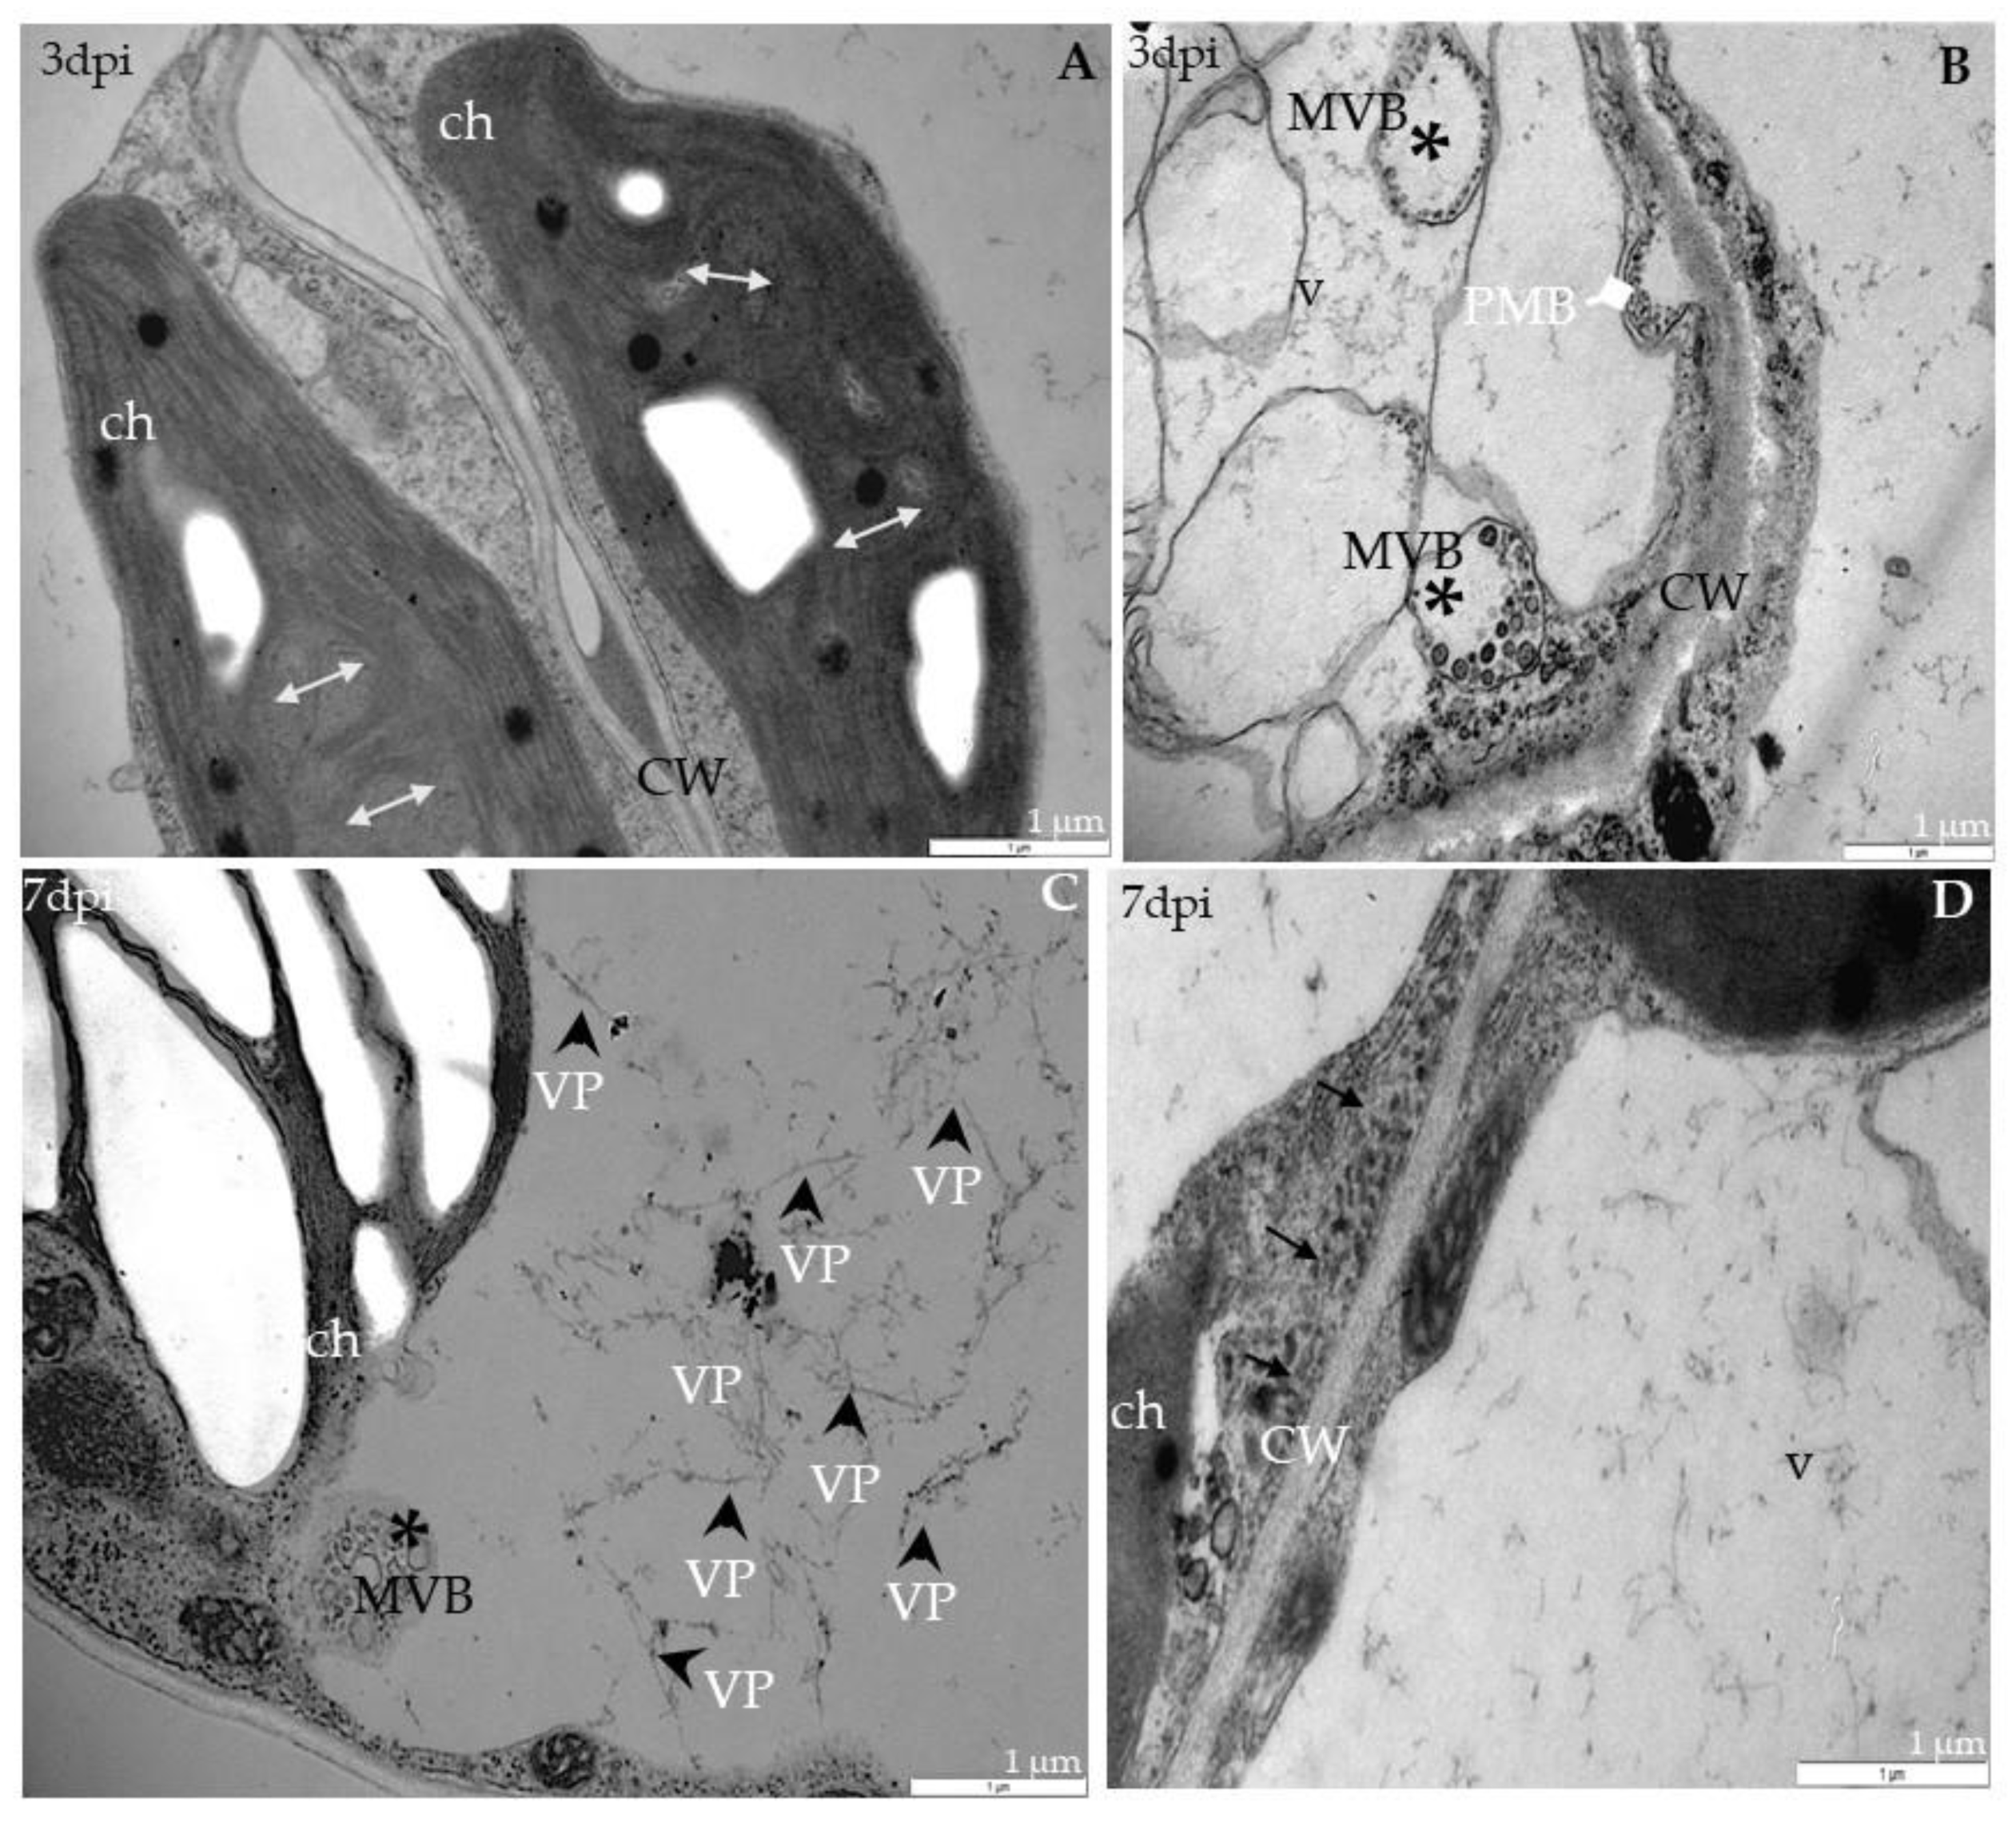
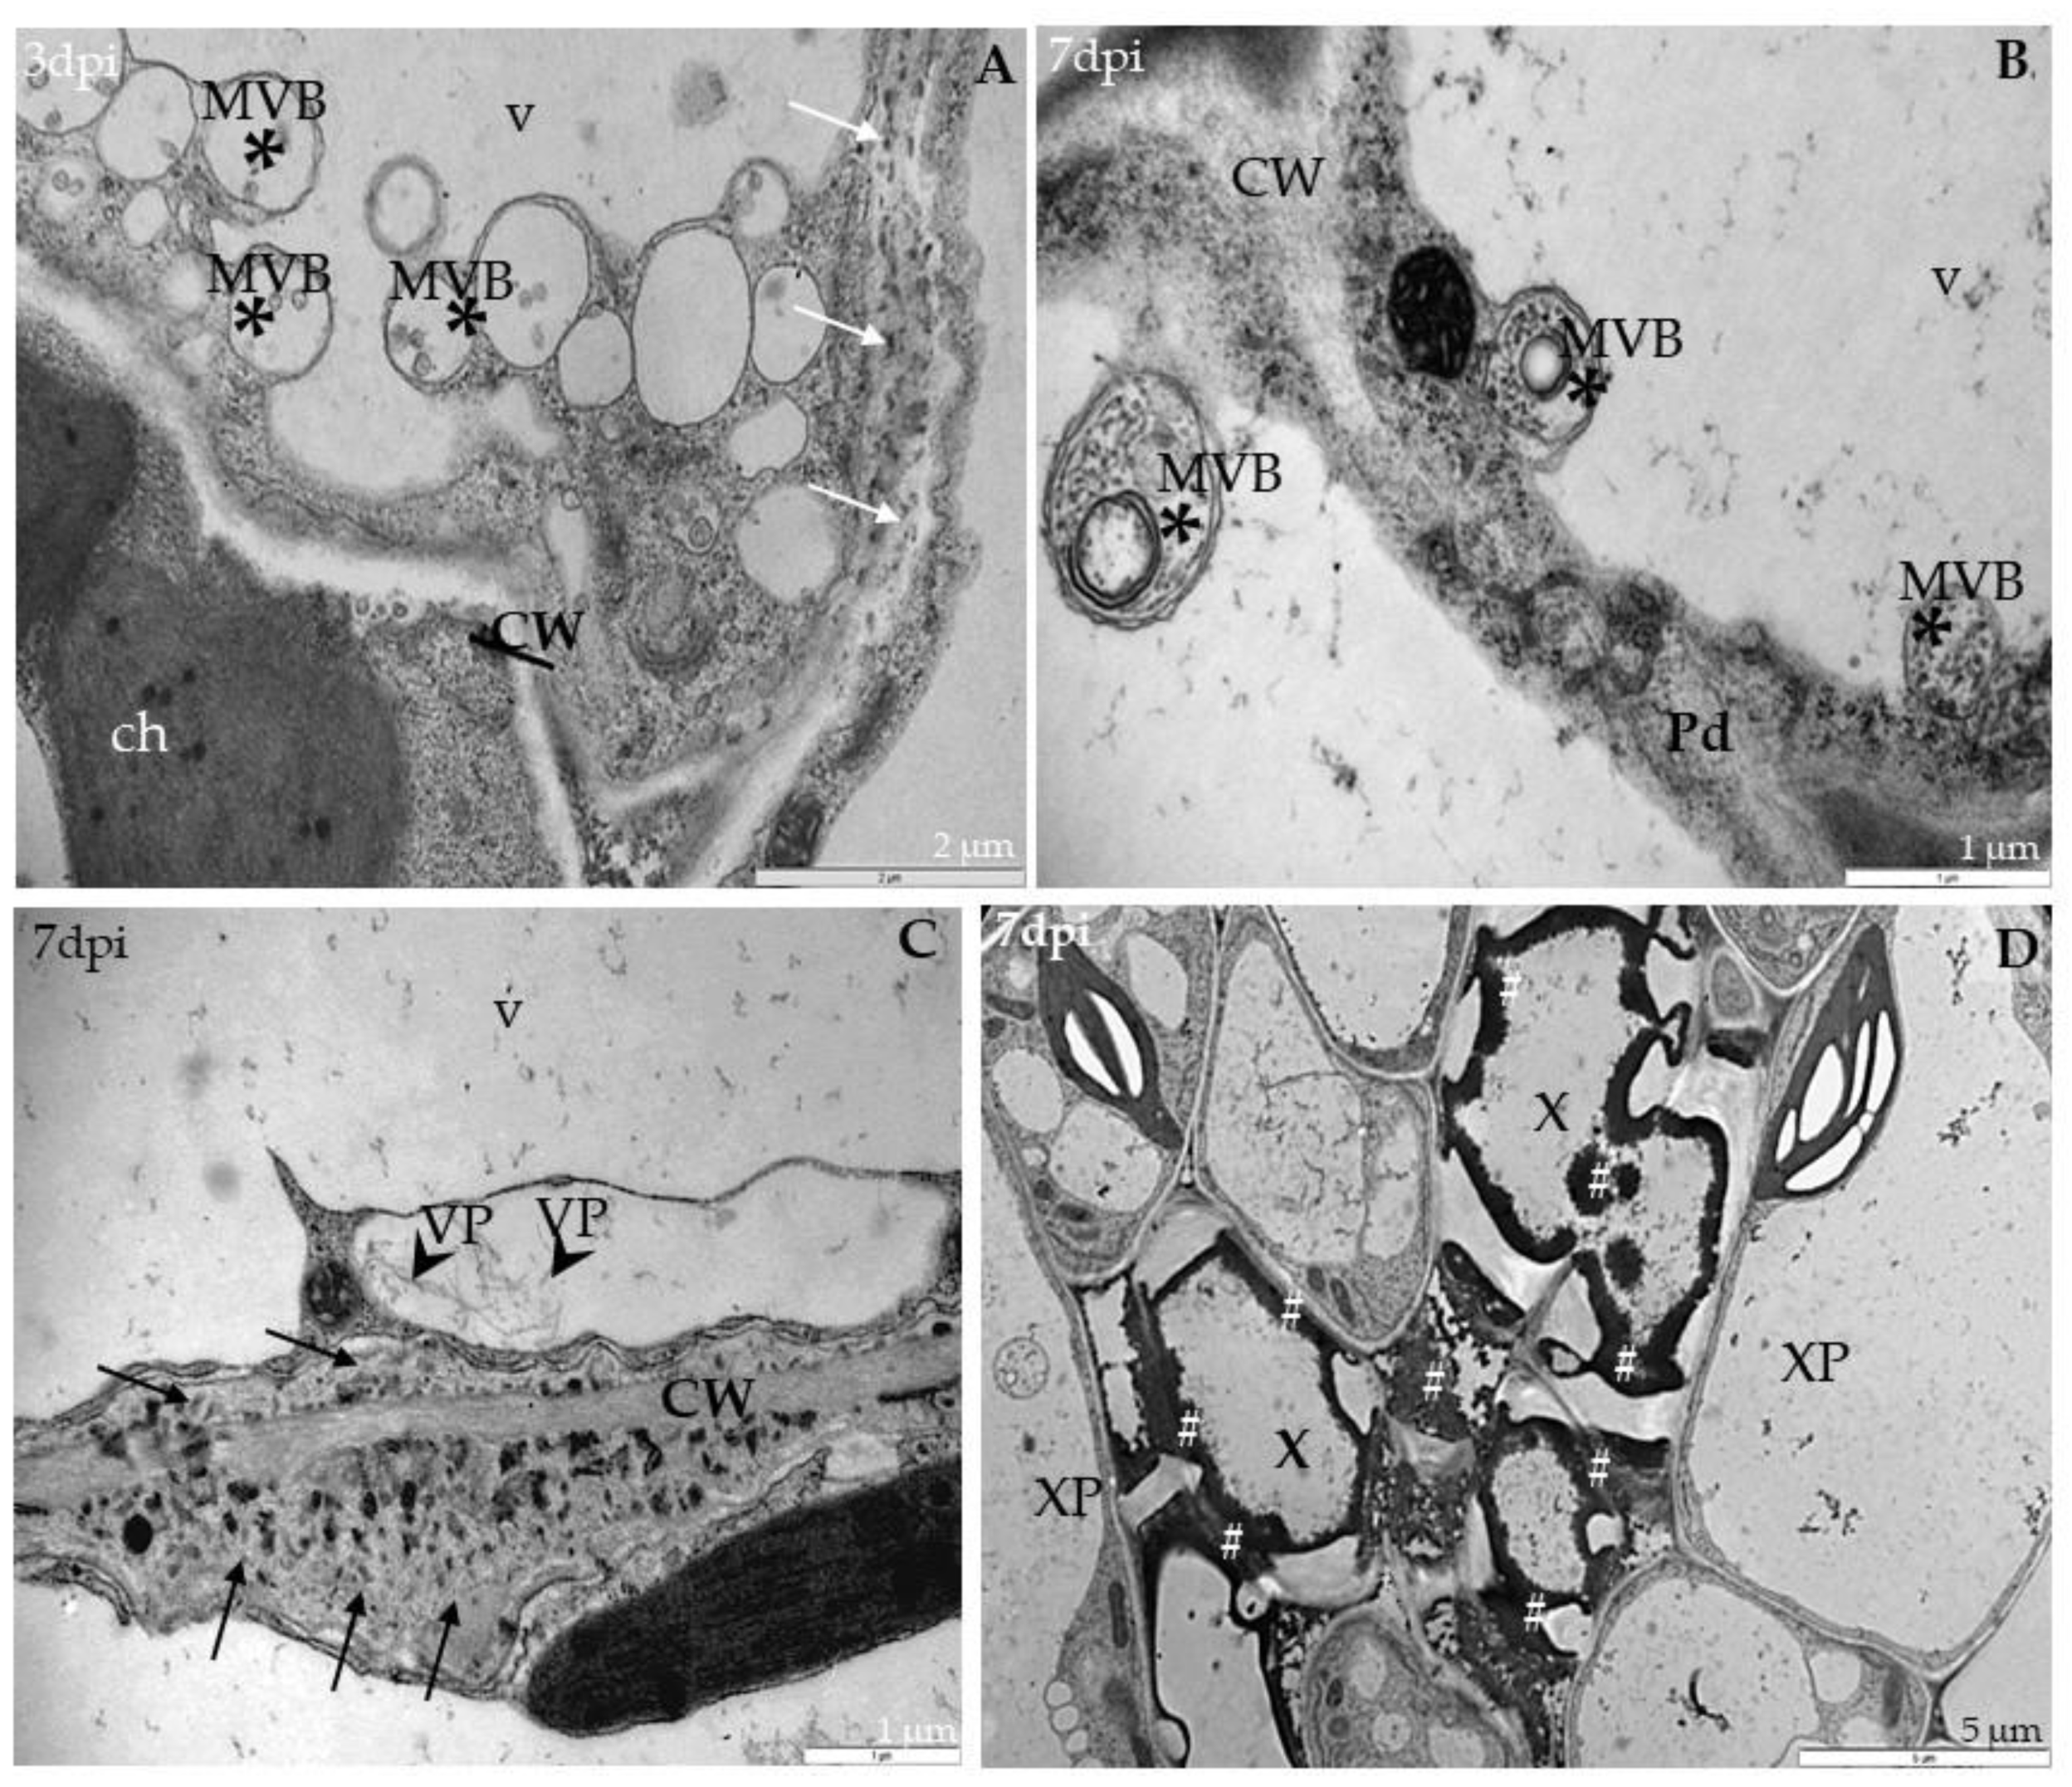
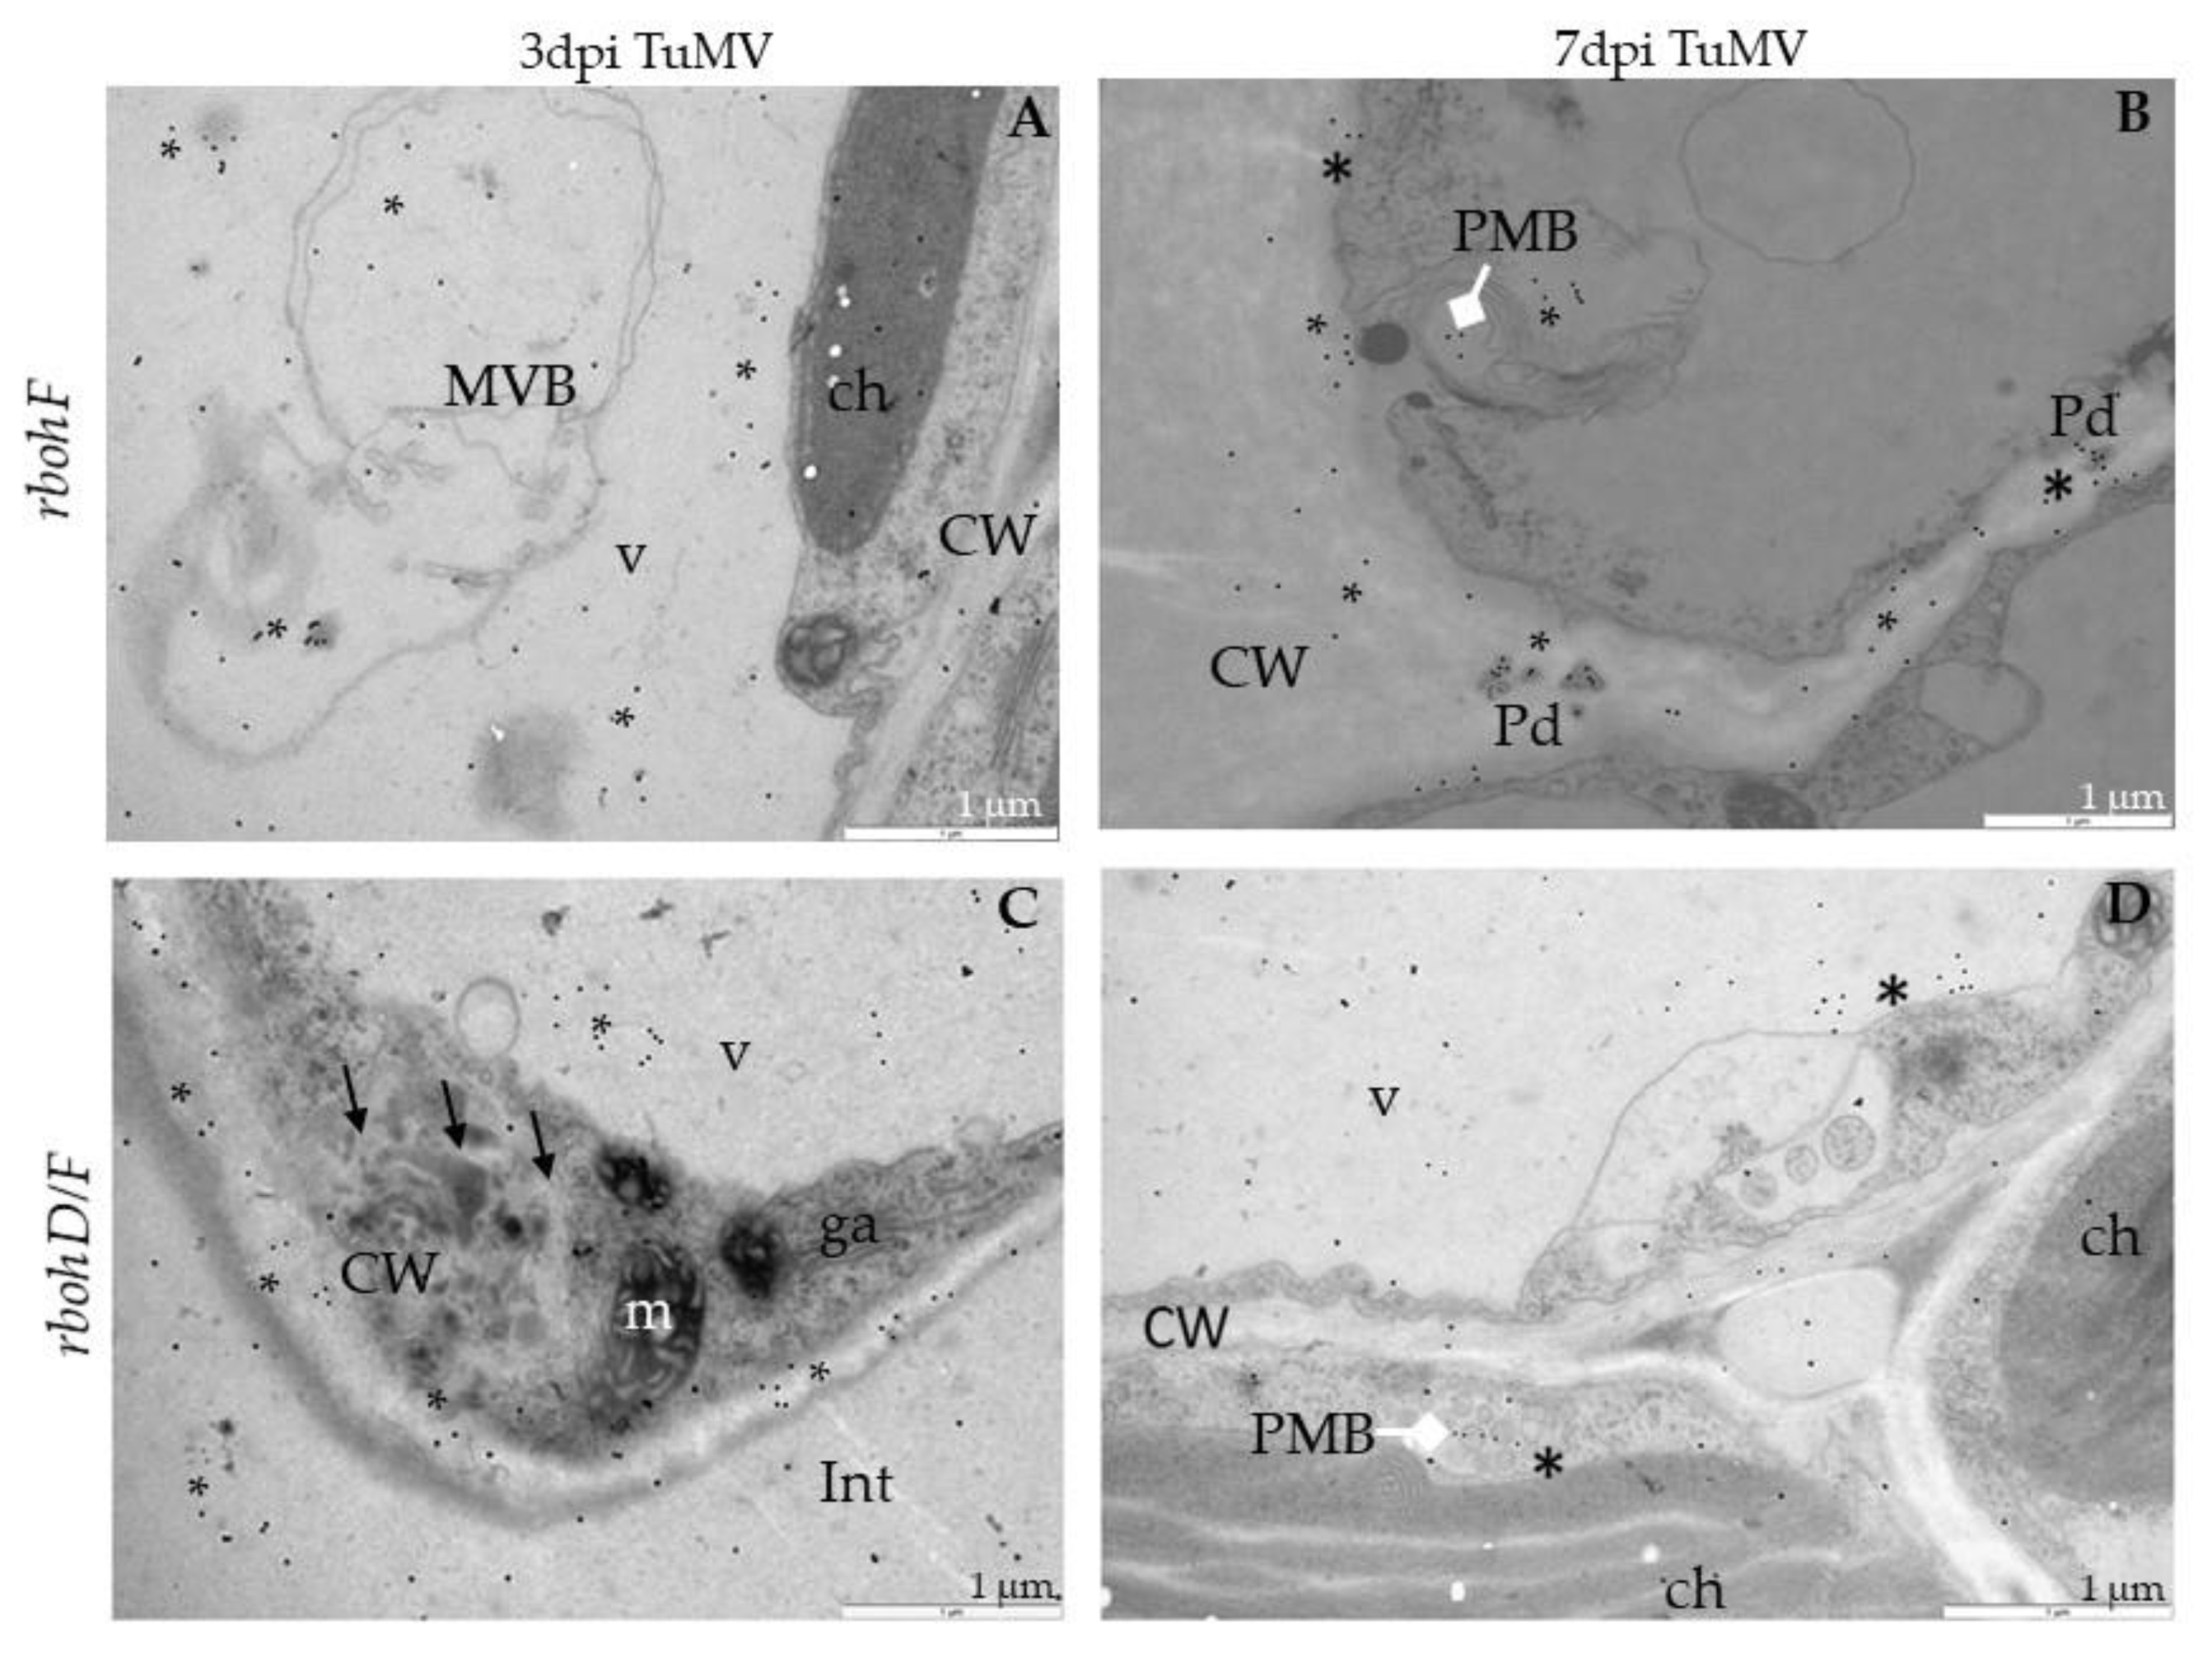
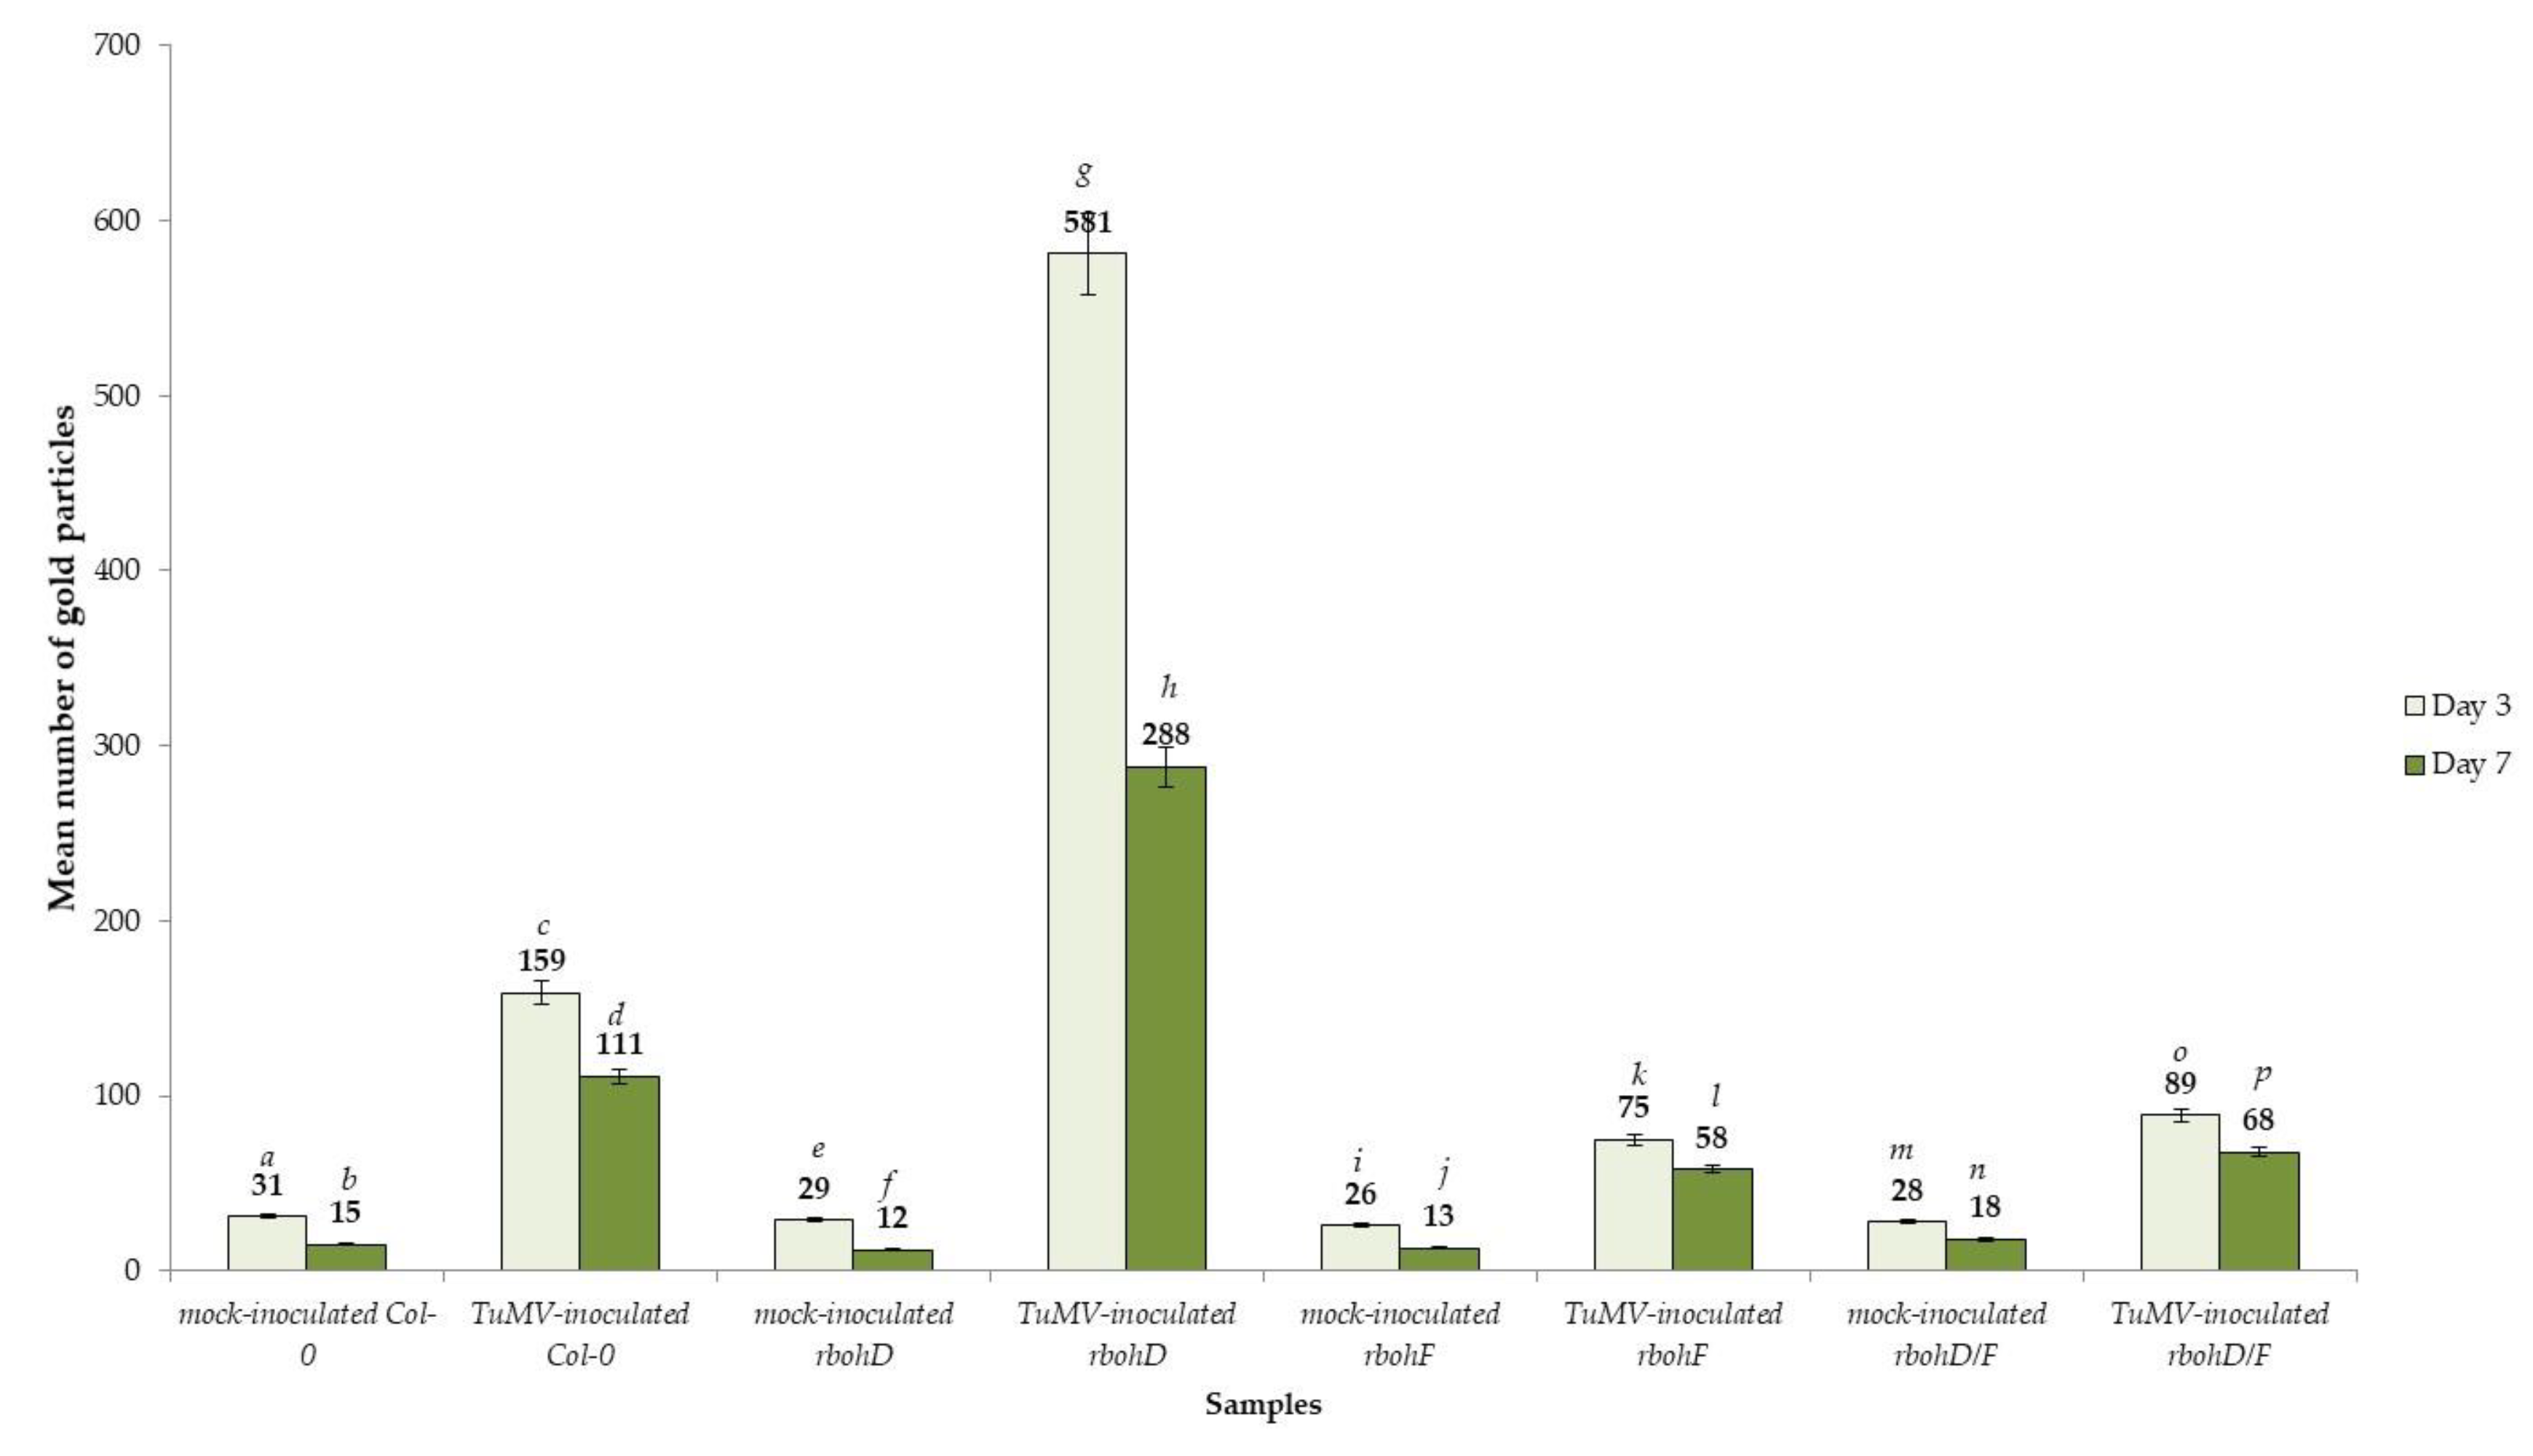
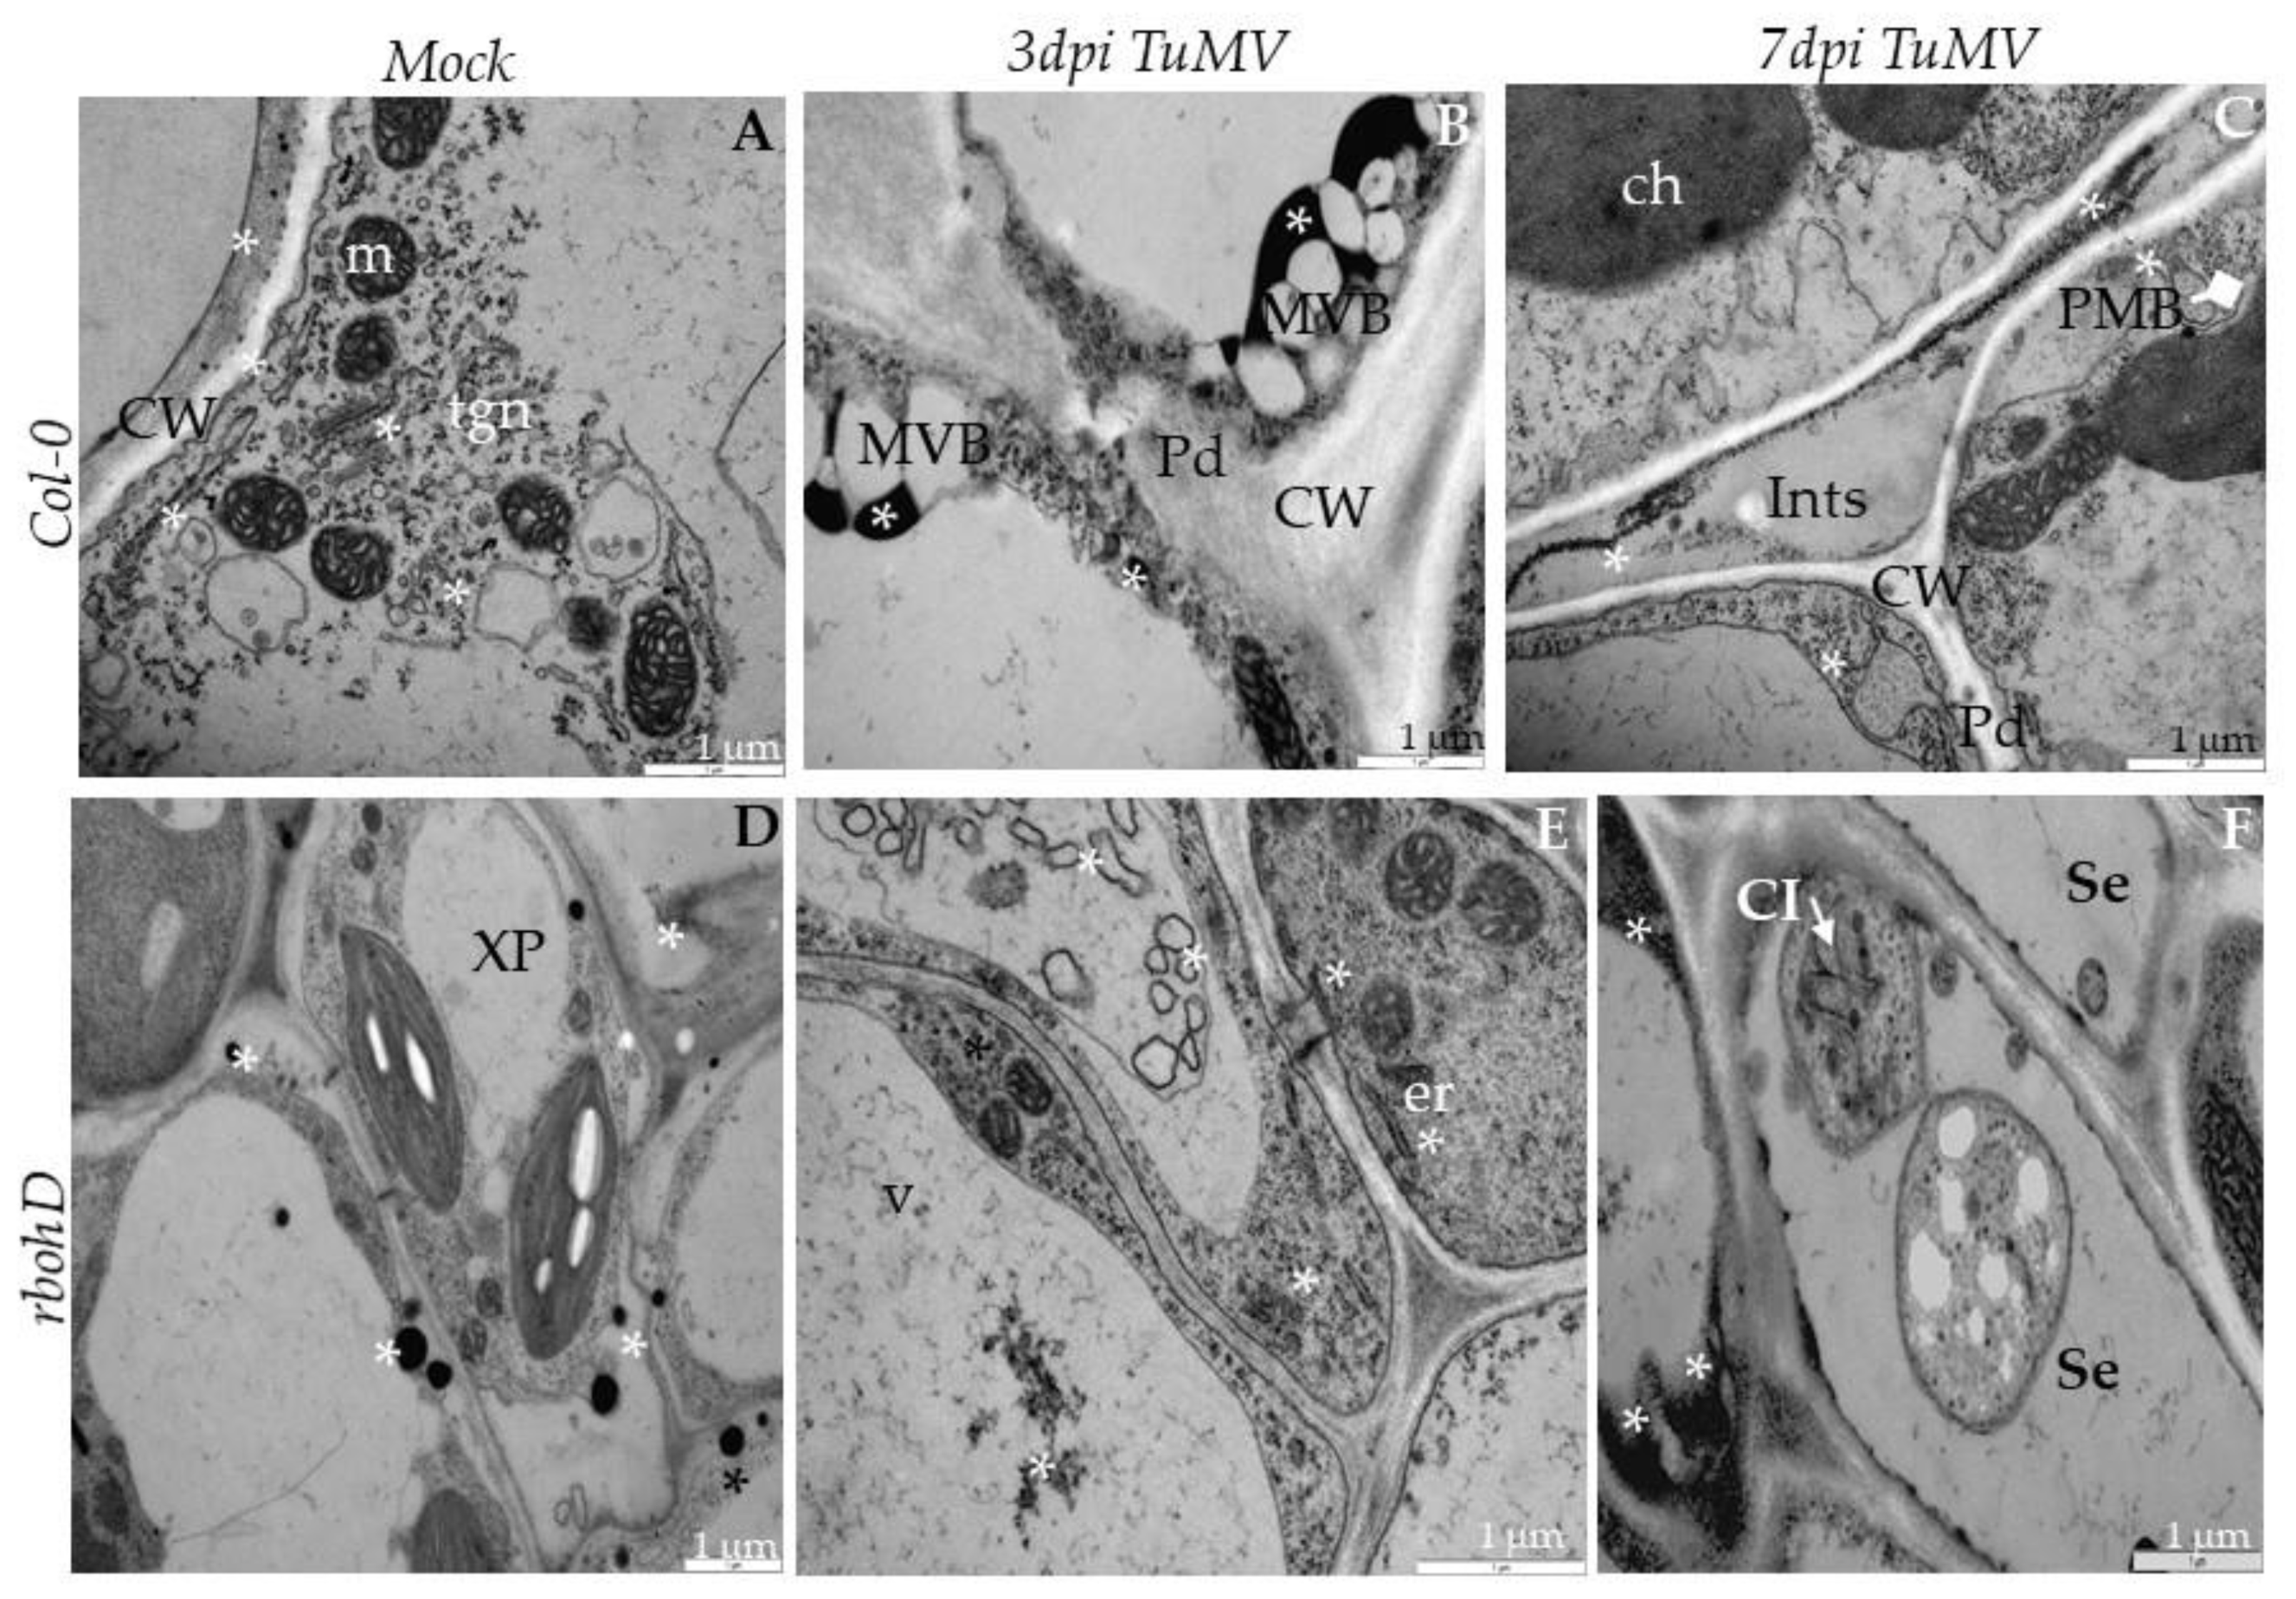
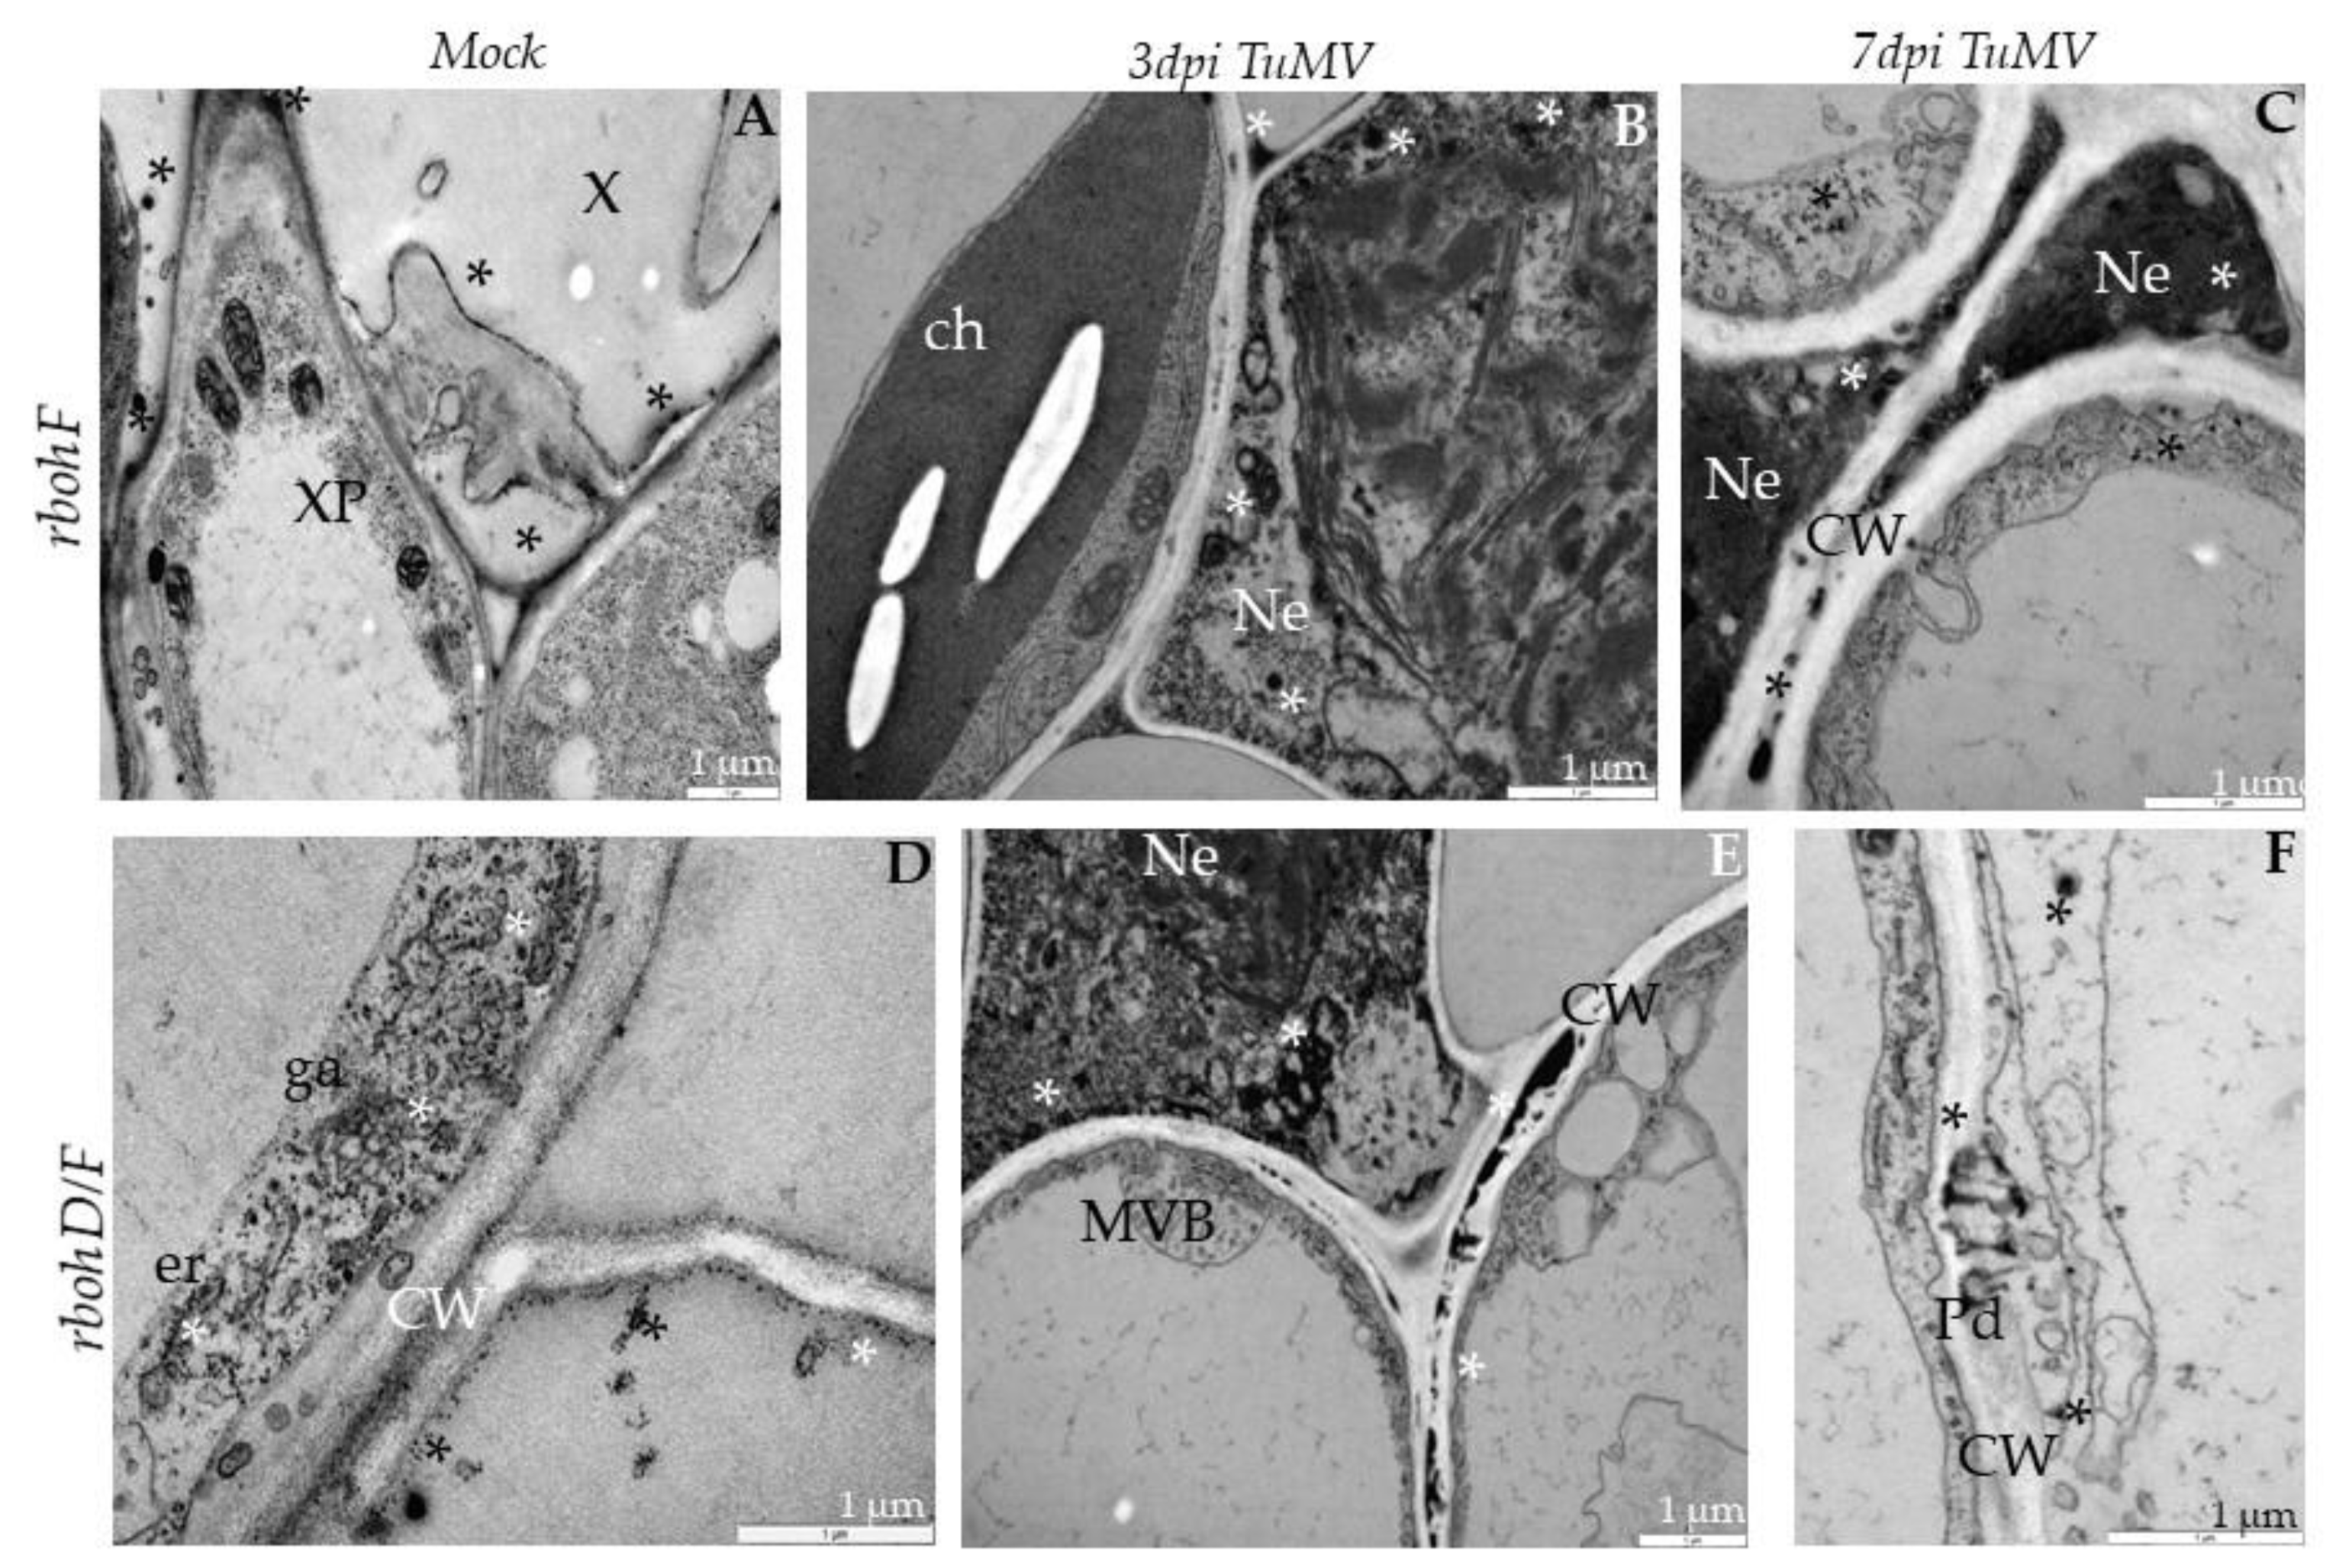
2.3. Localization of TuMV

Besides analyzing the relative virus concentration, we monitored the TuMV localization in situ in Col-0 and rboh mutants at the ultrastructural level (Figure 6, Figure 7 and Figure 8). There were no gold depositions noticed neither in control mock-inoculated tissues (Figure 6A) nor in sections where primary antibodies were replaced with the pre-immune serum. In Col-0, the epitopes were noticed in the cytoplasm near the inclusions (Figure 6B). Virus epitopes were co-localized in the cytoplasmic area of TuMV particles with the virus cytoplasmic inclusions, especially in the rbohD mutant (Figure 6C,D). A strong increase was observed in Col-0 tissues between 3 and 7 dpi, but not so strong as in rbohD. Even when the virus particles were not observed, TuMV epitope localization in multivesicular bodies and vacuoles were noticed, especially in the rbohF mutant (Figure 7A) or Col-0 (Figure 6B). Gold particles’ deposition along virus particles and around “single membrane with tubules” structures was revealed in the vacuoles of rbohF mutants (Figure 7B). Just a few gold granules were presented in vacuoles and around the altered cell wall in rbohD/F plants (Figure 7C,D). Likewise, quantification of the virus at day 3 revealed the most intense gold deposition in rbohD. Additionally, rbohD was the genotype where the depositions increased the most between 3 and 7 dpi (Figure 8). The weakest localization of TuMV was observed in rbohF and especially in the double mutant rbohD/F (Figure 7C,D and Figure 8). In addition, in both rbohF and rbohD/F the amount of localized virus decreased between days 3 and 7. These data clearly confirmed the limitation of the TuMV infection cycle in rbohF and rbohD/F mutants.

2.4. Distribution of Pathogenesis-Related Protein 1 (PR1) after TuMV Inoculation

PR1 expression is induced by TuMV infection, therefore this protein was used as a marker to indicate the progression of TuMV infection. For all four tested genotypes, TuMV inoculation increased PR1 levels (Figure 9, Figure 10 and Figure 11). Immunogold-labeled PR1 revealed the location in the cell wall and in the paramular bodies in the apoplast (Figure 9A,B) of Col-0 as an effect of TuMV inoculation. In rbohD, mutant PR1’s presence was noticed mainly in the cell wall, in the apoplast area and vacuoles (Figure 9C,D), whereas, in mock-inoculated leaves, weak PR1 detection in the cell wall and apoplast was found (Figure 9E), contrary to the lack of gold granules in sections where primary antibodies were replaced by pre-immune serum (Figure 9F). In rbohF, PR1 was primarily found in paramular bodies, but also in plasmodesmata within the cell wall (Figure 10A,B). Similarly, in rbohD/F the paramular bodies were decorated with gold granules, as was the reinforced cell wall in mesophyll cells (Figure 10C,D).
The green fluorescence signal localizing PR1 was mainly detected in the epidermis cell wall, but also in the trichomes cells. PR1 was also detected in vascular bundles regardless of genetic background (Figure S1 in Supplementary Materials). Analyzing the quantification of immunogold-labeled PR1, a low level of PR1 antigen in mock-inoculated Col-0 plants was revealed (Figure 11), whereas Col-0 plants displayed an over five-fold induction as compared to mock-inoculated plants at 3 dpi. Moreover, the rbohD mutant displayed the highest induction (20.03-fold), in contrast to PR1 rbohF and rbohD/F, which displayed the lowest induction with TuMV at 3 dpi (2.88-fold and 3.18-fold, respectively). However, the level of detectable PR1 decreased by 1.309- to 2.317-fold between 3 and 7 dpi in all mock- and virus-inoculated plants, with the lowest decrease observed in rbohF and rbohD/F. The amount of PR1 protein in the different lines correlates with the level of TuMV proliferation and the number of virus particles, suggesting that PR1 is a good marker for virus infection and that it could play a role in stopping the virus.

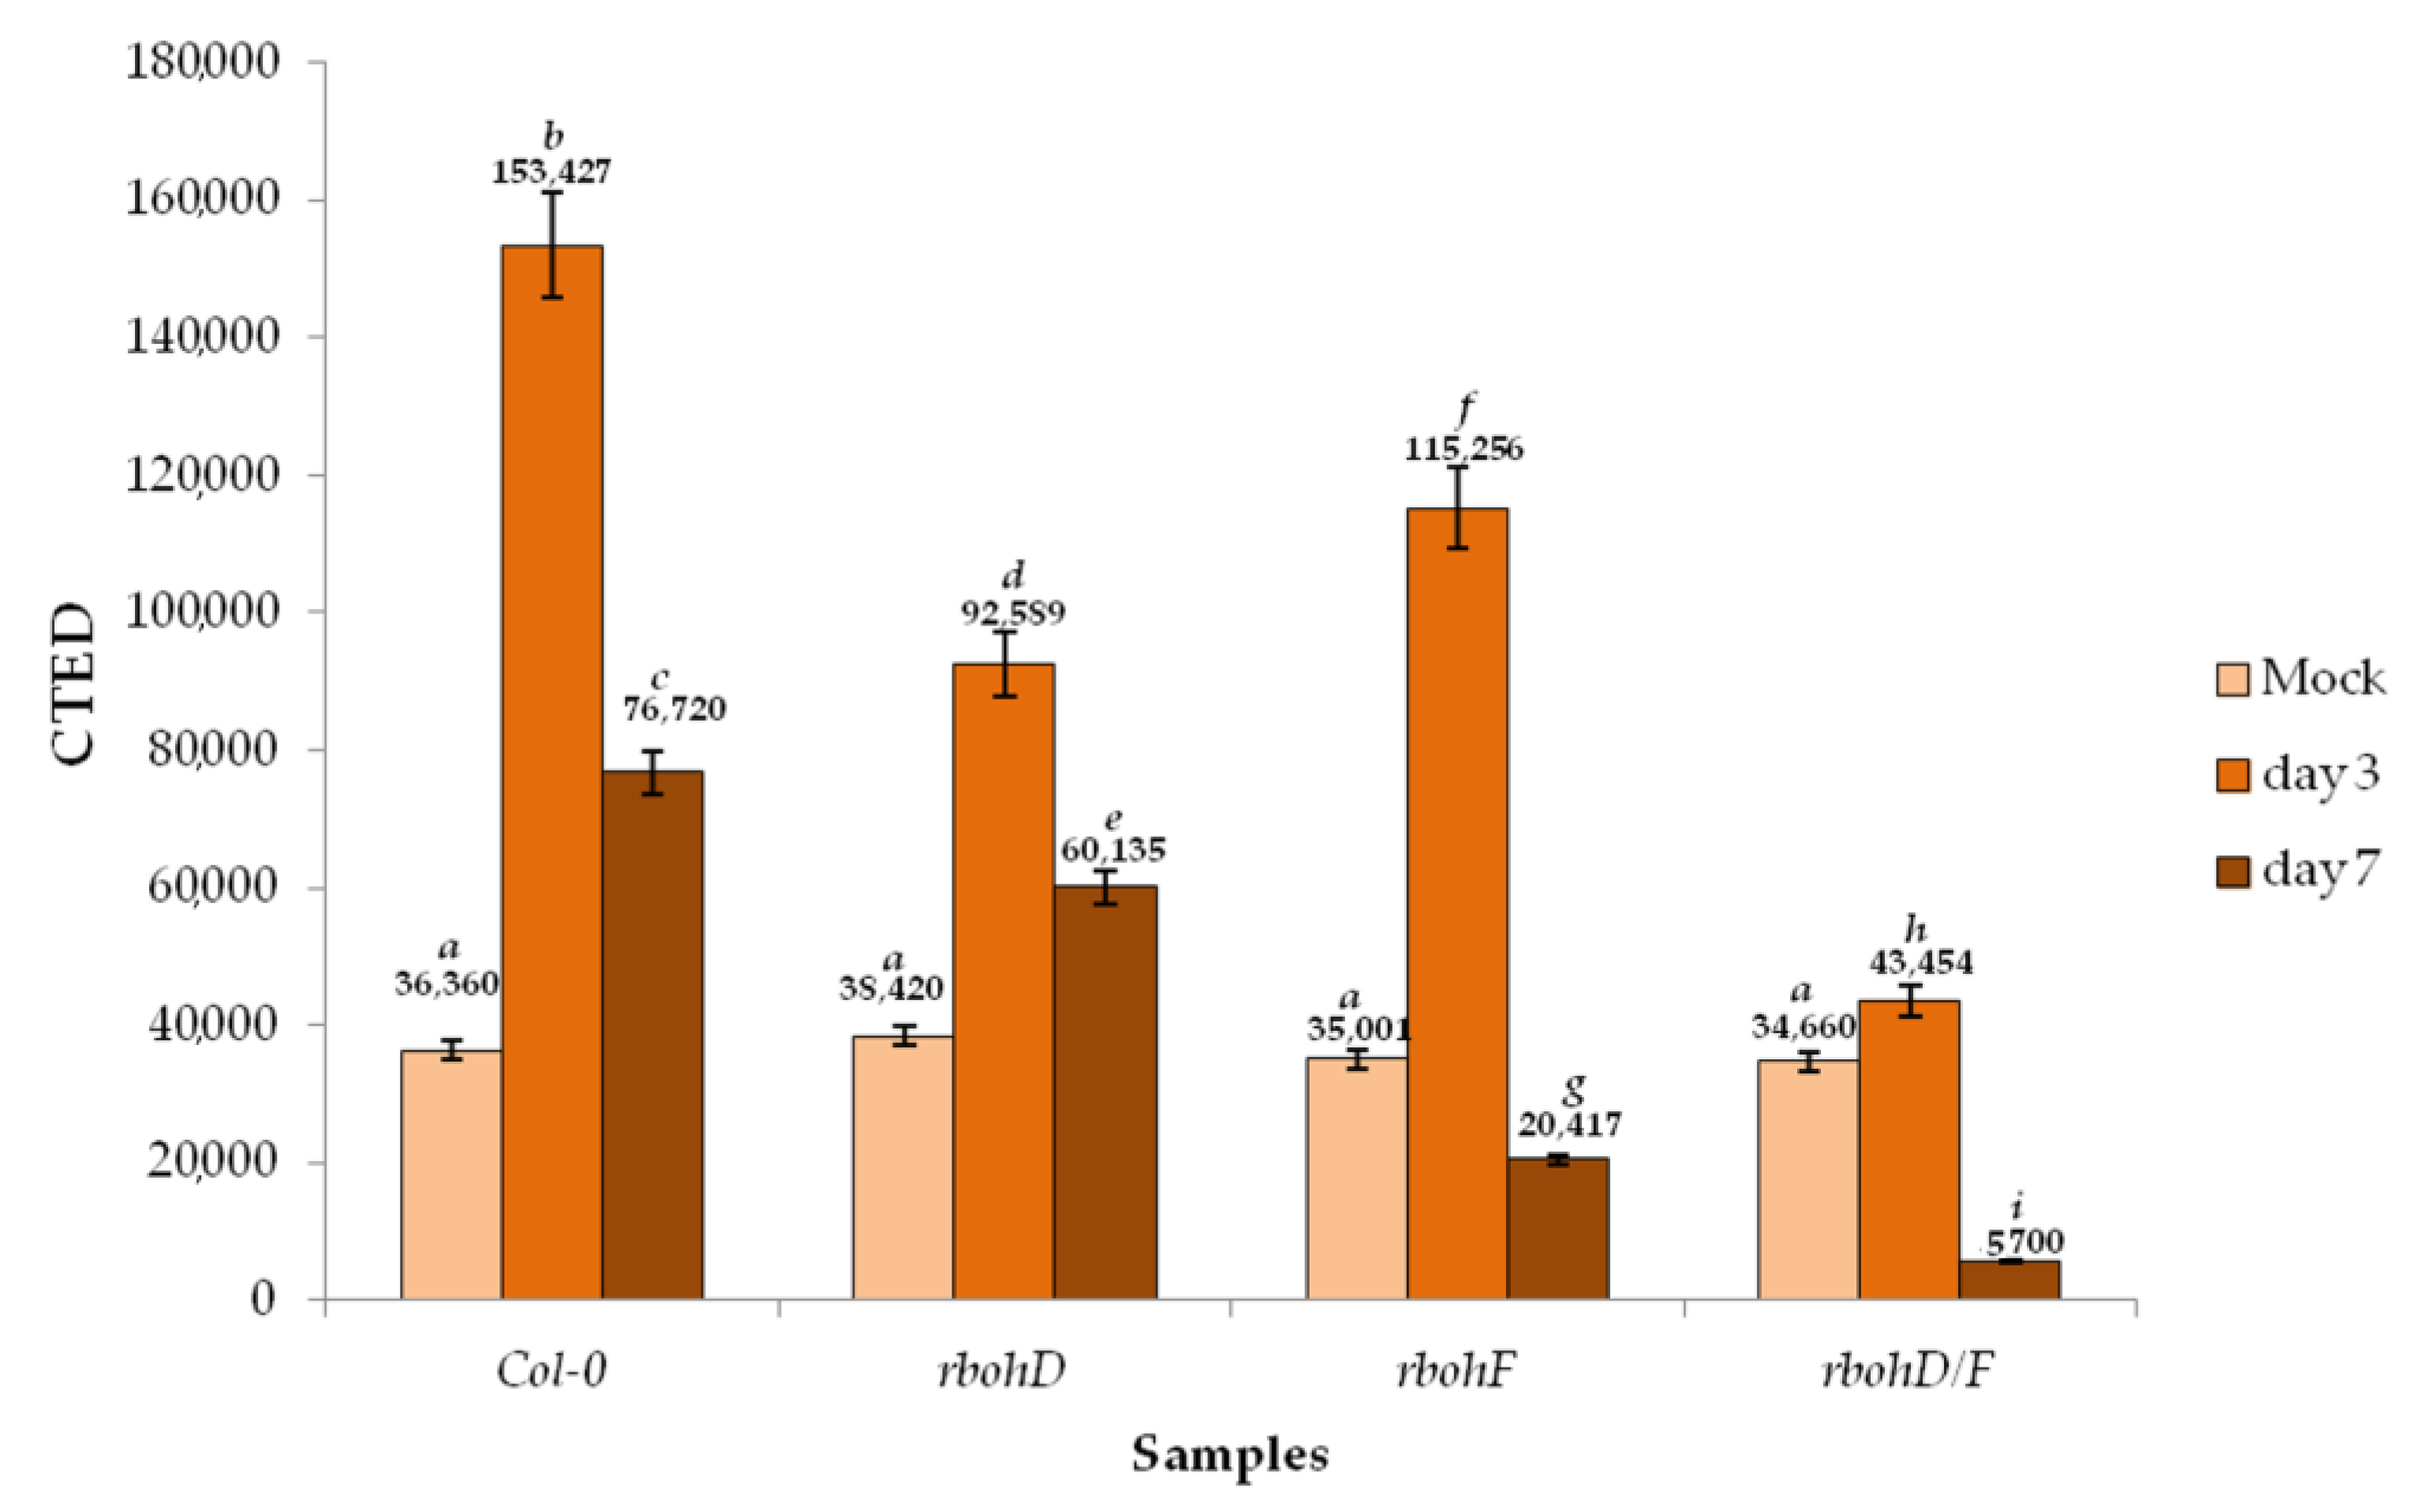
2.5. H2O2 in Response to TuMV Infection

We performed an in situ detection of H2O2 by cerium (IV) perhydroxide labeling in all four genotypes after TuMV infection and determined the corrected total electron density (CTED) based on the density of cerium perhydroxide precipitates. Analyses of the electron micrographs indicate that the H2O2 was induced by TuMV at 3 dpi as compared to mock-inoculated plants, and decreased subsequently at 7 dpi (Figure 12, Figure 13 and Figure 14). The levels of hydrogen peroxide in mock-inoculated Col-0 and in the three mutants were statistically similar. The concentration of H2O2 increased at 3 dpi, with the highest intensity in Col-0 followed by rbohD, and the least in rbohD/F. However, in Col-0 tissues the deposition of H2O2 occurred mainly along vesicular membranous structures and along the endoplasmic reticulum (Figure 12A–C). A similar pattern was observed in rbohD plants, although in this genotype H2O2 was also observed in vacuoles and in the apoplast (Figure 12D,F).
In contrast, in rbohF and rbohD/F H2O2 deposits were observed mainly along the cell wall (also in plasmodesmata) in the apoplast near necrotized areas (Figure 13A–F). Regardless of the genotype, H2O2 extensively decreased between 3 and 7 dpi (Figure 14), most notably in rbohF and rbohD/F. These data indicate that the two Rboh contribute to the H2O2 produced during TuMV infection, although the patterns of H2O2 driven by RbohD and RbohF seem to be different. These NADPH oxidases are responsible for most of these ROS produced after TuMV inoculation. Both RbohD and RbohF contribute to the ROS detected, but RbohD’s contribution is more important. Moreover, there are qualitative differences between the ROS that are dependent on each RBOH. Since rbohF and rbohD/F displays fewer ROS but enhanced resistance, this implies that the subset of RbohF-dependent ROS promotes susceptibility.

3. Discussion

3.1. RbohD Limits Accumulation of TuMV in Arabidopsis

Plant NADPH oxidases have emerged as important regulators of many responses to the environment, and many studies document the role of plant NADPH oxidases in different plant–pathogen interactions [36,37,38]. However, the function of these enzymes in plant–virus interactions remains poorly investigated. In this work, we focuses on two Arabidopsis NADPH oxidase genes, RbohD and RbohF, the two highest expressed homologues that are pleiotropic and act often redundantly in many immune responses to a wide range of pathogens [31,32,36]. We analyzed the responses to infection with the Turnip mosaic virus, the most threatening viral pathogen on Brassicaceae. Using Arabidopsis rbohD and rbohF transposon mutants, we demonstrated that rbohD supports more TuMV proliferation compared to Col-0 (and rbohF), especially at later times (Figure 1). Ultrastructural studies confirmed these results. TuMV infection effects were more severe in rbohD tissues, where TuMV induced typical potyviral cytoplasmic inclusions not only in mesophyll cells but also in phloem and xylem cells, providing evidence for systemic virus spread (Figure 3A–D). Moreover, virus particles and inclusions were observed at 3 dpi and were more intense than in the other genotypes (Figure 6A–D and Figure 7A–D). Consequently, in situ quantification of virus particles in these tissues showed that rbohD supports the highest accumulation of TuMV (Figure 8). Thus, these results suggest that RbohD contributes to stop TuMV proliferation and spread. Our findings are similar to those observed with other pathogens—e.g., the rbohD mutant was found to be more susceptible than wild type Arabidopsis to infection with different biotrophic and necrotrophic fungi and bacteria [36,37,39]. Moreover, our findings on TuMV are in accordance with the results from other potyviruses. A recent study reports that the potato RbohD orthologue limits the systemic spread of a tagged Potato Virus Y construct (PVYN-GFP) to upper (non-inoculated) leaves [40]. In view of our previous studies concerning RbohD in a potato–PVYNTN system [41] and comparing with current data on TuMV–rbohD interactions, it seems clear that RbohD has an important contribution to the resistance response to Potyvirus. In agreement, high levels of RbohD transcript were associated with resistance and hypersensitive response (HR) to PVY [30]. However, RbohD contribution to resistance is not general to all pathosystems—e.g., rbohD supports less Alternaria brassicola biomass growth than in wild type or rbohF, suggesting that RbohD does not develop a specific antifungal activity and does not act as a resistance factor, but rather could play a role as a cell death regulator [42]. In other pathosystems with avirulent and virulent bacteria or with the necrotrophic fungus Botrytis cinerea, the responses in rbohD (or rbohF) were not accompanied by an enhanced growth of the pathogen [36,43,44]. Therefore, resistance is not a general trait associated with RbohD.

3.2. RbohF Promotes TuMV Virulence in Arabidopsis

Intriguingly, rbohF and rbohD/F display less TuMV accumulation at 3 dpi than Col-0 (Figure 1), also confirmed by the detection of TuMV in situ at the ultrastructural level (Figure 4A–D, Figure 5A–D and Figure 7A–D). After virus inoculation, rbohF and rbohD/F mutants displayed changes in their chloroplasts, induction of multivesicular structures, or the appearance of single membranes with tubular structures as an effect of TuMV inoculation (Figure 4 and Figure 5). These changes have been documented in other infections with viruses [45,46], and may be an effect of cell wall rebuilding, as we previously documented for PVYNTN [47,48,49]. The cell wall rebuilding was especially noticeable in the TuMV–rbohD/F interaction and was often accompanied with phenolic-like compounds located inside xylem tracheary elements. Additionally, rbohF and especially rbohD/F mutants exhibited local necrosis at the 7-day time point, typical of the hypersensitive response (HR; Figure S2). Importantly, these ultrastructural changes in rbohF or rbohD/F were associated with fewer virus particles, as compared to Col-0 and rbohD interactions. Moreover, rbohF or rbohD/F particles were located in the vacuole and occasionally in small vacuole-like structures or vesicles in the mesophyll cell of the inoculated leaf, and no cytoplasmic inclusions were observed. This less severe TuMV infection in these mutants and the fact that virus was not able to create the inclusions needed for further spread through host cells suggests that RbohF promotes viral replication and increases susceptibility to TuMV. Although RbohF has mostly been associated with the establishment of immunity, some studies document its role in susceptibility, as rbohF displays increased resistance in response to several pathogens compared to the wild type [36,43]. Thus, again, resistance is not always associated with RbohF, and its function may vary depending on the pathosystem.
However, it is noticeable that rbohD and rbohF mutants display opposed effects in the Arabidopsis–TuMV interaction, suggesting that RbohD and RbohF play different and opposing roles in response to this virus. Usually, studies on the double mutant rbohD/F document an additive effect in response to pathogens as well as abiotic stress [43,50,51]. Our findings indicate that ROS produced by these two oxidases may have a qualitative (spatial or temporal) difference to signal these opposite functions.

3.3. RbohD and RbohF Are Responsible for Most ROS Produced during TuMV Infection

In contrast to other works, where the H2O2 level was determined macroscopically via DAB (3,3′-diaminobenzidine) application, here we quantified in situ the location of H2O2 by histochemical densitometry on the electron micrographs of infected tissues (Figure 12A–F, Figure 13A–F and Figure 14). This H2O2 accumulation after TuMV was transitory, since Col-0 showed an induction of H2O2 accumulation at 3 dpi that was reduced at 7 dpi. Production of ROS was partially compromised in the NADPH oxidase mutants, with rbohD showing a greater reduction in levels of H2O2 than in rbohF. These data suggest that RbohD is responsible for most ROS produced during TuMV infection, as has been shown in the response to many other pathogens [32,43]. This is in agreement with the higher level of expression of this homologue [29]. rbohD/F showed an additive reduction in ROS, suggesting than these two oxidases contribute to ROS production. A similar “gradation” in H2O2 levels in these mutants has also been documented in response to other pathogens [43,50]. Interestingly, our study revealed a different pattern of H2O2 localization between susceptible/resistant genotypes. In Col-0 and rbohD, the most susceptible genotypes, H2O2 decorated the vesicular and membranous structures, and was also detected inside vacuoles and in the area between the cell wall and plasmalemma—areas where a profusion of virus particles were present (Figure 12A–F). By contrast, in rbohF and rbohD/F, the most resistant genotypes, the deposits of hydrogen peroxide were linked to the cell wall, near plasmodesmata and in the area around necrotizing cells. This pattern of H2O2 deposition evidences a possible longer distance transport of these reactive species in these genotypes [52,53] and/or a putative role in plasmodesmatal permeability, a factor that could contribute to the resistance response to the virus [54]. In addition, these resistant genotypes displayed apparent necrosis, typical of the HR-like reaction, with characteristic rebuilding of cell walls and deposition of phenolic-like compounds inside xylem elements. The commonly accepted hypothesis predicts that the suppression of virus spread and multiplication during HR is due to the necrosis, which leads to virus resistance [55]. H2O2 has been identified as a key signaling molecule promoting HR-cell death [44], with the contribution of NADPH oxidases (in Arabidopsis RbohD and RbohF) as the usual source of ROS defense-related ROS generation [31,36,56,57]. However, these ROS can also inhibit necrosis in some pathosystems [42,48]. Even in some plant–virus interactions, downregulation of ROS and activation of antioxidant enzymes do associate with the suppression of virus-induced necrotization and susceptibility [57,58]. In our studies, we observed that the greater reduction in H2O2 in rbohD correlate with the lower level of necrosis and the greatest susceptibility to TuMV, suggesting that RbohD-dependent ROS contributes to restrict TuMV infection. Similar findings, where downregulation of RBOH-dependent ROS drove the suppression of the HR, have been documented in other plant–pathogen interactions such as in response to the hemibiotrophic bacterium Pseudomonas syringae or the hemibiotrophic oomycete Phytophthora infestans [31,38]. However, in our studies, although rbohF also displayed lower ROS production compared to Col-0, this genotype exhibited extensive necrosis and was more resistant, which indicates that RbohF-dependent ROS contributes to negatively regulate the HR and promotes susceptibility to this virus. This reduction in Rboh-dependent ROS with an increase in the HR has also been observed in response to some pathosystems such as to an avirulent P. syringae strain or to the biotrophic oomycete Hyaloperonospora arabidopsidis [31,59]. Thus, ROS might serve different signaling functions in different types of disease resistance and in the HR. Even the dual role for the same oxidase has been suggested, with ROS produced by RbohD acting as positive or negative regulator of cell death in different cellular contexts during the same Arabidopsis-A. brassicicola interaction [42]. The different localization of TuMV-induced H2O2 in rbohD and rbohF mutants suggests that RbohD and RbohF drive ROS generation at different locations, and that these different pools of ROS could be responsible for these opposed functions. This may be related to their differential pattern of expression. Although both oxidases are transcriptionally upregulated by pathogens, they present a differential spatio-temporal expression patter that contributes to fine-tune Rboh-dependent ROS production [29]. Intriguingly, rbohD/F displayed additive reduction in H2O2 but presented the same enhanced resistance than rbohF. This dominant effect of the rbohF mutation could indicate that RbohF acts as a susceptibility factor. It has also been documented that Red clover necrotic mosaic virus (RCNMV), a Dianthusvirus, hijacks the host generation of reactive oxygen species during infections [60] while RCNMV replication proteins were associated with the ROS-generating system and triggered the ROS-burst, similarly to Brome mosaic virus replication which also depends on ROS [60]. Alternatively, since rbohD/F (and rbohF) plants displayed HR-like necrosis, the enhanced dominant resistance in rbohD/F could be associated with the compensatory activation of other defense pathways leading to cell death/necrosis [39].

3.4. PR1 Accumulation Correlates with TuMV Virulence

Pathogenesis-related proteins (PRs) are usually induced during pathogen infection and biotic stresses and are classically associated with resistance [61]. It has been long hypothesized that H2O2 is able to upregulate the defense gene PR1 [62,63]. However, our data regarding localization and quantification of Arabidopsis PR1 protein do not support these ideas. PR1 protein quantification indicated that PR1 deposition was induced as an effect of TuMV inoculation compared to mock-inoculated plants in all genotypes analyzed (Figure 9, Figure 10 and Figure 11). However, similarly to CTED analyses of H2O2 precipitates, PR1 depositions significantly decreased between 3 and 7 dpi. Notably, our analyses revealed that the highest buildup of PR1 was observed in the most susceptible lines, rbohD and Col-0, whereas the weakest accumulation of PR1 was observed in rbohF and rbohD/F, the mutants that restricted virus concentration. Thus, our studies suggest a correlation between PR1 accumulation and susceptibility. Indeed, it has been suggested in other plant–virus interactions that PR1 is rather related to susceptibility than to resistance [64]. The expression of PR1 appears to largely differ among experimental systems and seems to depend on various factors including plant species, plant organs, cell type and the tissue colonization by different pathogens. During the infection of Capsicum chinense Jacq. With virulent isolates of PepMMoV, the peak of PR1 expression and virus accumulation occurred at 4 dpi [65]. Noticeably, in the Arabidopsis-A. brassicola pathosystem, rbohD plants also displayed increased PR1 protein accumulation and enhanced susceptibility to this pathogen compared to Col-0 [42]. In addition, our ultrastructural studies revealed a different location of PR1 accumulation between susceptible and resistant interactions. The most susceptible interactions (Col-0-TuMV and rbohD-TuMV) presented strong PR1 depositions in the cell wall at the sites where virus particles and inclusions were present. However, in atrbohF or atrbohD/F, the lines where the virus infection cycle was limited, PR1 appeared around multivesicular bodies and rebuilt cell wall areas. These data suggest that more than the amount of PR1 protein itself, the areas where PR1 deposition occur are more important for the limitation of the virus infection cycle. Immunofluorescence localization of PR1 indicates the preferential accumulation of PR1 in the leaf epidermis, within the basis of trichomes, and in vascular tissues (Figure S1). This observation was similar to that of Hoegen et al. [66], who reported PR1b in epidermal cells, glandular trichomes and leaf vascular bundles. The higher accumulation of PR1 protein in the more susceptible lines was probably because of the larger amount of plant cells responding to the multiplying virulent pathogen. However, PR1 is not believed to possess antiviral activity and SA (salicylic acid)-mediated responses to incompatible virus infection are almost activated by NPR1-independent pathways [67,68]. Nevertheless, the specific localization of PR1 in the most resistant genotypes after TuMV inoculation may indicate a connection of PR1 induction with susceptibility, which may be characteristic for this pathosystem. However, further studies are needed to confirm this idea.

4. Materials and Methods

4.1. Plant Material, Virus Inoculation and DAS-ELISA Test for Virus Levels

To determine changes in viral infections induced by Turnip mosaic virus (TuMV) and related to RBOHD and RBOHF, we used Arabidopsis thaliana (L.) Heynh wild type (Col-0) plants and specific mutants—Arabidopsis thaliana rbohD (knockout mutant carrying a single dSpm transposon insertion in RbohD), Arabidopsis thaliana rbohF (AtrbohF, knockout mutant carrying a single dSpm transposon insertion in RbohF) and double Arabidopsis thaliana rbohD rbohF (atrbohD/F, double knockout obtained by crossing atrbohF and atrbohD single mutants) [43]. All homozygous mutant seeds were kindly provided from Miguel-Angel Torres laboratory. Importantly, for TuMV inoculation described below, we used 19-day-old plants without any lesions and/or alterations.
Fifty plants of Col-0 and fifty plants of each type of mutant were mechanically inoculated as described by Tomilson (1970) and Walsh and Jenner (2002) [69,70] by using the TuMV inoculum (isolate PV-0104 from Leibniz Institute, Braunschweig, Germany) in phosphate buffer [71]. Leaves of mock- and TuMV-inoculated plants were assessed for the presence of virus by using DAS-ELISA, as published before by Kozieł et al. [72], with the primary antibodies against the TuMV (Bioreba, Reinach, Switzerland), followed by purified antirabbit antibodies conjugated with alkaline phosphatase (Bioreba, Switzerland) [73]. Each repeat was performed in a new ELISA plate with samples. For each test, samples from 15 mock-inoculated wide type or mutant plants were combined separately; the same was carried out for TuMV-inoculated plants. All DAS-ELISA tests were performed using the same reagents. The readings of OD405nm values were acquired after 60 min in duplicate, 3 and 7 days after inoculation. The mean OD405nm values were statistically assessed with a one-factor analysis of variance (ANOVA), as described in Kozieł et al. [72] with the Statistica software (version 13.0; StatSoft and TIBCO Software Inc., Palo Alto, CA, USA). For a more precise assessment, the corrected mean OD405nm values were computed as presented in [72] and used to compare the relative level of virus presence/concentration in plants. The cut-off point was also calculated by using a formula suggested by Bioreba (Switzerland) [74]:
Cut-off = mean value (of all negative-healthy plants from 3 and 7 dpi) × 3
This calculated cut-off point value was 0.1738. The readings of OD405 were compared to the calculated cutoff point and all OD405 values greater than 0.1738 were considered positive (confirmed presence of virus) [75]. Significance threshold/cut-off point values of DAS-ELISA confirmed the presence of the virus in all inoculated Arabidopsis thaliana plants.

4.2. Material Preparation for TEM Ultrastructural Analyses, Immunogold Localizations and Statistical Quantification of Both TuMV Epitopes and PR1

Approximately 15 fragments near the main vein of leaves from mock-inoculated (without symptoms, Figure S2) and TuMV-inoculated plants (with symptoms) at 3 and 7 dpi were fixed, post-fixed, dehydrated and embedded in Epon 812 (Fluka) resin according to the procedure presented in (Table S1) [47,76]. Leaf samples were collected 3 times, every time from a new group of twenty plants (in two time points, at 3 and 7 dpi) After TEM material preparation, the 50–70 nm sections from leaves were mounted on Formvar-coated copper grids (for ultrastructural analyses) or nickel grids (for immunogold analyses). The latter were treated exactly as described in [41,47]. This procedure was performed to detect the TuMV but also PR1 epitopes. Localization of TuMV and PR1 was determined separately by using different types of primary polyclonal rabbit antibodies. Firstly, the anti-TuMV antibodies were used (Bioreba, Switzerland) in a 1:50 dilution for detecting the virus, followed by the anti-PR1 antibodies (Agrisera, Vänäs, Sweden), also in a 1:50 dilution. To visualize the location of TuMV and PR1, we used a secondary antirabbit antibody conjugated with nanogold particles with sizes of 18 nm (Jackson Immuno Research Europe Ltd., Cambridgeshire, UK) in a dilution 1:100. The labeling specificity was checked by incubating grids with material from mock-inoculated plants and by omission of the primary antibody from the incubating solution. The grids were then counterstained with 1% uranyl acetate for 5 min and washed 5 times for 2 min each with distilled water. The immunogold-labeled sections on grids were examined using transmission electron microscopy (TEM, FEI M268D “Morgagni” transmission electron microscope) [47,48]. After examination of TuMV and PR1 localization, the labeling quantification of general specific localization was based on Otulak-Kozieł et al. [47]. The analysis of variance was applied to the data for the gold particle concentrations by using (ANOVA) and the post-hoc Tukey HSD test in STATISTICA software (StatSoft and TIBCO Software Inc., Palo Alto, CA, USA, version 13.0). ANOVA was used as an efficient estimator of gold labeling. For the statistical estimation of immunogold labeling, we compared infected and healthy (mock-inoculated) plants of mutants. Gold particles in cell compartments were counted in forty 10-μm images with 2 fields per image. In each combination the gold particles from 200 photos were counted for TuMV and PR1.

4.3. Immunofluorescence Localization of PR1

The virus- and mock-inoculated leave tissues were treated as previously described by Kozieł et al. [77]. To assess the distribution of PR1, it was localized by an immunofluorescence method according to Kozieł et al. [78]. The primary antibody targeted PR1 with the procedure described above in Section 4.2. The secondary antibody was antirabbit anti-IgG carrying the attached AlexaFluor®488 (Abcam, Cambridge, UK). Slides were imaged under a PROVIS AX70 fluorescent microscope with an Olympus UP90 high-definition camera (Olympus, Warsaw, Poland) and the photos were analyzed using Olympus Cell Sense Standard Software (version 1.18; Olympus, Center Valley, PA, USA).

4.4. Localization and Quantification of H2O2 by CTED Method

Detection of H2O2 was accomplished using CeCl3 as described by Bestwick et al. [79] with changes published by Otulak and Garbaczewska [80] and Kozieł et al. [72]. The leaf tissues were shortly pre-incubated in 50 mM MOPS buffer (pH 7.2) containing 5 mM CeCl3, washed for one hour with the same buffer, and fixed according to the procedure of Otulak and Garbaczewska [80]. Samples were contrasted and fixed in 2% (w/v) OsO4 in a cacodylate buffer and dehydrated in a series of ethanol–water washings, as described in Kozieł et al. [72]. The material was gradually saturated with Epon 812 (Fluka) and polymerized according to the procedure in [80]. Observations were made as previously described in [77]. To quantify the level of H2O2, a CTED method was used as presented by Kozieł et al. [72] which enables the analysis of distribution of electron-dense cerium (IV) perhydroxide precipitates. The electron density of these precipitates is directly proportional to the amount of H2O2. Then, CTED values were analyzed for statistical significance according to methodology presented by Kozieł et al. [72] with ANOVA and Tukey’s post-hoc HSD test performed using Statistica software (version 13.0; StatSoft and TIBCO Software Inc., Palo Alto, CA, USA).

5. Summary

In this study we compared the ultrastructural effects of TuMV infection on A.thaliana Col-0 and NADPH oxidase rbohD and rbohF transposon mutants and performed in situ localization and quantification of virus particles, H2O2 and PR1 proteins. TuMV infection in rbohD led to a systemic development of virus infection. The virus concentration and localization significantly increased between 3 and 7 days after inoculation in rbohD, even more dynamically than in Col-0. In this mutant, in situ localization of H2O2 correspond with virus particles and was observed in vacuoles and between the cell wall and plasmalemma. Moreover, quantification of H2O2 showed that rbohD-inoculated plants displayed a considerable reduction in ROS accumulation compared to Col-0. ROS derived from RbohD plays a role in the resistance response to TuMV in this pathosystem. Opposite to rbohD, a significant decrease in virus infection cycle was observed in rbohF and rbohD/F compared to Col-0 or rbohD. Interestingly, rbohD/F response was accompanied by local necrosis, typical for HR-like reactions, with the characteristic rebuilding of cell walls, phenolic-like compounds deposition inside xylem elements, together with the rare occurrence of virus particles and complete lack of virus inclusions. Noticeably, in situ localization of H2O2 in these more susceptible genotypes revealed that the deposits of hydrogen peroxide were differentially linked to the cell wall, near plasmodesmata and in the area around necrotizing cells. This pattern of H2O2 deposition evidenced a possible longer distance transport of these reactive species in these genotypes that could contribute to the enhanced resistance observed. Deposition of PR1 protein was activated in all A. thaliana variants compared to mock-inoculated plants, but the more susceptible rbohD plants displayed a higher level of PR1, whereas rbohF and rbohD/F displayed a lower accumulation. Our qualitative and quantitative analyses indicated that PR1 location strictly parallels the virus alterations, although it is not clear that the PR1 induction acts as an antiviral factor. The important role of ROS produced by NADPH oxidases in regulating the Arabidopsis response to TuMV and a differential role of RbohD and RbohF in this interaction were revealed.
Further molecular and cellular studies are needed to elucidate the possible role of other signaling molecules (e.g., nitric oxide metabolism and calcium signature distribution) that may potentially serve as active components in the A. thaliana–TuMV pathosystem. It has been reported that nitric oxide signaling and calcium protein kinases (among other kinases) can modulate NADPH oxidase activity; these analyses may help provide a better understanding of the mechanisms modulating A. thaliana–TuMV interactions.

Supplementary Materials

Supplementary Materials can be found at https://www.mdpi.com/1422-0067/21/22/8510/s1.

Author Contributions

Conceptualization, K.O.-K.; methodology, K.O.-K., J.F.-Ł. and E.K.; software, E.K.; validation, K.O.-K., M.A.T. and E.K.; formal analysis, K.O.-K., J.J.B. and M.A.T.; investigation, K.O.-K., E.K. and J.F.-Ł.; resources, K.O.-K. and E.K.; data curation, K.O.-K. and M.A.T.; writing—original draft preparation, K.O.-K.; writing—review and editing, K.O.-K., J.J.B. and M.A.T.; visualization, K.O.-K.; supervision, K.O.-K. and M.A.T.; project administration, K.O.-K. and E.K.; funding acquisition, K.O.-K. and E.K. All authors have read and agreed to the published version of the manuscript.

Funding

The work was conducted during the realization of a project financed by the National Science Center, Poland; NCN project decision number: 2019/03/X/NZ9/00499 given to E.K. and NCN project decision number: 2018/02/X/NZ9/00832 given to K.O.-K. Funding for MAT comes from RTI2018-096975-B-I00 grant of Spanish Ministry of Science, Innovation and Universities.

Acknowledgments

The authors would like to thank Benham E.L. Lockhart for editorial help in English language correction.

Conflicts of Interest

The authors declare no conflict of interest.

References

  1. Revers, F.; García, J.A. Molecular biology of potyviruses. Adv. Virus Res. 2015, 92, 101–199. [Google Scholar] [PubMed]
  2. Jenner, C.E.; Tomimura, K.; Ohshima, K.; Hughes, S.L.; Walsh, J. Mutations in Turnip mosaic virus P3 and cylindrical inclusion proteins are separately required to overcome two Brassica napus resistance genes. Virology 2002, 300, 50–59. [Google Scholar] [CrossRef] [PubMed] [Green Version]
  3. Liu, X.P.; Lu, W.C.; Liu, Y.K.; Li, J.L. A study of TuMV strain differentiation of cruciferous vegetables from ten provinces of China. Chin. Sci. Bull. 1990, 35, 1734–1739. [Google Scholar]
  4. Yoon, J.Y.; Green, S.K.; Opena, R.T. Inheritance of resistance to Turnip mosaic virus in Chinese cabbage. Euphytica 1993, 69, 103–108. [Google Scholar] [CrossRef]
  5. Kehoe, M.A.; Coutts, B.A.; Jones, R.A. Resistance phenotypes in diverse accessions, breeding lines, and cultivars of three mustard species inoculated with Turnip mosaic virus. Plant Dis. 2010, 94, 1–9. [Google Scholar] [CrossRef] [Green Version]
  6. Shattuck, V.I.; Stobbs, L.W. Evaluation of rutabaga cultivars for Turnip mosaic virus resistance and the inheritance of resistance. HortScience 1987, 22, 935–937. [Google Scholar]
  7. Hardwick, N.V.; Davies, J.M.L.; Wright, D.M. The incidence of three virus diseases of winter oilseed rape in England and Wales in the 1991/92 and 1992/93 growing seasons. Plant Pathol. 1994, 43, 1045–1049. [Google Scholar] [CrossRef]
  8. Laliberté, J.F.; Zheng, H. Viral manipulation of plant host membranes. Annu. Rev. Virol. 2014, 1, 237–259. [Google Scholar] [CrossRef]
  9. Cotton, S.; Grangeon, R.; Thivierge, K.; Mathieu, I.; Ide, C.; Wei, T.; Wang, A.; Laliberté, J.F. Turnip mosaic virus RNA replication complex vesicles are mobile, align with microfilaments, and are each derived from a single viral genome. J. Virol. 2009, 83, 10460–10471. [Google Scholar] [CrossRef] [Green Version]
  10. Dufresne, P.J.; Thivierge, K.; Cotton, S.; Beauchemin, C.; Ide, C.; Ubalijoro, E.; Laliberté, J.F.; Fortin, M.G. Heat shock 70 protein interaction with Turnip mosaic virus RNA-dependent RNA polymerase within virus-induced membrane vesicles. Virology 2008, 374, 217–227. [Google Scholar] [CrossRef] [Green Version]
  11. Grangeon, R.; Jiang, J.; Wan, J.; Agbeci, M.; Zheng, H.; Laliberté, J.F. 6K2-induced vesicles can move cell to cell during Turnip mosaic virus infection. Front. Microbiol. 2013, 4, 1–10. [Google Scholar] [CrossRef] [Green Version]
  12. Wan, J.; Basu, K.; Mui, J.; Vali, H.; Zheng, H.; Laliberté, J.F. Ultrastructural characterization of Turnip mosaic virus-induced cellular rearrangements reveals membrane-bound viral particles accumulating in vacuoles. J. Virol. 2015, 89, 12441–12456. [Google Scholar] [CrossRef] [Green Version]
  13. Movahed, N.; Sun, J.; Vali, H.; Laliberté, J.F.; Zheng, H. A host ER fusogen is recruited by Turnip mosaic virus for maturation of viral replication vesicles. Plant Physiol. 2019, 179, 507–518. [Google Scholar] [CrossRef] [Green Version]
  14. Jenner, C.E.; Wang, X.; Ponz, F.; Walsh, J.A. A fitness cost for Turnip mosaic virus to overcome host resistance. Virus Res. 2002, 86, 1–6. [Google Scholar] [CrossRef]
  15. Robbins, M.A.; Witsenboer, H.; Michelmore, R.W.; Laliberte, J.F.; Fortin, M.G. Genetic mapping of Turnip mosaic virus resis-tance in Lactuca sativa. Theor. Appl. Genet. 1994, 89, 583–589. [Google Scholar] [CrossRef]
  16. Walsh, J.A.; Sharpe, A.G.; Jenner, C.E.; Lydiate, D.J. Characterization of resistance to Turnip mosaic virus in oilseed rape (Brassica napus) and genetic mapping of TuRB01. Theor. Appl. Genet. 1999, 99, 1149–1154. [Google Scholar] [CrossRef]
  17. Jenner, C.E.; Walsh, J.A. Pathotypic variation in Turnip mosaic virus with special reference to European isolates. Plant Pathol. 1996, 45, 848–856. [Google Scholar] [CrossRef]
  18. Walsh, J.A. Genetic control of immunity to Turnip mosaic virus in winter oilseed rape (Brassica napus ssp. oleifera) and the effect of foreign isolates of the virus. Ann. Appl. Biol. 1989, 115, 89–99. [Google Scholar] [CrossRef]
  19. Coutts, B.A.; Walsh, J.A.; Jones, R.A. Evaluation of resistance to Turnip mosaic virus in Australian Brassica napus genotypes. Aust. J. Agric. Res. 2006, 58, 67–74. [Google Scholar] [CrossRef]
  20. Jungkunz, I.; Link, K.; Vogel, F.; Voll, L.M.; Sonnewald, S.; Sonnewald, U. AtHsp70-15-deficient Arabidopsis plants are characterized by reduced growth, a constitutive cytosolic protein response and enhanced resistance to TuMV. Plant J. 2011, 66, 983–995. [Google Scholar] [CrossRef]
  21. Hashimoto, M.; Neriya, Y.; Yamaji, Y.; Namaba, S. Recessive resistance to plant viruses: Potential resistance genes beyond translation initiation factors. Front. Microbiol. 2016, 7, 1–11. [Google Scholar] [CrossRef] [PubMed] [Green Version]
  22. Castelló, M.J.; Carrasco, J.L.; Vera, P. DNA-binding protein phosphatase AtDBP1 mediates susceptibility to two potyviruses in Arabidopsis. Plant Physiol. 2010, 153, 1521–1525. [Google Scholar] [CrossRef] [PubMed] [Green Version]
  23. Sui, N.; Wang, Y.; Liu, S.S.; Yang, Z.; Wang, F.; Wan, S.B. Transcriptomic and physiological evidence for the relationship between unsaturated fatty acid and salt stress in peanut. Front. Plant Sci. 2018, 9, 1–12. [Google Scholar] [CrossRef] [PubMed] [Green Version]
  24. Liu, S.S.; Wang, W.Q.; Li, M.; Wan, S.B.; Sui, N. Antioxidants and unsaturated fatty acids are involved in salt tolerance in peanut. Acta Physiol. Plant. 2017, 39, 1–20. [Google Scholar] [CrossRef]
  25. Sui, N.; Tian, S.S.; Wang, W.Q.; Wang, M.J.; Fan, H. Overexpression of glycerol-3-phosphate acyltransferase from Suaeda salsa improves salt tolerance in Arabidopsis. Front. Plant Sci. 2017, 8, 1–14. [Google Scholar] [CrossRef] [PubMed]
  26. Sewelam, N.; Kazan, K.; Schenk, P.M. Global plant stress signaling: Reactive oxygen species at the cross-road. Front. Plant Sci. 2016, 7, 1–21. [Google Scholar] [CrossRef] [PubMed] [Green Version]
  27. Camejo, D.; Guzmán-Cedeño, Á.; Moreno, A. Reactive oxygen species, essential molecules, during plant-pathogen interactions. Plant Physiol. Biochem. 2016, 103, 10–23. [Google Scholar] [CrossRef]
  28. Doke, N.; Ohashi, Y. Involvement of an O2 generating system in the induction of necrotic lesions on tobacco leaves infected with tobacco mosaic virus. Physiol. Mol. Plant Pathol. 1988, 32, 163–175. [Google Scholar] [CrossRef]
  29. Morales, J.; Kadota, Y.; Zipfel, C.; Molina, A.; Torres, M.A. The Arabidopsis NADPH oxidases RbohD and RbohF display differential expression patterns and contributions during plant immunity. J. Exp. Bot. 2016, 67, 1663–1676. [Google Scholar] [CrossRef] [Green Version]
  30. Sumimoto, H. Structure, regulation and evolution of Nox-family NADPH oxidases that produce reactive oxygen species. FEBS J. 2008, 275, 3249–3277. [Google Scholar] [CrossRef]
  31. Torres, M.A.; Dangl, J.L. Functions of the respiratory burst oxidase in biotic interactions, abiotic stress and development. Curr. Opin. Plant Biol. 2005, 8, 397–403. [Google Scholar] [CrossRef] [PubMed]
  32. Suzuki, N.; Miller, G.; Morales, J.; Shulaev, V.; Torres, M.A.; Mittler, R. Respiratory burst oxidases: The engines of ROS signaling. Curr. Opin. Plant Biol. 2011, 14, 691–699. [Google Scholar] [CrossRef] [PubMed]
  33. Han, J.P.; Köster, P.; Drerup, M.M.; Scholz, M.; Li, S.; Edel, K.H.; Hashimoto, K.; Kuchitsu, K.; Hippler, M.; Kudla, J. Fine-tuning of RbohF activity is achieved by differential phosphorylation and Ca2+ binding. New Phytol. 2018, 221, 1935–1949. [Google Scholar] [CrossRef] [PubMed]
  34. Kadota, Y.; Shirasu, K.; Zipfel, C. Regulation of the NADPH oxidase RBOHD during plant immunity. Plant Cell Physiol. 2015, 56, 1–9. [Google Scholar] [CrossRef] [Green Version]
  35. Fishman, Y.; Miller, G.; Mittler, R. Whole-plant live imaging of reactive oxygen species. Mol. Plant 2019, 12, 1203–1210. [Google Scholar] [CrossRef] [Green Version]
  36. Marino, D.; Dunand, C.; Puppo, A.; Pauly, N. A burst of plant NADPH oxidases. Trends Plant Sci. 2012, 17, 9–15. [Google Scholar] [CrossRef]
  37. Chen, D.; Cao, Y.; Li, H.; Kim, D.; Ahsan, N.; Thelen, J.; Stacey, G. Extracellular ATP elicits DORN1-mediated RbohD phosphorylation to regulate stomatal aperture. Nat. Commun. 2017, 8, 1–13. [Google Scholar] [CrossRef] [Green Version]
  38. Yoshioka, H.; Numata, N.; Nakajima, K.; Katou, S.; Kawakita, K.; Rowland, O.; Jones, J.D.G.; Doke, N. Nicotiana benthamiana gp91phox homologs NbrbohA and NbrbohB participate in H2O2 accumulation and resistance to Phytophthora infestans. Plant Cell 2003, 15, 706–718. [Google Scholar] [CrossRef] [Green Version]
  39. Kadota, Y.; Sklenar, J.; Dherbyshire, P.; Stransfeld, L.; Asai, S.; Notukakis, V.; Jones, J.D.G.; Shirasu, K.; Jones, A.; Zipfel, C. Direct regulation of the NADPH oxidase RBOHD by the PRR-associated kinase BIK1 during plant immunity. Mol. Cell 2014, 54, 43–55. [Google Scholar] [CrossRef] [Green Version]
  40. Lukan, T.; Pompe-Novak, M.; Baebler, S.; Tušek-Žnidarič, M.; Kladnik, A.; Križnik, M.; Blejec, A.; Zagorščak, M.; Stare, K.; Dušak, B.; et al. Precision transcriptomics of viral foci reveals the spatial regulation of immune-signaling genes and identifies RBOHD as an important player in the incompatible interaction between Potato virus Y and potato. Plant J. 2020, 1, 1–17. [Google Scholar] [CrossRef]
  41. Otulak-Kozieł, K.; Kozieł, E.; Valverde, R.A. The respiratory burst oxidase homolog d (rbohd) cell and tissue distribution in potato–Potato virus Y (PVYntn) hypersensitive and susceptible reactions. Int. J. Mol. Sci. 2019, 20, 2741. [Google Scholar] [CrossRef] [PubMed] [Green Version]
  42. Pogány, M.; von Rad, U.; Grün, S.; Dongo, A.; Pintye, A.; Simoneau, P.; Bahnweg, G.; Kiss, L.; Barna, B.; Durner, J. Dual roles of reactive oxygen species and NADPH oxidase RBOHD in an Arabidopsis–Alternaria pathosystem. Plant Physiol. 2009, 151, 1459–1475. [Google Scholar] [CrossRef] [PubMed] [Green Version]
  43. Torres, M.A.; Dangl, J.L.; Jones, J.D.G. Arabidopsis gp91(phox) homologues AtrbohD and AtrbohF are required for accumulation of reactive oxygen intermediates in the plant defense response. Proc. Natl. Acad. Sci. USA 2002, 99, 517–522. [Google Scholar] [CrossRef] [PubMed] [Green Version]
  44. Torres, M.A.; Jones, D.G.J.; Dangl, J.L. Pathogen-induced, NADPH oxidase-derived reactive oxygen intermediates suppress spread of cell death in Arabidopsis thaliana. Nat. Genet. 2005, 37, 1130–1134. [Google Scholar] [CrossRef] [PubMed]
  45. Jin, X.; Jiang, Z.; Zhang, K.; Wang, P.; Cao, X.; Yue, N.; Wang, X.; Zhang, X.; Li, Y.; Li, D.; et al. Three-dimensional analysis of chloroplast structures associated with virus infection. Plant Physiol. 2018, 176, 282–294. [Google Scholar] [CrossRef] [Green Version]
  46. Jin, X.; Cao, X.; Wang, X.; Jiang, J.; Wan, J.; Laliberté, J.F.; Zhang, Y. Three-Dimensional architecture and biogenesis of membrane structures associated with plant virus replication. Front. Plant Sci. 2018, 9, 57. [Google Scholar] [CrossRef]
  47. Otulak-Kozieł, K.; Kozieł, E.; Lockhart, B.E.L. Plant cell wall dynamics in compatible and incompatible potato response to infection caused by Potato Virus Y (PVYNTN). Int. J. Mol. Sci. 2018, 19, 862. [Google Scholar] [CrossRef] [Green Version]
  48. Otulak-Kozieł, K.; Kozieł, E.; Bujarski, J.J. Spatiotemporal changes in xylan-1/xyloglucan and xyloglucan xyloglucosyl transferase (Xth-Xet5) as a step-in of ultrastructural cell wall remodelling in potato–Potato virus Y (PVYntn) hypersensitive and susceptible reaction. Int. J. Mol. Sci. 2018, 19, 2287. [Google Scholar] [CrossRef] [Green Version]
  49. Otulak-Kozieł, K.; Kozieł, E.; Lockhart, B.E.L.; Bujarski, J.J. The expression of potato expansin a3 (StExpA3) and extensin4 (StExt4) genes with distribution of stexpas and hrgps-extensin changes as an effect of cell wall rebuilding in two types of PVYntnSolanum tuberosum interactions. Viruses 2020, 12, 66. [Google Scholar] [CrossRef] [Green Version]
  50. Siddique, S.; Matera, C.; Radakovic, Z.S.; Hasan, M.S.; Gutbrod, P.; Rozanska, E.; Sobczak, M.; Torres, M.A.; Grundler, F.M. Parasitic worms stimulate host NADPH oxidases to produce reactive oxygen species that limit plant cell death and promote infection. Sci. Signal. 2014, 7, 1–33. [Google Scholar] [CrossRef] [Green Version]
  51. Kwak, J.M.; Mori, I.C.; Pei, Z.M.; Leonhardt, N.; Torres, M.A.; Dangl, J.L.; Bloom, R.E.; Bodde, B.; Jones, J.D.G.; Schroader, J.I. NADPH oxidase AtrbohD and AtrbohF genes function in ROS-dependent ABA signaling in Arabidopsis. EMBO J. 2003, 22, 2623–2633. [Google Scholar] [CrossRef] [PubMed]
  52. Miller, G.; Schlauch, K.; Tam, R.; Cortes, D.; Torres, M.A.; Shulaev, V.; Dangl, J.L.; Mittler, R. The plant NADPH oxidase RBOHD mediates rapid systemic signaling in response to diverse stimuli. Sci. Signal. 2009, 2, 45. [Google Scholar] [CrossRef] [PubMed] [Green Version]
  53. Soderberg, A.; Barral, A.M.; Soderstrom, M.; Sander, B.; Rosen, A. Redox-signaling transmitted in trans to neighboring cells by melanoma-derived TNF-containing exosomes. Free Radic. Biol. Med. 2007, 43, 90–99. [Google Scholar] [CrossRef] [PubMed]
  54. Cui, W.; Lee, J.Y. Arabidopsis callose synthases CalS1/8 regulate plasmodesmal permeability during stress. Nat. Plants 2016, 2, 1–13. [Google Scholar] [CrossRef] [PubMed]
  55. Li, G.; Lv, H.; Zhang, S.; Li, F.; Zhang, H.; Quian, W.; Fang, Z.; Sun, R. TuMV management for brassica crops through host resistance: Retrospect and prospects. Plant Pathol. 2019, 68, 1035–1044. [Google Scholar] [CrossRef]
  56. Hancock, J.T.; Desikan, R.; Clarke, A.; Hurst, R.D.; Neill, S.J. Cell signalling following plant/pathogen interactions involves the generation of reactive oxygen and reactive nitrogen species. Plant Physiol. Biochem. 2002, 40, 611–617. [Google Scholar] [CrossRef]
  57. Love, A.J.; Yun, B.W.; Laval, V.; Loake, G.J.; Milner, J.L. Cauliflower mosaic virus, a compatible pathogen of Arabidopsis, engages three distinct defense-signaling pathways and activates rapid systemic generation of reactive oxygen species. Plant Physiol. 2005, 139, 935–948. [Google Scholar] [CrossRef] [Green Version]
  58. Kiraly, L.; Hafez, Y.M.; Fodor, J.; Kiraly, Z. Suppression of Tobacco mosaic virus-induced hypersensitive-type necrotization in tobacco at high temperature is associated with downregulation of NADPH oxidase and superoxide and stimulation of dehydroascorbate reductase. J. Gen. Virol. 2008, 89, 799–808. [Google Scholar] [CrossRef]
  59. Liu, H.B.; Wang, X.D.; Zhang, Y.Y.; Dong, J.J.; Ma, C.; Chen, W.L. NADPH oxidase RBOHD contributes to autophagy and hypersensitive cell death during the plant defense response in Arabidopsis thaliana. Biol. Plant. 2015, 59, 570–580. [Google Scholar] [CrossRef]
  60. Hyodo, K.; Hashimoto, K.; Kuchitsu, K.; Suzuki, N.; Okuno, T. Harnessing host ROS-generating machinery for the robust genome replication of a plant RNA virus. Proc. Natl. Acad. Sci. USA 2017, 114, 1282–1290. [Google Scholar] [CrossRef] [Green Version]
  61. Van Loon, L.C.; Rep, M.; Pieterse, C.M. Significance of inducible defense-related proteins in infected plants. Annu. Rev. Phytopathol. 2006, 44, 135–162. [Google Scholar] [CrossRef] [PubMed] [Green Version]
  62. Shirasu, K.; Nakajima, H.; Rajasekhar, V.K.; Dixon, R.A.; Lamb, C. Salicylic acid potentiates an agonist-dependent gain control that amplifies pathogen signals in the activation of defence mechanisms. Plant Cell 1997, 9, 261–270. [Google Scholar] [PubMed] [Green Version]
  63. Chen, Z.; Silva, H.; Klessig, D.F. Active oxygen species in the induction of plant systemic acquired resistance by salicylic acid. Science 1993, 262, 1883–1886. [Google Scholar] [CrossRef] [PubMed]
  64. Dardick, C.D.; Golem, S.; Culver, J.N. Susceptibility and symptom development in Arabidopsis thaliana to tobacco mosaic virus is influenced by virus cell-to-cell movement. Mol. Plant Microbe Interact. 2000, 13, 1139–1144. [Google Scholar] [CrossRef] [Green Version]
  65. Elvira, M.I.; Galdeano, M.M.; Gilardi, P.; Garcıa-Luque, I.; Serra, M. Proteomic analysis of pathogenesis-related proteins (PRs) induced by compatible and incompatible interactions of pepper mild mottle virus (PMMoV) in Capsicum chinense L3 plants. J. Exp. Bot. 2008, 59, 1253–1265. [Google Scholar] [CrossRef] [Green Version]
  66. Hoegen, E.; Strömberg, A.; Pihlgren, U.; Kombrik, E. Primary structure and tissue-specific expression of the pathogenesis-related protein PR-1b in potato. Mol. Plant Pathol. 2002, 3, 329–345. [Google Scholar] [CrossRef]
  67. Kachroo, P.; Yoshioka, K.; Shah, J.; Dooner, H.K.; Klessig, D.F. Resistance to Turnip crinkle virus in Arabidopsis is regulated by two host genes and is salicylic acid dependent but npr1, ethylene, and jasmonate independent. Plant Cell 2000, 12, 677–690. [Google Scholar] [CrossRef] [Green Version]
  68. Wong, C.E.; Carson, R.A.J.; Carr, J.P. Chemically Induced Virus Resistance in Arabidopsis thaliana is independent of pathogenesis-related protein expression and the NPR1 Gene. Mol. Plant Microbe Interact. 2002, 15, 75–81. [Google Scholar] [CrossRef] [Green Version]
  69. Tomlinson, J.A. Turnip mosaic virus. In MI/AAB Descriptions of Plant Viruses; CMI/AAB: Surrey, UK, 1970. [Google Scholar]
  70. Walsh, J.A.; Jenner, C.E. Turnip mosaic virus and the quest for durable resistance. Mol. Plant Pathol. 2002, 3, 289–300. [Google Scholar] [CrossRef]
  71. Jenner, C.E.; Keane, G.J.; Jones, J.E.; Walsh, J.A. Serotypic variation in turnip mosaic virus. Plant Pathol. 1999, 48, 101–108. [Google Scholar] [CrossRef]
  72. Kozieł, E.; Otulak-Kozieł, E.; Bujarski, J.J. Modifications in Tissue and Cell Ultrastructure as Elements of Immunity-Like Reaction in Chenopodium quinoa against Prune Dwarf Virus (PDV). Cells 2020, 9, 148. [Google Scholar] [CrossRef] [PubMed] [Green Version]
  73. Clark, M.F.; Adams, A.N. Characteristics of the microplate method of enzyme-linked immunosorbent assay for the detection of plant viruses. J. Gen. Virol. 1977, 34, 475–483. [Google Scholar] [CrossRef] [PubMed]
  74. Bioreba Company Site. Available online: http://www.bioreba.ch/saas/CustomUpload/374O357O340O370O356O369O350O321O360O366O369O356O353O352O350O320O326O/Simple_ELISA_Data_Analysis.pdf (accessed on 9 September 2020).
  75. Korkmaz, S.; Cevik, B.; Karanfil, A.; Onder, S.; Ohshima, K. Phylogenetic relationships and genetic structure of populations of turnip mosaic virus in Turkey. Eur. J. Plant Pathol. 2020, 156, 559–569. [Google Scholar] [CrossRef]
  76. Otulak, K.; Garbaczewska, G. The participation of plant cell organelles in compatible and incompatible Potato virus Y-tobacco and -potato plant interaction. Acta Physiol. Plant. 2013, 36, 85–99. [Google Scholar] [CrossRef] [Green Version]
  77. Kozieł, E.; Otulak-Kozieł, K.; Bujarski, J.J. Ultrastructural analysis of Prune dwarf virus intercellular transport and pathogenesis. Int. J. Mol. Sci. 2018, 19, 2570. [Google Scholar] [CrossRef] [Green Version]
  78. Kozieł, E.; Otulak, K.; Lockhart, B.E.L.; Garbaczewska, G. Subcelullar localization of proteins associated with Prune dwarf virus replication. Eur. J. Plant Pathol. 2017, 149, 653–668. [Google Scholar] [CrossRef] [Green Version]
  79. Bestwick, C.S.; Brown, I.R.; Mansfield, J.W. Localized Changes in peroxidase activity accompany hydrogen peroxide generation during the development of a nonhost hypersensitive reaction in lettuce. Plant Physiol. 1998, 118, 1067–1078. [Google Scholar] [CrossRef] [Green Version]
  80. Otulak, K.; Garbaczewska, G. Localisation of hydrogen peroxide accumulation during Solanum tuberosum cv. Rywal hypersensitive response to Potato virus Y. Micron 2010, 41, 327–335. [Google Scholar] [CrossRef]
Figure 1. TuMV detection and relative virus concentration assessment in Arabidopsis thaliana Col-0 and rbohD, rbohF and rbohD/F mutants at 3 and 7 days after inoculation. Values represented are mean of corrected OD405nm values. Significant differences between classes at p < 0.05 level of significance were assessed by analysis of variance (ANOVA) with post-hoc Tukey HSD. The statistically significant values are marked by letters above chart bars.
Ijms 21 08510 g001
Figure 2. Viral particles and inclusions, multivesicular bodies induction and chloroplast changes in Col-0 different leaf tissues 3 (A,B) and 7 days (C,D) after TuMV inoculation examined with a transmission electron microscope (TEM, FEI M268D “Morgagni” transmission electron microscope). (A) Virus particles (VPs; marked by arrowhead) in vacuole (v) of palisade mesophyll cell. (B) Multivesicular bodies (MVBs; marked by *) in cytoplasm and vacuole (v) of phloem parenchyma (PP) cell. Pd-plasmodesmata. (C) Virus particles (VPs; arrowhead) in vacuole (v) and virus inclusions (cytoplasmatic inclusion (CI); marked by arrow) in cytoplasm of xylem parenchyma (XP) cell. (D) Virus cytoplasmic inclusions (Cis; arrow) inside phloem cell and necrotic changes (Ne) in companion cell (CC). Se—sieve element; X—xylem tracheary element.
Ijms 21 08510 g002
Figure 3. Virus particles and viral cytoplasmatic inclusion, changes in chloroplast lamellae stacks in rbohD plants leaf tissues 3 (A) and 7 days (BD) after TuMV inoculation examined under TEM. (A) Curved (double-headed arrow) chloroplast (ch) thylakoids, cell wall (CW) invagination (black arrow) and paramular bodies (PMBs; marked by diamond head arrow) in palisade mesophyll cell. (B) Virus particles (VPs, with arrowhead) and virus cytoplasmic inclusions (CIs; arrows) in palisade mesophyll cell. (C) Destroyed chloroplast (ch) with disorganized thylakoids (double-headed arrow), virus cytoplasmic inclusions (CIs; white arrow) and viral particles (VPs; black arrowhead) in cytoplasm of spongy mesophyll cell. v—vacuole; m—mitochondrion. (D) Virus inclusions (CI; arrow) inside xylem tracheary elements (X). m—mitochondrion.
Ijms 21 08510 g003
Figure 4. Curved structure of chloroplast lamellae stacks—multivesicular structures and viral particles in vacuole in different leaf tissues of rbohF plants 3 (A,B) and 7 days (C,D) after TuMV inoculation examined under a TEM. (A) Curved thylakoids (double-headed arrow) in chloroplast (ch) of palisade mesophyll cell. (B) Multivesicular structures (“single membranes with tubules”) (MVB; *) in vacuole (v) and paramular bodies (PMBs; marked by diamond head arrow) in phloem apoplast area. CW—cell wall. (C) Virus particles (VPs; arrowhead) and multivesicular bodies (MVB; *) inside vacuole (v) of spongy mesophyll cell. ch—chloroplast. (D) Irregular structure (arrows) of the cell wall (CW) between spongy mesophyll cells. ch—chloroplast; v—vacuole.
Ijms 21 08510 g004
Figure 5. Multivesicular bodies’ induction, viral particles in vacuole and cell wall rebuilding in rbohD/F plants tissues 3 (A) and 7 days (BD) after TuMV inoculation examined under a TEM. (A) Cell wall rebuilding (CW; arrows) and multivesicular bodies (MVB; *) in phloem parenchyma cells. Ch—chloroplast; V—vacuole. (B) Multivesicular bodies (MVBs; *) near plasmodesmata (Pd) in phloem parenchyma cells. CW—cell wall; V—vacuole. (C) Cell wall (CW) rebuilding (arrows) and virus particles (VPs; arrowhead) in membranous structures such as small vacuoles in palisade mesophyll cells. V—vacuole. (D) Accumulation of phenolic-like compounds (marked with #) inside xylem tracheary elements (X). XP—xylem parenchyma.
Ijms 21 08510 g005
Figure 6. TuMV detection in Col-0 and rbohD mock-inoculated leaf tissues (A) and 3 (B,C) and 7 days (D) after virus inoculation by immunogold electron microscopy. (A) Unchanged palisade mesophyll cell without TuMV epitope from mock-inoculated Col-0 plants. ch—chloroplast; v—vacuole. (B) TuMV epitope presence (*) around cytoplasmic inclusion (CI; arrow) and multivesicular bodies (MVBs) in phloem parenchyma cell of Col-0. CW—cell wall; m—mitochondrion; Se—sieve tube. (C) TuMV epitope localization (*) along virus particles (VPs; arrowhead) in companion cell (CC) and sieve element (Se) in rbohD phloem tissue. Pd—plasmodesmata. (D) TuMV epitope presence (*) around virus particles (VPs; arrowhead) and cytoplasmic inclusion (CI; arrow) in vesicular structures in rbohD palisade mesophyll cells.
Ijms 21 08510 g006
Figure 7. TuMV detection in rbohF and rbohD/F leaf tissues 3 (A,C) and 7 days (B,D) after virus inoculation examined by immunogold electron microscopy. (A) TuMV epitope localization (*) around multivesicular structures (MVB) in rbohF phloem cells. Phenolic-like compounds (#) near MVB. CW—cell wall; v—vacuole. (B) TuMV epitope presence (*) along virus particles (VPs; arrowheads) in vacuole (v) and around single membrane with tubule structures (SMTs) in rbohF. Phenolic-like compounds (#). m—mitochondrion. (C) TuMV epitope (*) in vacuole (V) and around changed (black arrows) cell wall (CW) with paramular bodies (PMBs; diamond head arrow) in rbohD/F phloem parenchyma cell. (D) TuMV epitope (*) in vacuole (v) rbohD/F xylem parenchyma cells (XP). Phenolic-like compounds (#) inside xylem tracheary elements (X).
Ijms 21 08510 g007
Figure 8. Quantification of gold particles associated with TuMV in Arabidopsis thaliana Col-0, rbohD, rbohF and double rbohD/F mutants at 3 and 7 days after inoculation. Significant differences between classes at p < 0.05 level of significance by ANOVA with post-hoc Tukey HSD were assessed. The statistical significant values are marked by letters above chart bars.
Ijms 21 08510 g008
Figure 9. Localization of PR1 in Col-0 and rbohD leaf tissues 3 (A,C) and 7 days (B,D) after TuMV inoculation examined by immunogold electron microscopy. Control comprises Col-0 mock-inoculated leaf tissues (E) and leaf tissues without primary antibodies (F). (A) PR1 (*) in cell wall (CW), plasmodesmata (Pd) and vacuole (v) in Col-0 mesophyll 3 days after TuMV inoculation. (B) PR1 presence (*) in cell wall (CW), paramular bodies (PMBs; diamond head arrow) in apoplast area of palisade mesophyll Col-0 plants 7 days after TuMV inoculation. (C) PR1 localization (*) in cell wall (CW) and vacuoles (vs) in rbohD 3 days after TuMV inoculation. (D) PR1 deposition (*) along cell wall (CW) and in vacuoles (vs) in rbohD spongy mesophyll cell with virus cytoplasmic inclusions (CI with arrow). (E) PR1 (*) in cell wall (CW) and vacuole (v) in different type of phloem cells from mock-inoculated Col-0 plants. Se—sieve element. (F) Mesophyll from mock-inoculated Col-0 control plants without PR1 epitopes when primary antibodies were replaced by pre-immune serum. ch—chloroplast; CW—cell wall.
Ijms 21 08510 g009
Figure 10. Localization of PR1 in rbohF and rbohD/F leaf tissues 3 (A,C) and 7 days (B,D) after TuMV inoculation examined by immunogold electron microscopy. (A) PR1 localization (*) around multivesicular bodies (MVBs) in vacuole (v) in rbohF palisade mesophyll cell. ch—chloroplast; CW—cell wall. (B) PR1 presence (*) in plasmodesmata (Pd), cell wall (CW) and paramular bodies (PMBs; white diamond head arrow) in rbohF phloem parenchyma cell. (C) PR1 (*) in and around changed (arrows) cell wall (CW) in rbohD/F spongy mesophyll cell. ga—Golgi apparatus, m—mitochondrion, v—vacuole. (D) PR1 presence (*) in paramular bodies (PMBs; diamond head arrow) and vacuole (V) in rbohD/F spongy mesophyll cell. ch—chloroplast; CW—cell wall; v—vacuole.
Ijms 21 08510 g010
Figure 11. Quantification of PR1 antigen localization in mock- and TuMV-inoculated Arabidopsis thaliana Col-0, rbohD, rbohF and double rbohD/F mutant at 3 and 7 days after inoculation. Significant differences between classes at p < 0.05 level of significance by ANOVA with post-hoc Tukey HSD were assessed. The statistical significant values are marked by letters above chart bars.
Ijms 21 08510 g011
Figure 12. H2O2 detection in Col-0 and rbohD mock-inoculated leaf tissues (A,D) and 3 (B,E) and 7 days (C,F) post-TuMV inoculation examined under TEM. (A) Electron-dense deposits of cerium perhydroxide (*) in the cell wall and along the trans Golgi network (tgn) and vesicles in the cytoplasm of Col-0 spongy mesophyll cell. CW—cell wall; m—mitochondrion. (B) H2O2 (*) around multivesicular bodies (MVBs) in Col-0 epidermis. Pd—plasmodesmata; CW—cell wall. (C) H2O2 (*) in cell wall (CW), intercellular space (Ints) and near paramural bodies (PMB; diamond arrowhead) in Col-0 mesophyll cells. (D) H2O2 (*) in the apoplast between cell wall and plasmalemma in rbohD mock-treated xylem cells. XP—xylem parenchyma. (E) H2O2 (*) in vacuoles (vs), vesicular structures and endoplasmic reticulum (er) in cytoplasm in rbohD phloem parenchyma cells. (F) H2O2 (*) in phloem parenchyma cells with cytoplasmic inclusions (Cis; white arrow) of TuMV in rbohD sieve element (Se).
Ijms 21 08510 g012
Figure 13. H2O2 detection in rbohF and rbohD/F mock-inoculated leaf tissues (A,D) and 3 (B,E) and 7 days (C,F) post-TuMV inoculation examined under TEM. (A) Cerium perhydroxide precipitates (*) in cell wall and apoplast between cell wall and plasmalemma in rbohF mock-inoculated xylem tracheary elements (X). XP—xylem parenchyma. (B) H2O2 (*) along membranous structures in necrotized (Ne) palisade mesophyll cell with destructed chloroplasts in rbohF. (C) H2O2 (*) in dark necrotized (Ne) protoplast of phloem cells and in the cytoplasm of non-necrotized phloem parenchyma cells in rbohF. CW—cell wall. (D) H2O2 staining (*) along the cell wall (CW) and endoplasmic reticulum (er) in rbohD/F mock-inoculated spongy mesophyll cells. ga—Golgi apparatus. (E) H2O2 (*) along the cell wall (CW) and membranous structures of necrotized (Ne) rbohD/F spongy mesophyll cell. MVBs—multivesicular bodies; CW—cell wall. (F) H2O2 (*) in plasmodesmata (Pd) and in cytoplasm around in rbohD/F mesophyll cell.
Ijms 21 08510 g013
Figure 14. Corrected total electron density (CTED) of cerium (IV) perhydroxide precipitate in mock- and TuMV-inoculated Arabidopsis thaliana Col-0, rbohD, rbohF and double mutant rbohD/F at 3 and 7 dpi. Significant differences between classes at p < 0.05 level of significance by ANOVA with post-hoc Tukey HSD were assessed. The statistical significant values are marked by letters above chart bars.
Ijms 21 08510 g014
Table 1. Turnip mosaic virus (TuMV) detection assessment using double antibody sandwich enzyme-linked immunosorbent assay (DAS-ELISA) on Arabidopsis thaliana wild type and mutant leaves at 3 and 7 dpi. Values presented are mean optical density (OD405nm) values. Absence of virus is marked by (−). Presence of TuMV (+) is confirmed in samples with mean OD405nm above estimated cut-off point: 0.1738.
SampleMean OD405nmPresence (+)/Absence of the Virus (−)
buffer0.0000
mock-inoculated Col-0 (3 dpi)0.0415
mock-inoculated rbohD (3 dpi)0.0472
mock-inoculated rbohF (3 dpi)0.0410
mock-inoculated mutant rbohD/F (3 dpi)0.0400
TuMV-inoculated Col-0 (3 dpi)0.6550+
TuMV-inoculated rbohD (3 dpi)0.6910+
TuMV-inoculated rbohF (3 dpi)0.5700+
TuMV-inoculated rbohD/F (3 dpi)0.5000+
mock-inoculated Col-0 (7 dpi)0.0801
mock-inoculated rbohD (7 dpi)0.0813
mock-inoculated rbohF (7 dpi)0.0723
mock-inoculated rbohD/F (7 dpi)0.0600
TuMV-inoculated Col-0 (7 dpi)1.379+
TuMV-inoculated rbohD (7 dpi)2.701+
TuMV-inoculated rbohF (7 dpi)0.355+
TuMV-inoculated rbohD/F (7 dpi)0.272+
Publisher’s Note: MDPI stays neutral with regard to jurisdictional claims in published maps and institutional affiliations.

