A SINE-VNTR-Alu in the LRIG2 Promoter Is Associated with Gene Expression at the Locus

 , , and
Abstract
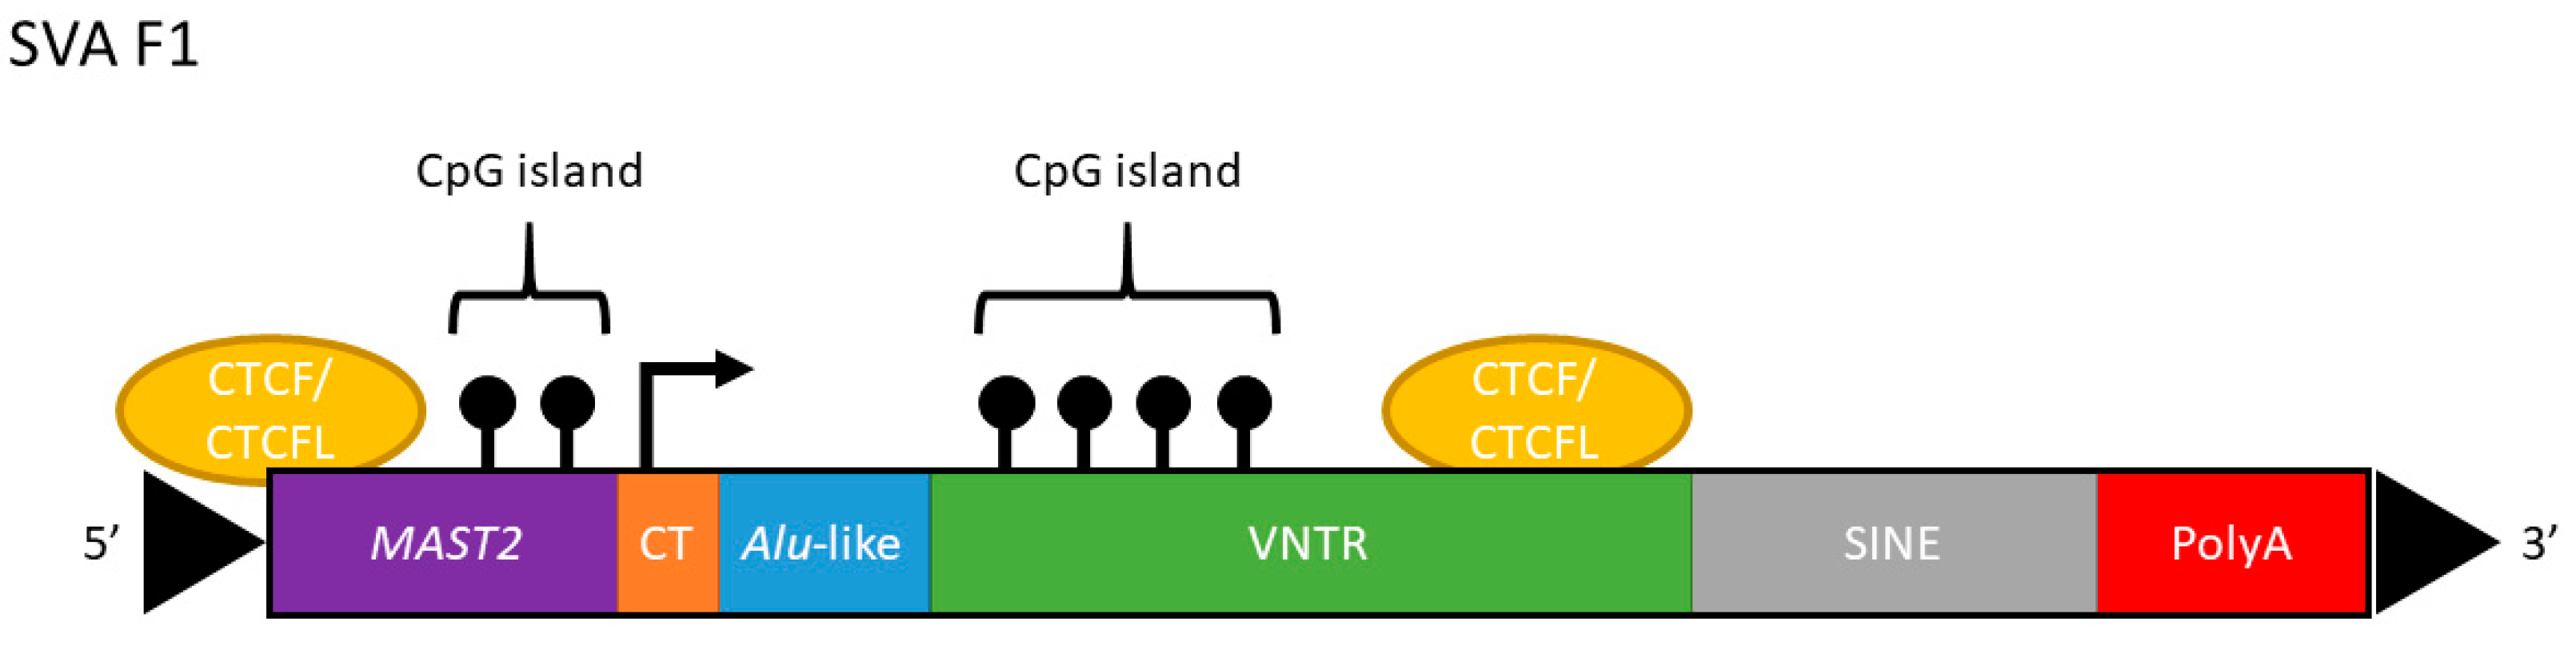
1. Introduction
2. Results
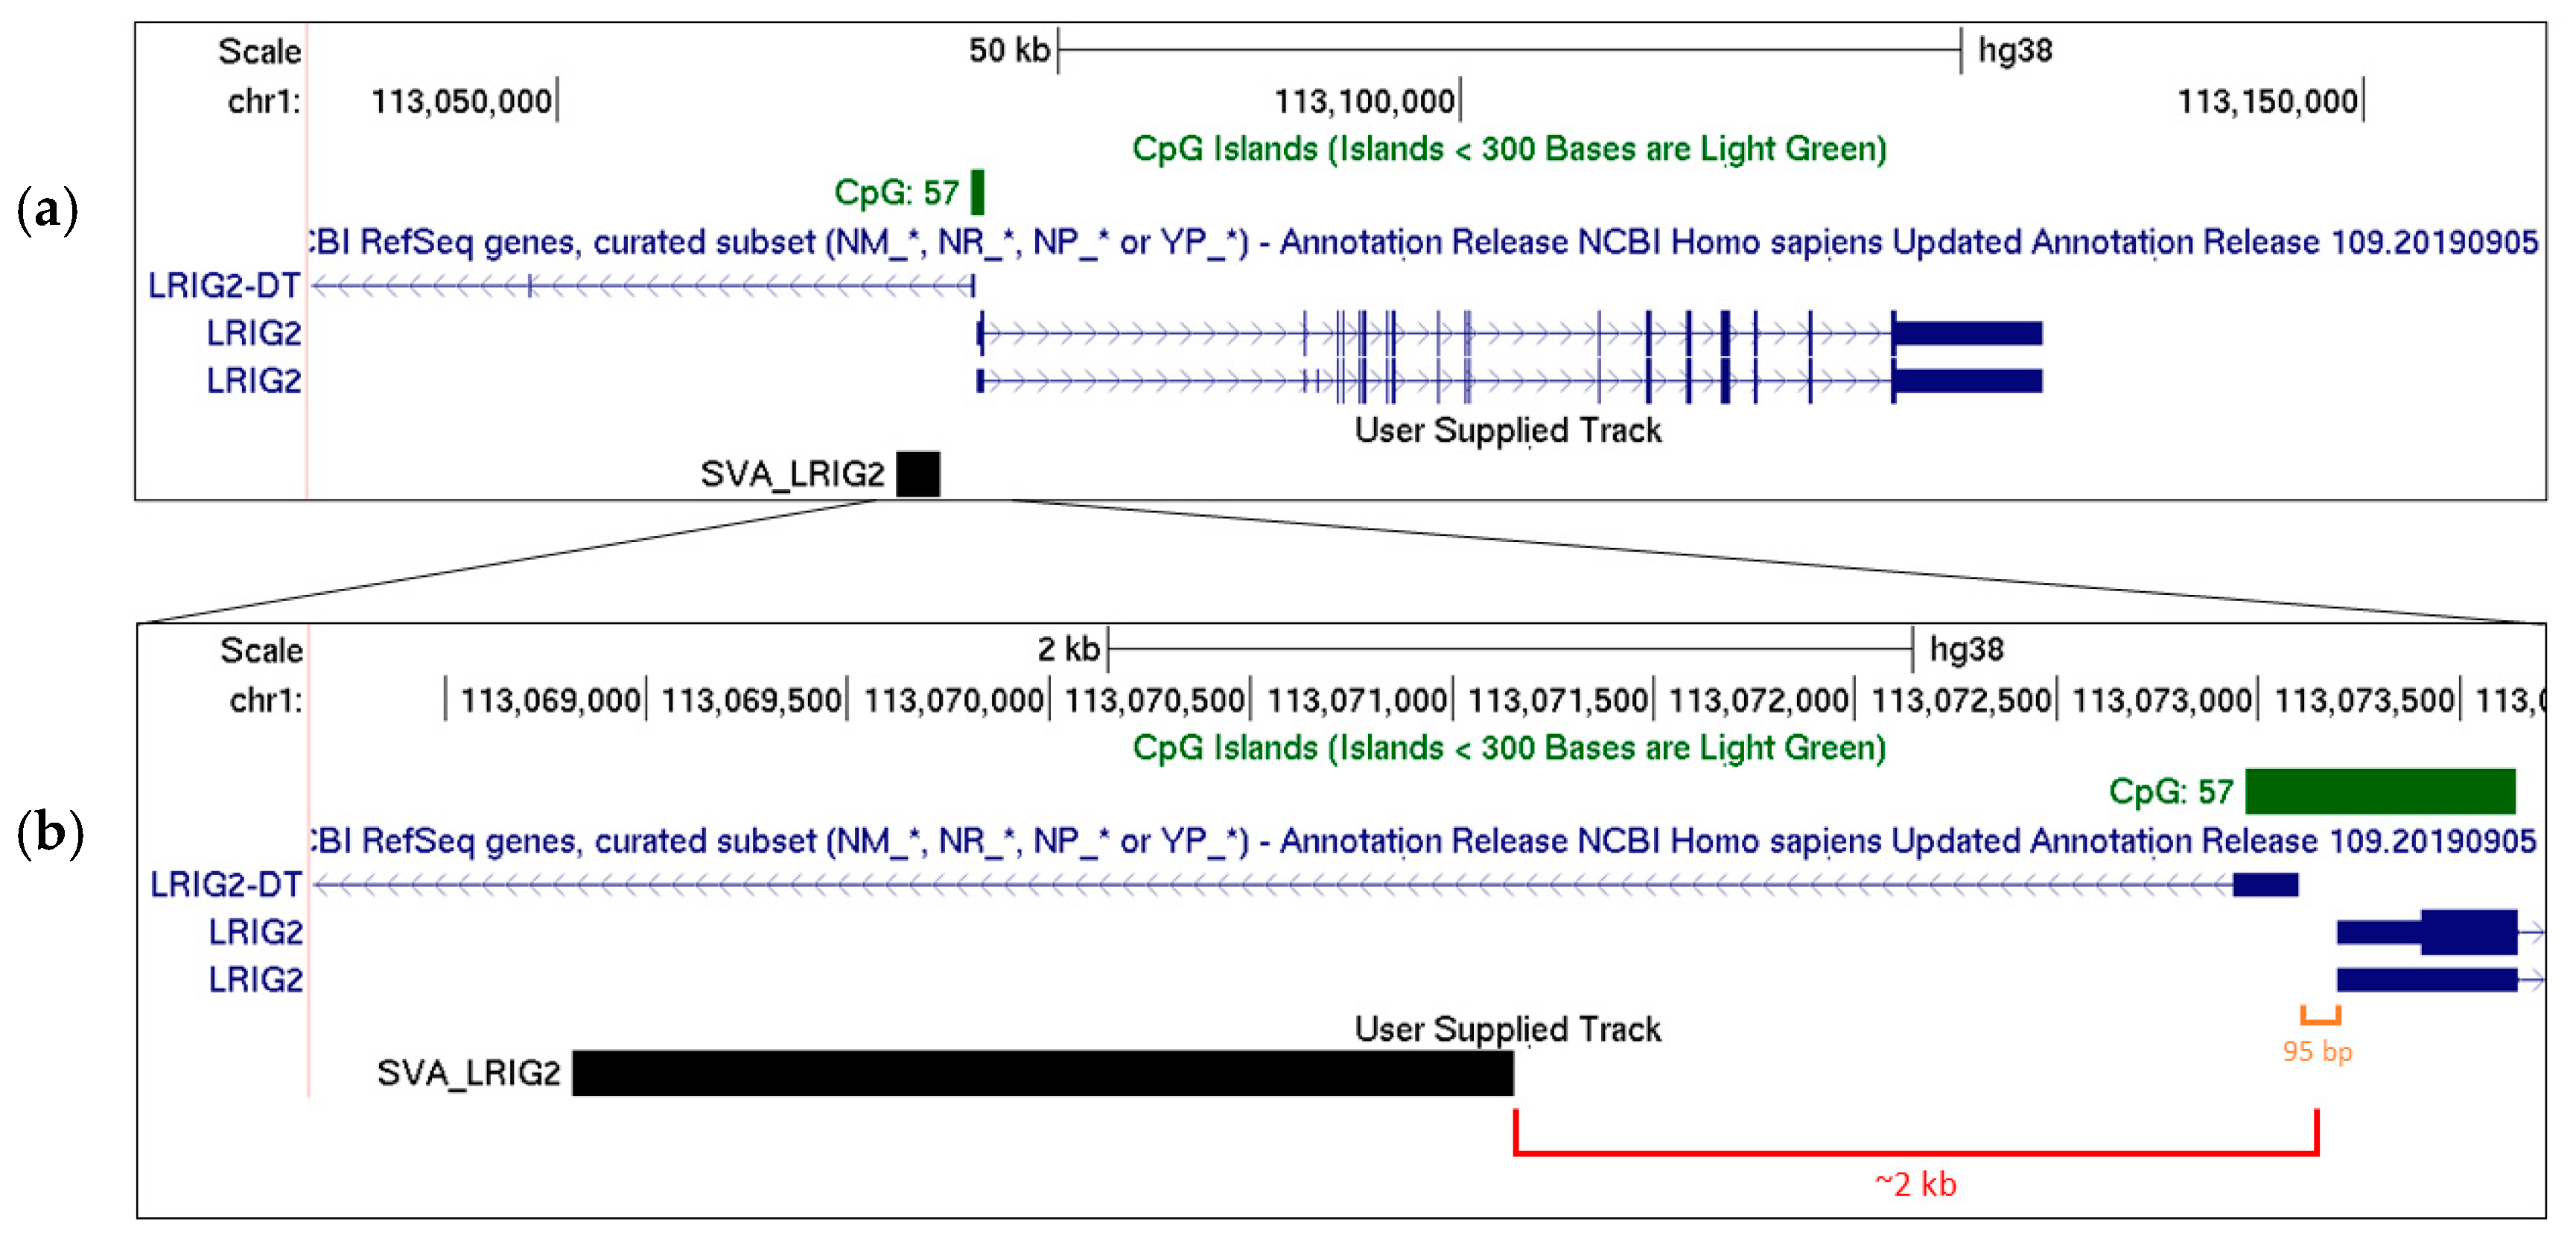
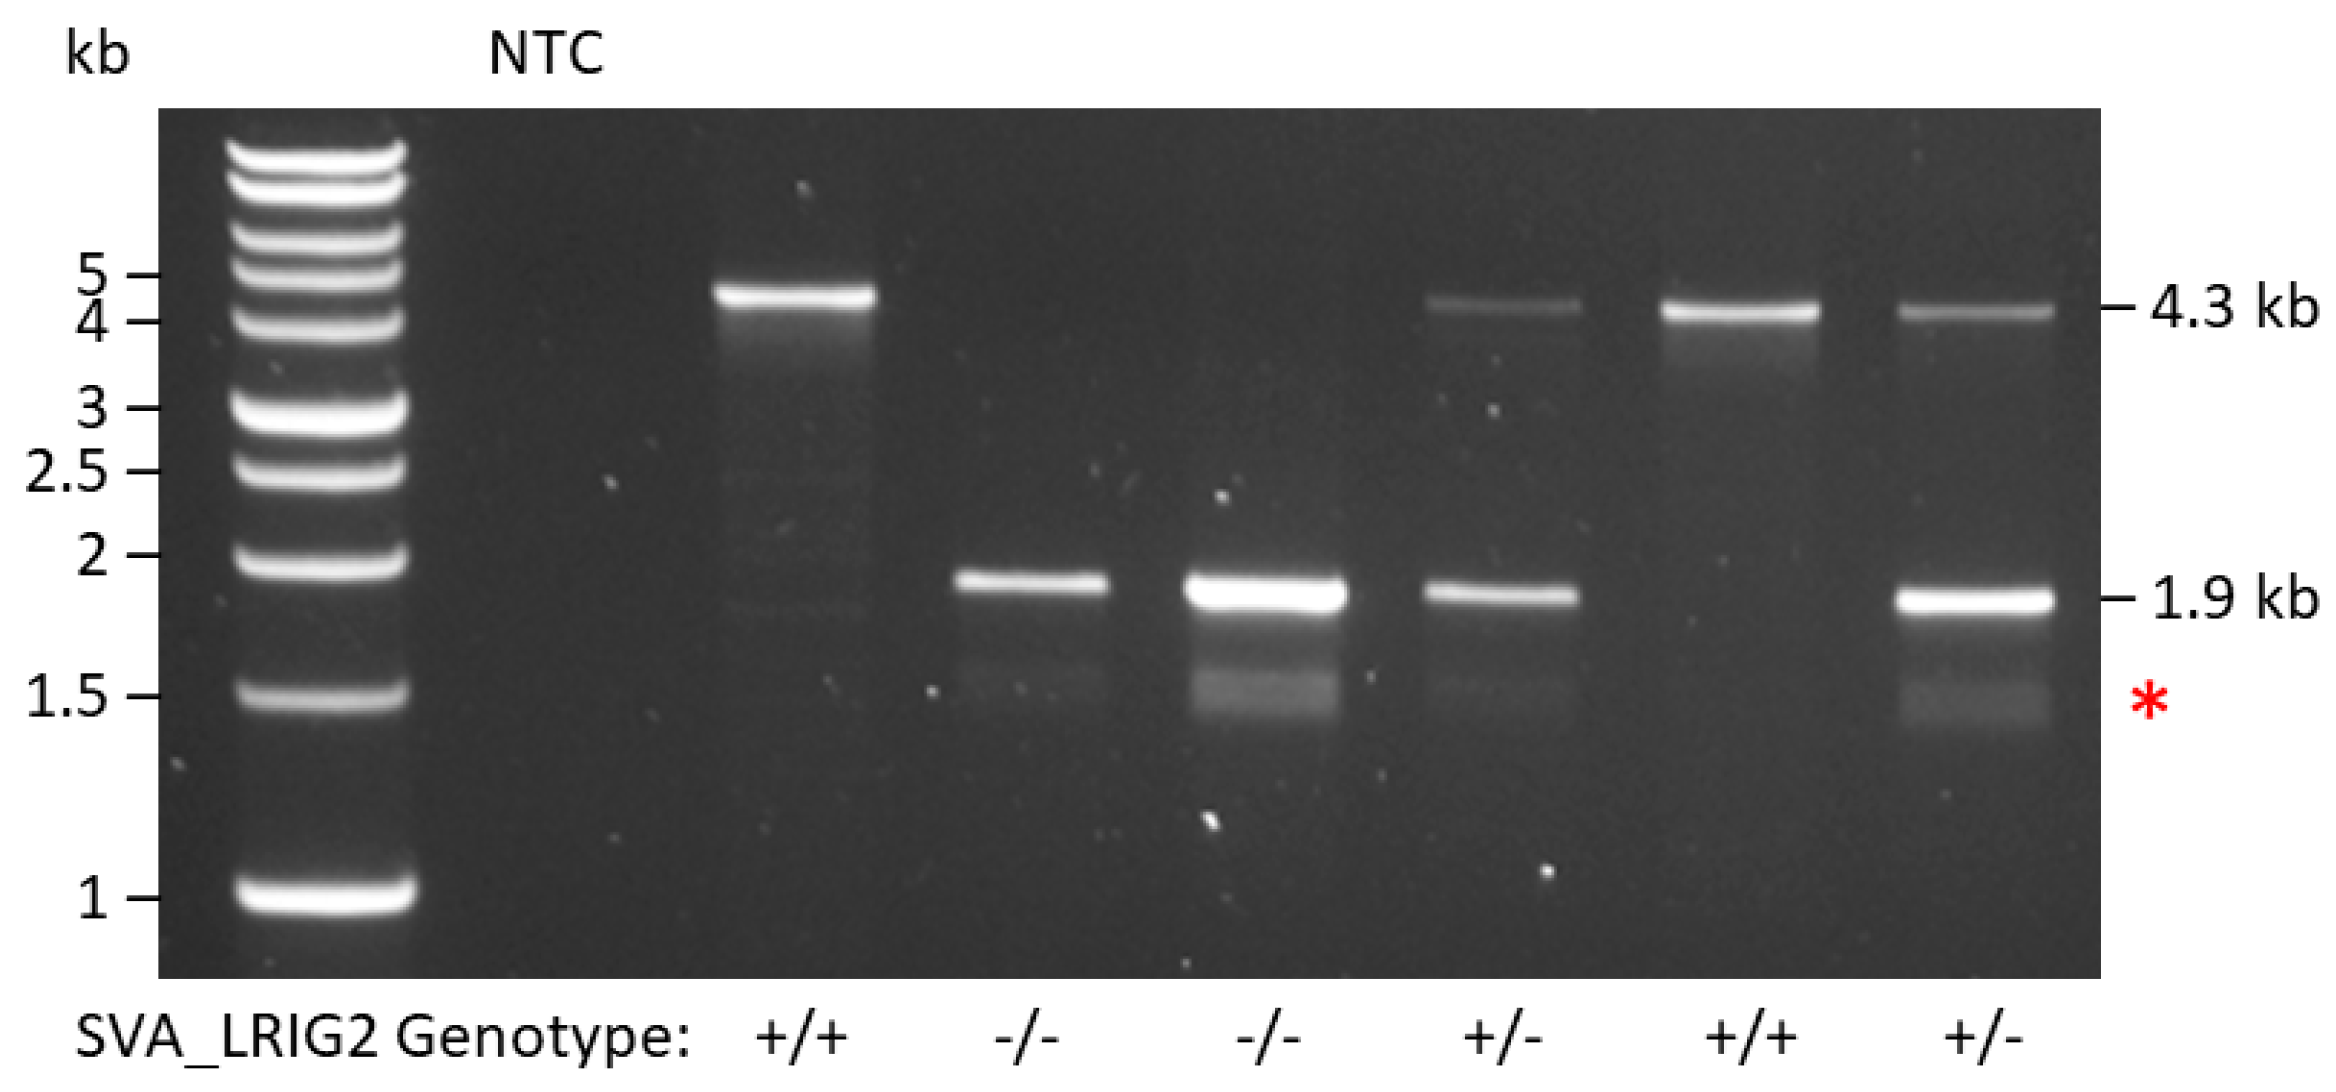
2.1. SVA_LRIG2 Genotypes Were PCR Validated or Imputed for 288 Individuals
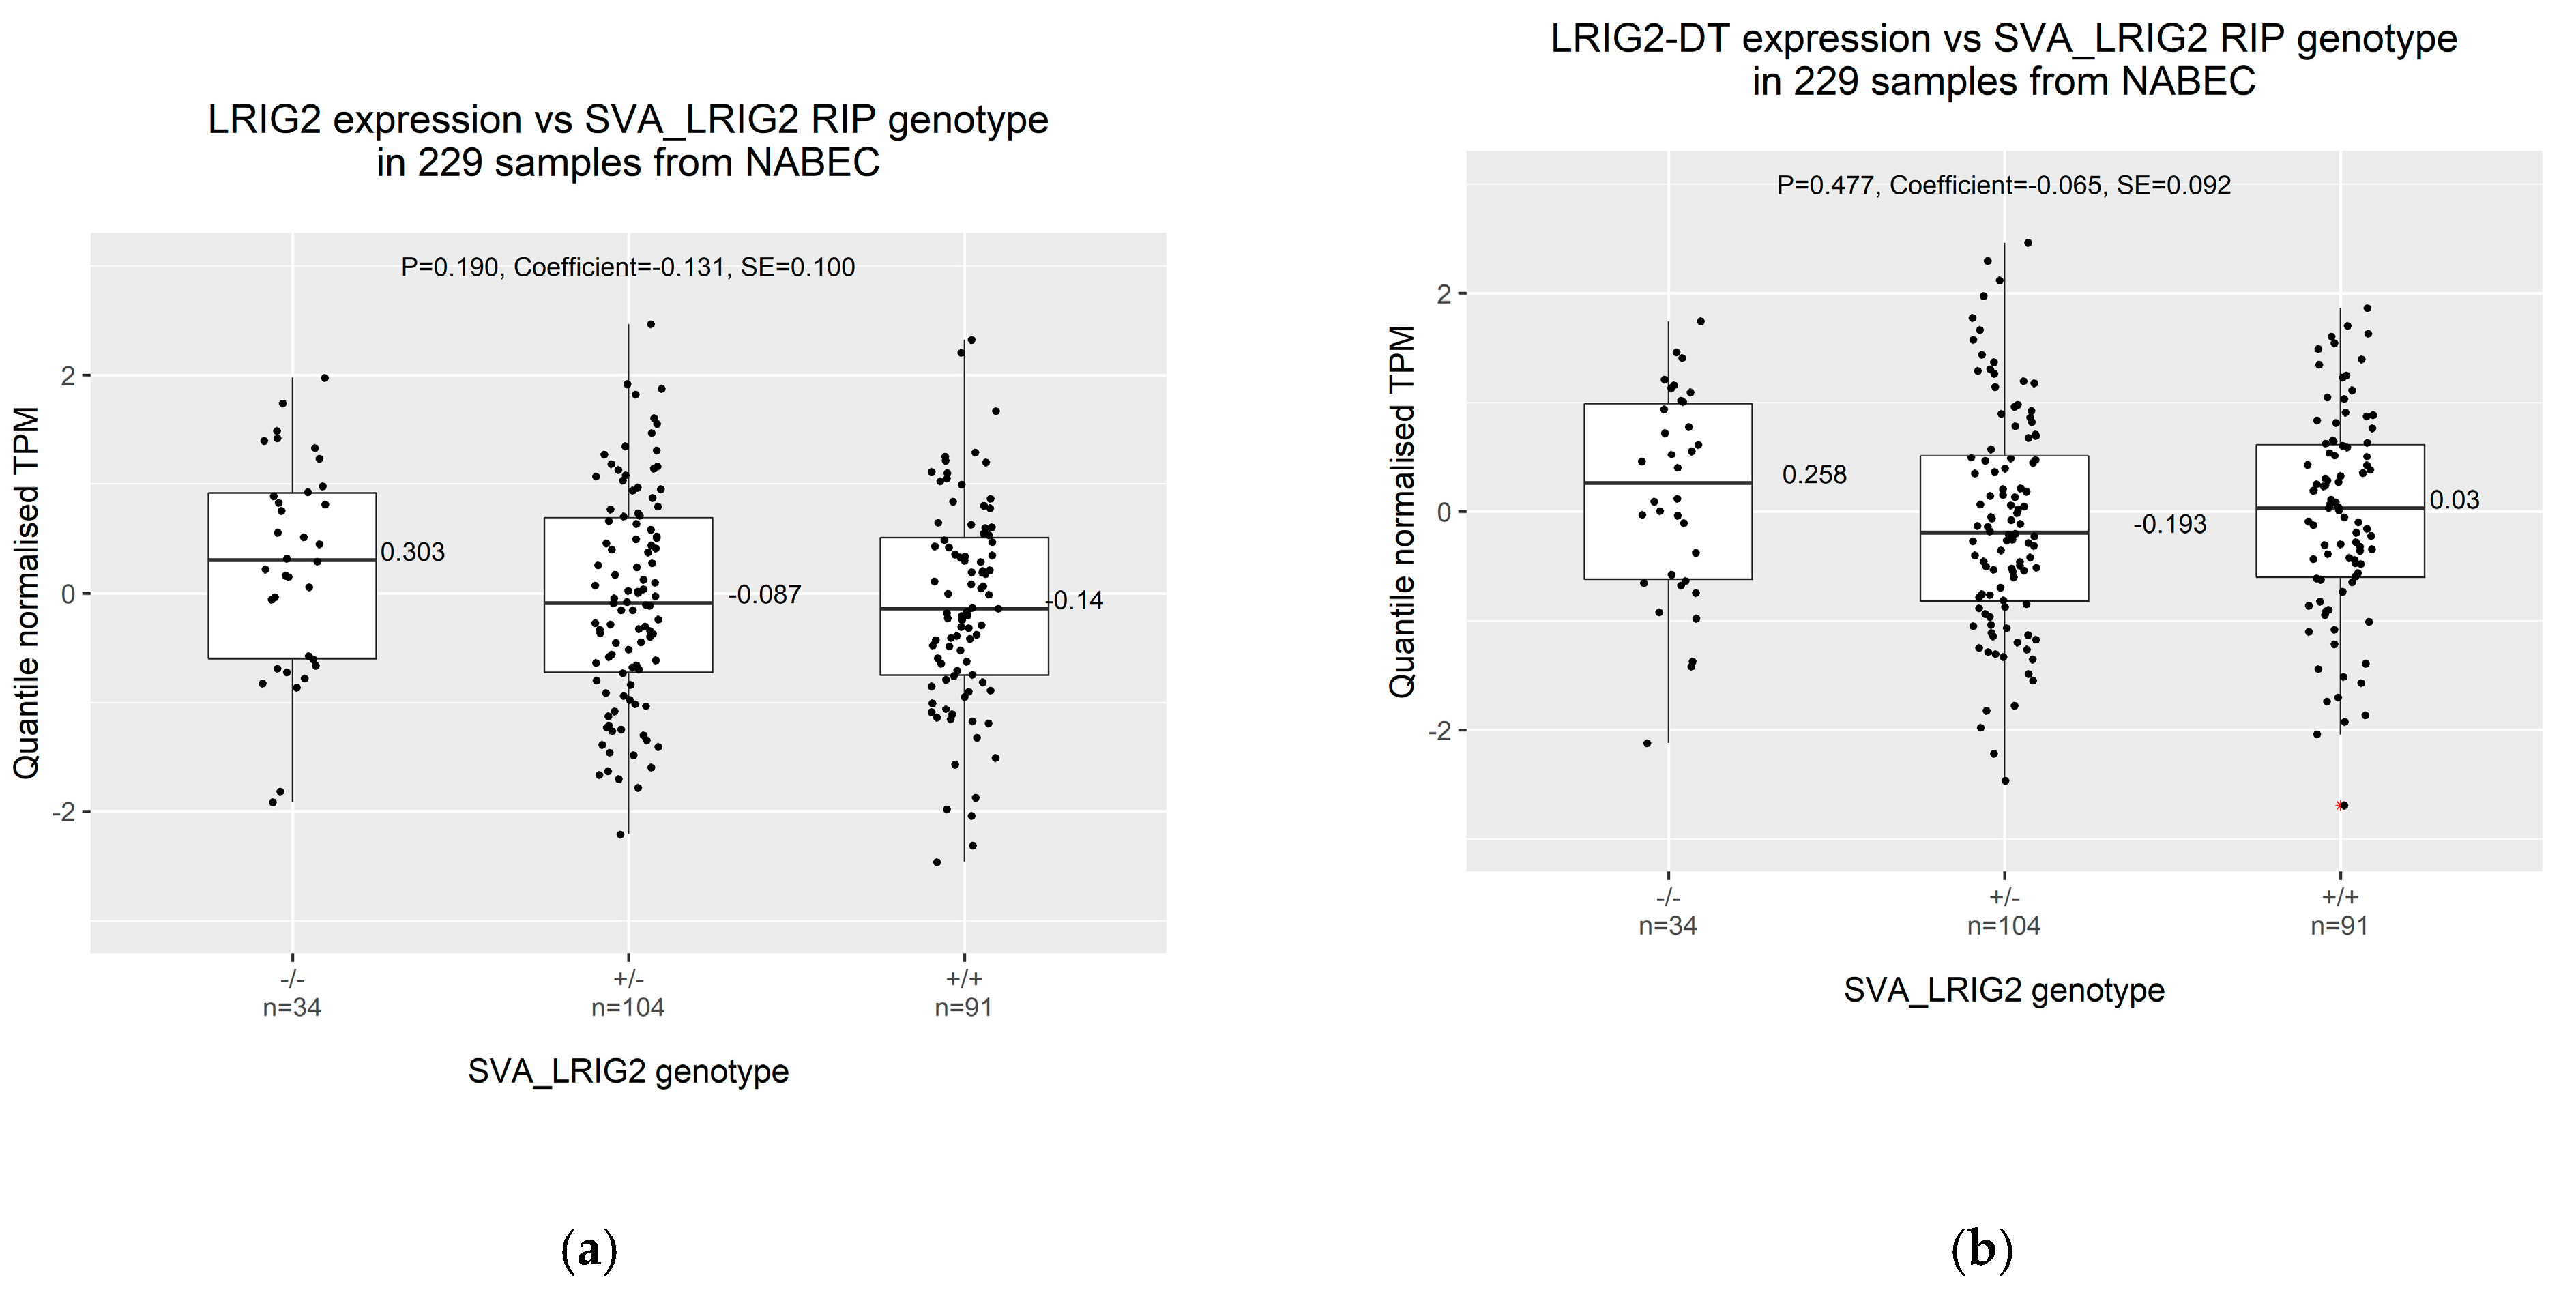
2.2. Increased Allele Dosage of SVA_LRIG2 Is Non-Significantly Associated with Reduced Transcription from the LRIG2 Locus
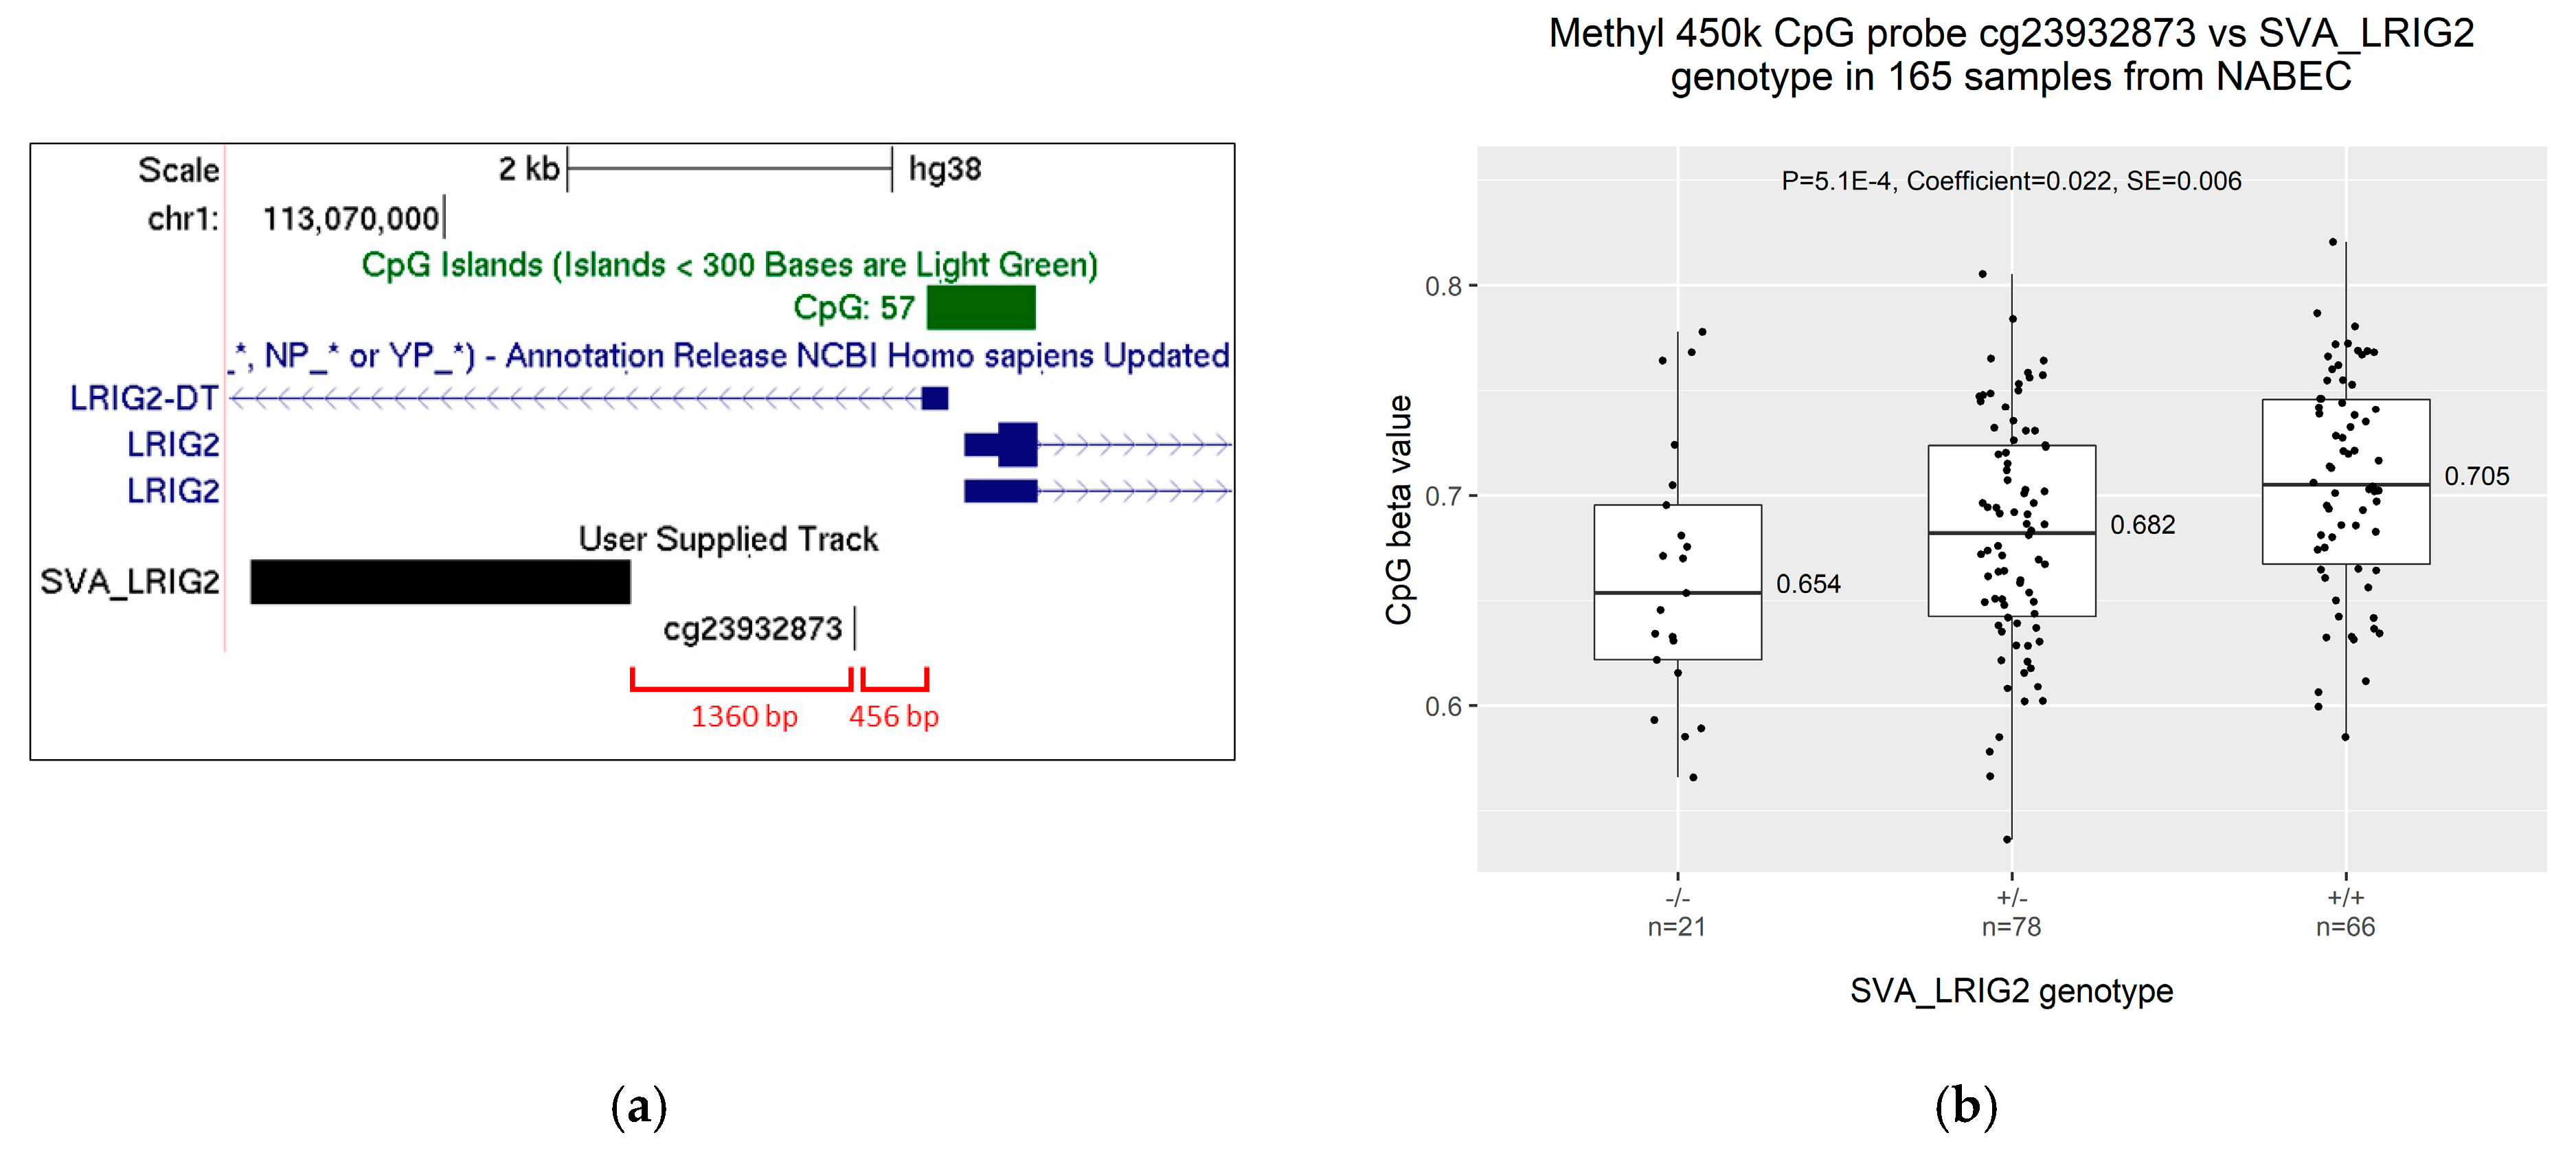
2.3. Increased Allele Dosage of SVA_LRIG2 Is Associated with Increased Methylation of the Nearest 450K Methylation Probe, cg23932873
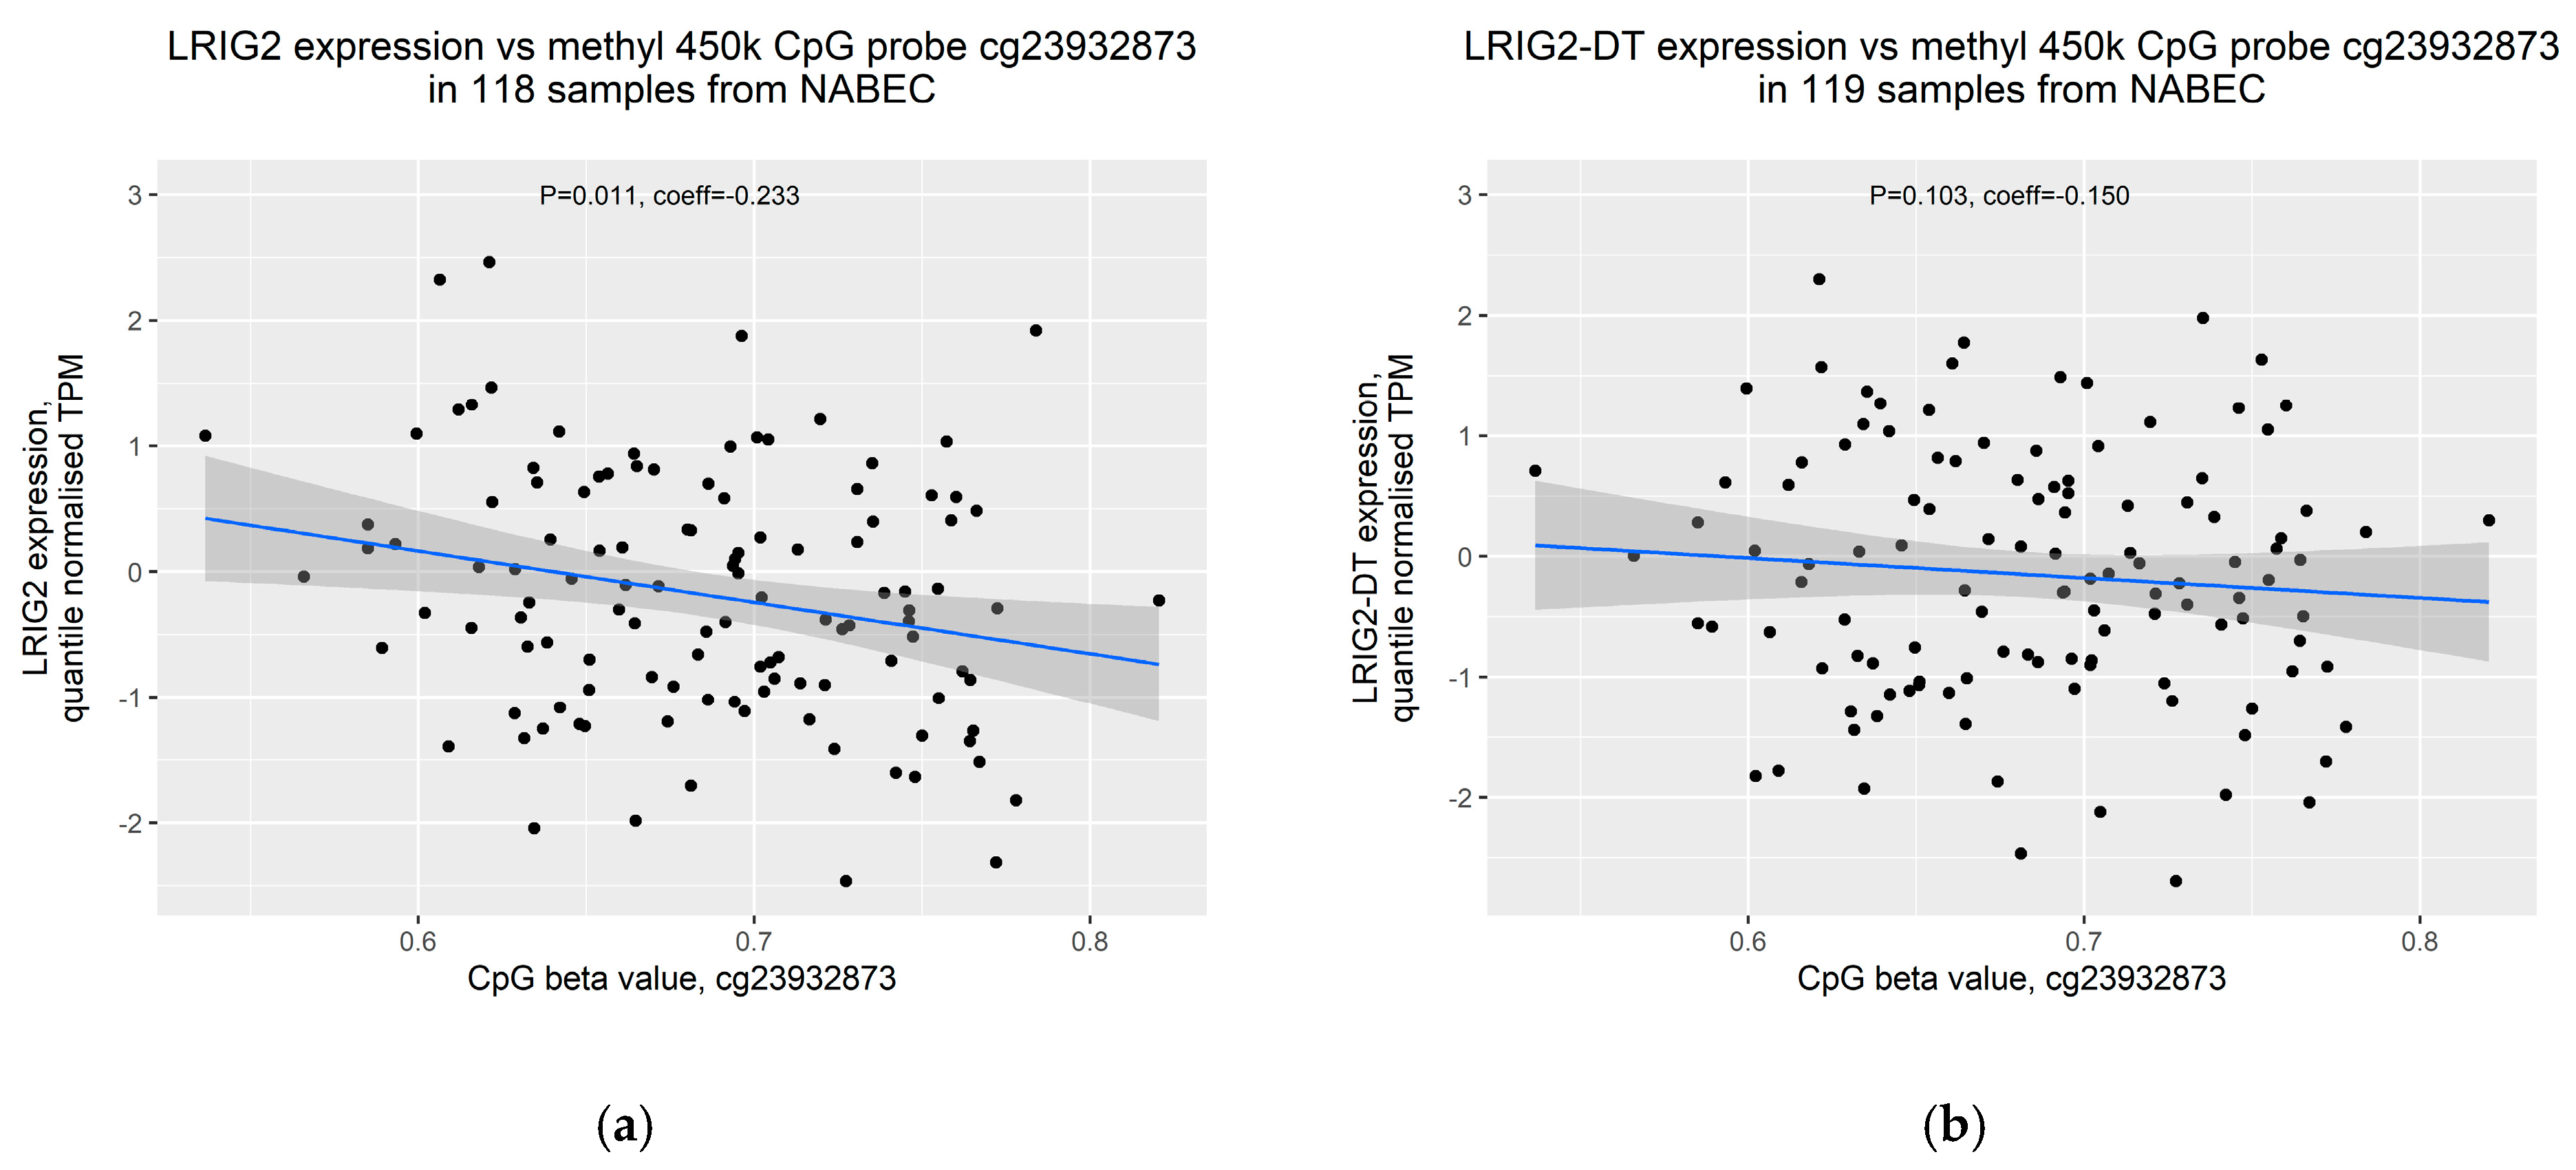
2.4. Increased Methylation of cg23932873 Is Weakly Correlated with Decreased Expression of LRIG2
3. Discussion
4. Materials and Methods
Author Contributions
Funding
Acknowledgments
Conflicts of Interest
Abbreviations
| NABEC | North American Brain Expression Consortium |
| SVA | SINE-VNTR-Alu |
| RIP | Retrotransposon insertion polymorphism |
| LTR | Long terminal repeat |
| Hg38 | Human genome assembly GRCh38 |
| VNTR | Variable number tandem repeat |
| SINE | Short interspersed nuclear element |
| SNP | Single-nucleotide polymorphism |
| CTCF | CCCTC-binding factor |
| CTCFL | CTCF like |
| LRIG2 | Leucine-rich repeats and immunoglobulin-like domains 2 |
| dbRIP | Database of RIPs in humans |
| dbGaP | Database of Genotypes and Phenotypes |
| WGS | Whole-genome sequencing |
| TPM | Transcripts per kilobase million |
| mQTL | Methylation quantitative trait loci |
| SE | Standard error |
References
- Lander, E.S.; Linton, L.M.; Birren, B.; Nusbaum, C.; Zody, M.C.; Baldwin, J.; Devon, K.; Dewar, K.; Doyle, M.; FitzHugh, W.; et al. Initial sequencing and analysis of the human genome. Nature 2001, 409, 860–921. [Google Scholar] [CrossRef] [PubMed]
- Erwin, J.A.; Marchetto, M.C.; Gage, F.H. Mobile DNA elements in the generation of diversity and complexity in the brain. Nat. Rev. Neurosci. 2014, 15, 497–506. [Google Scholar] [CrossRef] [PubMed]
- Cordaux, R.; Batzer, M.A. The impact of retrotransposons on human genome evolution. Nat. Rev. Genet. 2009, 10, 691–703. [Google Scholar] [CrossRef] [PubMed]
- Wang, H.; Xing, J.; Grover, D.; Hedges, D.J.; Han, K.; Walker, J.A.; Batzer, M.A. SVA Elements: A Hominid-specific Retroposon Family. J. Mol. Biol. 2005, 354, 994–1007. [Google Scholar] [CrossRef]
- Hancks, D.C.; Goodier, J.L.; Mandal, P.K.; Cheung, L.E.; Kazazian, H.H., Jr. Retrotransposition of marked SVA elements by human L1s in cultured cells. Hum. Mol. Genet. 2011, 20, 3386–3400. [Google Scholar] [CrossRef]
- Bantysh, O.B.; Buzdin, A.A. Novel family of human transposable elements formed due to fusion of the first exon of gene MAST2 with retrotransposon SVA. Biochemistry (Moscow) 2009, 74, 1393–1399. [Google Scholar] [CrossRef]
- Xing, J.; Zhang, Y.; Han, K.; Salem, A.H.; Sen, S.K.; Huff, C.D.; Zhou, Q.; Kirkness, E.F.; Levy, S.; Batzer, M.A.; et al. Mobile elements create structural variation: Analysis of a complete human genome. Genome Res. 2009, 19, 1516–1526. [Google Scholar] [CrossRef]
- Bennett, E.A.; Coleman, L.E.; Tsui, C.; Pittard, W.S.; Devine, S.E. Natural Genetic Variation Caused by Transposable Elements in Humans. Genetics 2004, 168, 933–951. [Google Scholar] [CrossRef]
- Stuart, H.M.; Roberts, N.A.; Burgu, B.; Daly, S.B.; Urquhart, J.E.; Bhaskar, S.; Dickerson, J.E.; Mermerkaya, M.; Silay, M.S.; Lewis, M.A.; et al. LRIG2 Mutations Cause Urofacial Syndrome. Am. J. Hum. Gen. 2013, 92, 259–264. [Google Scholar] [CrossRef]
- Holmlund, C.; Nilsson, J.; Guo, D.; Starefeldt, A.; Golovleva, I.; Henriksson, R.; Hedman, H. Characterization and tissue-specific expression of human LRIG2. Gene 2004, 332, 35–43. [Google Scholar] [CrossRef]
- Newman, W.G.; Woolf, A.S. Urofacial Syndrome. In GeneReviews®; Adam, M.P., Ardinger, H.H., Pagon, R.A., Wallace, S.E., Bean, L.J.H., Stephens, K., Amemiya, A., Eds.; University of Washington: Seattle, WA, USA, 1993. [Google Scholar]
- Haberle, V.; Stark, A. Eukaryotic core promoters and the functional basis of transcription initiation. Nat. Rev. Mol. Cell Biol. 2018, 19, 621–637. [Google Scholar] [CrossRef] [PubMed]
- Seila, A.C.; Calabrese, J.M.; Levine, S.S.; Yeo, G.W.; Rahl, P.B.; Flynn, R.A.; Young, R.A.; Sharp, P.A. Divergent transcription from active promoters. Science 2008, 322, 1849–1851. [Google Scholar] [CrossRef] [PubMed]
- Core, L.J.; Martins, A.L.; Danko, C.G.; Waters, C.T.; Siepel, A.; Lis, J.T. Analysis of nascent RNA identifies a unified architecture of initiation regions at mammalian promoters and enhancers. Nat. Genet. 2014, 46, 1311–1320. [Google Scholar] [CrossRef] [PubMed]
- Savage, A.L.; Bubb, V.J.; Breen, G.; Quinn, J.P. Characterisation of the potential function of SVA retrotransposons to modulate gene expression patterns. BMC Evol. Biol. 2013, 13, 101. [Google Scholar] [CrossRef]
- Strichman-Almashanu, L.Z.; Lee, R.S.; Onyango, P.O.; Perlman, E.; Flam, F.; Frieman, M.B.; Feinberg, A.P. A genome-wide screen for normally methylated human CpG islands that can identify novel imprinted genes. Genome Res. 2002, 12, 543–554. [Google Scholar] [CrossRef]
- Szpakowski, S.; Sun, X.; Lage, J.M.; Dyer, A.; Rubinstein, J.; Kowalski, D.; Sasaki, C.; Costa, J.; Lizardi, P.M. Loss of epigenetic silencing in tumors preferentially affects primate-specific retroelements. Gene 2009, 448, 151–167. [Google Scholar] [CrossRef]
- Turker, M.S. Gene silencing in mammalian cells and the spread of DNA methylation. Oncogene 2002, 21, 5388–5393. [Google Scholar] [CrossRef]
- Yates, P.A.; Burman, R.; Simpson, J.; Ponomoreva, O.N.; Thayer, M.J.; Turker, M.S. Silencing of mouse Aprt is a gradual process in differentiated cells. Mol. Cell Biol. 2003, 23, 4461–4470. [Google Scholar] [CrossRef]
- Moore, L.D.; Le, T.; Fan, G. DNA methylation and its basic function. Neuropsychopharmacology 2013, 38, 23–38. [Google Scholar] [CrossRef]
- Pugacheva, E.M.; Teplyakov, E.; Wu, Q.; Li, J.; Chen, C.; Meng, C.; Liu, J.; Robinson, S.; Loukinov, D.; Boukaba, A.; et al. The cancer-associated CTCFL/BORIS protein targets multiple classes of genomic repeats, with a distinct binding and functional preference for humanoid-specific SVA transposable elements. Epigenet. Chromatin 2016, 9, 35. [Google Scholar] [CrossRef]
- Zabolotneva, A.A.; Bantysh, O.; Suntsova, M.V.; Efimova, N.; Malakhova, G.V.; Schumann, G.G.; Gayfullin, N.M.; Buzdin, A.A. Transcriptional regulation of human-specific SVAF1retrotransposons by cis-regulatory MAST2 sequences. Gene 2012, 505, 128–136. [Google Scholar] [CrossRef] [PubMed]
- Wang, D.C.; Wang, W.; Zhang, L.; Wang, X. A tour of 3D genome with a focus on CTCF. Semin. Cell Dev. Biol. 2018, 90, 4–11. [Google Scholar] [CrossRef] [PubMed]
- Savage, A.L.; Wilm, T.P.; Khursheed, K.; Shatunov, A.; Morrison, K.E.; Shaw, P.J.; Shaw, C.E.; Smith, B.; Breen, G.; Al-Chalabi, A.; et al. An Evaluation of a SVA Retrotransposon in the FUS Promoter as a Transcriptional Regulator and Its Association to ALS. PLoS ONE 2014, 9, e90833. [Google Scholar] [CrossRef] [PubMed]
- Vasiliou, S.A.; Ali, F.R.; Haddley, K.; Cardoso, M.C.; Bubb, V.J.; Quinn, J.P. The SLC6A4 VNTR genotype determines transcription factor binding and epigenetic variation of this gene in response to cocaine in vitro. Addict. Biol. 2012, 17, 156–170. [Google Scholar] [CrossRef]
- Kaer, K.; Speek, M. Retroelements in human disease. Gene 2013, 518, 231–241. [Google Scholar] [CrossRef]
- Aneichyk, T.; Hendriks, W.T.; Yadav, R.; Shin, D.; Gao, D.; Vaine, C.A.; Collins, R.L.; Domingo, A.; Currall, B.; Stortchevoi, A.; et al. Dissecting the Causal Mechanism of X-Linked Dystonia-Parkinsonism by Integrating Genome and Transcriptome Assembly. Cell 2018, 172, 897–909. [Google Scholar] [CrossRef]
- Bragg, D.C.; Mangkalaphiban, K.; Vaine, C.A.; Kulkarni, N.J.; Shin, D.; Yadav, R.; Dhakal, J.; Ton, M.-L.; Cheng, A.; Russo, C.T.; et al. Disease onset in X-linked dystonia-parkinsonism correlates with expansion of a hexameric repeat within an SVA retrotransposon in TAF1. Proc. Natl. Acad. Sci. USA 2017, 114, E11020–E11028. [Google Scholar] [CrossRef] [PubMed]
- Wang, J.; Song, L.; Grover, D.; Azrak, S.; Batzer, M.A.; Liang, P. dbRIP: A highly integrated database of retrotransposon insertion polymorphisms in humans. Hum. Mutat. 2006, 27, 323–329. [Google Scholar] [CrossRef]
- De Koning, A.P.J.; Gu, W.; Castoe, T.A.; Batzer, M.A.; Pollock, D.D. Repetitive Elements May Comprise Over Two-Thirds of the Human Genome. PLoS Genet. 2011, 7, e1002384. [Google Scholar] [CrossRef]
- Halldorsson, B.V.; Istrail, S.; De La Vega, F.M. Optimal selection of SNP markers for disease association studies. Hum. Hered. 2004, 58, 190–202. [Google Scholar] [CrossRef]
- Vasieva, O.; Cetiner, S.; Savage, A.; Schumann, G.G.; Bubb, V.J.; Quinn, J.P. Potential Impact of Primate-Specific SVA Retrotransposons During the Evolution of Human Cognitive Function. Trends Evol. Biol. 2017, 6. [Google Scholar] [CrossRef]
- Lohmueller, K.E.; Pearce, C.L.; Pike, M.; Lander, E.S.; Hirschhorn, J.N. Meta-analysis of genetic association studies supports a contribution of common variants to susceptibility to common disease. Nat. Genet. 2003, 33, 177–182. [Google Scholar] [CrossRef] [PubMed]
- Ng, H.H.; Zhang, Y.; Hendrich, B.; Johnson, C.A.; Turner, B.M.; Erdjument-Bromage, H.; Tempst, P.; Reinberg, D.; Bird, A. MBD2 is a transcriptional repressor belonging to the MeCP1 histone deacetylase complex. Nat. Genet. 1999, 23, 58–61. [Google Scholar] [CrossRef] [PubMed]
- Geiman, T.M.; Sankpal, U.T.; Robertson, A.K.; Zhao, Y.; Zhao, Y.; Robertson, K.D. DNMT3B interacts with hSNF2H chromatin remodeling enzyme, HDACs 1 and 2, and components of the histone methylation system. Biochem. Biophys. Res. Commun. 2004, 318, 544–555. [Google Scholar] [CrossRef]
- Fuks, F.; Burgers, W.A.; Brehm, A.; Hughes-Davies, L.; Kouzarides, T. DNA methyltransferase Dnmt1 associates with histone deacetylase activity. Nat. Genet. 2000, 24, 88–91. [Google Scholar] [CrossRef] [PubMed]
- Fuks, F.; Hurd, P.J.; Deplus, R.; Kouzarides, T. The DNA methyltransferases associate with HP1 and the SUV39H1 histone methyltransferase. Nucleic Acids Res. 2003, 31, 2305–2312. [Google Scholar] [CrossRef]
- Stacey, S.N.; Kehr, B.; Gudmundsson, J.; Zink, F.; Jonasdottir, A.; Gudjonsson, S.A.; Sigurdsson, A.; Halldorsson, B.V.; Agnarsson, B.A.; Benediktsdottir, K.R.; et al. Insertion of an SVA-E retrotransposon into the CASP8 gene is associated with protection against prostate cancer. Hum. Mol. Genet. 2016, 25, 1008–1018. [Google Scholar] [CrossRef]
- Jacob, A.G.; Smith, C.W.J. Intron retention as a component of regulated gene expression programs. Hum. Genet. 2017, 136, 1043–1057. [Google Scholar] [CrossRef]
- Pollard, M.O.; Gurdasani, D.; Mentzer, A.J.; Porter, T.; Sandhu, M.S. Long reads: Their purpose and place. Hum. Mol. Genet. 2018, 27, R234–R241. [Google Scholar] [CrossRef]
- Amarasinghe, S.L.; Su, S.; Dong, X.; Zappia, L.; Ritchie, M.E.; Gouil, Q. Opportunities and challenges in long-read sequencing data analysis. Genome Biol. 2020, 21, 30. [Google Scholar] [CrossRef]
- Chang, C.C.; Chow, C.C.; Tellier, L.C.; Vattikuti, S.; Purcell, S.M.; Lee, J.J. Second-generation PLINK: Rising to the challenge of larger and richer datasets. Gigascience 2015, 4, 7. [Google Scholar] [CrossRef] [PubMed]
- Gibbs, J.R.; van der Brug, M.P.; Hernandez, D.G.; Traynor, B.J.; Nalls, M.A.; Lai, S.L.; Arepalli, S.; Dillman, A.; Rafferty, I.P.; Troncoso, J.; et al. Abundant quantitative trait loci exist for DNA methylation and gene expression in human brain. PLoS Genet. 2010, 6, e1000952. [Google Scholar] [CrossRef] [PubMed]


| SVA_LRIG2 Genotype | Validated Counts | Imputed Counts | Total Counts |
|---|---|---|---|
| −/− | 14 | 35 | 49 |
| +/− | 43 | 111 | 154 |
| +/+ | 39 | 46 | 85 |
| Total | 96 | 192 | 288 |
Publisher’s Note: MDPI stays neutral with regard to jurisdictional claims in published maps and institutional affiliations. |
© 2020 by the authors. Licensee MDPI, Basel, Switzerland. This article is an open access article distributed under the terms and conditions of the Creative Commons Attribution (CC BY) license (http://creativecommons.org/licenses/by/4.0/).
Share and Cite
Hall, A.; Moore, A.K.; Hernandez, D.G.; Billingsley, K.J.; Bubb, V.J.; Quinn, J.P.; NABEC (North American Brain Expression Consortium). A SINE-VNTR-Alu in the LRIG2 Promoter Is Associated with Gene Expression at the Locus. Int. J. Mol. Sci. 2020, 21, 8486. https://doi.org/10.3390/ijms21228486
Hall A, Moore AK, Hernandez DG, Billingsley KJ, Bubb VJ, Quinn JP, NABEC (North American Brain Expression Consortium). A SINE-VNTR-Alu in the LRIG2 Promoter Is Associated with Gene Expression at the Locus. International Journal of Molecular Sciences. 2020; 21(22):8486. https://doi.org/10.3390/ijms21228486
Chicago/Turabian StyleHall, Ashley, Anni K. Moore, Dena G. Hernandez, Kimberley J. Billingsley, Vivien J. Bubb, John P. Quinn, and NABEC (North American Brain Expression Consortium). 2020. "A SINE-VNTR-Alu in the LRIG2 Promoter Is Associated with Gene Expression at the Locus" International Journal of Molecular Sciences 21, no. 22: 8486. https://doi.org/10.3390/ijms21228486
APA StyleHall, A., Moore, A. K., Hernandez, D. G., Billingsley, K. J., Bubb, V. J., Quinn, J. P., & NABEC (North American Brain Expression Consortium). (2020). A SINE-VNTR-Alu in the LRIG2 Promoter Is Associated with Gene Expression at the Locus. International Journal of Molecular Sciences, 21(22), 8486. https://doi.org/10.3390/ijms21228486