Article

Trans-Ancestral Fine-Mapping and Epigenetic Annotation as Tools to Delineate Functionally Relevant Risk Alleles at IKZF1 and IKZF3 in Systemic Lupus Erythematosus

by
Timothy J. Vyse
and
Deborah S. Cunninghame Graham
*
Department of Medical and Molecular Genetics, King’s College London, London SE1 9RT, UK
*
Author to whom correspondence should be addressed.
Int. J. Mol. Sci. 2020, 21(21), 8383; https://doi.org/10.3390/ijms21218383
Submission received: 28 August 2020 / Revised: 9 October 2020 / Accepted: 13 October 2020 / Published: 9 November 2020
(This article belongs to the Special Issue Functional Genomics in Health and Disease)

Abstract

:
Background: Prioritizing tag-SNPs carried on extended risk haplotypes at susceptibility loci for common disease is a challenge. Methods: We utilized trans-ancestral exclusion mapping to reduce risk haplotypes at IKZF1 and IKZF3 identified in multiple ancestries from SLE GWAS and ImmunoChip datasets. We characterized functional annotation data across each risk haplotype from publicly available datasets including ENCODE, RoadMap Consortium, PC Hi-C data from 3D genome browser, NESDR NTR conditional eQTL database, GeneCards Genehancers and TF (transcription factor) binding sites from Haploregv4. Results: We refined the 60 kb associated haplotype upstream of IKZF1 to just 12 tag-SNPs tagging a 47.7 kb core risk haplotype. There was preferential enrichment of DNAse I hypersensitivity and H3K27ac modification across the 3′ end of the risk haplotype, with four tag-SNPs sharing allele-specific TF binding sites with promoter variants, which are eQTLs for IKZF1 in whole blood. At IKZF3, we refined a core risk haplotype of 101 kb (27 tag-SNPs) from an initial extended haplotype of 194 kb (282 tag-SNPs), which had widespread DNAse I hypersensitivity, H3K27ac modification and multiple allele-specific TF binding sites. Dimerization of Fox family TFs bound at the 3′ and promoter of IKZF3 may stabilize chromatin looping across the locus. Conclusions: We combined trans-ancestral exclusion mapping and epigenetic annotation to identify variants at both IKZF1 and IKZF3 with the highest likelihood of biological relevance. The approach will be of strong interest to other complex trait geneticists seeking to attribute biological relevance to risk alleles on extended risk haplotypes in their disease of interest.

1. Introduction

Systemic Lupus Erythematosus (SLE) is a complex autoimmune disease of unknown etiology. However, genome-wide association analysis of cohorts has proven to be a successful means of identifying novel susceptibility loci for lupus [1,2,3,4,5,6,7,8,9,10,11]. The 84 autosomal genetic risk factors identified in the largest of these Genome-wide association studies (GWAS) studies, in a Euro-Canadian cohort [12]) implicate many different gene families from diverse biochemical pathways. Dysregulation of these molecular pathways could have serious consequences for the function of multiple immune cell types. The Ikaros family of Kruppel zinc finger transcription factors is one such gene family. The importance of this gene family in SLE pathogenesis is evidenced by the associations (Pmeta < 5 × 10⁻⁸) for three family members: IKZF1 (Ikaros) (rs2366293-C, rs4917014-T), IKZF3 (Aiolos) (rs2941509-T) and IKZF2 (Helios) (rs6435760-C) [12].
The Ikaros transcription factors are important regulatory proteins in hematopoiesis and lymphocyte function and as such make good functional candidates for lupus. Excluding Pegasus (IKZF5) the other four member of the Ikaros transcription factor gene family co-evolved in pairs: IKZF1 and IKZF3 from a common ancestor IKFL1 and IKZF2 (Helios) and IKZF4 (Eos) from IKFL2 [13]. However, all four proteins have subsequently developed functional differences and expression profiles. The focus of this manuscript the trans-ancestral fine mapping and epigenetic characterization of the two IKFL1-derived IKZF transcription factors, namely IKZF3 and IKZF1. There is strong evidence to support both IKZF1 and IKZF3 as strong candidates for SLE. Expression of IKZF3 is largely restricted to T and B cells and the Aiolos knockout mouse, which spontaneously develops a lupus-like phenotype, is characterized by the chronic activation of B cells with increased levels of autoantibodies and glomerulonephritis [14]. IKZF1 has a wider expression pattern in blood cell types, being involved in hematopoietic stem cell development [15] and in lymphoid development, as evidenced by the lack of T, B, NK and dendritic cells in a mouse model which lacks Ikzf1 DNA-binding exons 3–5 [16]. Myeloid cell types are unaffected.
Both IKZF3 and IKZF1 Have also Been Reported to be Risk Factors for Other Autoimmune Diseases. At IKZF1, although associations have been reported for multiple autoimmune diseases, there is no common consensus risk variant between studies for SLE and: Crohn’s Disease (rs1456896) [17]; Irritable Bowel Disease (rs1456896) [18]; Ulcerative Colitis (rs1456896) [18], Multiple Sclerosis (rs201847125) [19], Type I Diabetes (rs10272724) [20]. The associated in variant in SLE (rs4917014) has limited linkage disequilibrium (LD) (r2 = 0.25) with any of the variants for the other autoimmune diseases listed and is present at a higher minor allele frequency (MAF) than the other AID variants in Europeans.
The association at the IKZF3 locus in European SLE is different from that seen in the other autoimmune diseases, where the association is driven by a high frequency (MAF > 40% risk allele): Crohn’s Disease (rs2872507, rs12946510) [17,18]; Rheumatoid Arthritis (rs2872507) [21]; Primary Biliary Cirrhosis (rs8067378) [22]; Ulcerative Colitis (rs12946510, rs2872507) [18,23]; Multiple Sclerosis (rs12946510) [19]; Inflammatory Bowel Disease (rs12946510) [18]; Childhood Asthma (multiple variants) [24] or T1D (rs12453507) [25]. None of these variants is in LD with the SLE variant (r2 < 0.03) and the non-SLE variants show strong LD (r2 > 0.80) with each other.
In the literature, there is no convincing data to support a role for rs4917014 as a conclusive cis-eQTL for IKZF1. There is a single report, comparing IKZF1 protein expression in different types of B cells from SLE cases (n = 10) and healthy controls (n = 10). There was a marginal increase in the MFI detection for IKZF1+ CD27+IgD switched memory (SwM) B cells, CD27+IgD+ double-positive non-switched memory (NSM) B cells and CD27IgD DN B cells in SLE patients compared with healthy controls. In the same dataset there was less MFI detected for CD27IgD+ mature naive B cells in the patients compared with the healthy controls [26]. Therefore, acknowledging that this existing protein expression data uses both limited cell types and activity states and that the results were not correlated with genetic risk factors, we looked for evidence of other mechanisms whereby risk alleles at IKZF1 may influence IKZF1 levels.
The risk alleles for both IKZF1 and IKZF3 lie on extended haplotypes, which makes it challenging to define causal variants for functional studies. In this paper a combined approach to identify risk alleles with an increased likelihood for biologic function. Firstly, we annotate tag-SNPs on the risk haplotypes at both loci using publicly available epigenetic and regulatory datasets, from Roadmap [27], ENCODE [28], PC-Hi-C [29] and Haploreg v4 [30]. Those alleles carried on risk haplotypes which possess or are co-localized with, a greater level of epigenetic modification are more likely to have functional significance. The second part of our strategy capitalizes on the differential severity and prevalence of SLE between ancestries. We use a trans-ancestral fine-mapping method to define shared variants on population-specific haplotypes, which increases the weight in prioritization for functional characterization. Therefore, using a “two-pronged attack” exploiting both epigenetic annotation and trans-ancestral fine mapping we seek to narrow down the core regions of association at IKZF1 and IKZF3 and define sets of candidate causal variants at each locus.

2. Results

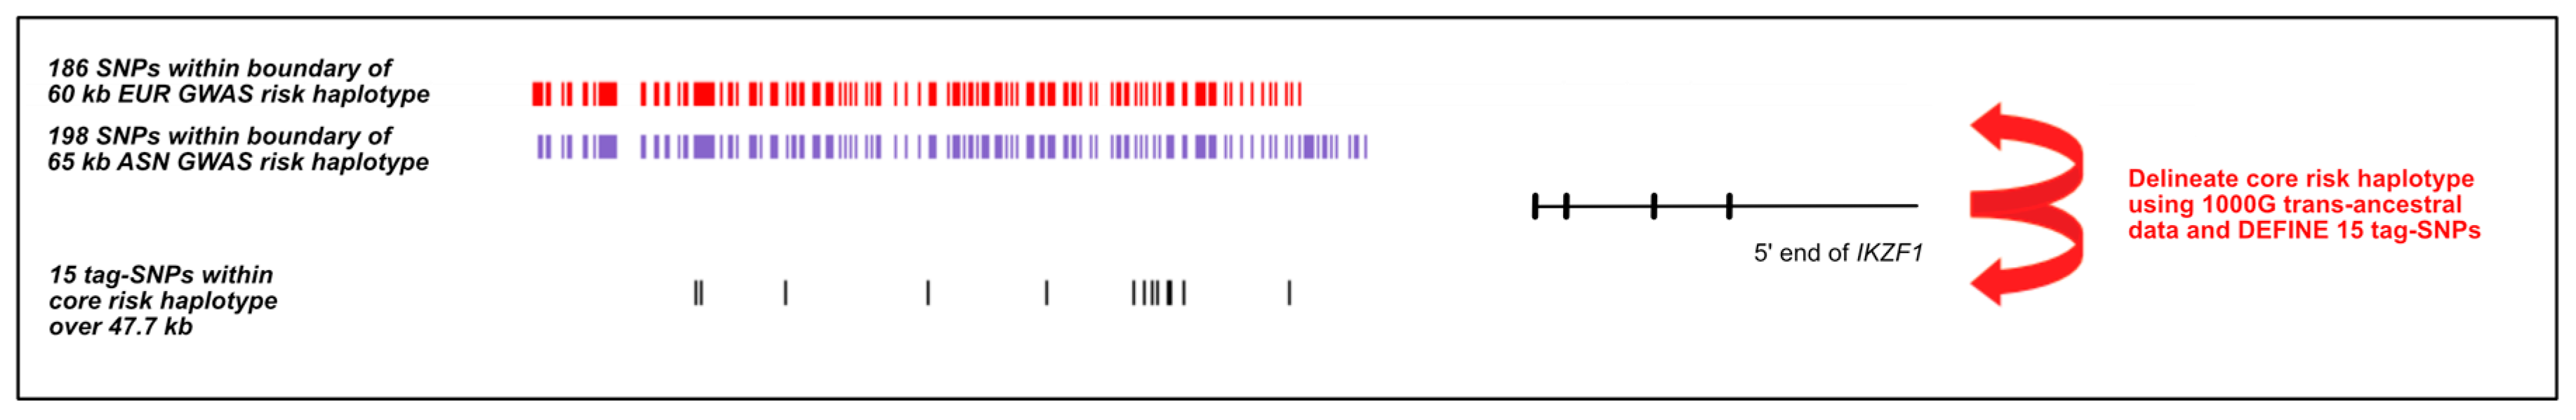
2.1. Defining the Risk Haplotype at IKZF1 in SLE

The strongest risk allele at IKZF1 (rs4917014-T) from our European SLE GWAS [12] is located 38.5 kb upstream of the TSS for IKZF1 (Pmeta < 5 × 10⁻⁸). The variant lies within the proximal end of the risk haplotype in the control samples from this GWAS (Figure A1A–C). This 60 kb risk haplotype (EUR_GWAS) (Figure A1D), which carries a total of 186 variants (using boundary cut-off of r2 > 0.75 with rs4917014) is bounded by rs1870027 and rs17552904 (chr7:50258234-50318308, hg19).
The association was replicated in a meta-analysis with two Chinese (ASN) GWAS [7,31,32]. In these Chinese datasets, rs4917014 is located on an overlapping, albeit slightly longer risk haplotype ASN_GWAS, comprising 198 variants over 65 kb, bounded by rs4598207 and rs6964608 (chr7:50258479-50324037, hg19) (Figure A1C). There are no other associations outside these risk haplotypes in either the European or Chinese populations.
The trans-ancestral SLE ImmunoChip study [33] provided minimal additional information, because the gene-centric genotyping platform used for the study had sparse coverage of the IKZF1 risk haplotype. Only five of the variants on the risk haplotypes from the European/Chinese GWAS studies were included on the chip. However, the dataset revealed that the MAF of those five risk alleles were more similar in samples of European and Asian origin to those of African origin. There was association for all five variants in African Americans and European samples (Table A1). We cannot explore the association in African samples in more detail because there is currently no published SLE GWAS in samples of African origin.

2.2. Refining the IKZF1 Risk Haplotype Using the 1000 Genomes Super-Populations

We narrowed down the risk haplotype with a trans-ancestral mapping approach, using healthy individuals taken from the five superpopulations from the 1000G super-population data: AFR—African; AMR—Admixed American; EAS—East Asian; EUR—European and SAS—South Asian. The refined region around rs4917014 shared across ancestries, using an LD cut-off of r2 > 0.75 with rs4917014, comprised 15 SNPs across only 47.7 kb, bounded by rs34767118 and rs876039 (chr7:50271064-50308811) (Figure 1). This region is most likely to harbor alleles of functional significance at IKZF1.

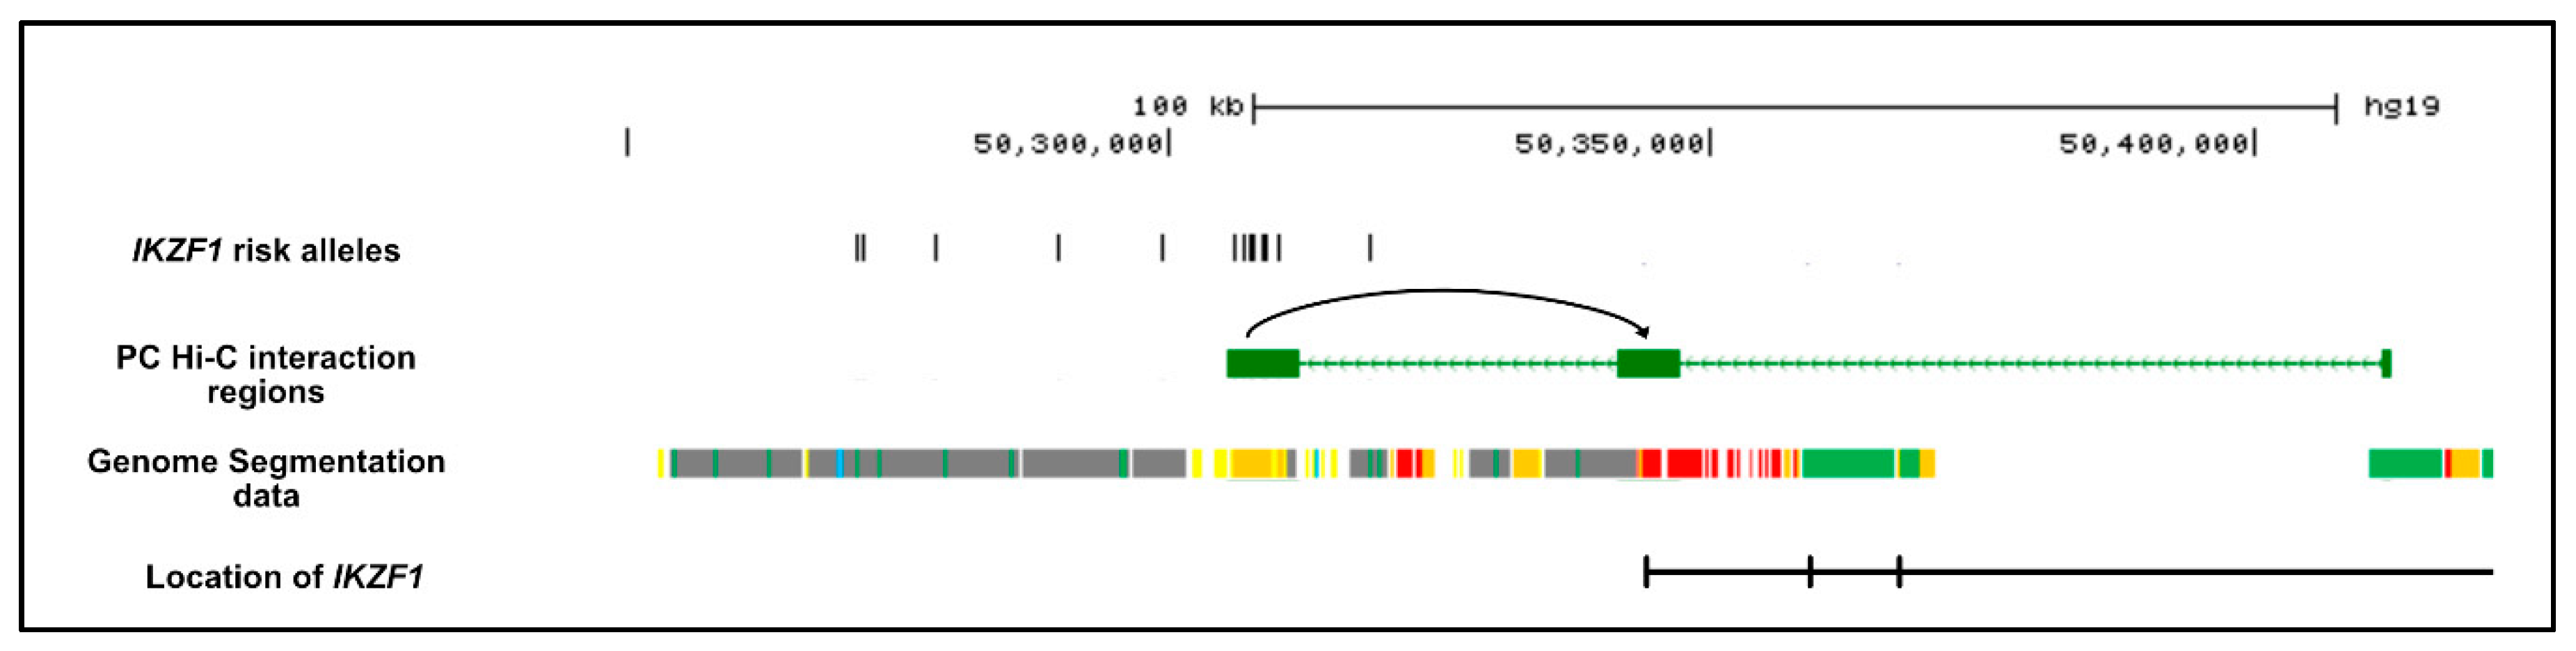
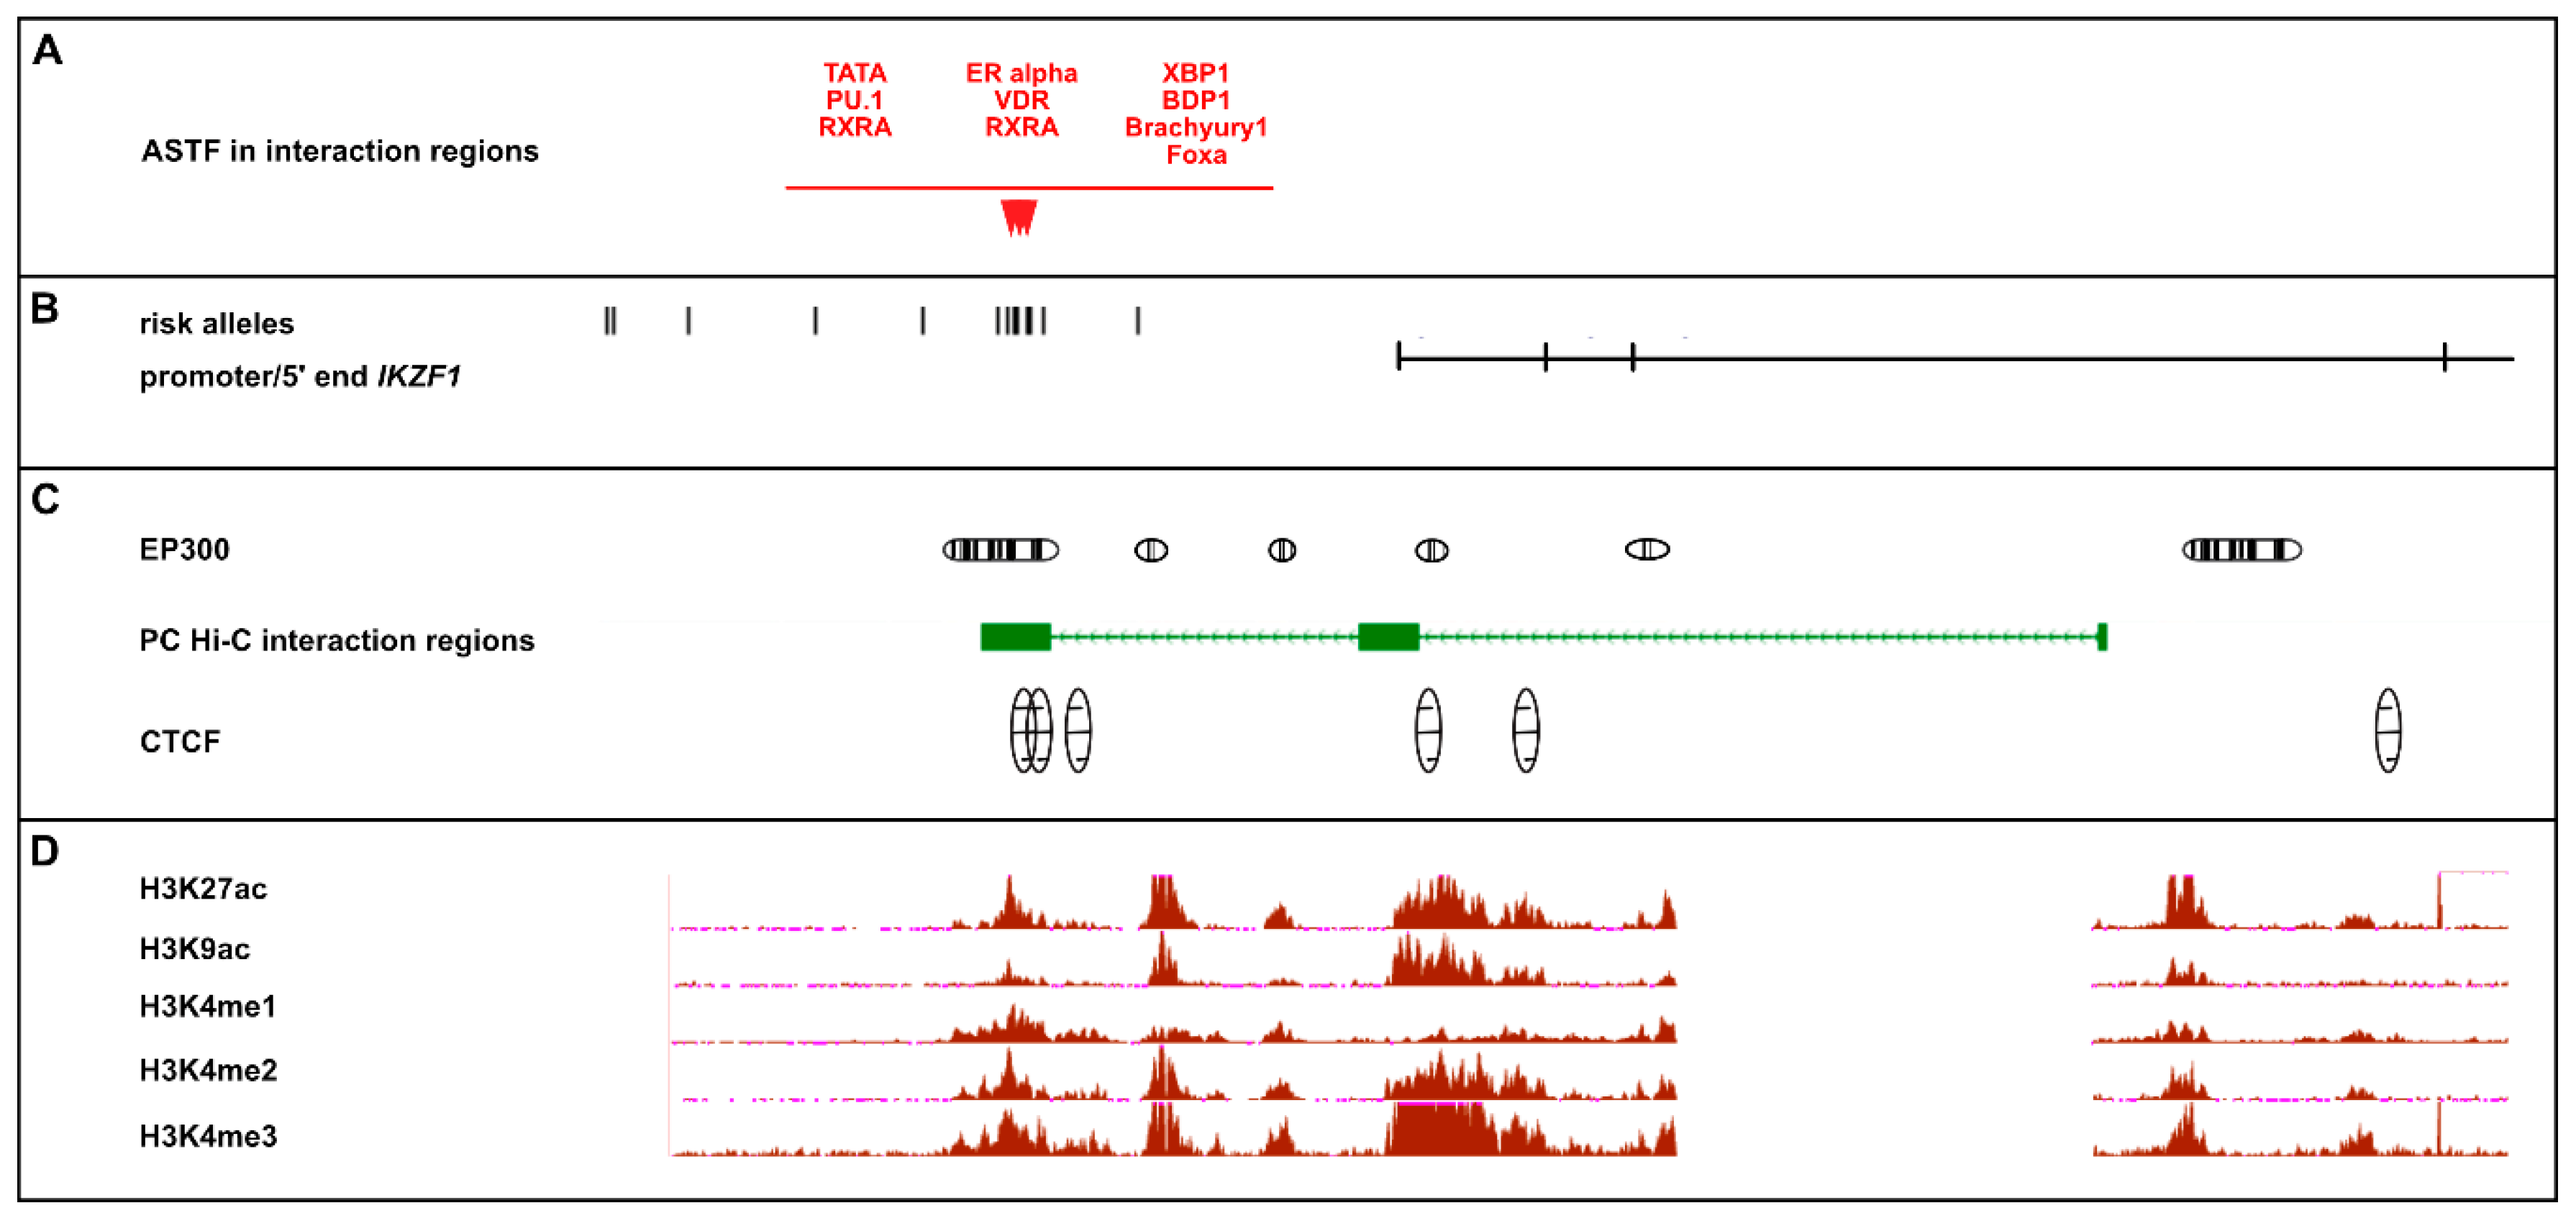
2.3. Functional Annotation of IKZF1 Risk Alleles

Given the limited cell types used for the published protein expression data in SLE samples [26] and the fact that the authors did not select cells based on specific risk alleles at IKZF1, we employed several strategies to investigate the mechanisms by which risk alleles may impact IKZF1 expression levels. We used publicly available epigenetic data in a diverse set of immune cell types to search for enrichment of epigenetic signals which overlapped the risk alleles within the 47.7 kb IKZF1 risk haplotype and therefore more likely to have functional significance.

2.3.1. Determination of Chromatin Status

Alignment of the risk alleles upstream of IKZF1 revealed that only the seven SNPs on the risk haplotype lie within a predicted enhancer (orange) using the Combined Genome Segmentation data from ENCODE in LCLs (Figure A1G). The remaining five variants were located within areas of heterochromatin (grey) or low activity (green). Taken together, these data suggest that the seven variants within the predicted enhancer region are more likely to be functionally active.

2.3.2. Chromatin Looping with Risk Alleles

The IKZF1 promoter is the hub of chromatin looping events at the locus. Analysis of Promoter Capture Hi-C data showed three interaction regions at IKZF1 (Figure 2 and Figure A1F) [29]. These data revealed that the proximal promoter (chr7:50341186-50347256) (TSS) interacts with the 3′ end of the enhancer region (chr7:50305428-50311993) (Enh) in multiple immune cell types (Figure A2A). The Enh region contains a set of seven risk alleles. A second interaction between the TSS and a shorter sequence in intron 3 (chr7:50411807-50412756) (I3) did not involve the Enh region (data not shown). There was cell-type specificity in the Enh-TSS looping activities (Figure A2A), with the strongest interaction (CHICAGO score > 11) seen in neutrophils, T and B lymphocytes. Each of the cell types which exhibited strong interaction also demonstrated higher than median IKZF1 expression for the human cells/tissues assessed by the GeneAtlas U133A microarray (BIOGPS) [34].
We also found that the 47.7 kb risk haplotype overlaps with a 9.7 kb GeneHancer region (GH07J050261) designated by the GeneHancer database [35,36]. GH07J050261 contains seven of the IKZF1 risk alleles (Figure A1E) and there is evidence of chromatin looping events between GH07J050261 and a second GeneHancer interval in the promoter (GH07J050303). The core risk haplotype lies within a previously identified SuperEnhancer region stretching into and across the IKZF1 coding region for multiple immune cell types (Figure A3).

2.3.3. Cell-Type Specificity in DNAse Sensitivity in the IKZF1 Enhancer Region

Figure 3 demonstrates preferential enrichment of DNAse I across IKZF1 in T cells. The PC Hi-C enhancer region exhibits the most convincing DNAse I hotspots (SignalValue > 5), with the strongest signals being in Th1 cells and regulatory T cells at rs4917014 and rs876036 (Figure A4A).

2.3.4. Discovery of Allele-Specific Transcription Factor Binding Sites

We characterized the transcription factors which are predicted to show allele-specific differences in binding affinity (from Haploreg v4.1) to each of the 12 risk alleles defined by GWAS. Ten of these polymorphism are predicted to exhibit allele-specific binding of one or more TFs (Table A3). Five of the risk alleles within the PC Hi-C Enh region exhibit strong allele-specific binding affinity (>3 fold predicted change) for TFs which also bind to variants in the IKZF1 PC Hi-C TSS/promoter interaction region or the GeneHancer promoter region (Table 1). These five risk variants, through shared binding events have the greatest potential for genetic control of IKZF1 gene expression through chromatin looping events, leading to dimerization of the shared TF and increased regulatory activity on gene expression.
Figure 4 summarizes the epigenetic landscape across IKZF1. The TFs predicted to show allele-specific binding (ASTF) lie within one of the CTCF regions within the upstream associated region and at one of the multiple EP300 binding sites across the locus. Both of these elements are characteristic of enhancer regions. There is also evidence of several epigenetic modifications across the region which commonly reside in active enhancers (H3K27ac), active regulatory elements/promoters (H3K9ac); promoter/TSS (H3K4me3) or are located in the gene body of CpG genes with higher expression (H3K4me1 and H3K4me2).

2.3.5. Identification of cis-eQTLs at IKZF1

None of the SLE risk alleles in the PC Hi-C Enh or TSS/Promoter regions are themselves cis-eQTLs for IKZF1 expression in whole blood from the GTEx2015_v6 data or from the NESDR NTR conditional eQTL database [37,38].
However, four of the ten risk variants predicted to exhibit allele-specific TF binding share the same TFs with other polymorphism in the promoter GH07J050293 interaction region, which are also cis-eQTLs for IKZF1 in whole blood in either the GTEx2015_v6(*) or the NESDA NTR conditional eQTL(#) databases (Table 1). These six promoter eQTLs are: rs11765436/rs7802443-RXRA-rs11185603; rs9886239-PU.1-rs11185603; rs11761922/rs7781977-BDP1-rs876038; rs10269380-Brachyury-rs876038 and rs7777365-FOXA-rs876039. It will be important to establish whether the TFs involved form a “bridge” to support the chromatin looping between the enhancer and promoter regions and whether there is a potential contribution of SLE risk alleles to control gene expression at IKZF1.

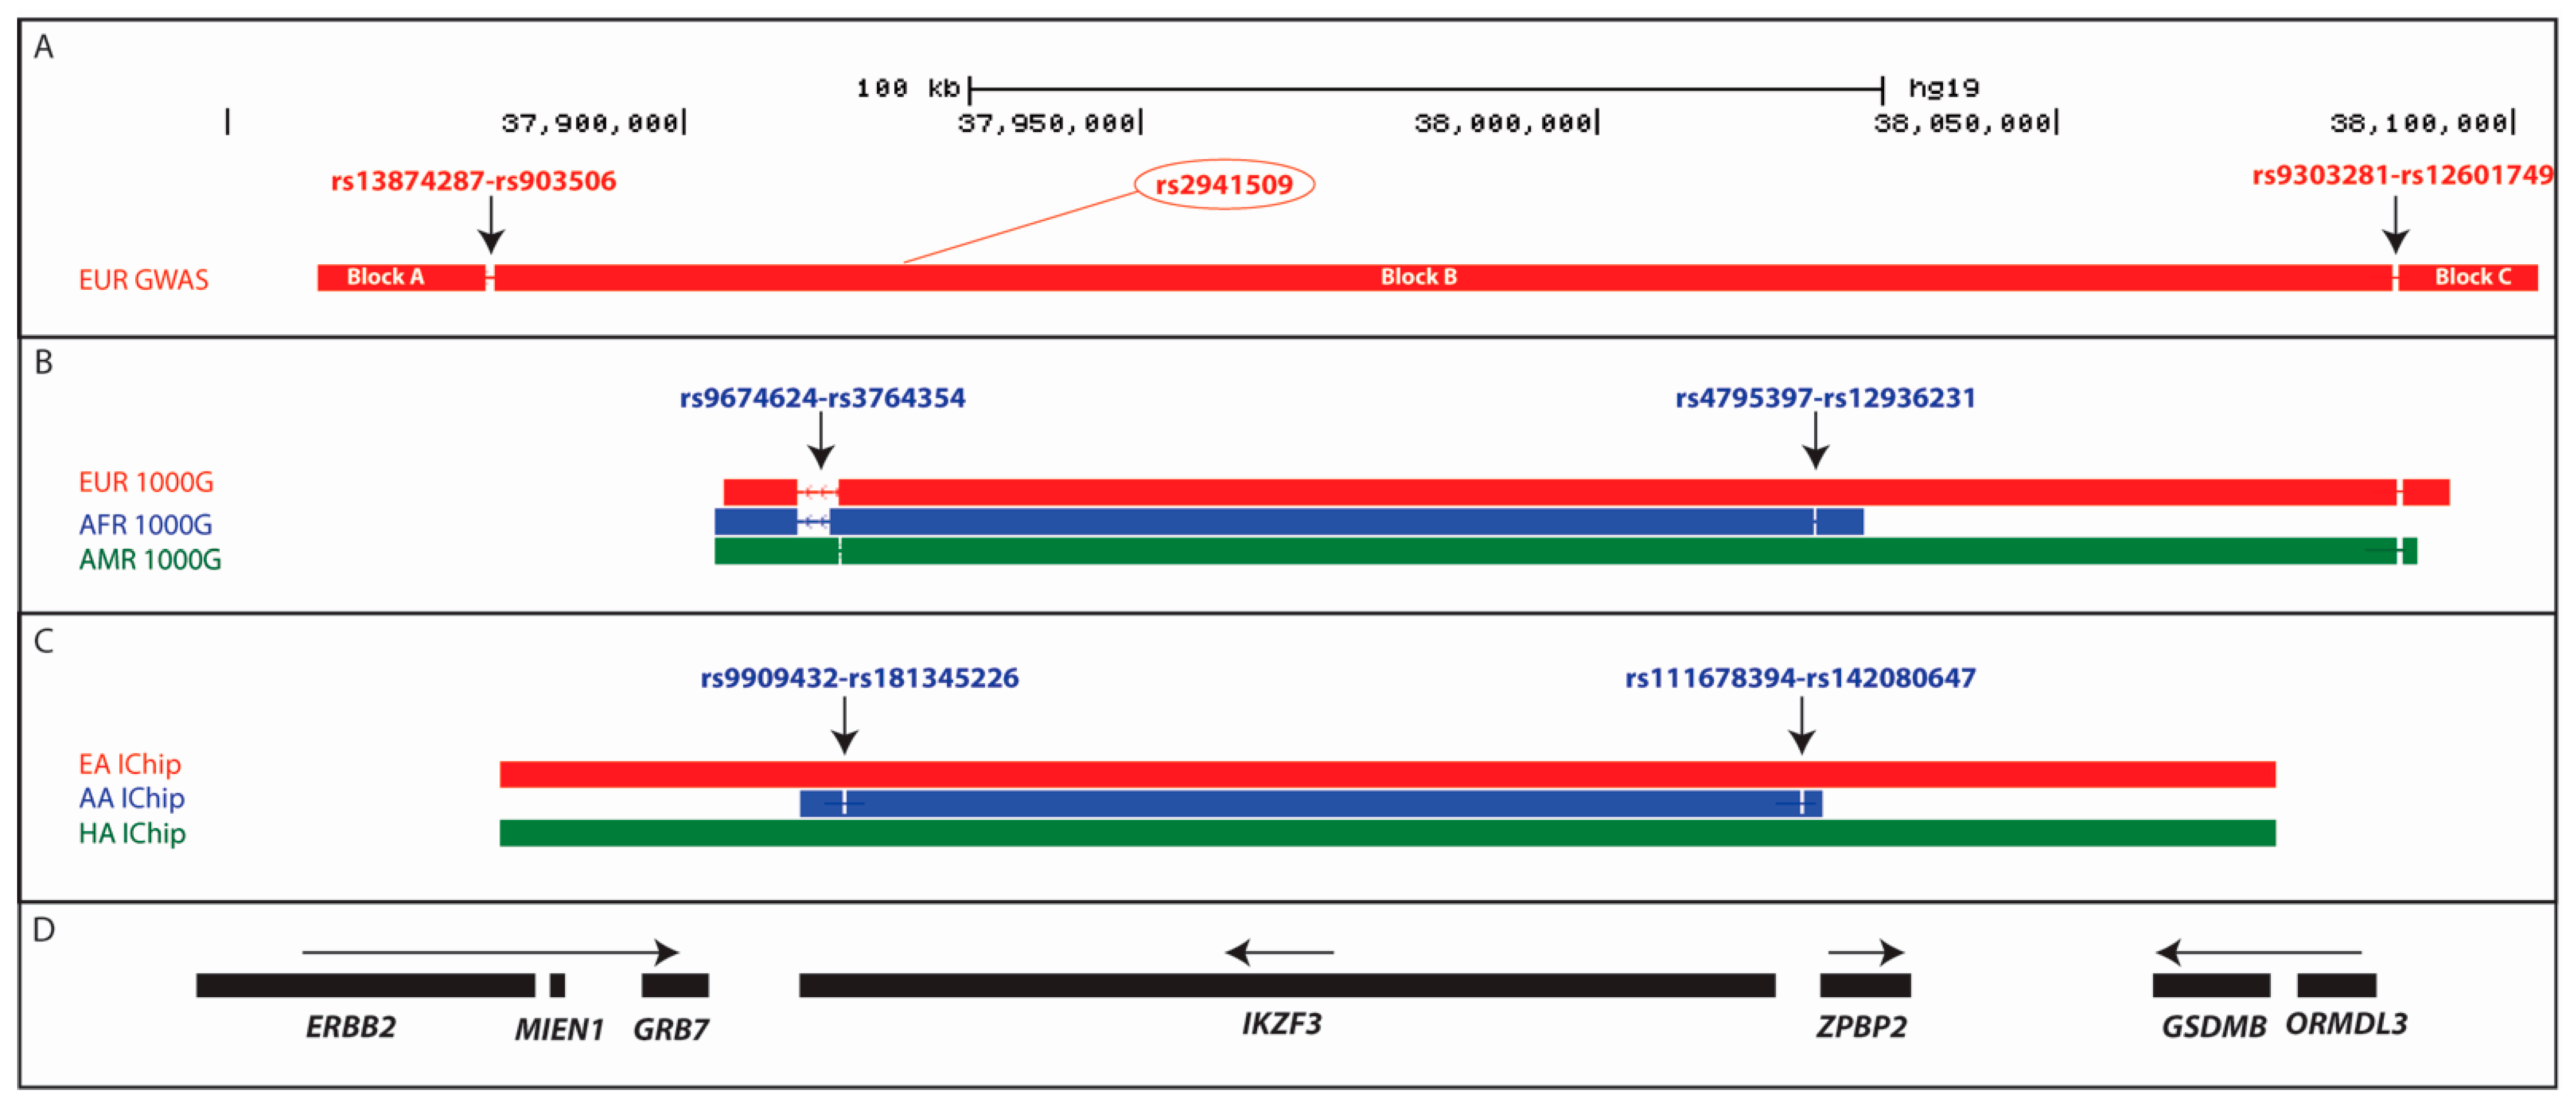
2.4. Extended IKZF3 Haplotype across Multiple Genes in European SLE GWAS Study

In our European GWAS [12] we identified a single associated haplotype at the IKZF3 locus which stretches from intron 19 of ERBB2 (rs903506), across IKZF3, ZPBP2, GSDMB and ORMDL3 into the upstream region of ORMDL3 (rs9303281) (Figure A5A), a distance 194 kb (chr17:37879762-38074046). This European IKZF3 risk haplotype (EUR-IKZF3 haplotype) present at a frequency of 3% in Europeans, is tagged by the minor risk alleles of 282 variants with each of the five genes within the haplotype boundary containing multiple risk alleles. The peak association from conditional analyses is in the 3′ UTR of IKZF3 (rs2941509). However, the tight LD across the locus in Europeans means that it is not possible to discriminate between any of the 282 tag SNPs as possessing functional significance.

2.5. Fine-Mapping the IKZF3 Risk Haplotype Using the 1000 Genomes Super-Populations

In an attempt to narrow down the region of the European risk haplotype to define the segment most likely to harbor alleles of functional significance, we adopted a trans-ancestral approach, which utilized the five 1000G super-population datasets, to discover the minimal risk haplotype shared between ancestries.
The frequency of the European risk haplotype in the EUR-GWAS (3%) and EUR 1000G samples (2.9%) is ~6-fold less in the African AFR 1000G samples (12.5%), whereas in AMR individuals the frequency was marginally below (2.3%) that seen in EUR samples. In both Asian super-populations, the EUR-IKZF3 haplotype was present at <0.1%, so we did not include the two Asian super-populations in further trans-ancestral analyses.
The alignment of the haplotype blocks from AFR, EUR and AMR 1000G samples allowed us to identify a common shared haplotype block containing the rs2941509 risk variant, of 107 kb (Figure A5B). In all three datasets, the 3′ of this refined haplotype is at the 3′ end of IKZF3, between the immediate 3′ flanking region (within an IKZF1 ChIP-binding site from ENCODE in EBV-LCLs) (rs9674624) and the 3′ UTR (rs3764354). The 5′ boundary of the risk haplotype was defined using the AFR 1000G samples because in both EUR and AMR samples the 5′ LD break is in the same place, upstream of ORMDL3 (rs112191651-rs4795405). However, in the AFR samples, the haplotype block is shorter, with the 5′ boundary lying within an IKZF1 binding site in the IKZF3-ZPBP2 bi-directional promoter (rs4795397-rs12936231). Taken together, these results show that the AFR samples are a key discriminator in narrowing down the common shared haplotype. Using the 1000G data we have successfully reduced the length of the core IKZF3 risk haplotype by over 44% from 194 kb (EUR GWAS) to 107 kb (AFR 1000G)(chr17:37916823-38023745). We have also reduced the number of tag SNPs from 282 (EUR GWAS) to 152 (AFR 1000G) (Figure A5B).
Using genotypes from 2452 AA healthy control samples on the ImmunoChip we further reduced the length of the risk haplotype block, at both the 5′ and 3′ ends, by a total of 6 kb compared to the same block in the AFR 1000 Genomes dataset (Figure A5B). In a similar manner to our results in the AFR 1000G samples, the haplotype carrying the European risk alleles (EUR-IKZF3 haplotype) in the AA (African-American) ImmunoChip cohort was present at a higher frequency (~12%) than in European samples. However, in the HA (Hispanic-American) (ncontrols = 2016) ImmunoChip cohort, the haplotype carrying the European risk alleles was at a reduced frequency (2.5%) compared to the European GWAS haplotype (Figure A5B), albeit it the same length, so would not add any further information in fine-mapping the European signal.
In summary, the LD break-points in both the AA ImmunoChip and AFR 1000G datasets allow us to massively reduce, by >47%, the IKZF3 risk haplotype first identified in the Euro-Canadian SLE GWAS, leading to a risk haplotype covering 101 kb (chr17:37920146-38021117), restricted to the coding region for IKZF3 and carrying only 140 European tag-SNPs.

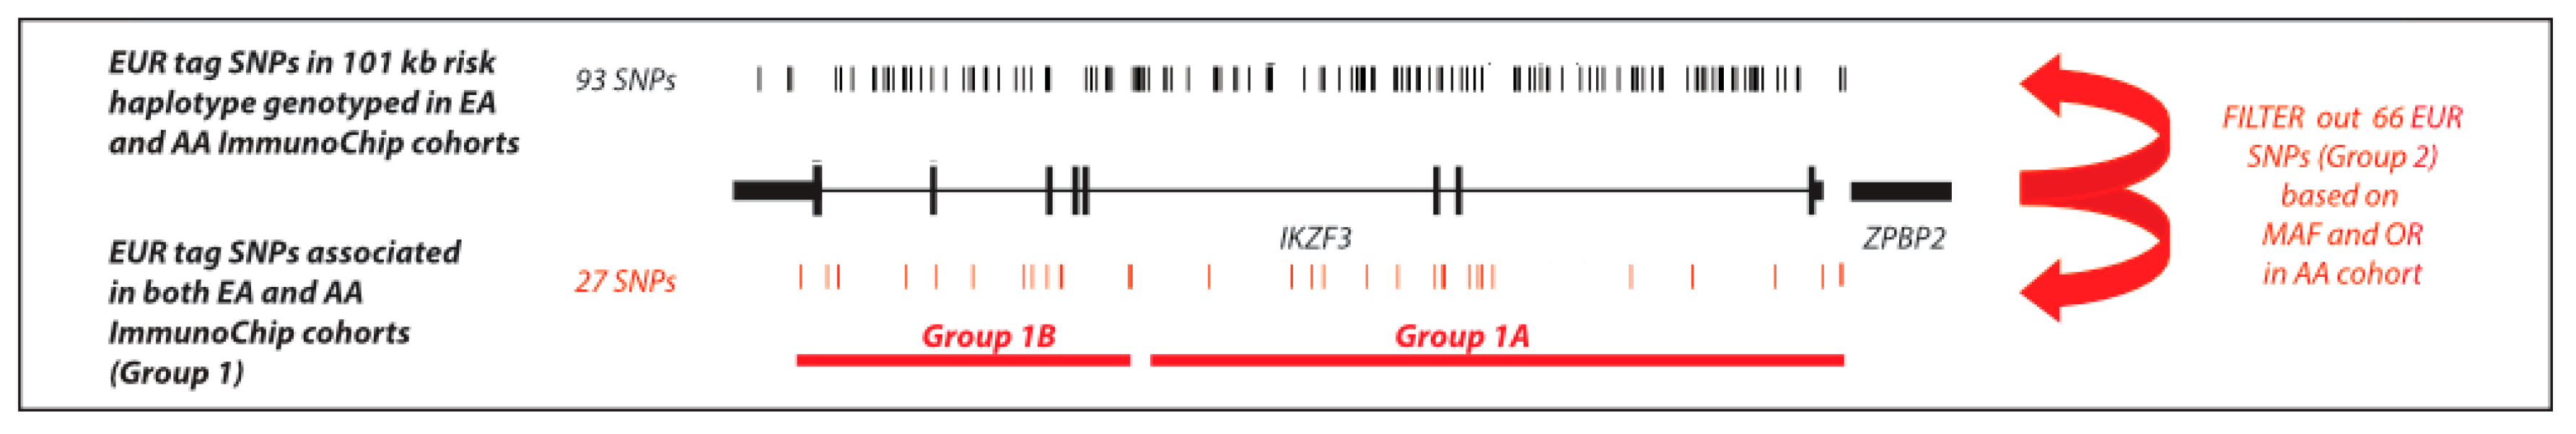
2.6. Trans-Ancestral Exclusion Mapping of IKZF3 using the SLE ImmunoChip Data

We replicated the association signal at IKZF3 in a EA (European-American) SLE ImmunoChip cohort (ncases = 6748, ncontrols = 11,516), with a total of 93 tag-SNPs in LD with rs2941509 (ORrs2941509 = 1.27, CI 1.14–1.41) showing highly significant association (Table A4).
We used trans-ancestral exclusion mapping as a method of narrowing down the EUR-IKZF3 risk haplotype to variants with greater potential for biological significance, by excluding sets of variants based on the strength of association and MAF in two ancestries. Our analyses split the associated variants into two groups with 27 of the 93 tagging variants (Group 1) showing association with SLE (OR > 1.27) in the AA ImmunoChip cohort (ncases = 2970, ncontrols = 2452). The remaining 66 variants (Group 2) were not associated (OR < 1.14) with lupus in AA samples. None of the Group 1 or 2 variants were associated with other autoimmune diseases (from the GWAS Catalogue).
Furthermore, the Group 1 risk alleles (3.6% in EA samples) were much rarer in the AA ImmunoChip cohort (MAF < 0.1%). Conversely, for the Group 2 variants, the risk alleles from the EA study present at a higher MAF in the AA cohort (MAF >12%) compared with the EA samples. However, the increased frequency of the Group 2 variants did not lead to increased association in the AA population. Added to this, meta-analysis of the EA and AFR ImmunoChip datasets revealed that the OR of Group 2 SNPs was not increased by either a fixed effects (OR) or by random effects (OR(R)) model and we found high heterogeneity between the two ancestries (I > 50) (Table A4). These results led to the exclusion of 66 variants on the risk haplotype which included the lead SNP identified in our original GWAS study (rs2941509) [12]. Therefore, we focused our further functional annotation on the 27 Group 1 SNPs because they showed association in both populations and were more likely to harbor alleles of functional significance for lupus.
We employed a subsequent round of trans-ancestral exclusion mapping to split the remaining 27 group 1 variants into two sets, based on the degree of association in the AA cohort (Table A4, Figure 5). The 17 variants in Group 1A, which extend across the regulatory region of the gene (between the promoter region and I3), exhibited a stronger association (OR > 1.5) in the AA cohort compared to that seen in the EA population (OR > 1.27). This is despite the meta-analysis of Class 1A variants only providing marginal improvement in association, because of the low MAF in the AA cohort for these SNPs (Table 2). Conversely, the nine SNPs in Group 1B, which lie within the coding region including all six Zinc Fingers (I3-E7), showed similar strength of association in the AA and EA samples, despite the radically reduced MAF for variants in the AA cohort. We will include both Group 1A and 1B variants in our functional annotation of IKZF3 but have greater confidence that the variants in Group 1A will have a better predictive ability of biological significance than those in Group 1B.

2.7. Functional Annotation of Risk Alleles at IKZF3

2.7.1. Analysis of Expression Levels

As with IKZF1, none of the IKZF3 risk alleles are cis-eQTLs for IKZF3 in whole blood [37,38]. At IKZF3, this may reflect the lack of power in cis-eQTL analysis given the low MAF of the risk alleles (MAF = 0.03). However, at the protein level there is a significant increase of in the MFI detection of IKZF3 positive CD27+IgD switched memory (SwM) B cells and CD27+IgD+ double-positive non-switched memory (NSM) B cells in 10 SLE cases and 10 healthy controls, with moderate increases in the detection of MFI in CD27IgD DN B cells and CD27IgD+ mature naive B cells (naive) in the patients compared with the healthy controls [26].
Nevertheless, recognizing that the risk alleles at IKZF3 may exert their function through epigenetic mechanisms rather than direct transcriptional regulation and that this function may be cell-type and/or activation state specific, we looked for epigenetic mechanisms operating across the risk haplotype which may indicate that specific risk alleles may act in this way.

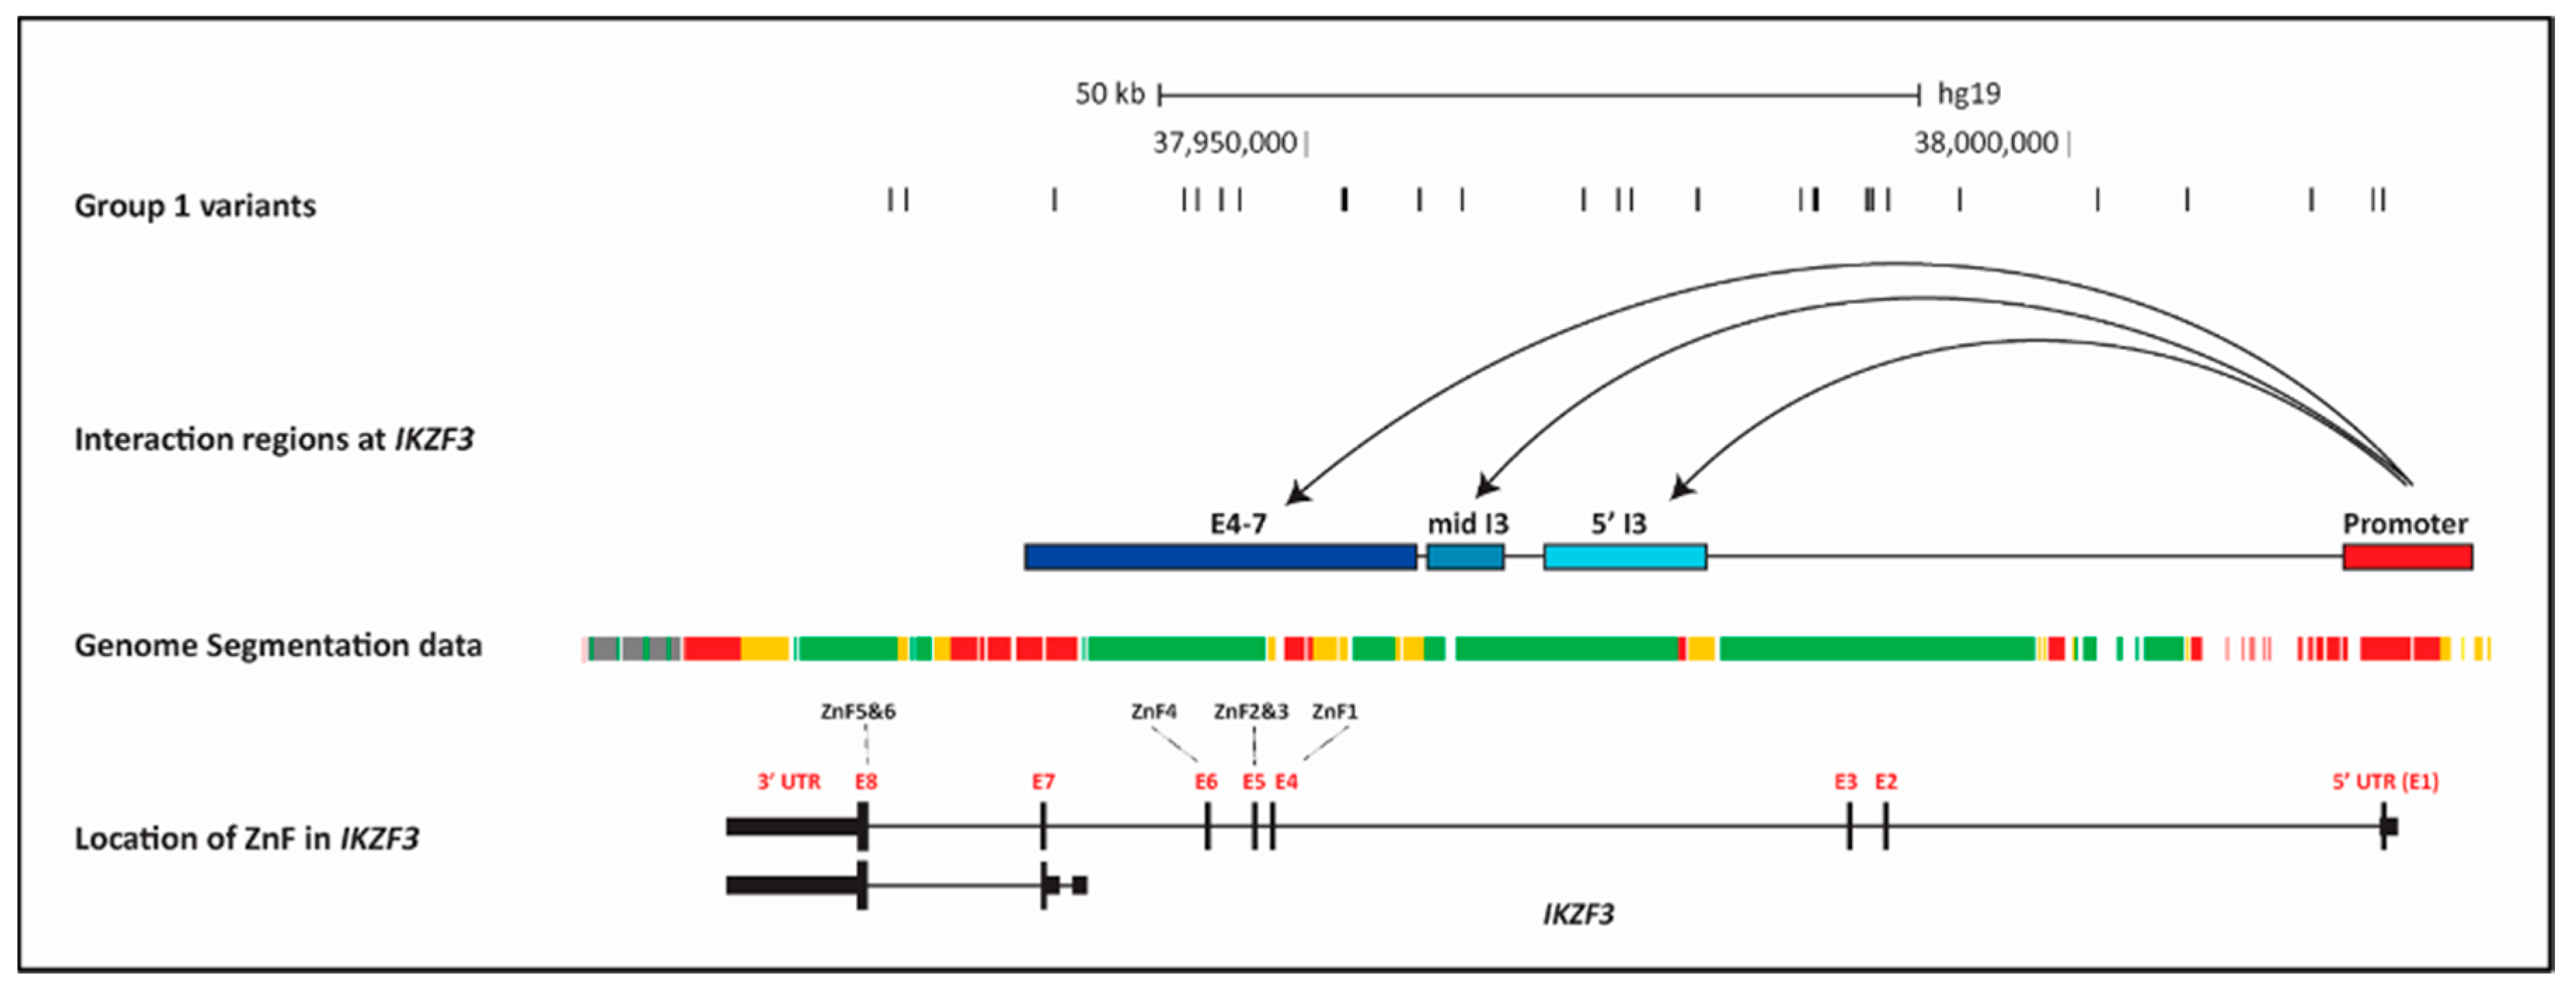
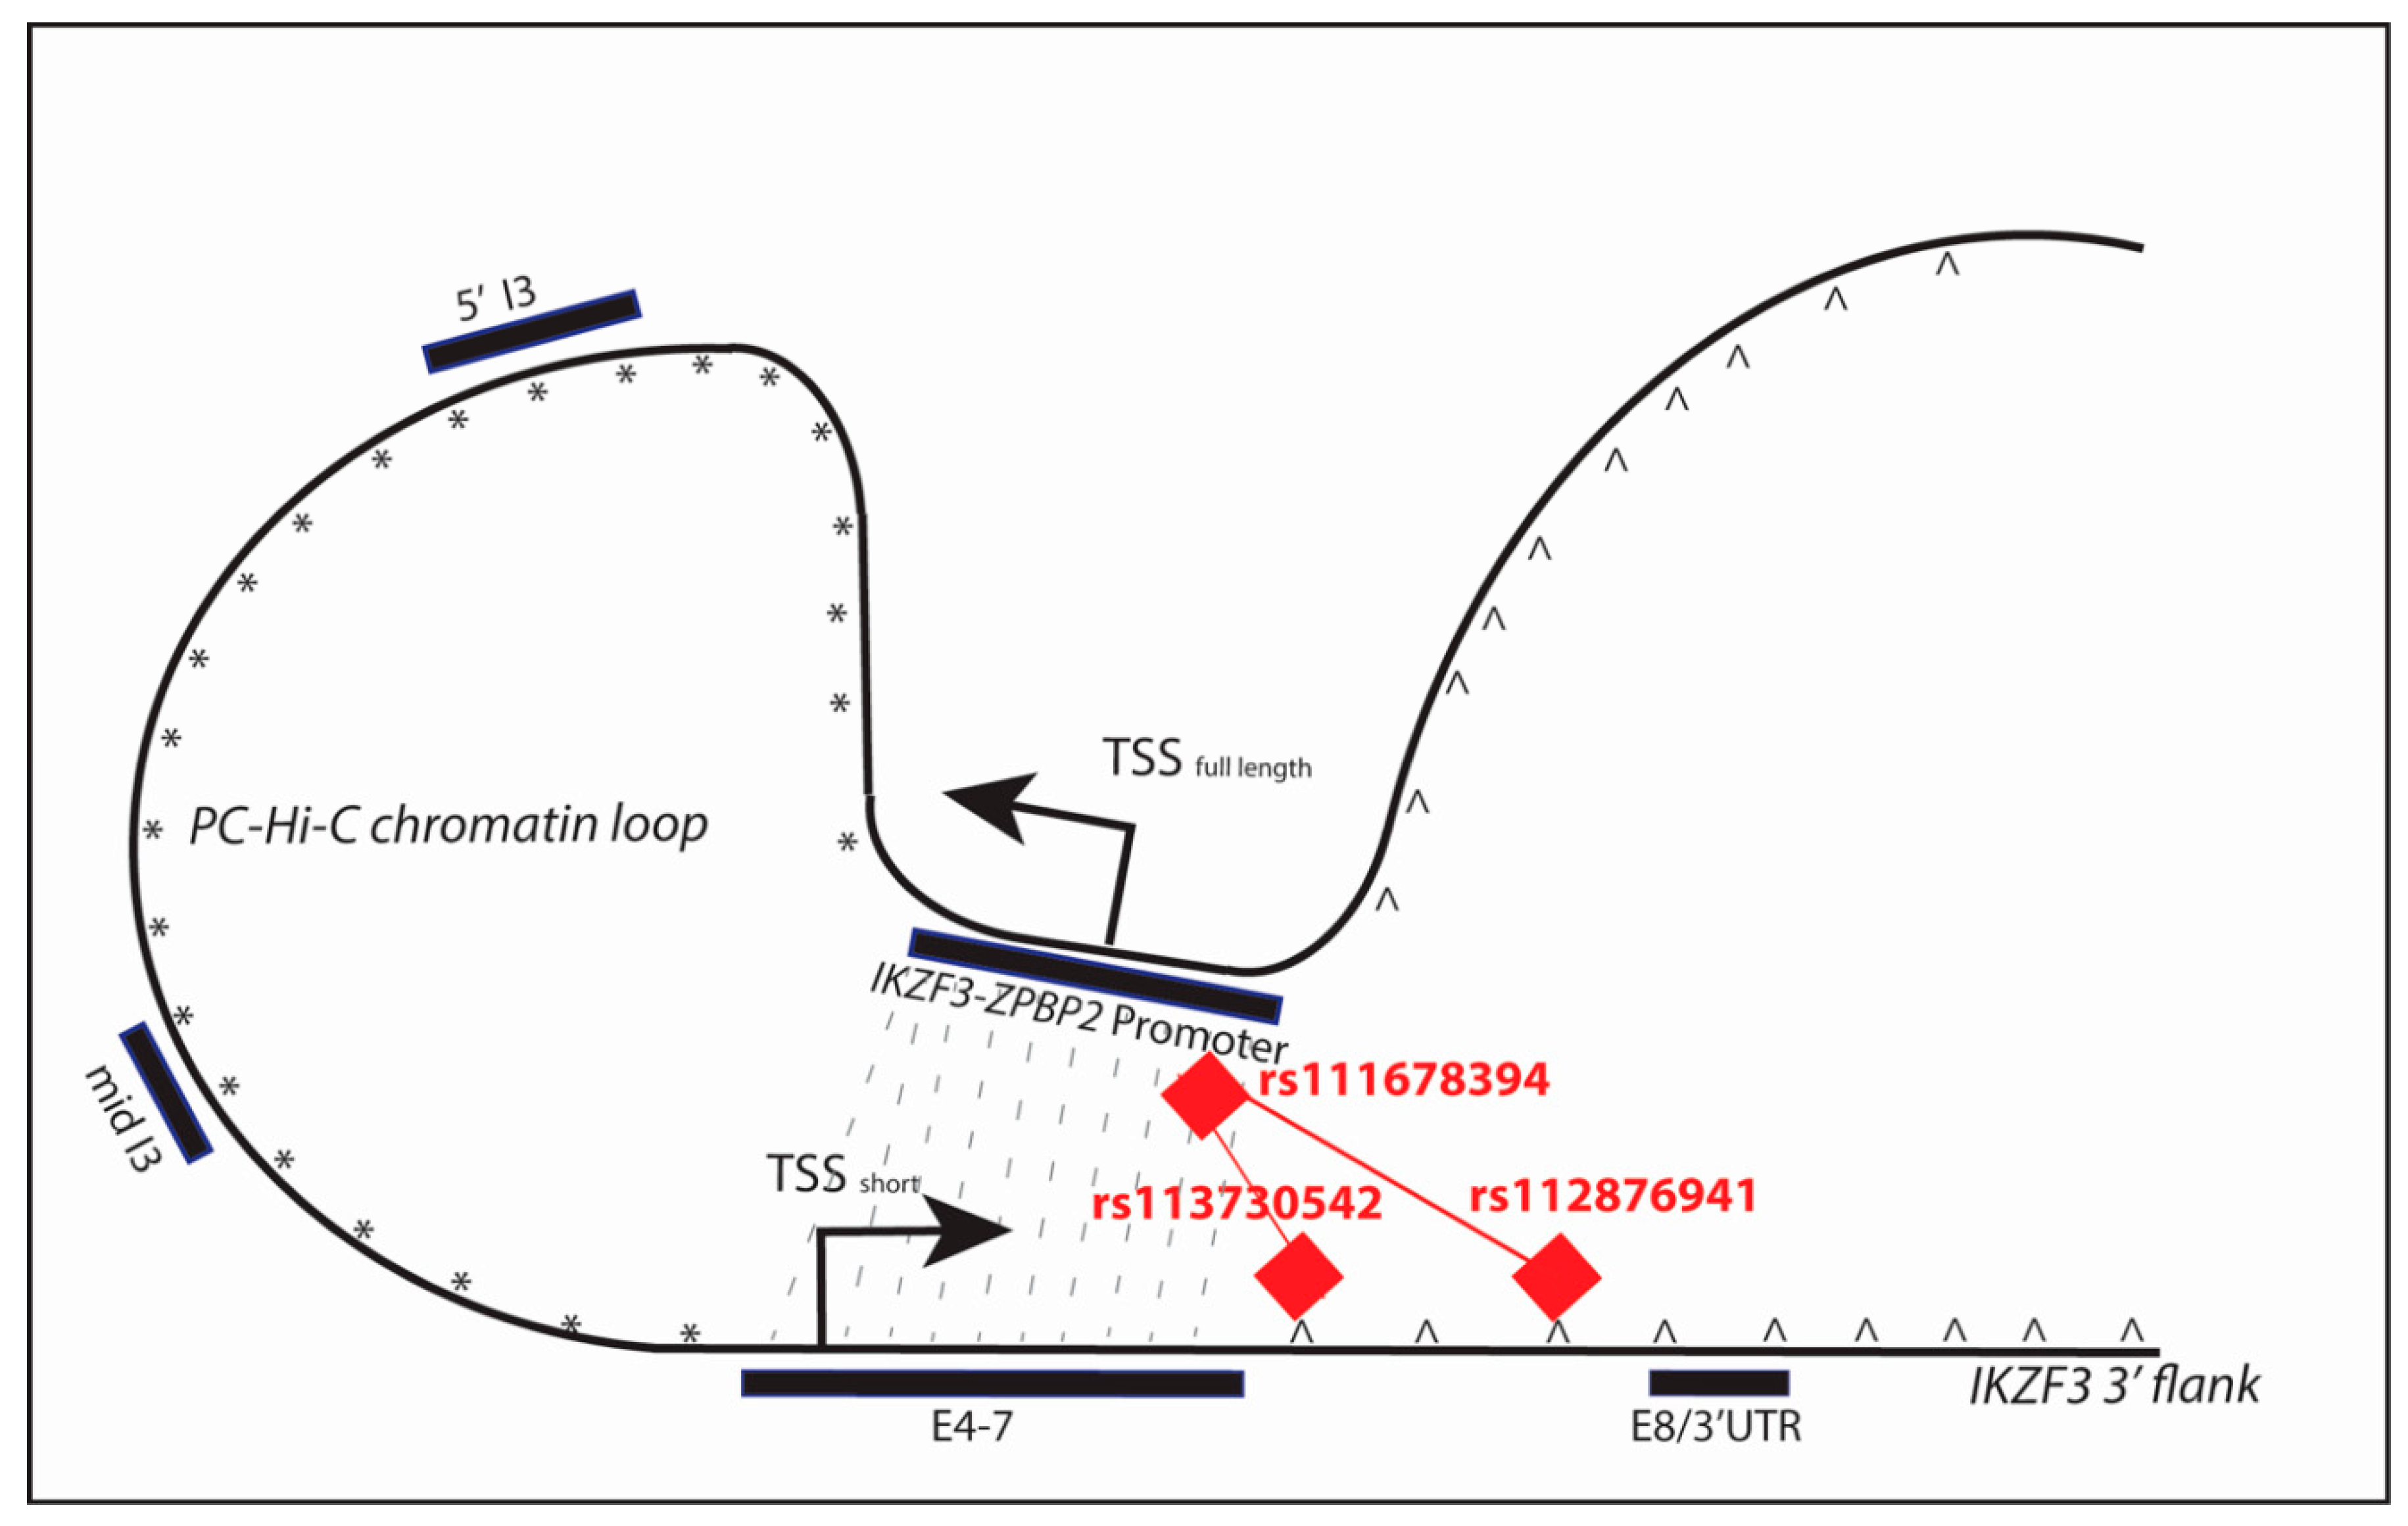
2.7.2. Determination of Chromatin Looping at IKZF3

Using the data from the PC Hi-C database, we identified chromatin looping events between the IKZF3-ZPBP2 bi-directional promoter region (chr17:38018444-38027003) and three separate segments within the coding region of the gene: (5′ I3) chr17:37965773-37976506; (mid I3) chr17:37958027-37963133 in intron 3 and (3′ E4-7) (chr17:37932293-37957717 (Figure 3 and Figure 6).
The strongest interactions were between the IKZF3-ZPBP2 promoter and the most 3′ interaction fragment (3′ E4-7) were in naïve CD4+ T cells, total CD4+ T cells, activated total CD4+ T cells, non-activated total CD4+ T cells, naïve CD8+ T cells, total CD8+ T cells, naïve B cells and total B cells (tB) (CHICAGO interaction score > 5.5) (Figure A2B). This 3′ E4-7 interaction region contains the four DNA binding zinc fingers (ZnF 1–4) and the first ~8.4 kb, around the TSS, of a shorter IKZF3 isoform, implying the promoter-gene interaction may affect the expression of these two functional regions of the locus. Interactions of the promoter with all three coding fragments are greatest in lymphocytes, which reflects the predominant lymphocyte expression pattern of IKZF3. However, the 3′ E4-7 interaction region does not contain the two dimerization Zinc Fingers (ZnF 5–6) (Figure 6). The lack of direct interaction between the promoter and dimerization domains means that the risk alleles in the promoter region may only have an indirect interaction with variants in the dimerization domains (in E8) [29,39].

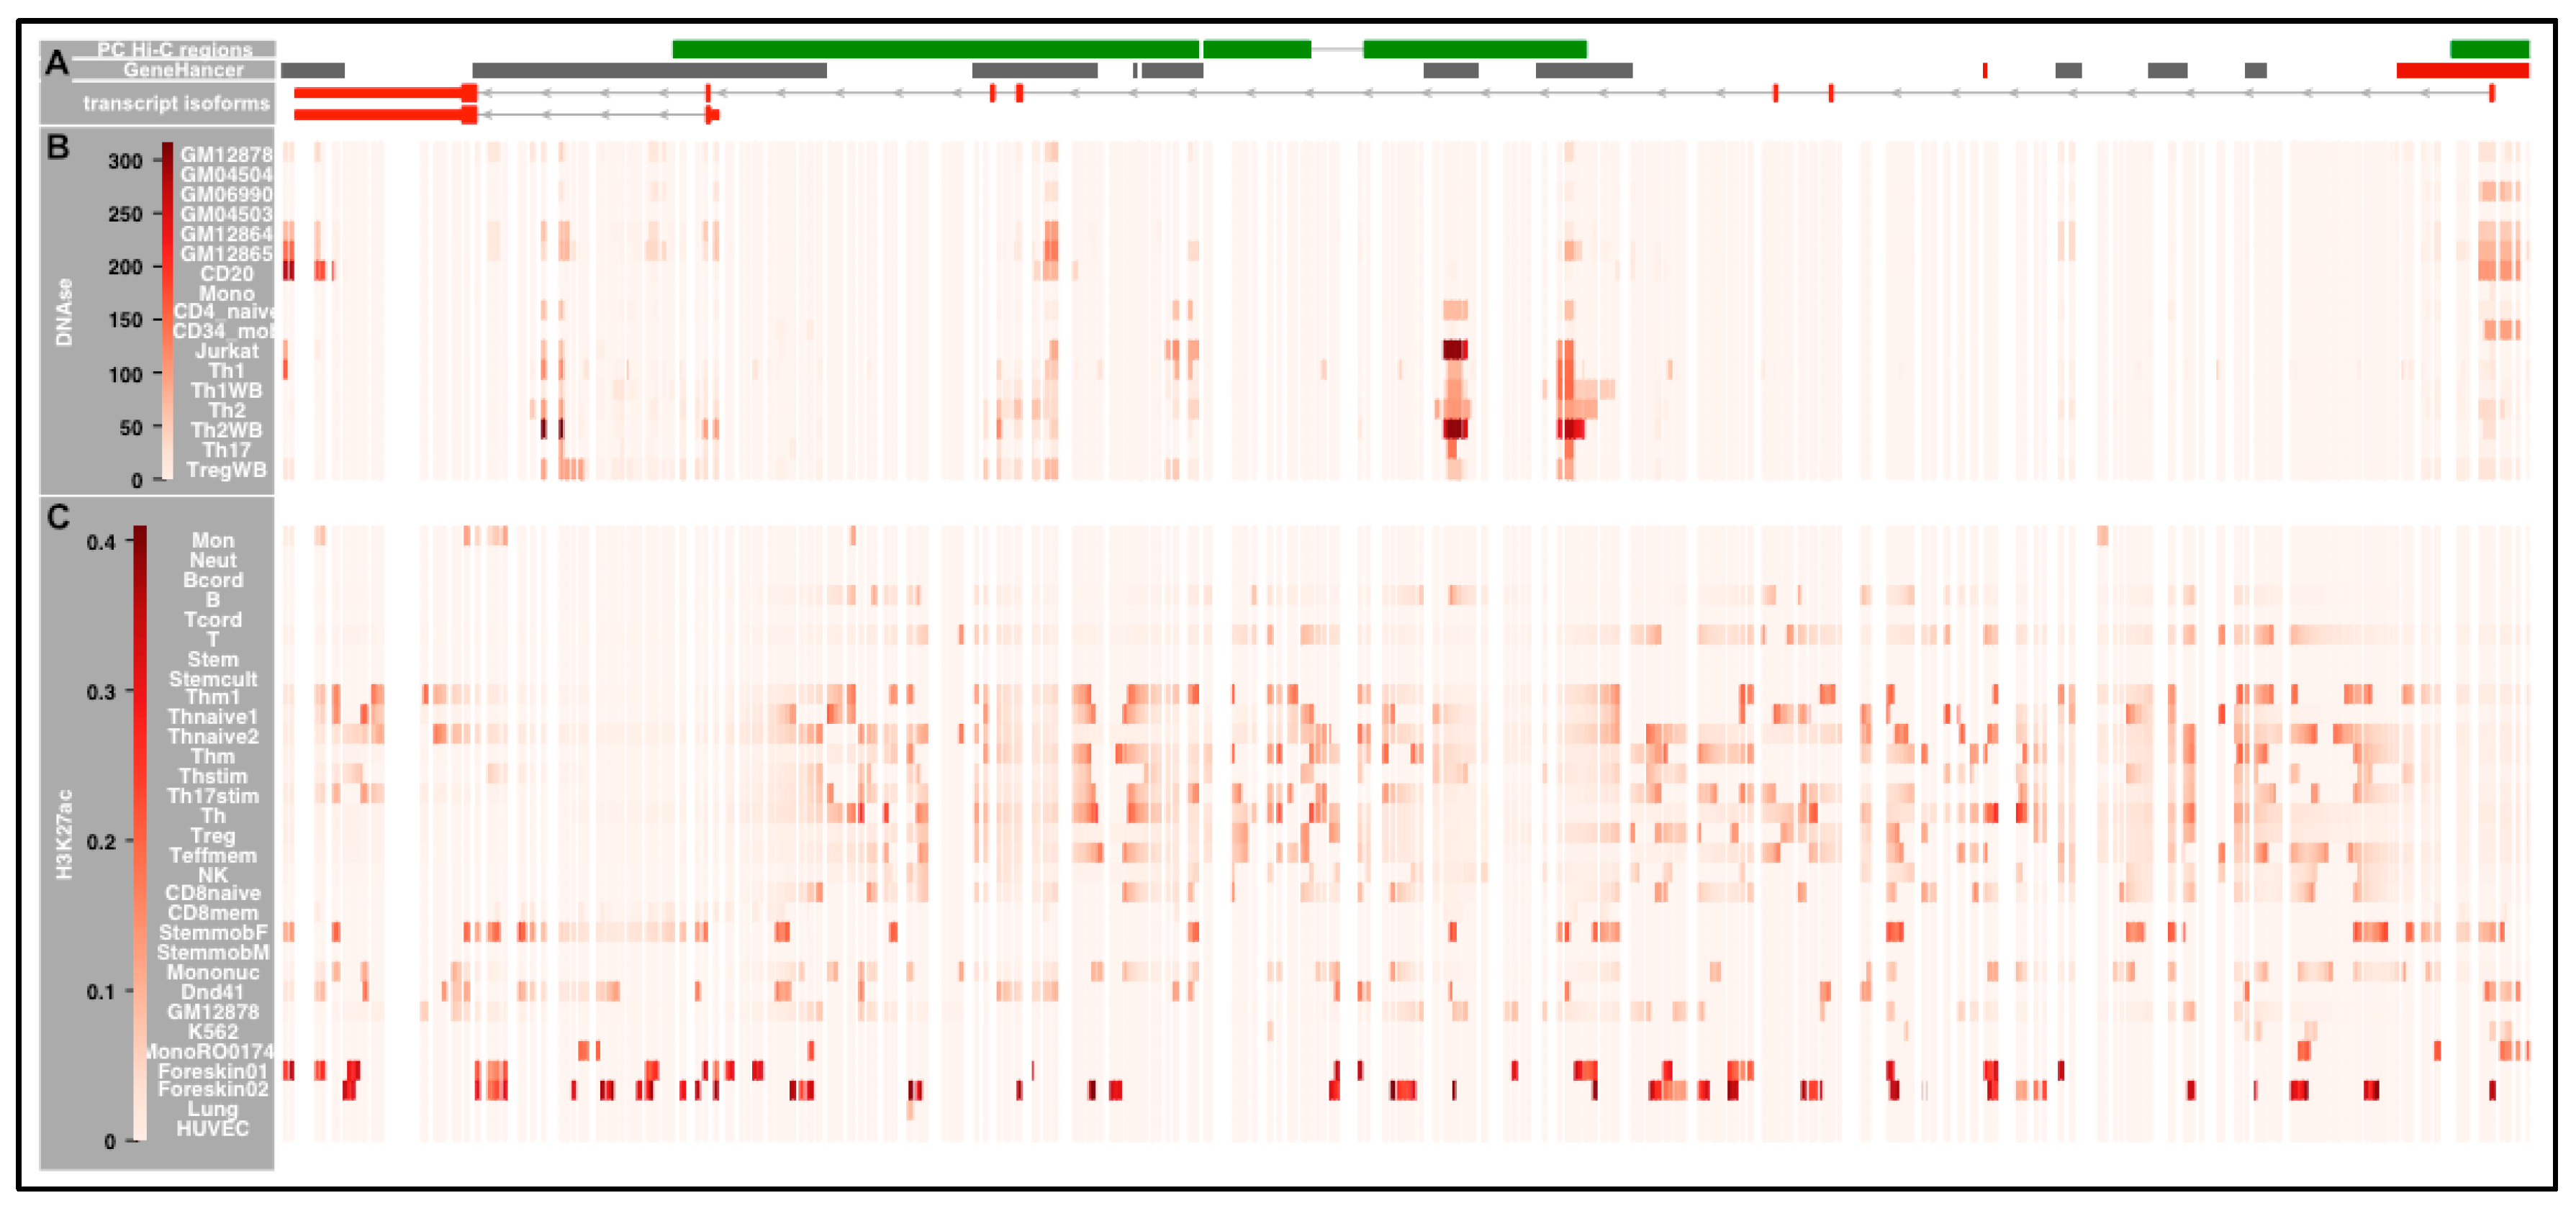
2.7.3. Accessibility of the Chromatin across IKZF3

Extracting the Combined Genome Segmentation data from ENCODE in LCLs, revealed that the entire IKZF3 risk haplotype is within regions of open chromatin (Figure 6). We also found that the Group 1 variants were preferentially enriched within the three PC Hi-C interaction regions (17 out of 27 SNPs) (Table A4), giving further evidence of potential biological function for these risk alleles. By contrast, although there are 12 GeneHancer regions across IKZF3, which contain 17 Group 1 variants, of the two GeneHancer (promoter) regions interacting at IKZF3 only one of these, the GH17J039859 primary promoter, contained risk alleles (Table A5).

2.7.4. Cell-Type Specificity in DNAse Sensitivity in the IKZF3 Interaction Regions

Figure 7 illustrates the enrichment of DNAseI hotspots at the DNA interaction regions across the whole of IKZF3 from the PC Hi-C or GeneHancer datasets.
The hotspot signal for individual Group 1 risk alleles mirrors the locus-wide signal so that we can see signal enrichment (SignalValue > 2.5) in 14 Group 1 variants spread across the entire risk haplotype (Figure A4B). The most convincing DNAseI hotspots (SignalValue > 5) were seen at Group 1 SNPs predominantly residing within the promoter (IKZF3-ZPBP2) and the 5′ I3 regions (PC Hi-C experiments). In terms of cell type specificity, the hotspots in B cells are restricted to the promoter region but there is enhanced enrichment of hotspots seen in T cell types within the coding region, including at rs113370572 within the E4-7 interaction fragment. We therefore established that 26 of the Group 1 SNPs were in regions of open chromatin in lymphoblastoid cell lines LCLs (Figure 6) and that there is a degree of cell-type specificity of DNAse1 HS (Figure A4B).
For each allele of the tag-SNPs on the core associated haplotypes for IKZF1 and IKZF3, we extracted the predicted allele-specific differences in binding affinity of transcription factor (taken from the ENCODE TF Binding experiments) from Haploreg v4.1. These differences were calculated as the change in log-odds (LOD) score between the Ref and Alt alleles for each tag-SNP—using Position Weight Matrices (PWM) for any TF binding motifs overlapping a 29 bp region around each risk allele, which reached a stringency (threshold of p  <  4−8) for either the Ref or Alt allele [30].

2.7.5. Discovery of Allele-Specific Transcription Factor Binding Sites

We extracted the allele-specific differences in TF binding affinity predicted at each of the Group 1 SNPs from the Haploreg database. These results revealed that 18 Group 1 variants exhibited allele-specific differences in binding affinity for one or more of the transcription factors from ENCODE (AS-TF) (Table 2). The table shows the relative strength of this allele-specific binding (using a between cut-off of log-odds >2) for the minor risk (Alt) allele compared with the non-risk (Ref) allele. Ten of these 18 variants lie within one of the four interaction regions described for IKZF3 from the PC Hi-C data.
We also found that variants within the IKZF3-ZPBP2 bi-directional promoter (chr17:38,020,431-38,024,500) share TF binding sites with the Group 1 risk alleles within the coding region of IKZF3 (Table 2). Dimerization between these TFs may be a mechanism to stabilize chromatin looping events [40,41] across IKZF3 and the promoter region.
One example of how TF dimerization may be involved in reinforcing chromatin looping is for the Fox(o) family of transcription factors [42]. Figure 8 illustrates how potential dimerization between members of the Foxo family of TFs, which when bound to three IKZF3 risk alleles could stabilize chromatin looping across the locus. The IKZF3-ZPBP2 promoter polymorphism rs111678394 (Foxi1/Foxo_1) can interact with two variants in intron 7: rs113730542 (Fox) (Table A6) and/or rs112876941 (Foxo_2) via Fox family dimerization (Table 2 and Table A7).

2.7.6. IKZF3 Risk Alleles Lie within a SuperEnhancer in B Cells

Figure A6 categorizes the SNP-by-SNP functional annotations across IKZF3, revealing that only four variants rs111678394, rs112412105, rs75148376 and rs113370572 lie with a PC Hi-C interaction, a DNAse HS and exhibit a predicted allele-specific TF binding. The variants lie within an interval of just 87.6 kb (chr17: 38,021,116-37,933,467). However, we also know that the entire IKZF3 region has been identified as a SuperEnhancer in B lymphocytes [43] (Figure A3), which complicates the prioritization of individual variants as having greater functional relevance than others. Some of the additional epigenetic modifications which characterize this SuperEnhancer/core risk haplotype are illustrated in Figure 9. The region is bounded by CTCF binding sites, demonstrating that there is a TAD (topologically associated domain) within IKZF3 (Figure 9C). We also found multiple EP300 binding sites across the locus, which are also commonly seen in enhancer regions. There are several epigenetic modifications across the entire locus found in EBV-LCLs which characterize: active enhancers (H3K27ac); active regulatory elements/promoters (H3K9ac); promoter/TSS (H3K4me3) or are located in the gene body of CpG genes with higher expression (H3K4me1 and H3K4me2) (Figure 9D).

3. Discussion

There is clear evidence from large scale SLE GWAS studies that three members of the Ikaros family of transcription factors (TF) are associated with lupus across multiple ancestries. The Ikaros transcription factors are important regulators of multiple immune cell types but in each case, the risk alleles tag an extended risk haplotype, so the identity of the causal risk alleles is unknown. Identifying these causal risk alleles will be an important step forward in understanding how genetics may alter the function of IKZF1 and IKZF3 in SLE.
Since three members of the same family show evidence of association for the same disease, it provides a convincing argument that these TFs play an important role in disease pathogenesis and indeed builds the case for a comprehensive analysis of the association signals in order to define the causal risk alleles at each locus. We therefore used a multi-omic strategy to build up a picture of the genetic, epigenetic and functional annotation across the associated loci, to pin-point the risk alleles which are likely to make the strongest contribution to the genetic-dysregulation of IKZF1 and IKZF3. At each locus we identified a set of risk alleles across multiple ancestries which are located within regions of open chromatin, are predicted to show differences allele-specific TF binding affinity, be part of regions displaying chromatin looping and show chromatin modification characteristic of the presence of a SuperEnhancer.
Given the differences in the prevalence and severity of SLE between different ancestries [32], our strategy was to take advantage of the minor allele frequency differences for risk alleles between ancestries to track down the causal risk alleles at IKZF1 and IKZF3. Through a combination of aligning tag SNPs on European risk haplotypes with the corresponding alleles in non-Europeans and subsequent fine-mapping using the multi-ancestral SLE ImmunoChip dataset, we identified the core risk haplotypes at both loci. At IKZF1 we successfully reduced the core risk haplotype by ~37% down to 37.7 kb, located 38.5 kb upstream of the transcriptional start site and which includes just 12 tag-SNPs variants for functional annotation, by excluding 174 associated variants.
At IKZF3, after haplotype alignments between ancestries, we were still left with 93 tag SNPs over 101 kb in the core risk haplotype. Therefore, the nature of the fine-mapping and subsequent functional annotation was more demanding at this locus. It was therefore necessary to incorporate a trans-ancestral exclusion mapping process to exclude tag SNPs from functional annotation based on their MAF and OR. We did this using the African American samples from the SLE multi-ancestry ImmunoChip, because there is no published SLE GWAS in African American samples. This exclusion strategy was based on the assumption that since SLE is more common in samples of African origin, it was reasonable to assume that European tag-SNPs (MAFEA = 3%), would be more common and exhibit stronger association in SLE cases of African origin. Using this approach, we excluded a total of 66 SNPs (from the 93 tag SNPs) which exhibited MAFAA > MAFEA with MAF > 3%ORAA < OREA, leaving just 27 SNPs over 101 kb for functional annotation.
Therefore, in this manuscript, we set out to discover which of the risk variants at IKZF1 and IKZF3 were candidate causal risk alleles for SLE or other immune-related disease. Our results revealed that neither set of risk alleles were cis-eQTLs, nor caused amino acid changes in the Ikaros (encoded by IKZF1) or Aiolos (encoded by IKZF3) proteins. Consequently, we went on to investigate whether the risk alleles acted via epigenetic mechanisms, such as DNA methylation and DNA hypersensitivity, both of which can influence TF binding and chromatin looping.
Although the utility of DNA methylation in unravelling epigenetic mechanisms is immense, there are only two studies of this heritable, cell-type specific mark in SLE samples, both of which utilized probe-based rather than sequencing-based platforms. The first study revealed significant hypomethylation (correlated with increased gene transcription) at IKZF3 in CD4+ T cells but not at IKZF1 [44]. There was no ancestry specific analysis published on this dataset, which may be due to the moderate sample size of each cohort. The second study in Danish SLE samples revealed no evidence of hypermethylation (corresponding to down-regulated gene expression) at IKZF1 or IKZF3 in B cells, T cells, monocytes or granulocytes [45]. Determination of a detailed allele-specific methylation map across IKZF1 and IKZF3 which takes into account trans-ancestral differences in allele frequencies in SLE awaits sequence-based methylation study in immune cell types from SLE samples of different ancestries during flare and during more quiescent disease.
The data in this manuscript suggest that by far the biggest epigenetic determinant of cell-specific differences in gene regulation at IKZF1 and IKZF3 come from measurements of DNAse hypersensitivity. Hotspots delineating regions of open chromatin work provide a permissive landscape to allow allele specific TF binding and chromatin looping. All three types of event contribute to an accessible scaffold for post translational modification of chromatin tails, such as acetylation of lysine 27 on histone 3 (H3K27ac), which delineate enhancer elements.
There is widespread open chromatin in multiple cell types across the risk haplotypes for IKZF1 in T cell types and in a more diverse set of immune cell types across IKZF3 (Figure 2 and Figure 3). This made it impossible to prioritize specific risk alleles as being more functionally significant. Similarly, it was not possible to prioritize specific risk alleles which were colocalized with sites of preferential marking by H3K27ac. This is in line with a previous report, which indicated that both IKZF1 and IKZF3 contain SuperEnhancers (SE) for multiple immune cell types [43] (Figure A3). These SE groups of enhancers, usually found at master transcription factors, which control the identity of a given cell types. Finally, the chromatin looping observed at IKZF1 and IKZF3 bring the risk alleles within the enhancers into closer proximity to promoter elements and make the DNA backbone more accessible to large numbers of additional TFs which characterize SuperEnhancers.
In summary, through a process of layered functional annotation at, using publicly available resources, we have found that the core SLE risk alleles at IKZF1 and IKZF3 are part of “functionally active DNA,” within SuperEnhancers. Taken together, these results suggest that the IKZF1 and IKZF3 risk alleles may contribute to the genetic dysregulation of the SuperEnhancers and the consequential dysregulation in the function of immune cell types. However, we accept that confirmation of these findings requires detailed “wet lab” experimentation, which is outside the remit of this current manuscript.

4. Materials and Methods

4.1. Datasets

We used 1000-Genome imputed GWAS data from the European GWAS [12] and the two Chinese GWAS [7,31]. The entire 1000-Genome imputed SLE ImmunoChip data from Europeans (ncases = 6748, ncontrols = 11,516) and African Americans (AA) (ncases = 2970, ncontrols = 2452) was available through collaboration [33]. The 1000 Genomes data for the five super-populations was downloaded from the 1000 Genomes website via Ensembl. All the genetic data were aligned using the UCSC hg19 build.

4.2. Haplotype Analysis of the Genetic Datasets

Haplotypes were derived in each dataset, using the Solid-Spine algorithm in Haploview, (HWE cut off of 0.0001 and minor allele frequency cut off of 0.01) [46]. Visual inspection of overlapping haplotype blocks in the European SLE GWAS was used to identify continuous risk haplotypes across IKZF1 and IKZF3, using an inter-block D′ score of > 0.75 and to select sets of tag SNPs. The European risk alleles and haplotypes were used as a template to align the haplotypes from the other datasets and to track the presence of the European risk haplotype in these populations. The core risk haplotypes were defined by minimal alignment of the haplotype blocks from each dataset.

4.3. Trans-Ancestral Meta-Analysis

Trans-ancestral meta-analysis was undertaken using PLINK with the default settings for combining two datasets using a random effect and a fixed effects model [47]. A test of heterogeneity was used to confirm that the datasets were homogenous using a p value cut off of >0.01.

4.4. Trans-Ancestral Exclusion Mapping

Trans-ancestral exclusion mapping was carried out at IKZF3 using the EUR (ncases = 6748, ncontrols = 11,516) and AA (ncases = 2970, ncontrols = 2452) samples from the SLE ImmunoChip dataset and the EUR and AFR samples from the 1000 Genomes data. Variants were included in the analysis if >75% individuals were typed in each study. The SNPs were aligned by genomic position across all four studies, recording minor allele frequency (MAF) and/or association p value/OR for each variant. SNPs were grouped by the differences in MAF between EA/EUR and AA/AFR samples, taking into account the association p value where available. A set of European risk alleles which were most likely to tag the causal alleles at IKZF3 in Europeans were defined as being absent/very rare (MAF < 0.01) in Africans.

4.5. Functional Annotation of Risk Alleles

The H3K27ac epigenetic data for the core association intervals and flanking regions (<10kb) was downloaded from the RoadMap Consortium in a total of 27 blood cell-types together with three fibroblast cell-types and a lung endothelial cell-type for use as a control. The epigenetic data contained the consolidated imputed epigenetic data based on the p value signals from each of the individual epigenetic marks in each of the cell-types. We used the UCSC genome browser (hg19) to subset each epigenetic track for the required intervals and then exported the signal data via Galaxy [48]. Where the SNPs of interest were <10 bp away from the edge of the 25-bp epigenetic interval containing it, we averaged the enrichment from two adjacent intervals. The Signal Values for the DNAse I Hotspot data from ENCODE/Washington were downloaded for each of the risk alleles at IKZF1 and IKZF3 using UCSC/Galaxy. We accessed the PC Hi-C data across IKZF1 and IKZF3 in immune cell types from the 3D Genome Browser [39,49]. The Combined Genome Segmentation data from ENCODE in EBV-LCLs was extracted from the UCSC Genome Browser [50]. We used the R package haploR to extract cis-eQTL data for risk alleles across IKZF1 and IKZF3 from Haploreg [30,51] and accessed conditional cis-eQTLs across both genes from the NESDR NTR conditional eQTL database [38]. We exported the enhancers intervals inferred across IKZF1 and IKZF3 from the GeneHancer database [35].

4.6. Allele-Specific Transcription Factor Binding

For each allele of the tag-SNPs on the core associated haplotypes for IKZF1 and IKZF3, we extracted the predicted allele-specific differences in binding affinity of transcription factor from Haploreg v4.1 using haploR [51]. These differences were calculated as the change in log-odds (LOD) score between the Ref and Alt alleles for each tag-SNP—using Position Weight Matrices (PWM) for any TF binding motifs overlapping a 29 bp region around each risk allele, which reached a stringency (threshold of P  <  4−8) for either the Ref or Alt allele [30].

4.7. Visualisation of Genomic Data

We visualized the epigenetic and genomic data within the UCSC genome browser or using the Gviz package from Bioconductor, within R [52].

Author Contributions

T.J.V. reviewed and edited the manuscript, was involved in the conceptualisation of the project and the acquisition of funding and provided critical review; D.S.C.G. wrote and revised the manuscript, undertook the formal bioinformatics analysis; acquired the financial support for the project leading to this publication. All authors have read and agreed to the published version of the manuscript.

Funding

Versus Arthritis (grants 20580, 20265, 20332).

Acknowledgments

We would like to express our appreciation to all the patients who have given samples to make this research possible. We thank David Morris for useful discussions regarding the SLE association data. We gratefully acknowledge the Alliance for Lupus Research for funding and support for the SLE ImmunoChip study and to Rob Graham (Genentech Inc.) for additional funding for genotyping for part of the SLE ImmunoChip cohort. Thanks to Carl Langefeld and all the other authors and contributors for the collaboration on the SLE ImmunoChip data. Thank you also to Phil Tombleson for his work on the data administration as part of the National Institute for Health Research Biomedical Research Centre (NIHR BRC) at Guy’s and St Thomas’ NHS Foundation and King’s College London.

Conflicts of Interest

The authors declare no conflict of interest.

Abbreviations

Tag-SNPsSingle nucleotide polymorphism tagging a haplotype
SLE GWASGenome-Wide association study in Systemic Lupus Erythematosus
ASTFAllele-Specific transcription factor binding site
eQTLExpression quantitative trait locus
GWASGenome-Wide association study
MAFMinor allele frequency
PC Hi-CPromoter Capture Hi-C
SLESystemic Lupus Erythematosus
TFTranscription factor

Appendix A

Figure A1. Trans-ancestral fine-mapping of the IKZF1 risk haplotype. The diagram illustrates the power of trans-ancestral fine mapping at IKZF1. Panel A: Illustrates the associated SNPs in the 47 kb core risk haplotype following trans-ancestral alignment of the IKZF1 haplotypes. Each variant is in strong LD (r2 > 0.75) with rs4917014 (Pmeta < 5 × 10⁻⁸). Panel B: Position of the core risk haplotype in relation to the genomic architecture across IKZF1. Panels C and D: Datasets used for defining the core risk haplotype. Panel C: Location of 60 kb full “risk” haplotype in healthy controls from the European GWAS (EUR_GWAS) with that from two Chinese GWAS (ASN_GWAS)—comprising variants in strong LD (r2 > 0.75) with rs4917014. Panel D: Alignment of the “risk” haplotypes in healthy individuals from the five super-populations of the 1000G project comprising variants in strong LD (r2 > 0.75) with rs4917014: EUR_1000G (shown in red); AFR_1000G (show in blue); AMR_1000G (shown in green); SAS_1000G (shown in turquoise) and EAS_1000G (shown in purple). The dashed box delineates the 47 kb core share haplotype bounded by rs34767118 and rs876039 (chr7:50271064-50308811). Panel E: GeneHancer regulatory elements at IKZF1 from GeneCards—from left to right: GH07J050261 (chr7:50300992-50310765); GH07J050293 (chr7:50333047-50334464); GH07J050301 (chr7:50340632-50340761); GH07J050303 (chr7:50343395-50362927); GH07J050326 (chr7:50366368-50368325); GH07J050329 (chr7:50368690-50370631); GH07J050341 (chr7:50410631-50437890) and GH07J050392 (chr7:50459865-50466852). The Promoter/TSS interval is designated as a red box and the enhancer intervals as grey boxes. Panel F: Interaction regions at IKZF1 from Left to Right: Enhancer (Enh) (chr7:50305428-50311993); Transcriptional Start Site/Promoter (TSS) (chr7:50341186-50347256) and intron 3 (I3) (chr7:50411807-50412756) [29]. Panel G: Combined Genome Segmentation data from ENCODE in EBV-LCLs. All seven variants lying within the risk haplotype (bounded by a red box, lie within a region predicted to be an enhancer (orange).
Ijms 21 08383 g0a1
Figure A2. Chromatin looping at IKZF1 and IKZF3 in immune cell types. The figure shows the chromatin looping events at (A) IKZF1 and (B) IKZF3 in multiple immune cell types [29]. A CHICAGO score (soft-thresholded -log weighted p-values) of >5 represents a significance interaction between two intervals. At IKZF1, there was only one chromatin looping event between the Promoter (TSS) (chr7:50341186-50347256) and the Enhancer (chr7:50305428-50311993). At IKZF3, there are three interaction regions between the bi-directional promoter IKZF3-ZPBP2 (chr17:38018444-38027003) and the coding region of the gene (5′ I3) chr17:37965773-37976506; (mid I3) chr17:37958027-37963133 and (3′ E4-7) chr17:37932293-37957717. The immune cell types analyzed are: Monocytes (Mon); Macrophages M0 (Mac0); Macrophages M1 (Mac1); Macrophages M2 (Mac2); Neutrophils (Neu); Megakaryocytes (MK); Endothelial precursors (EP); Erythroblasts (Ery); Fetal thymus (FoeT); Naïve CD4+ T cells (nCD4); Total CD4+ T cells (tCD4); Activated total CD4+ T cells (aCD4); Non-activated total CD4+ T cells (naCD4); Naïve CD8+ T cells (nCD8); Total CD8+ T cells (tCD8); Naïve B cells (nB) and Total B cells (tB).
Ijms 21 08383 g0a2
Figure A3. Genomic Landscape of the SuperEnhancers at IKZF1 and IKZF3. The figure illustrates the genomic architecture around the SuperEnhancers at IKZF1 (chr7:50,289,782-50,486,079) (top panel) and IKZF3 (chr17:37,904,434-38,025,200) (hg19) (lower panel). For each locus: (a) shows the position of individual enhancer regions was extracted from (Hnisz et al. 2013) [40] for immune cell types and illustrated by black boxes in the following cell types: CD4pmem—CD4 primary Memory T cells; CD8mem—CD8 memory T cells; CD8naive—CD8 naïve T cells; CD8naive—CD8 naïve T cells; CD3T—CD3 T cells; CD8pT—CD8 primary T cells; CD14—CD14 cells; CD19—CD19 cells; CD4pmem—CD4 primary memory T cells; CD20—CD20 cells, CD56 cells; CND41—CND41 cells; GM12878—GM12878; Jurkat—Jurkat T cells; Spleen—Spleen; Thymus—Thymus; CD4pnaive—CD4 naïve primary T cells; CD4pnaive—CD4 naïve primary T cells; CD4+CD25-CD45RA—CD4+ CD25- CD45RA Naïve T cells; CD4+CD25-CD45RO—CD4+ CD25- CD45RO T cells, ThPMA—CD4+ CD25- Il17- PMA stimulated Th cells; Th17PMA—CD4+ CD25- Il17+ PMA stimulated Th17; CD4+CD225intCD127+mem—CD4+ CD225int CD127+ memory T cells; CD34+F—CD34+ fetal cells; CD34+A—CD34+ adult cells; CD34pRO01480—CD34 primary RO01480 cells; CD34pRO01536—CD34 primary RO01536 cells; CD34pRO01549—CD34 primary RO01549 cells; HUVEC—HUVEC. (b) The transcript isoforms of IKZF1 and IKZF3; (c) the GeneHancer regions; (d) The location of the CpG islands is illustrated using the CpG track from the UCSC genome browser in several vertebrate cell lines (PMID: 3656447) and (e) the H3K27Ac Mark (Often Found Near Active Regulatory Elements) from ENCODE in GM12878 cells.
Ijms 21 08383 g0a3
Figure A4. DNAse Hotspots across risk variants at IKZF1 and IKZF3 in immune cells. The figure displays the SignalValues of the DNA Hotspots for (A) the core risk variants at IKZF1 and (B) Group I variants at IKZF3, in the following immune cell types taken from ENCODE: CD20—CD20+ B cells (RO01778); CD14—Monocytes CD14+ RO01746; CD4—CD4+ T cells_Naive_Wb11970640, CD4+_ T cells Naive_Wb78495824; CD34—CD34+ Mobilized; LCL—EBV-LCL (GM12865, GM12864, GM06990, GM04504, GM04503); Jurkat—Jurkat cells; Th1—Th1, Th1_Wb54553204, Th1_Wb33676984; Th2—Th2, Th2_Wb54553204, Th2_Wb33676984; Th17—Th17 cells; T reg—Treg_ Wb83319432, Treg_Wb78495824. The location of the interaction regions from PC Hi-C is illustrated above the variants for IKZF1: Enhancer (Enh) (chr7:50305428-50311993) and IKZF3: Promoter (chr17:38018444-38027003) with the three interaction regions across the coding region chr17:37965773-37976506 (5′ I3); chr17:37958027-37963133 (mid I3) and chr17:37932293-37957717 (3′ E4-7).
Ijms 21 08383 g0a4
Figure A5. Trans-ancestral Fine-Mapping of IKZF3. All of the data in Panels AD are from a single alignment from the various studies analyzed in this manuscript. (A) shows the haplotype block structure across the IKZF3 locus constructed using 15,991 healthy individuals from a European SLE GWAS [12]. Block B represents the 194 kb region covering the ~3% risk haplotype, carrying the IKZF3 risk variant from the GWAS (rs2941509) (chr17:37879762-38074046). Blocks A and C are the adjacent haplotype blocks in which there are no associated variants. The SNPs delineating the break-down in LD between the haplotype blocks A and B and between B and C are shown (rs13874287-rs903506 and rs9303281-rs12601749 respectively). There is no LD between any of the SNPs in block A and any of the associated variants in block B (r2 < 0.02) and between any of the associated SNPs in block B compared to any variants in block C (r2 < 0.03). (B) Alignment of haplotypes across IKZF3 in the European (EUR—shown in red), African (AFR—shown in blue) and Amerindian (AMR—shown in green) super-populations from the 1000 Genomes project. The 107 kb LD block shared by all three super-populations which carries rs2941509 is bounded by two LD breakpoints (rs9909432-rs181345226 and rs111678394-rs142080647) (chr17:37916823-38023745). (C) The haplotype structure across IKZF3 is shown in the healthy controls from the SLE ImmunoChip dataset, comprising 11,516 European-American (EA), 2452 African-American (AA) and 2016 Hispanic-American (HA) samples. The 101 kb shared risk haplotype carrying rs2914509 is bounded by two LD breakpoints (rs9909432-rs181345226 and rs111678394-rs142080647) (chr17:37920146-38021117). (D) This panel shows the location of the protein coding genes across the locus, with arrows designating the direction of transcription.
Ijms 21 08383 g0a5
Figure A6. Functional Annotation of Group 1 Variants at IKZF3. The figure shows the functional annotation of Group 1 variants. All but three SNPs lie within the annotation categories: Interaction region—PC-Hi-C (CHICAGO score > 5); DNAse1 HS—DNAse1 hotspot in one or more immune cell types (SignalValue > 2.5) or AS-TF—Predicted Allele Specific binding of TF (-log10P value > 3). Variants in red, bold text also show enrichment for one or more epigenetic modification (-log10 p value > 10).
Ijms 21 08383 g0a6
Table A1. Association at IKZF1 in Trans-ancestral SLE ImmunoChip Study.
SNPPos (hg19)African American
2970 Cases, 2452 Controls
European
6748 Cases, 11,516 Controls
Hispanic
1872 Cases and 2016 Controls
p ValueORAA (CI)MAFAAp ValueOREA (CI)MAFEAp ValueORHisp (CI)MAFHisp
rs49170147:503058631.48 × 10−50.728 (0.631–0.841)0.09 (G)3.67 × 10−90.866 (0.826–0.909)0.32 (G)0.0210.897 (0.818–0.984)0.48 (T)
rs111856037:503068104.29 × 10−50.742 (0.643–0.856)0.09 (G)8.99 × 10−90.870 (0.829–0.912)0.32 (G)0.0210.898 (0.819–0.984)0.48 (C)
rs43854257:503073341.83 × 10−50.831 (0.771–0.897)0.49 (G)1.51 × 10−90.872 (0.832–0.914)0.32 (G)0.1480.934 (0.852–1.026)0.50 (A)
rs8760367:503077109.52 × 10−30.890 (0.815–0.972)0.25 (C)7.49 × 10−90.869 (0.829–0.912)0.32 (C)0.0530.913 (0.833–1.001)0.49 (T)
rs8760377:503086921.87 × 10−50.731 (0.633–0.844)0.09 (A)2.23 × 10−80.873 (0.832–0.915)0.31 (A)0.0200.897 (0.818–0.983)0.48 (T)
Table A2. Genomic Locations of Regulatory Elements at IKZF1 and IKZF3.
LocusElementNamePosition (hg19)
IKZF1PC Hi-C interaction regionsEnhancer (Enh)chr7:50305428-50311993
Transcriptional Start Site/Promoter (TSS)chr7:50341186-50347256
intron 3 (I3)chr7:50411807-50412756
GeneHancer regionsGH07J050261 chr7:50300992-50310765
GH07J050293 chr7:50333047-50334464
GH07J050301 chr7:50340632-50340761
GH07J050303 chr7:50343395-50362927
GH07J050326 chr7:50366368-50368325
GH07J050329 chr7:50368690-50370631
GH07J050341 chr7:50410631-50437890
GH07J050392 chr7:50459865-50466852
IKZF3PC Hi-C interaction regionsIKZF3-ZPBP2 bi-directional promoter chr17:38018444-38027003
5′ I3chr17:37965773-37976506
mid I3chr17:37958027-37963133
3′ E4-7chr17:37932293-37957717
GeneHancer regionsGH17J039753 chr17:37909296-37916397
GH17J039766 chr17:37922530-37939749
GH17J039790 chr17:37946728-37952847
GH17J039799 chr17:37954622-37954701
GH17J039798 chr17:37954998-37957986
GH17J039812 chr17:37968642-37971311
GH17J039817 chr17:37974070-37978821
GH17J039839 chr17:37995815-37995875
GH17J039842 chr17:37999223-38000547
GH17J039847 chr17:38003768-38005630
Table A3. Allele-Specific Binding of Transcription Factors to IKZF1 Risk Alleles.
OrderRisk SNPPos
(hg19)
TF Showing Allele-Specific Binding (ASTF)StrandRefAltAlt-Ref Enrichment
1rs3476711850271064Sox_5+12.511.4−1.1
VDR_1+−8.13.912
Zbtb12+11.814.42.6
2rs1177376350271499CDP_4-12.613.20.6
Fox-13.32.5−10.8
Foxd1_1-4.52.5−2
Foxi1-13.111.9−1.2
Foxj1_2-14.213.9−0.3
Foxj2_1-12.112−0.1
Gm397-6.610.74.1
Pou3f2_2+−9.42.612
Zfp105+10.8110.2
p53_1+−25.8−27.5−1.7
3rs6244535050278187none 0
4rs6244535250289504Arid3a_2-8.410.92.5
Barx2-10.511.91.4
Cdx2_2-10.611.20.6
Dbx1-8.710.61.9
Dbx2+8.811.52.7
Dlx3-12.110−2.1
Evi-1_4+415.511.5
HNF1_1-12.710.7−2
HNF1_6-13.811.2−2.6
HNF1_7+11.710.2−1.5
Hoxa10-1112.81.8
Hoxa3_2-13.913.1−0.8
Hoxa5_3-11.610.2−1.4
Hoxa7_2-1112.51.5
Hoxb4-11.212.41.2
Hoxc6-12.1130.9
Hoxc9-12.212.70.5
Hoxd8+12.916.13.2
Msx-1_2-10.713.22.5
Ncx_2-11.415.13.7
Nkx6-1_2-9.914.84.9
Nkx6-1_3-9.714.95.2
Nkx6-2-11.612.61
Pax-4_2-11.28.1−3.1
Pou2f2_known4+12.813.30.5
Pou3f4-611.75.7
Pou4f3-9.115.16
Pou5f1_known1+11.64.7−6.9
Prrx1+1110.4−0.6
5rs5593538250289669SRF_known5+−0.81111.8
6rs1118560250299077Cart1+15.211.7−3.5
Cdx+9.612.12.5
HNF1_2-6.211.35.1
Lhx3_2+10.73−7.7
PLZF+13.213−0.2
Pou2f2_known2+12.88.4−4.4
Pou2f2_known9+7.4−4.5−11.9
Pou6f1_1-10.213.93.7
7rs4917014 *50305863Nkx2_2+10.9121.1
8rs11185603 *50306810CCNT2_disc2+12.57.1−5.4
ELF1_known1-132−11
Nkx2_2-11.910.3−1.6
PU.1_disc3-12.30.4−11.9
RXRA_disc4+12.81.7−11.1
TATA_disc7-13.67.3−6.3
9rs4385425 *50307334none 0
10rs876036 *50307710ERalpha-a_disc4+0.210.710.5
LXR_3-11.37.4−3.9
RXRA_known4+10.4−0.2−10.6
VDR_2+12.44.6−7.8
VDR_3+12.28.3−3.9
11rs876038 *50308527BDP1_disc1-2.72.1−0.6
Brachyury_1-−2.4−5.6−3.2
XBP-1_1+12.20.2−12
12rs876037 *50308527none 0
13rs876039 *50308811Foxa_known2-11.512.61.1
Foxa_known3-12.713.30.6
* SLE risk variants lying within the IKZF1 GeneHancer enhancer (GH07J050261).
Table A4. Meta-Analysis of EA Tagging SNPs across IKZF3 in ImmunoChip data from European and African Ancestries.
#GrouprsChrPos
(hg19)
A1/A2ImmunoChip Association DataMeta-Analysis
MAFEAPEAOREAMAFEAPAAORAAsP(R)OROR(R)QI
11rs1116783941738021116C/G0.0352.50 × 10−61.29
(1.16–1.44)
0.0050.0421.656
(1.01–2.71)
5.29 × 10−75.29 × 10−71.311.310.3350
21rs1172787021738020420A/G0.0321.13 × 10−51.28
(1.15–1.44)
0.0040.1361.50
(0.877–2.55)
4.38 × 10−64.38 × 10−61.301.300.5880
32rs99058811738018954A/G0.0364.44 × 10−61.28
(1.15–1.43)
0.2560.0041.13
(1.04–1.24)
3.16 × 10−70.0031.191.200.07967.8
42rs98993361738017779T/C0.0363.60 × 10−61.28
(1.16–1.43)
0.2560.0051.13
(1.04–1.23)
3.50 × 10−70.0041.191.200.06670.5
52rs98990061738017064A/T0.0421.28 × 10−51.25
(1.13–1.38)
0.2570.0051.13
(1.04–1.23)
7.23 × 10−70.0011.181.180.13754.8
61rs779243381738016356T/C0.0352.50 × 10−61.29
(1.16–1.44)
0.0050.0421.66
(1.01–2.71)
5.29 × 10−75.29 × 10−71.311.310.3350
72rs99157971738014867A/G0.0362.75 × 10−61.29
(1.16–1.44)
0.2560.0051.13
(1.04–1.23)
3.40 × 10−70.0051.191.200.05672.6
82rs169653671738014315C/T0.0363.99 × 10−61.28
(1.15–1.43)
0.2560.0051.13
(1.04–1.23)
3.68 × 10−70.0041.191.200.06969.9
92rs1134665461738012586A/G0.0362.10 × 10−61.29
(1.16–1.44)
0.1300.0261.13
(1.02–1.27)
7.90 × 10−70.0041.211.210.09065.2
102rs99072911738010036G/A0.0362.75 × 10−61.29
(1.16–1.44)
0.2570.0031.14
(1.05–1.24)
1.57 × 10−70.0031.201.210.07269.1
112rs80695311738009343T/A0.0363.24 × 10−61.29
(1.16–1.43)
0.2560.0051.13
(1.04–1.23)
3.36 × 10−70.0041.191.210.06470.9
122rs80688941738008999G/A0.0362.75 × 10−61.29
(1.16–1.44)
0.2560.0051.13
(1.04–1.23)
2.87 × 10−70.0051.191.200.06071.9
131rs1132337201738008190T/C0.0352.50 × 10−61.29
(1.16–1.44)
0.0050.0421.66
(1.01–2.71)
5.29 × 10−75.29 × 10−71.311.310.3350
141rs1126770361738002152A/G0.0352.50 × 10−61.29
(1.16–1.44)
0.0050.0421.66
(1.01–2.71)
5.29 × 10−75.29 × 10−71.311.310.3350
152rs676008071738001558G/A0.0362.75 × 10−61.29
(1.16–1.44)
0.2620.0071.13
(1.03–1.22)
4.54 × 10−70.0081.191.200.04974.2
162rs99086941737997771T/C0.0362.90 × 10−61.29
(1.16–1.43)
0.2560.0051.13
(1.04–1.23)
2.95 × 10−70.0041.191.200.06171.6
172rs99005411737996070C/T0.0362.75 × 10−61.29
(1.16–1.44)
0.2560.0051.13
(1.04–1.23)
3.12 × 10−70.0051.191.200.05872.3
181rs1116919131737993238T/C0.0352.24 × 10−61.30
(1.16–1.44)
0.0050.0421.66
(1.01–2.71)
4.60 × 10−74.60 × 10−71.311.310.3380
192rs284496711737991630C/T0.0362.47 × 10−61.29
(1.16–1.44)
0.2560.0051.13
(1.036–1.23)
3.27 × 10−70.0061.191.200.05573.0
201rs1119449121737988476C/T0.0353.64 × 10−61.29
(1.16–1.43)
0.0050.0421.66
(1.01–2.71)
7.80 × 10−77.80 × 10−71.301.300.3260
212rs733041231737987588T/C0.0363.07 × 10−61.29
(1.16–1.43)
0.1280.0251.14
(1.02–1.27)
9.54 × 10−70.0031.211.210.10861.4
222rs1121414681737987464T/C0.0363.99 × 10−61.28
(1.15–1.43)
0.2590.0061.13
(1.04–1.23)
4.64 × 10−70.0051.191.200.06371.2
231rs1117345951737987399T/C0.0353.64 × 10−61.29
(1.16–1.43)
0.0050.0421.66
(1.01–2.71)
7.80 × 10−77.80 × 10−71.301.300.3260
241rs1134797721737987042A/G0.0353.64 × 10−61.29
(1.16–1.43)
0.0050.0421.66
(1.01–2.71)
7.80 × 10−77.80 × 10−71.301.300.3260
251rs1127975701737983751A/G0.0353.64 × 10−61.29
(1.16–1.43)
0.0050.0421.66
(1.01–2.71)
7.80 × 10−77.80 × 10−71.301.300.3260
261rs1124375081737983512A/G0.0353.09 × 10−61.29
(1.16–1.44)
0.0230.5641.07
(0.840–1.38)
6.90 × 10−60.0161.251.220.19041.7
272rs351300191737983141G/A0.0376.29 × 10−61.28
(1.15–1.42)
0.2550.0071.13
(1.03–1.23)
7.56 × 10−70.0041.181.190.07368.8
281rs1114695621737982696C/T0.0364.51 − 061.28
(1.15–1.43)
0.0050.0421.66
(1.01–2.71)
9.58 × 10−79.58 × 10−71.301.300.3210
292rs129426601737982037T/C0.0364.44 × 10−61.28
(1.15–1.43)
0.2520.0031.14
(1.04–1.24)
2.54 × 10−70.0021.191.200.08566.2
302rs80763471737977540T/G0.0363.78 × 10−61.28
(1.16–1.42)
0.2520.0031.14
(1.04–1.24)
2.29 × 10−70.0021.191.200.08167.1
312rs99089831737976926A/G0.0363.42 × 10−61.29
(1.16–1.43)
0.1240.0231.14
(1.02–1.27)
8.39 × 10−70.0021.211.210.12258.2
322rs99110691737976601C/T0.0363.07 × 10−61.29
(1.16–1.43)
0.1240.0231.14
(1.02–1.27)
7.99 × 10−70.0021.221.210.12058.7
332rs99019171737976205C/G0.0363.42 × 10−61.29
(1.16–1.43)
0.1240.0231.14
(1.02–1.27)
8.39 × 10−70.0021.211.210.12258.2
341rs1127431301737975855C/G0.0353.46 × 10−61.29
(1.16–1.43)
0.0050.0591.59
(0.979–2.58)
8.55 × 10−78.55 × 10−71.301.300.4060
352rs340533941737975660G/A0.0363.42 × 10−61.29
(1.16–1.43)
0.1240.0231.13
(1.02–1.27)
8.39 × 10−70.0021.211.210.12258.2
362rs580753751737975592T/C0.0363.42 × 10−61.287
(1.157–1.432)
0.1240.0231.14
(1.02–1.27)
8.39 × 10−70.0021.211.210.12258.2
372rs99026211737973010A/G0.0363.42 × 10−61.29
(1.16–1.43)
0.1240.0231.14
(1.02–1.27)
8.39 × 10−70.0021.211.210.12258.2
382rs98980311737972647G/C0.0366.45 × 10−61.28
(1.16–1.42)
0.1240.0231.14
(1.02–1.27)
1.38 × 10−60.0011.211.200.14752.4
391rs1124121051737971635G/A0.0364.06 × 10−61.29
(1.16–1.43)
0.0050.0591.59
(0.979–2.58)
9.57 × 10−79.57 × 10−71.301.300.4020
401rs1131153051737970686C/A0.0369.37 × 10−61.27
(1.14–1.42)
0.0050.0591.59
(0.979–2.58)
2.28 × 10−62.28 × 10−61.291.290.3800
411rs1122389001737968494T/C0.0364.06 × 10−61.29
(1.16–1.43)
0.0050.0591.59
(0.979–2.58)
9.57 × 10−79.57 × 10−71.301.300.4020
422rs671356461737967871G/C0.0365.47 × 10−61.28
(1.15–1.42)
0.2520.0041.13
(1.04–1.24)
4.03 × 10−70.0031.191.200.08266.9
432rs1147772821737967649A/C0.0365.47 × 10−61.28
(1.15–1.42)
0.2500.0051.13
(1.04–1.23)
4.48 × 10−70.0031.191.200.08067.3
442rs43373251737964435T/C0.0369.22 × 10−61.27
(1.14–1.41)
0.2500.0051.13
(1.04–1.23)
7.12 × 10−70.0021.181.190.09564.2
452rs99016171737964175C/G0.0364.24 × 10−61.284
(1.15–1.43)
0.1250.0271.13
(1.01–1.27)
1.27 × 10−60.0021.211.210.11659.6
461rs1130648431737960421C/T0.0365.02 × 10−61.28
(1.15–1.43)
0.0050.0591.59
(0.979–2.58)
1.25 × 10−61.25 × 10−61.291.290.3950
472rs72119981737959788G/A0.0366.42 × 10−61.28
(1.15–1.42)
0.2350.0051.13
(1.04–1.23)
5.27 × 10−70.0021.191.200.08965.4
482rs360978411737958112A/G0.0366.08 × 10−61.28
(1.15–1.42)
0.2520.0021.14
(1.05–1.24)
2.69 × 10−70.0011.191.200.10162.8
492rs349885041737957631T/C0.0365.47 × 10−61.28
(1.15–1.42)
0.2520.0041.14
(1.04–1.24)
3.14 × 10−70.0021.191.200.08965.4
501rs169653471737957566C/G0.0301.24 × 10−51.29
(1.15–1.45)
0.0040.1541.52
(0.852–2.70)
5.12 × 10−65.12 × 10−61.301.300.5950
512rs129373301737957316A/C0.0366.02 × 10−61.28
(1.15–1.42)
0.2680.0091.12
(1.03–1.22)
1.33 × 10−60.0081.181.190.05672.7
522rs343444621737955193G/A0.0365.47 × 10−61.28
(1.15–1.42)
0.2520.0051.13
(1.04–1.23)
4.78 × 10−70.0031.191.200.07867.82
532rs98993451737954757A/G0.0352.37 × 10−51.26
(1.13–1.41)
0.2510.0041.13
(1.04–1.24)
1.17 × 10−60.0011.181.200.12557.4
541rs1133692931737952654T/C0.0364.51 × 10−61.28
(1.15–1.43)
0.0070.2871.27
(0.820–1.95)
2.63 × 10−62.63 × 10−61.281.280.9480
551rs751483761737952508T/C0.0364.51 × 10−61.28
(1.15–1.43)
0.0070.2871.27
(0.820–1.95)
2.63 × 10−62.63 × 10−61.281.280.9480
562rs733021521737952350C/G0.0366.84 × 10−61.28
(1.15–1.42)
0.1270.0591.11
(0.996–1.25)
5.54 × 10−60.0101.201.190.08167.1
572rs1131592271737952091A/G0.0363.81 × 10−61.29
(1.16–1.43)
0.1270.0631.11
(0.994–1.24)
4.04 × 10−60.0141.201.200.06570.7
582rs569289751737952031G/A0.0482.38 × 10−71.28
(1.16–1.40)
0.2500.0141.11
(1.02–1.22)
1.18 × 10−70.0111.191.190.03477.7
592rs129387491737951847T/C0.0363.81 × 10−61.29
(1.16–1.43)
0.1270.0631.11
(0.994–1.24)
4.04 × 10−60.0141.201.200.06470.7
602rs359381991737950812T/C0.0364.24 × 10−61.28
(1.15–1.43)
0.1270.0631.11
(0.994–1.24)
4.23 × 10−60.0141.201.200.06670.4
612rs351051101737950421A/G0.0363.24 × 10−61.29
(1.16–1.43)
0.1270.0631.11
(0.994–1.24)
3.63 × 10−60.0141.201.200.06271.3
622rs353520751737949790C/T0.0363.81 × 10−61.29
(1.16–1.43)
0.1270.0631.11
(0.994–1.24)
4.04 × 10−60.0141.201.200.06470.7
631rs1127716461737945708C/A0.0364.51 × 10−61.28
(1.15–1.43)
0.0070.2871.27
(0.820–1.95)
2.63 × 10−62.63 × 10−61.281.280.9500
641rs1123013221737944518G/C0.0364.51 × 10−61.28
(1.15–1.43)
0.0070.2871.27
(0.820–1.95)
2.63 × 10−62.63 × 10−61.281.280.9500
652rs350884691737944481T/C0.0362.21 × 10−61.29
(1.16–1.44)
0.1190.0961.10
(0.983–1.24)
4.27 × 10−60.0241.201.200.04874.4
662rs342912171737944410A/C0.0363.81 × 10−61.29
(1.16–1.43)
0.1270.0631.11
(0.994–1.24)
4.04 × 10−60.0141.201.200.06570.7
672rs99116881737943800T/C0.0364.71 × 10−61.28
(1.15–1.43)
0.1270.0601.11
(0.996–1.24)
4.20 × 10−60.0111.201.200.07369.0
682rs99116691737943766G/C0.0363.81 × 10−61.29
(1.16–1.43)
0.1270.0631.11
(0.994–1.24)
4.04 × 10−60.0141.201.200.06570.7
691rs1118626421737942983G/C0.0364.51 × 10−61.28
(1.15–1.43)
0.0070.2871.27
(0.820–1.95)
2.63 × 10−62.63 × 10−61.281.280.9450
702rs345995461737942971T/C0.0364.93 × 10−61.28
(1.15–1.42)
0.2550.0101.12
(1.03–1.22)
1.10 × 10−60.0081.181.190.05572.8
711rs1123453831737942017T/C0.0364.51 × 10−61.28
(1.15–1.43)
0.0070.2871.27
(0.82–1.95)
2.63 × 10−62.63 × 10−61.281.280.9500
722rs15104751737941379C/A0.0363.81 × 10−61.29
(1.16–1.43)
0.1270.0631.11
(0.994–1.24)
4.04 × 10−60.0141.201.200.06570.7
732rs1138124491737940167C/T0.0364.93 × 10−61.28
(1.15–1.42)
0.2550.0101.12
(1.03–1.22)
1.10 × 10−60.0081.181.200.05572.8
742rs99093651737939958G/A0.0364.93 × 10−61.28
(1.15–1.42)
0.2550.0101.12
(1.03–1.22)
1.10 × 10−60.0081.181.190.05572.76
752rs340169641737938976T/G0.0364.93 × 10−61.28
(1.15–1.42)
0.2550.0101.12
(1.03–1.22)
1.10 × 10−60.0081.181.190.05572.8
762rs676057031737938496C/T0.0364.24 × 10−61.28
(1.15–1.43)
0.1280.0781.11
(0.989–1.24)
5.78 × 10−60.0191.201.190.05772.5
772rs355065181737938093C/T0.0362.61 × 10−61.29
(1.16–1.44)
0.1270.0601.11
(0.996–1.24)
2.70 × 10−60.014041.201.200.06071.8
782rs133808711737936248C/T0.0363.78 × 10−61.28
(1.16–1.43)
0.2550.0201.11
(1.02–1.21)
2.39 × 10−60.0191.171.190.03477.6
792rs72246411737934910C/T0.0362.60 × 10−61.29
(1.16–1.44)
0.2550.0111.12
(1.03–1.22)
9.12 × 10−70.0131.181.200.03976.5
802rs127093641737933822G/A0.0362.22 × 10−61.29
(1.16–1.44)
0.1280.0791.11
(0.988–1.24)
3.83 × 10−60.0231.201.200.04674.9
811rs1133705721737933467C/T0.0352.94 × 10−61.29
(1.16–1.44)
0.0070.2871.27
(0.820–1.95)
1.78 × 10−61.78 × 10-61.291.290.9320
822rs99014831737932773A/T0.0362.60 × 10−61.29
(1.16–1.44)
0.2550.0111.12
(1.03–1.22)
9.12 × 10−70.0131.181.200.03976.5
832rs98948981737932220C/T0.0361.99 × 10−61.30
(1.16–1.44)
0.1270.0731.11
(0.991–1.24)
3.13 × 10−60.0211.201.200.04774.8
842rs99135961737932062A/G0.0361.99 × 10−61.30
(1.16–1.44)
0.1270.1221.09
(0.977–1.22)
6.92 × 10−60.0411.191.200.03178.6
852rs96528401737929427T/A0.0373.32 × 10−51.25
(1.13–1.39)
0.2010.0451.1
(1.00–1.21)
2.24 × 10−50.0151.161.170.07468.7
862rs713697881737927144A/G0.0363.42 × 10−61.29
(1.16–1.43)
0.2000.0521.10
(0.999–1.20)
6.32 × 10−60.0331.181.190.02779.5
872rs80726121737927119G/A0.0363.06 × 10−61.29
(1.16–1.43)
0.2550.0111.12
(1.03–1.22)
9.31 × 10−70.0111.181.200.04375.7
882rs98943701737926003C/G0.0374.77 × 10−71.31
(1.18–1.45)
0.3180.0181.10
(1.02–1.20)
8.05 × 10−70.0371.171.200.01184.6
892rs347588951737925467T/C0.0375.33 × 10-71.31
(1.18–1.45)
0.3180.0181.10
(1.02–1.20)
7.76 × 10-70.0341.171.200.01284.2
901rs1127713601737923770G/A0.0352.79 × 10−61.29
(1.16–1.44)
0.0070.2871.27
(0.820–1.95)
1.59 × 10−61.59 × 10−61.291.290.9260
911rs1128769411737922803T/A0.0352.36 × 10−61.29
(1.16–1.44)
0.0070.2871.27
(0.820–1.95)
1.37 × 10−61.37 × 10−61.291.290.9210
922rs29415091737921193T/C0.0371.30 × 10−51.27
(1.14–1.41)
0.2440.0521.09
(0.999–1.19)
2.07 × 10−50.0341.161.170.03477.9
932rs675715611737920846C/T0.0362.44 × 10−61.29
(1.16–1.43)
0.2300.0491.09
(1–1.20)
6.03 × 10−60.0411.171.180.01981.8
Class: Class 1 MAFEA > MAFAA; Class 2 MAFEA < MAFAA. A1/A2: Risk Allele EA/Non-Risk Allele EA. ImmunoChip Association data: MAF, p value and OR for EA and AA cohorts. Meta-analysis: p value fixed effects, P(R) value random effects, OR fixed effects, OR(R) Random effects, Q p value for Cochrane’s Q statistic, I I^2 heterogeneity index (0–100).
Table A5. Overlap of IKZF3 risk alleles with PC Hi-C interaction regions and GeneHancer regulatory elements.
#GrouprsChrPosPC Hi-C
Interaction Region
Pos (hg19)GeneHancerPos (hg19)
11rs1116783941738021116IKZF3-ZPBP238018444-38027003GH17J03985938015831-38025531
21rs1172787021738020420
32rs99058811738018954
42rs98993361738017779
52rs98990061738017064
61rs779243381738016356
72rs99157971738014867
82rs169653671738014315
92rs1134665461738012586
102rs99072911738010036
112rs80695311738009343 GH17J03985238008382-38009513
122rs80688941738008999
131rs1132337201738008190
141rs1126770361738002152
152rs676008071738001558
162rs99086941737997771
172rs99005411737996070
181rs1116919131737993238
192rs284496711737991630
201rs1119449121737988476 GH17J03981737974070-37978821
212rs733041231737987588
222rs1121414681737987464
231rs1117345951737987399
241rs1134797721737987042
251rs1127975701737983751
261rs1124375081737983512
272rs351300191737983141
281rs1114695621737982696
292rs129426601737982037
302rs80763471737977540
312rs99089831737976926
322rs99110691737976601
332rs990191717379762055′ (I3)37965773-37976506
341rs1127431301737975855
352rs340533941737975660
362rs580753751737975592
372rs99026211737973010
382rs98980311737972647
391rs1124121051737971635
401rs1131153051737970686GH17J03981237968642-37971311
411rs1122389001737968494
422rs671356461737967871
432rs1147772821737967649
442rs43373251737964435
452rs99016171737964175
461rs1130648431737960421
472rs72119981737959788
482rs360978411737958112
492rs3498850417379576313′ (E4-7)37932293-37957717GH17J03979837954998-37957986
501rs169653471737957566
512rs129373301737957316
522rs343444621737955193
532rs98993451737954757
541rs1133692931737952654GH17J03979037946728-37952847
551rs751483761737952508
562rs733021521737952350
572rs1131592271737952091
582rs569289751737952031
592rs129387491737951847
602rs359381991737950812
612rs351051101737950421
622rs353520751737949790
631rs1127716461737945708
641rs1123013221737944518
652rs350884691737944481
662rs342912171737944410
672rs99116881737943800
682rs99116691737943766
691rs1118626421737942983
702rs345995461737942971
711rs1123453831737942017
722rs15104751737941379
732rs1138124491737940167
742rs99093651737939958
752rs340169641737938976GH17J03976637922530-37939749
762rs676057031737938496
772rs355065181737938093
782rs133808711737936248
792rs72246411737934910
802rs127093641737933822
811rs1133705721737933467
822rs99014831737932773
832rs98948981737932220
842rs99135961737932062
852rs96528401737929427
862rs713697881737927144
872rs80726121737927119
882rs98943701737926003
892rs347588951737925467
901rs1127713601737923770
911rs1128769411737922803
922rs29415091737921193
932rs675715611737920846
Table A6. Allele-Specific Binding of Transcription Factors to Risk Alleles at IKZF3 for which MAFEUR > MAFAFR but which are not included on the ImmunoChip.
Group I Risk VariantsSNPs in IKZF3-ZPBP2 bi-Directional Promoter
Risk SNPLocationInteract.
Fragment
ASTFAlt-Ref Enrich.Promoter SNPShared
Promoter TF
Alt-Ref Enrich.
Ars193004755I1no---
Brs115164861I1no---
Crs142142756I1noFoxj1_1−2.5rs145735506Foxj1_111.8
Foxo_3−2.3rs184525456
rs138959946
Foxo_3−12
−3
p300_disc32.0rs188089973
rs9907794
rs116467677
rs145275643
rs138461720
rs112745149
rs192412458
p300_disc5
p300_disc5
p300_disc9
p300_disc10
p300_disc5
p300_disc5
p300_disc1
1.9
−5.9
−1.7
11.9
−2.5
3.2
11.9
Drs145168309I2noAP-1_disc811.2rs190729974
rs4795397
rs192412458
rs192412458
rs147224870
rs1453558
rs1453560
rs36111081
rs66565390
AP-1_disc1
AP-1_disc2
AP-1_disc3/7/9
AP-1_known2/3/4
AP-1_disc7
AP-1_disc2
AP-1_known1
AP-1_disc7
AP-1_disc7
12
−6.8
11.9/0.4/12
11.8/4.2/12
−10.9
11.9
−2.5
11.1
−11.1
Irf_known79.0rs9907564
rs188089973
rs75027016
rs138461720
rs112745149
rs184525456
Irf_known9
Irf_disc5/known9
Irf_known1/2
Irf_disc3
Irf_disc3/known9
Irf_known1/9
−1.1
11.9/−0.6
11.9/12
5.5
9.6/12
12/11.9
Pax-5_disc44.7--
Pou2f2_disc1
Pou2f2_known10
4.7
3.1
rs202227901
rs191534721
rs9905881
rs193079571
rs140511615
rs4622539
rs184966935
rs145101657
rs145975450
Pou2f2_known4
Pou2f2_known4
Pou2f2_known2
Pou2f2_known2
Pou2f2_known8
Pou2f2_known8
Pou2f2_known2
Pou2f2_known10
Pou2f2_known2
−0.2
−0.6
2.6
4.3
−5.4
−5.2
1.9
4.9
1
p300_disc52.9rs188089973
rs9907794
rs116467677
rs145275643
rs138461720
rs112745149
rs192412458
p300_disc5
p300_disc5
p300_disc9
p300_disc10
p300_disc5
p300_disc5
p300_disc1
1.9
−5.9
−1.7
11.9
−2.5
3.2
11.9
Ers111907649I3noAP-1_disc7−10.9rs190729974
rs4795397
rs192412458
rs192412458
rs147224870
rs1453558
rs1453560
rs36111081
rs66565390
AP-1_disc1
AP-1_disc2
AP-1_disc3/7/9
AP-1_known2/3/4
AP-1_disc7
AP-1_disc2
AP-1_known1
AP-1_disc7
AP-1_disc7
12
−6.8
11.9/0.4/12
11.8/4.2/12
−10.9
11.9
−2.5
11.1
−11.1
BHLHE40_disc2−11.2rs145275643
rs11557466
BHLHE40_known1
BHLHE40_known1
−0.2
1.3
Frs140386398I3noBDP1_disc3−12rs79042302BDP1_disc1−5.3
GR_disc5−12rs199994111
rs183478341
rs192412458
rs190942850
rs192800564
rs11655198
GR_disc6
GR_disc1
GR_disc2
GR_known3/9
GR_disc6
GR_disc4
−0.3
6.6
11.8
−0.2/−0.3
−9.2
12
Grs149317842I33′ E4-7Dlx2−10.1rs191534721Dlx2−1.9
Dlx3−9.4rs191534721Dlx2−1.3
Irx−5.6--
Lhx3_1−12rs138350717Lhx3_1−1
Pou3f2_2−11rs202227901
rs182045388
rs200781948
rs11078924
Pou3f2_2
Pou3f2_2
Pou3f2_2
Pou3f2_2
−12
−11
−12
−2.9
SRF_known34.3rs188089973
rs75027016
SRF_known3
SRF_known3
−1
1.3
STAT_known34.9rs202227901
rs191534721
rs4622539
rs145275643
rs79042302
rs79042302
rs112745149
rs192412458
rs181849193
rs185870642
rs145975450
rs74805134
STAT_disc5/known1
STAT_disc5
STAT_disc4
STAT_known13
STAT_disc1
STAT_known10/11/12/15/4/6/7
STAT_disc3
STAT_disc2
STAT_disc6
STAT_known14/15
STAT_known11
STAT_disc7
2.2/4.7
−11.8
12
5.2
−4
−11.9/1.2/−1/0.1/−3/−12/−0.9
12
12
11.9
11.9/11.9
−4.3
−11.7
YY1_known63.7rs188089973
rs147224870
rs28661251
YY1_known6
YY1_disc4
YY1_disc1/known2
−1.6
−3.1
−3.9/−0.6
Hrs186234194I73′ E4-7- --
Irs145335424I7noAP-1_disc2−12rs190729974
rs4795397
rs192412458
rs192412458
rs147224870
rs1453558
rs1453560
rs36111081
rs66565390
AP-1_disc1
AP-1_disc2
AP-1_disc3/7/9
AP-1_known2/3/4
AP-1_disc7
AP-1_disc2
AP-1_known1
AP-1_disc7
AP-1_disc7
12
−6.8
11.9/0.4/12
11.8/4.2/12
−10.9
11.9
−2.5
11.1
−11.1
Gfi1_3−12--
NF-Y_disc1−12--
NF-Y_known1−5.2--
RFX5_disc2−11.9rs4795397RFX5_disc2−7.5
TATA_disc6−5.4rs188089973
rs140511615
rs4622539
rs184966935
rs112745149
rs184525456
rs185009382
rs192678773
TATA_known4
TATA_disc9
TATA_disc9
TATA_known1
TATA_disc7
TATA_known1
TATA_disc7
TATA_disc7
0.7
−5.1
−3.2
−2.1
1.3
−0.6
−2.8
−7
Jrs113730542I7noFox8.3rs111678394Fox−1
Table A7. Risk Variants with Shared TF binding sites and Cell-type Specificity for DNAse I Hotspots.
SNPDNAse HotSpot
(ENCODE)
Interaction Region
Hi-C
Shared TF between IKZF3-ZPBP2 and 3′ (E4-7)
Interaction Regions
Shared DNase HotSpot between IKZF3-ZPBP2 and 3′ (E4-7)
Interaction Regions
Source
rs111678394yIKZF3-ZPBP2(Foxi1) Foxo_1,
Pax-4_5
CD20, CD4, CD34+, LCL, Th1, Th2, TregTable 2
rs75148376y3′ (E4-7)Ncx, Nkx6, Pou4f3,
Dbx1, Hoxb4
LCL, Th1, Th2, TregTable 2
rs113370572y3′ (E4-7)HDAC2LCL, Th1, Th2, TregTable 2
rs113730542 *y<2kb from
3′ (E4-7)
FoxCD4, LCL, Th1, Th2, TregTable A6
rs112876941y<10kb from 3′ (E4-7)Foxa, Foxj1, Foxo,
HNF1, TCF12
CD14+, LCLTable 2
* rs113703542 is a risk allele from the EUR GWAS which was not typed on the ImmunoChip, so the variant was not included in Group 1 risk alleles, just in Table A5.

References

  1. Chen, L.; Morris, D.L.; Vyse, T.J. Genetic advances in systemic lupus erythematosus: An update. Curr. Opin. Rheumatol. 2017, 29, 423–433. [Google Scholar] [CrossRef] [PubMed] [Green Version]
  2. Hom, G.; Graham, R.R.; Modrek, B.; Taylor, K.E.; Ortmann, W.; Garnier, S.; Lee, A.T.; Chung, S.A.; Ferreira, R.C.; Pant, P.V.; et al. Association of systemic lupus erythematosus with C8orf13-BLK and ITGAM-ITGAX. N. Engl. J. Med. 2008, 358, 900–909. [Google Scholar] [CrossRef] [PubMed] [Green Version]
  3. Kozyrev, S.V.; Abelson, A.K.; Wojcik, J.; Zaghlool, A.; Linga Reddy, M.V.; Sanchez, E.; Gunnarsson, I.; Svenungsson, E.; Sturfelt, G.; Jonsen, A.; et al. Functional variants in the B-cell gene BANK1 are associated with systemic lupus erythematosus. Nat. Genet. 2008, 40, 211–216. [Google Scholar] [CrossRef] [PubMed]
  4. Graham, R.R.; Cotsapas, C.; Davies, L.; Hackett, R.; Lessard, C.J.; Leon, J.M.; Burtt, N.P.; Guiducci, C.; Parkin, M.; Gates, C.; et al. A genome-wide association scan identifies Tumour Necrosis Factor Alpha Inducible Protein 3 (TNFAIP3/A20) as a susceptibility locus for Systemic Lupus Erythematosus. Nat. Genet. 2008, 40, 1059–1061. [Google Scholar] [CrossRef]
  5. Harley, J.B.; Alarcon-Riquelme, M.E.; Criswell, L.A.; Jacob, C.O.; Kimberly, R.P.; Moser, K.L.; Tsao, B.P.; Vyse, T.J.; Langefeld, C.D.; Nath, S.K.; et al. Genome-wide association scan in women with systemic lupus erythematosus identifies susceptibility variants in ITGAM, PXK, KIAA1542 and other loci. Nat. Genet. 2008, 40, 204–210. [Google Scholar] [CrossRef] [PubMed]
  6. Morris, D.L.; Taylor, K.E.; Fernando, M.M.; Nititham, J.; Alarcon-Riquelme, M.E.; Barcellos, L.F.; Behrens, T.W.; Cotsapas, C.; Gaffney, P.M.; Graham, R.R.; et al. Unraveling multiple MHC gene associations with systemic lupus erythematosus: Model choice indicates a role for HLA alleles and non-HLA genes in Europeans. Am. J. Hum. Genet. 2012, 91, 778–793. [Google Scholar] [CrossRef] [PubMed] [Green Version]
  7. Yang, W.; Shen, N.; Ye, D.Q.; Liu, Q.; Zhang, Y.; Qian, X.X.; Hirankarn, N.; Ying, D.; Pan, H.F.; Mok, C.C.; et al. Genome-wide association study in Asian populations identifies variants in ETS1 and WDFY4 associated with systemic lupus erythematosus. PLoS Genet. 2010, 6, e1000841. [Google Scholar] [CrossRef] [Green Version]
  8. Okada, Y.; Shimane, K.; Kochi, Y.; Tahira, T.; Suzuki, A.; Higasa, K.; Takahashi, A.; Horita, T.; Atsumi, T.; Ishii, T.; et al. A genome-wide association study identified AFF1 as a susceptibility locus for systemic lupus eyrthematosus in Japanese. PLoS Genet. 2012, 8, e1002455. [Google Scholar] [CrossRef]
  9. Lee, H.S.; Kim, T.; Bang, S.Y.; Na, Y.J.; Kim, I.; Kim, K.; Kim, J.H.; Chung, Y.J.; Shin, H.D.; Kang, Y.M.; et al. Ethnic specificity of lupus-associated loci identified in a genome-wide association study in Korean women. Ann. Rheum. Dis. 2014, 73, 1240–1245. [Google Scholar] [CrossRef]
  10. Lessard, C.J.; Sajuthi, S.; Zhao, J.; Kim, K.; Ice, J.A.; Li, H.; Ainsworth, H.; Rasmussen, A.; Kelly, J.A.; Marion, M.; et al. Identification of a Systemic Lupus Erythematosus Risk Locus Spanning ATG16L2, FCHSD2, and P2RY2 in Koreans. Arthritis Rheumatol. 2016, 68, 1197–1209. [Google Scholar]
  11. Demirci, F.Y.; Wang, X.; Kelly, J.A.; Morris, D.L.; Barmada, M.M.; Feingold, E.; Kao, A.H.; Sivils, K.L.; Bernatsky, S.; Pineau, C.; et al. Identification of a New Susceptibility Locus for Systemic Lupus Erythematosus on Chromosome 12 in Individuals of European Ancestry. Arthritis Rheumatol. 2016, 68, 174–183. [Google Scholar] [CrossRef]
  12. Bentham, J.; Morris, D.L.; Cunninghame Graham, D.S.; Pinder, C.L.; Tombleson, P.; Behrens, T.W.; Martin, J.; Fairfax, B.P.; Knight, J.C.; Chen, L.; et al. Genetic association analyses implicate aberrant regulation of innate and adaptive immunity genes in the pathogenesis of systemic lupus erythematosus. Nat. Genet. 2015, 47, 1457–1464. [Google Scholar] [CrossRef]
  13. John, L.B.; Ward, A.C. The Ikaros gene family: Transcriptional regulators of hematopoiesis and immunity. Mol. Immunol. 2011, 48, 1272–1278. [Google Scholar] [CrossRef] [PubMed]
  14. Wang, J.H.; Avitahl, N.; Cariappa, A.; Friedrich, C.; Ikeda, T.; Renold, A.; Andrikopoulos, K.; Liang, L.; Pillai, S.; Morgan, B.A.; et al. Aiolos regulates B cell activation and maturation to effector state. Immunity 1998, 9, 543–553. [Google Scholar] [CrossRef] [Green Version]
  15. Yoshida, T.; Ng, S.Y.; Zuniga-Pflucker, J.C.; Georgopoulos, K. Early hematopoietic lineage restrictions directed by Ikaros. Nat. Immunol 2006, 7, 382–391. [Google Scholar] [CrossRef]
  16. Schmitt, C.; Tonnelle, C.; Dalloul, A.; Chabannon, C.; Debre, P.; Rebollo, A. Aiolos and Ikaros: Regulators of lymphocyte development, homeostasis and lymphoproliferation. Apoptosis 2002, 7, 277–284. [Google Scholar] [CrossRef] [PubMed]
  17. Franke, A.; McGovern, D.P.; Barrett, J.C.; Wang, K.; Radford-Smith, G.L.; Ahmad, T.; Lees, C.W.; Balschun, T.; Lee, J.; Roberts, R.; et al. Genome-wide meta-analysis increases to 71 the number of confirmed Crohn’s disease susceptibility loci. Nat. Genet. 2010, 42, 1118–1125. [Google Scholar] [CrossRef] [Green Version]
  18. Jostins, L.; Ripke, S.; Weersma, R.K.; Duerr, R.H.; McGovern, D.P.; Hui, K.Y.; Lee, J.C.; Schumm, L.P.; Sharma, Y.; Anderson, C.A.; et al. Host-microbe interactions have shaped the genetic architecture of inflammatory bowel disease. Nature 2012, 491, 119–124. [Google Scholar] [CrossRef] [Green Version]
  19. International Multiple Sclerosis Genetics Consortium; Beecham, A.H.; Patsopoulos, N.A.; Xifara, D.K.; Davis, M.F.; Kemppinen, A.; Cotsapas, C.; Shah, T.S.; Spencer, C.; Booth, D.; et al. Analysis of immune-related loci identifies 48 new susceptibility variants for multiple sclerosis. Nat. Genet. 2013, 45, 1353–1360. [Google Scholar] [CrossRef]
  20. Swafford, A.D.; Howson, J.M.; Davison, L.J.; Wallace, C.; Smyth, D.J.; Schuilenburg, H.; Maisuria-Armer, M.; Mistry, T.; Lenardo, M.J.; Todd, J.A. An allele of IKZF1 (Ikaros) conferring susceptibility to childhood acute lymphoblastic leukemia protects against type 1 diabetes. Diabetes 2011, 60, 1041–1044. [Google Scholar] [CrossRef] [Green Version]
  21. Stahl, E.A.; Raychaudhuri, S.; Remmers, E.F.; Xie, G.; Eyre, S.; Thomson, B.P.; Li, Y.; Kurreeman, F.A.; Zhernakova, A.; Hinks, A.; et al. Genome-wide association study meta-analysis identifies seven new rheumatoid arthritis risk loci. Nat. Genet. 2010, 42, 508–514. [Google Scholar] [CrossRef]
  22. Liu, J.Z.; Almarri, M.A.; Gaffney, D.J.; Mells, G.F.; Jostins, L.; Cordell, H.J.; Ducker, S.J.; Day, D.B.; Heneghan, M.A.; Neuberger, J.M.; et al. Dense fine-mapping study identifies new susceptibility loci for primary biliary cirrhosis. Nat. Genet. 2012, 44, 1137–1141. [Google Scholar] [CrossRef] [Green Version]
  23. Anderson, C.A.; Boucher, G.; Lees, C.W.; Franke, A.; D’Amato, M.; Taylor, K.D.; Lee, J.C.; Goyette, P.; Imielinski, M.; Latiano, A.; et al. Meta-analysis identifies 29 additional ulcerative colitis risk loci, increasing the number of confirmed associations to 47. Nat. Genet. 2011, 43, 246–252. [Google Scholar] [CrossRef] [Green Version]
  24. Moffatt, M.F.; Kabesch, M.; Liang, L.; Dixon, A.L.; Strachan, D.; Heath, S.; Depner, M.; von Berg, A.; Bufe, A.; Rietschel, E.; et al. Genetic variants regulating ORMDL3 expression contribute to the risk of childhood asthma. Nature 2007, 448, 470–473. [Google Scholar] [CrossRef]
  25. Barrett, J.C.; Clayton, D.G.; Concannon, P.; Akolkar, B.; Cooper, J.D.; Erlich, H.A.; Julier, C.; Morahan, G.; Nerup, J.; Nierras, C.; et al. Genome-wide association study and meta-analysis find that over 40 loci affect risk of type 1 diabetes. Nat.Genet. 2009, 41, 703–707. [Google Scholar] [CrossRef] [Green Version]
  26. Nakayama, Y.; Kosek, J.; Capone, L.; Hur, E.M.; Schafer, P.H.; Ringheim, G.E. Aiolos Overexpression in Systemic Lupus Erythematosus B Cell Subtypes and BAFF-Induced Memory B Cell Differentiation Are Reduced by CC-220 Modulation of Cereblon Activity. J. Immunol. 2017, 199, 2388–2407. [Google Scholar] [CrossRef]
  27. Roadmap Epigenomics, C.; Kundaje, A.; Meuleman, W.; Ernst, J.; Bilenky, M.; Yen, A.; Heravi-Moussavi, A.; Kheradpour, P.; Zhang, Z.; Wang, J.; et al. Integrative analysis of 111 reference human epigenomes. Nature 2015, 518, 317–330. [Google Scholar]
  28. ENCODE Project Consortium. An integrated encyclopedia of DNA elements in the human genome. Nature 2012, 489, 57–74. [Google Scholar] [CrossRef]
  29. Javierre, B.M.; Burren, O.S.; Wilder, S.P.; Kreuzhuber, R.; Hill, S.M.; Sewitz, S.; Cairns, J.; Wingett, S.W.; Varnai, C.; Thiecke, M.J.; et al. Lineage-Specific Genome Architecture Links Enhancers and Non-coding Disease Variants to Target Gene Promoters. Cell 2016, 167, 1369–1384.e19. [Google Scholar] [CrossRef] [PubMed]
  30. Ward, L.D.; Kellis, M. HaploReg v4: Systematic mining of putative causal variants, cell types, regulators and target genes for human complex traits and disease. Nucleic Acids Res. 2016, 44, D877–D881. [Google Scholar] [CrossRef]
  31. Han, J.W.; Zheng, H.F.; Cui, Y.; Sun, L.D.; Ye, D.Q.; Hu, Z.; Xu, J.H.; Cai, Z.M.; Huang, W.; Zhao, G.P.; et al. Genome-wide association study in a Chinese Han population identifies nine new susceptibility loci for systemic lupus erythematosus. Nat. Genet. 2009, 41, 1234–1237. [Google Scholar] [CrossRef]
  32. Morris, D.L.; Sheng, Y.; Zhang, Y.; Wang, Y.F.; Zhu, Z.; Tombleson, P.; Chen, L.; Cunninghame Graham, D.S.; Bentham, J.; Roberts, A.L.; et al. Genome-wide association meta-analysis in Chinese and European individuals identifies ten new loci associated with systemic lupus erythematosus. Nat. Genet. 2016, 48, 940–946. [Google Scholar] [CrossRef]
  33. Langefeld, C.D.; Ainsworth, H.C.; Cunninghame Graham, D.S.; Kelly, J.A.; Comeau, M.E.; Marion, M.C.; Howard, T.D.; Ramos, P.S.; Croker, J.A.; Morris, D.L.; et al. Transancestral mapping and genetic load in systemic lupus erythematosus. Nat. Commun. 2017, 8, 16021. [Google Scholar] [CrossRef]
  34. Wu, C.; Orozco, C.; Boyer, J.; Leglise, M.; Goodale, J.; Batalov, S.; Hodge, C.L.; Haase, J.; Janes, J.; Huss, J.W., 3rd; et al. BioGPS: An extensible and customizable portal for querying and organizing gene annotation resources. Genome Biol. 2009, 10, R130. [Google Scholar] [CrossRef] [PubMed]
  35. Fishilevich, S.; Nudel, R.; Rappaport, N.; Hadar, R.; Plaschkes, I.; Iny Stein, T.; Rosen, N.; Kohn, A.; Twik, M.; Safran, M.; et al. GeneHancer: Genome-wide integration of enhancers and target genes in GeneCards. Database (Oxford) 2017, 2017, bax028. [Google Scholar] [CrossRef] [Green Version]
  36. Stelzer, G.; Rosen, N.; Plaschkes, I.; Zimmerman, S.; Twik, M.; Fishilevich, S.; Stein, T.I.; Nudel, R.; Lieder, I.; Mazor, Y.; et al. The GeneCards Suite: From Gene Data Mining to Disease Genome Sequence Analyses. Curr. Protoc. Bioinform. 2016, 54, 1.30.1–1.30.33. [Google Scholar] [CrossRef]
  37. Consortium, G.T. Human genomics. The Genotype-Tissue Expression (GTEx) pilot analysis: Multitissue gene regulation in humans. Science 2015, 348, 648–660. [Google Scholar] [CrossRef] [PubMed] [Green Version]
  38. Jansen, R.; Hottenga, J.J.; Nivard, M.G.; Abdellaoui, A.; Laport, B.; de Geus, E.J.; Wright, F.A.; Penninx, B.; Boomsma, D.I. Conditional eQTL analysis reveals allelic heterogeneity of gene expression. Hum. Mol. Genet. 2017, 26, 1444–1451. [Google Scholar] [CrossRef]
  39. Wang, Y.; Song, F.; Zhang, B.; Zhang, L.; Xu, J.; Kuang, D.; Li, D.; Choudhary, M.N.K.; Li, Y.; Hu, M.; et al. The 3D Genome Browser: A web-based browser for visualizing 3D genome organization and long-range chromatin interactions. Genome Biol. 2018, 19, 151. [Google Scholar] [CrossRef] [Green Version]
  40. Nolis, I.K.; McKay, D.J.; Mantouvalou, E.; Lomvardas, S.; Merika, M.; Thanos, D. Transcription factors mediate long-range enhancer-promoter interactions. Proc. Natl. Acad. Sci. USA 2009, 106, 20222–20227. [Google Scholar] [CrossRef] [Green Version]
  41. Sanyal, A.; Lajoie, B.R.; Jain, G.; Dekker, J. The long-range interaction landscape of gene promoters. Nature 2012, 489, 109–113. [Google Scholar] [CrossRef]
  42. Singh, P.; Han, E.H.; Endrizzi, J.A.; O’Brien, R.M.; Chi, Y.I. Crystal structures reveal a new and novel FoxO1 binding site within the human glucose-6-phosphatase catalytic subunit 1 gene promoter. J. Struct. Biol. 2017, 198, 54–64. [Google Scholar] [CrossRef] [Green Version]
  43. Hnisz, D.; Abraham, B.J.; Lee, T.I.; Lau, A.; Saint-Andre, V.; Sigova, A.A.; Hoke, H.A.; Young, R.A. Super-enhancers in the control of cell identity and disease. Cell 2013, 155, 934–947. [Google Scholar] [CrossRef] [Green Version]
  44. Absher, D.M.; Li, X.; Waite, L.L.; Gibson, A.; Roberts, K.; Edberg, J.; Chatham, W.W.; Kimberly, R.P. Genome-wide DNA methylation analysis of systemic lupus erythematosus reveals persistent hypomethylation of interferon genes and compositional changes to CD4+ T-cell populations. PLoS Genet. 2013, 9, e1003678. [Google Scholar] [CrossRef] [Green Version]
  45. Ulff-Moller, C.J.; Asmar, F.; Liu, Y.; Svendsen, A.J.; Busato, F.; Gronbaek, K.; Tost, J.; Jacobsen, S. Twin DNA Methylation Profiling Reveals Flare-Dependent Interferon Signature and B Cell Promoter Hypermethylation in Systemic Lupus Erythematosus. Arthritis Rheumatol. 2018, 70, 878–890. [Google Scholar] [CrossRef] [Green Version]
  46. Barrett, J.C.; Fry, B.; Maller, J.; Daly, M.J. Haploview: Analysis and visualization of LD and haplotype maps. Bioinfomatics 2005, 21, 263–265. [Google Scholar] [CrossRef] [Green Version]
  47. Purcell, S.; Neale, B.; Todd-Brown, K.; Thomas, L.; Ferreira, M.A.; Bender, D.; Maller, J.; Sklar, P.; de Bakker, P.I.; Daly, M.J.; et al. PLINK: A tool set for whole-genome association and population-based linkage analyses. Am. J. Hum. Genet. 2007, 81, 559–575. [Google Scholar] [CrossRef] [Green Version]
  48. Blankenberg, D.; Von Kuster, G.; Coraor, N.; Ananda, G.; Lazarus, R.; Mangan, M.; Nekrutenko, A.; Taylor, J. Galaxy: A web-based genome analysis tool for experimentalists. Curr. Protoc. Mol. Biol. 2010, 89, 10–19. [Google Scholar] [CrossRef]
  49. Burren, O.S.; Rubio Garcia, A.; Javierre, B.M.; Rainbow, D.B.; Cairns, J.; Cooper, N.J.; Lambourne, J.J.; Schofield, E.; Castro Dopico, X.; Ferreira, R.C.; et al. Chromosome contacts in activated T cells identify autoimmune disease candidate genes. Genome Biol. 2017, 18, 165. [Google Scholar] [CrossRef]
  50. Hoffman, M.M.; Ernst, J.; Wilder, S.P.; Kundaje, A.; Harris, R.S.; Libbrecht, M.; Giardine, B.; Ellenbogen, P.M.; Bilmes, J.A.; Birney, E.; et al. Integrative annotation of chromatin elements from ENCODE data. Nuc. Acids Res. 2013, 41, 827–841. [Google Scholar] [CrossRef] [Green Version]
  51. Zhbannikov, I.Y.; Arbeev, K.; Ukraintseva, S.; Yashin, A.I. haploR: An R package for querying web-based annotation tools. F1000Res 2017, 6, 97. [Google Scholar]
  52. Hahne, F.; Ivanek, R. Visualizing Genomic Data Using Gviz and Bioconductor. Methods Mol. Biol. 2016, 1418, 335–351. [Google Scholar]
Figure 1. Trans-ancestral mapping to define a core set of IKZF1 risk alleles. The figure shows the location of the 186 SNPs defined within the boundary of the 60 kb IKZF1 risk haplotype and the 198 SNPs within the 65 kb Chinese (ASN) risk haplotype. Alignment of the 1000G haplotypes carrying alleles in LD (r2 > 0.75) with rs4917014 (as shown in Figure A1) was used to refine the risk haplotype to 15 variants in tight LD (r2 > 0.75) with rs4917014 over a distance of 47.7 kb upstream of the IKZF1 transcriptional start site.
Ijms 21 08383 g001
Figure 2. Chromatin Status of IKZF1 Interaction Regions. The figure shows several aligned tracks across IKZF1 (hg19). The 15 risk alleles are aligned with the three interaction regions at IKZF1, reading from Left to Right: Upstream Enhancer region; proximal promoter (TSS) and intron 3 (I3). There is chromatin looping between the Enhancer region and the TSS region but not intron 3. The Genome Segmentation data was extracted from ENCODE (EBV-LCL), using a merged consensus of the segmentations from ChromHMM and Segway algorithms. The seven states correspond to: Predicted promoter including TSS (bright red), Predicted promoter flanking region (light red), Predicted enhancer (orange), Predicted weak enhancer or open chromatin cis regulatory element (yellow), CTCF enriched element (blue), Predicted transcribed region (Dark Green), Predicted Repressed or Low Activity region (grey).
Ijms 21 08383 g002
Figure 3. Genomic and Epigenetic Landscape across IKZF1. The figure shows the genomic landscape around IKZF1. The data is split into three horizontal panels (AC). The genomic location of each element is presented in Table A2. Panel A: The top row PC Hi-C interaction regions from left to right designated: Enhancer (Enh); Transcriptional Start Site/Promoter (TSS) and intron 3 (I3). The second row illustrates the GeneHancer regulatory regions (grey boxes and promoter/TSS regions (red boxes) from GeneCards—from left to right: GH07J050261; GH07J050293; GH07J050301; GH07J050303; GH07J050326; GH07J050329; GH07J050341 and GH07J050392. The third row illustrates the genomic architecture of the major IKZF1 transcript. The fourth row shows the location of the risk alleles at IKZF1, which are in strong LD (r2 > 0.75) with the GWAS risk variant, rs4917104: rs34767118, rs11773763, rs62445350, rs55935382, rs11185602, rs4917014, rs11185603, rs4385425, rs876036, rs876038, rs876037 and rs876039). Panel B: heatmaps delineating the Signal Values of the DNAse Hotspots, calculated by the Sato et al. 2004 method. These data were taken from Digital DNAseI data from ENCODE/Washington for immune cells: GM12878 (EBV-LCL); GM04504 (EBV-LCL); GM06990 (EBV-LCL); GM04503 (EBV-LCL); GM12864 (EBV-LCL); GM12865 (EBV-LCL); CD20 (CD20+ B cells); Mono (CD14+ Monocytes); CD4 (naïve CD4+ T cells from whole blood); CD34+ (Mobilized CD34+ cells); Jurkat (Jurkat T cell line); Th1 (purified Th1 cells); Th1WB (Th1 cells from whole blood); Th2 (purified Th1 cells); Th2WB (Th1 cells from whole blood); Th17 (T helper cells expressing IL-17) and Treg (Regulatory T cells). Panel C: heatmaps illustrating the enrichment of the H3K27ac enhancer mark (using the consolidated imputed epigenetic data in RoadMap), calculated by the IntervalStats tool in the Colocstats web browser. The blood cell types from RoadMap are: Mon (E029—Primary monocytes from peripheral blood); Neut (E030—Primary neutrophils from peripheral blood); Bcord (E031—Primary B cells from cord blood); B (E032—Primary B cells from peripheral blood); Tcord (E033 and E034—Primary T cells from cord blood); T (E034—Primary T cells from peripheral blood); Stem (E035—Primary hematopoietic stem cells); Stemcult (E036—Primary hematopoietic stem cells short term culture); Thm1 (E037—Primary T helper memory cells from peripheral blood); Thnaive1 (E038—Primary T helper naive cells from peripheral blood); Thnaive2 (E039—Primary T helper naive cells from peripheral blood); Thm2 (E040—Primary T helper memory cells from peripheral blood); Thstim (E041—Primary T helper cells PMA-I stimulated); Th17stim (E042—Primary T helper 17 cells PMA-I stimulated); Th (E043—Primary T helper cells from peripheral blood); Treg (E044—Primary T regulatory cells from peripheral blood); Teffmem (E045—Prim. T cells effector/memory enriched from periph. Blood); NK (E046—Primary Natural Killer cells from peripheral blood); CD8naive (E047—Primary T CD8+ naïve cells from peripheral blood); CD8mem (E048—Primary T CD8+ memory cells from peripheral blood); StemmobF (E050—Primary hematopoietic stem cells G-CSF-mobilized Female); StemmobM (E051—Primary hematopoietic stem cells G-CSF-mobilized Male); Mononuc (E062—Primary mononuclear cells from peripheral blood); Dnd41 (E115—Dnd41 TCell Leukemia Cell Line); GM12878 (E116—GM12878 Lymphoblastoid Cell Line); K562 (E123—K562 Leukemia Cell Line) and MonoRO01746 (E124—Monocytes-CD14+ RO01746 Primary Cells). The non-blood cells from RoadMap are Forekin01 (E055—Foreskin Fibroblast Primary Cells), Forekin02 (E055—Foreskin Fibroblast Primary Cells), Lung (E128—NHLF Lung Fibroblast Primary Cells) and HUVEC (E122—HUVEC Umbilical Vein Endothelial Primary Cells).
Ijms 21 08383 g003
Figure 4. Epigenetic Annotation of Risk Alleles at IKZF1. The figure is a diagrammatic representation summarizing the functional annotation across IKZF1. All of the data in Panels A-D was prepared in a single alignment against hg19 (chr7:50,279,064-50,481,386). Panel A: The transcription factors which are predicted to exhibit significant (LOD < 3) allele-specific binding (ASTF) to IKZF1 risk alleles within the PC-Hi-C interaction regions, taken from Table 1. Panel B: Genomic architecture of IKZF1 and the location of the 15 upstream risk alleles. Panel C: Clusters of statistically significant enrichment (score range 200–1000) ChIP-Seq peaks for EP300 and CTCF (Transcription Factor ChIP-seq Uniform Peaks from ENCODE/Analysis) in GM12878 EBV-LCLs, aligned with the PC-Hi-C interaction intervals across IKZF3. Panel D: ChIP-Seq signal wiggle density graphs for chromatin marks from ENCODE/BROAD in GM12878 EBV-LCL cells for-H3K27ac (active enhancer region), H3K9ac (active regulatory elements/promoters), H3K4me1 (found in gene body of CpG genes with higher expression), H3K4me2 (found in gene body of CpG genes with higher expression) and H3K4me3 (associated with promoter/TSS). The vertical viewing range for each of these epigenetic tracks is set to viewing maximum at 50, to allow comparison of signal between each epigenetic modification.
Ijms 21 08383 g004
Figure 5. Trans-ancestral exclusion mapping to refine risk alleles at IKZF3. Location of the 93 European tag-SNPs carried on the 101 kb core risk haplotype across IKZF3 coded on the antisense strand, shared between healthy EA (European American) and AA (African American) individuals from the SLE ImmunoChip study. Trans-ancestral exclusion mapping led to the removal of 66 variants (Group 2) which had MAF > 12% but which were not associated (p > 0.01) in the AA samples. The remaining 27 variants (Group 1) showed stronger association in the AA samples, despite having MAF < 0.1%. This group of variants, were split into Group 1A (variants located in promoter-I3 regulatory region of the gene) and Group 1B (variants in the I3-E7 region covering the six Zinc Fingers). Group 1A variants were more strongly associated (OR > 1.5) than the Group 1B variants (OR > 1.27) in the AA cohort.
Ijms 21 08383 g005
Figure 6. Chromatin Status of IKZF3 Interaction Regions. The figure shows several aligned tracks across IKZF3 (hg19). The 27 Group 1 variants, aligned with the interaction regions at IKZF3: IKZF3-ZPBP2 bi-directional promoter (chr17:38018444-38027003) with the three interaction regions across the coding region chr17:37965773-37976506 (5′ I3); chr17:37958027-37963133 (mid I3) and chr17:37932293-37957717 (3′ E4-7) across IKZF3, taken from Pi-HiC data [29]. The strongest interactions (CHICAGO Score > 5.5) were seen in T and B lymphocytes: Naïve CD4+ T cells (nCD4), Total CD4+ T cells (tCD4), Activated total CD4+ T cells (aCD4), Non-activated total CD4+ T cells (naCD4), Naïve CD8+ T cells (nCD8), Total CD8+ T cells (tCD8), Naïve B cells (nB) and Total B cells (tB). The Genome Segmentation data was extracted from ENCODE (EBV-LCL), using a merged consensus of the segmentations from ChromHMM and Segway algorithms. The seven states correspond to: Predicted promoter including TSS (bright red), Predicted promoter flanking region (light red), Predicted enhancer (orange), Predicted weak enhancer or open chromatin cis regulatory element (yellow), CTCF enriched element (blue), Predicted transcribed region (Dark Green), Predicted Repressed or Low Activity region (grey). The genomic architecture of IKZF3 shows the regions of the gene coding for the Zinc Fingers responsible for DNA binding (ZnF 1–4) and dimerization (ZnF 5–6). By contrast, there are a total of 12 regulatory elements across IKZF3 listed in the GeneHancer database (Figure 3, Table A5). However, only one of the GeneHancer elements within IKZF3 undertakes chromatin looping with the major bi-directional IKZF3 promoter (GH17J039859). This element is the second promoter (GH17039839), located in intron 1, which contains the ribosomal protein L39 pseudogene 4 (interaction confidence score = 190) (data not shown). (GH17J039859) contains three Group 1 risk alleles but GH17039839 does not contain any risk alleles) (Table A5). Nevertheless, the bi-directional IKZF3 promoter (GH17J039859) interacts with GeneHancer element upstream of GSDMB and ORMDL3 (GH17J039916) (interaction confidence score = 652). GH17J039916 lies within the original 194 kb EUR associated LD region but not the 101 kb core risk haplotype.
Ijms 21 08383 g006
Figure 7. Genomic and Epigenetic Landscape across IKZF3. The figure shows the genomic landscape around IKZF3. The data is split into three horizontal panels (AC). The genomic location of each element is presented in Table A2. Panel A: The top row PC Hi-C interaction regions from right to left designated: IKZF3-ZPBP2 bi-directional promoter with the three interaction regions across the coding region (5′ I3); (mid I3) and (3′ E4-7). The second row GeneHancer regulatory elements—from right to right: GH17J039753; GH17J039766; GH17J039790; GH17J039799; GH17J039798; GH17J039812; GH17J039817; GH17J039839; GH17J039842 and GH17J039847. The Promoter/TSS intervals are designated as red boxes and the enhancer intervals as grey boxes. The third row illustrates the genomic architecture of the full length and short IKZF3 transcripts. Panel B: heatmaps delineating the Signal Values of the DNAse Hotspots, calculated by the Sato et al. 2004 method. These data were taken from Digital DNAseI data from ENCODE/Washington for immune cells: GM12878 (EBV-LCL); GM04504 (EBV-LCL); GM06990 (EBV-LCL); GM04503 (EBV-LCL); GM12864 (EBV-LCL); GM12865 (EBV-LCL); CD20 (CD20+ B cells); Mono (CD14+ Monocytes); CD4 (naïve CD4+ T cells from whole blood); CD34+ (Mobilized CD34+ cells); Jurkat (Jurkat T cell line); Th1 (purified Th1 cells); Th1WB (Th1 cells from whole blood); Th2 (purified Th1 cells); Th2WB (Th1 cells from whole blood); Th17 (T helper cells expressing IL-17) and Treg (Regulatory T cells). Panel C: heatmaps illustrating the enrichment of the H3K27ac enhancer mark (using the consolidated imputed epigenetic data in RoadMap), calculated by the IntervalStats tool in the Colocstats web browser. The blood cell types from RoadMap are: Mon (E029—Primary monocytes from peripheral blood); Neut (E030—Primary neutrophils from peripheral blood); Bcord (E031—Primary B cells from cord blood); B (E032—Primary B cells from peripheral blood); Tcord (E033 and E034—Primary T cells from cord blood); T (E034—Primary T cells from peripheral blood); Stem (E035—Primary hematopoietic stem cells); Stemcult (E036—Primary hematopoietic stem cells short term culture); Thm1 (E037—Primary T helper memory cells from peripheral blood); Thnaive1 (E038—Primary T helper naive cells from peripheral blood); Thnaive2 (E039—Primary T helper naive cells from peripheral blood); Thm2 (E040—Primary T helper memory cells from peripheral blood); Thstim (E041—Primary T helper cells PMA-I stimulated); Th17stim (E042—Primary T helper 17 cells PMA-I stimulated); Th (E043—Primary T helper cells from peripheral blood); Treg (E044—Primary T regulatory cells from peripheral blood); Teffmem (E045—Prim. T cells effector/memory enriched from periph. Blood); NK (E046—Primary Natural Killer cells from peripheral blood); CD8naive (E047—Primary T CD8+ naïve cells from peripheral blood); CD8mem (E048—Primary T CD8+ memory cells from peripheral blood); StemmobF (E050—Primary hematopoietic stem cells G-CSF-mobilized Female); StemmobM (E051—Primary hematopoietic stem cells G-CSF-mobilized Male); Mononuc (E062—Primary mononuclear cells from peripheral blood); Dnd41 (E115—Dnd41 TCell Leukemia Cell Line); GM12878 (E116—GM12878 Lymphoblastoid Cell Line); K562 (E123—K562 Leukemia Cell Line) and MonoRO01746 (E124—Monocytes-CD14+ RO01746 Primary Cells). The non-blood cells from RoadMap are Forekin01 (E055—Foreskin Fibroblast Primary Cells), Forekin02 (E055—Foreskin Fibroblast Primary Cells), Lung (E128—NHLF Lung Fibroblast Primary Cells) and HUVEC (E122—HUVEC Umbilical Vein Endothelial Primary Cells).
Ijms 21 08383 g007
Figure 8. The Potential for Stabilization of Chromatin Looping by TF dimerization at IKZF3. The figure illustrates the potential for TF dimerization to stabilize chromatin looping at IKZF3. For clarity, we have just shown the interaction between the IKZF2-ZPBP2 promoter and 3′ E4-7 interaction fragments from PC Hi-C, which brings together the TSSfull length (promoter of the full-length isoform) and the TSSshort (TSS of the shorter isoform) of IKZF3 (grey dotted lines). The Fox family members (red diamonds) bind to the risk alleles in the promoter (rs111678394) and dimerize with the Fox TFs binding two risk variants downstream of the 3′ E4-7 fragment: rs113730542 and rs112876941. Since Fox transcription factors act as dimers this potential for Fox dimerization may stabilize the interaction between the IKZF3-ZPBP2 and 3′ E4-7 fragments.
Ijms 21 08383 g008
Figure 9. Epigenetic Annotation of Group 1 Risk Alleles at IKZF3. The figure is a diagrammatic representation of the functional annotation across IKZF3. All of the data in Panels AD was prepared in a single alignment against hg19 (chr17:37,892,161-38,035,099). Panel A: The transcription factors which are predicted to exhibit significant (LOD < 3) allele-specific binding (ASTF) to group 1 risk alleles within the PC-Hi-C interaction regions, taken from Table 2. Panel B: Genomic architecture of IKZF3 and the location of the 26 Group 1 risk alleles (Table 2). Panel C: Clusters of statistically significant enrichment (score range 200–1000) ChIP-Seq peaks for EP300 and CTCF (Transcription Factor ChIP-seq Uniform Peaks from ENCODE/Analysis) in GM12878 EBV-LCLs, aligned with the PC-Hi-C interaction intervals across IKZF3. Panel D: ChIP-Seq signal wiggle density graphs for chromatin marks from ENCODE/BROAD in GM12878 EBV-LCL cells for—H3K27ac (active enhancer region), H3K9ac (active regulatory elements/promoters), H3K4me1 (found in gene body of CpG genes with higher expression), H3K4me2 (found in gene body of CpG genes with higher expression) and H3K4me3 (associated with promoter/TSS). The vertical viewing range for each of these epigenetic tracks is set to viewing maximum at 50, to allow comparison of signal between each epigenetic modification.
Ijms 21 08383 g009
Table 1. Allele Specific Binding of Transcription Factors to IKZF1 Risk alleles.
Enhancer Region (Enh) Promoter/TSS Region (PC Hi-C) GeneHancer Promoter Region (GH07J050293)
Risk SNPTF Showing Allele-Specific Binding (ASTF)Alt-Ref EnrichmentTSS SNP with Same TF Binding Site as Risk AlleleTF Binding to TSS SNPAlt-Ref EnrichmentTSS SNP with Same TF Binding Site as Risk AlleleTF Binding to TSS SNPAlt-Ref Enrichment
rs11185603 *ARXRA_disc4−11.1 rs146295095RXRA_known13
rs141865623RXRA_disc2−0.8
rs11765436 #RXRA_disc25.7rs11765436 #RXRA_disc25.7
rs187496825RXRA_known212
rs180969166 ^RXRA_known60
rs183264036 ^RXRA_disc10.2rs7802443 #RXRA_disc211.4
BPU.1_disc3−11.9 rs191336126
rs80161560
PU.1_disc20.8rs9886239 *PU.1_disc2−12
PU.1_disc31.6
CTATA_disc7−6.3 rs142010565TATA_known1−1.9rs7777365TATA_known3−2.4
rs142762599TATA_known10.1
rs79391891TATA_disc2−12
rs186224998TATA_disc9−4
rs62447182TATA_disc9−5.1
rs876036DERalpha-a_disc410.5 rs180969166 ^
rs183264036
rs151114892
rs145086785
ERalpha-a_disc2/4−2/−0.3
ERalpha-a_disc43.3
ERalpha-a_disc4−3.6
ERalpha-a_disc40.5
DVDR_2/3−7.8, −3.9 rs180969166 ^VDR_412
rs151114892VDR_4−11.5
ERXRA_known4−10.6 rs11765436 #RXRA_disc25.7
rs7802443 #RXRA_disc211.4
rs876038 *AXBP-1_1−12 rs184933329XBP-1_2−11.9
rs74607523XBP-1_2−2.3
BBDP1_disc1−0.6 rs11761922 *BDP1_disc112
rs7781977 #BDP1_disc112
CBrachyury_1−3.2 rs10269380 *Brachyury_14.8
rs876039 Foxa_known2,31.1, 0.6 rs7777365 #Foxa_known1−2.7
*/# Risk variants having shared TF binding sites with promoter variants which are eQTLs for IKZF1 in whole blood (GTEx2015_v6* or NESDA NTR conditional eQTL database#). ^ SNP is just outside PC Hi-C interaction region but within GeneHancer promoter interaction region.
Table 2. Allele-Specific Binding of Transcription Factors to Group 1 Risk Alleles at IKZF3.
Group I Risk VariantsSNPs in IKZF3-ZPBP2 Bi-Directional Promoter
Risk SNPInteraction
Fragment
ASTF *Alt-Ref EnrichmentPromoter SNPShared
Promoter TF
Alt-Ref Enrichment
1rs111678394IKZF3-ZPBP2Foxi1−3.9---
Foxo_1−2.1rs138959946 aFoxo1−2.4
Pax-4_5−2.3rs189743120 aPax_4_51
2rs117278702IKZF3-ZPBP2-----
3rs77924338noVDR_4−9.1rs74805134 bVDR_2−11.5
4rs113233720noDMRT4−11.5rs147630723 aDMRT411.9
5rs112677036no Mef2_known5 11.5 rs73985223 bMef2_known611.9
rs73985223 bMef2_disc16.4
rs4622539 bMef2_known5−3.2
rs192412458 aMef2_disc311.9
rs188089973Mef2_known5−3.8
rs185330833 aMef2_known611.7
rs184966935 aMef2_known1−10
rs184525456 aMef2_known5−3.1
rs140511615 aMef2_known5−11.8
6rs111691913noZntb38.0---
7rs111944912noHoxa132rs12150079Hoxa130.7
8rs111734595no-----
9rs113479772no-----
10rs112797570no-----
11rs111734595noSETDB1
Zfx
8.2
−5.7
rs201229892
rs117064469
SETDB1
Zfx
−0.6
−1.4
12rs111469562no Obox64.6rs11078925Obox3−6.7
Dmbx14.1rs11078925Dmbx1−9
13rs1127431305′ (I3)-----
14rs1124121055′ (I3)GR_disc4−12rs183478341 u/kGR_disc16.6
15rs1131153053′ (E4-7)-----
16rs1122389003′ (E4-7)-----
17rs1130648433′ (E4-7)-----
18rs169653473′ (E4-7)Pou6f1_2 ---
19rs1133692933′ (E4-7) Irf_disc32.3rs138461720 u/kIrf_disc35.5
Irf_disc32.3rs112745149 u/kIrf_disc39.6
20rs751483763′ (E4-7) Ncx_24rs9905881 bNcx_23.2
Nkx6-1_26.7rs149800216 aNkx6-1_3−9.7
Nkx6-1_26.7rs149800216 aNkx6-1_2−10.2
Nkx6-1_26.7rs149800216 aNkx6-1_1−12
Ncx_24rs149800216 aNcx_2−6.4
Pou4f35.6rs138350717 aPou4f35.9
Nkx6-1_26.7rs138350717 aNkx6-1_23.5
Nkx6-1_26.7rs138350717 aNkx6-1_17.9
Dbx12.2rs202227901 bDbx1−0.1
Dbx12.2rs138350717 aDbx10.6
Dbx12.2rs145735506 aDbx11.4
Dbx12.2rs185330833 aDbx1−1.2
Hoxb42.1rs202227901 bHoxb4−0.5
21rs1127716463′ (E4-7) GR_disc5−3.8rs192800564 aGR_disc6−9.2
GR_disc5−3.8rs192412458 aGR_disc211.8
GR_disc5−3.8rs11655198GR_disc412
22rs1123013223′ (E4-7) NF-E2_disc111.9rs201229892 aNF-E2_disc112
Rad21_disc10−11.5rs187549822 aRad21_disc2−4.2
23rs1118626423′ (E4-7)Sin3Ak-20_disc1−2.9rs116467677 aSin3Ak-20_disc6−0.6
24rs1123453833′ (E4-7)HNF1_26.1rs202236981 aHNF1_2−1.8
25rs113370572 T3′ (E4-7) HDAC2_disc59.6rs202227901 bHDAC2_disc610.6
HDAC2_disc59.6rs200781948 aHDAC2_disc6−3.9
26rs112771360no-----
27rs112876941no HNF1_73.5---
HNF1_63.1rs9905881 bHNF1_6−2.7
HNF1_63.1rs9907564 bHNF1_6−1.1
HNF1_63.1rs138350717 aHNF1_60.7
HNF1_14.3rs9905881 bHNF1_1−4.3
Foxo_211.9rs184525456 aFoxo_2−12
Foxa_disc2−10.6rs145895912 aFoxa_disc311.7
Foxj1_14.6rs145735506 aFoxj1_111.8
Foxo_211.9rs138959946 aFoxo_2−12
* ASTFs predicted to exhibit >2 fold enrichment when binding to Group 1 risk allele compared with binding to the non-risk allele; T Group 1 SNP in TSS (~8.4 kb) of shorter isoform; For promoter variants: a very rare minor allele (<0.5% or monomorphic) in EUR; b ~3% minor allele in EUR u/k—within promoter interaction region not within risk haplotype.
Publisher’s Note: MDPI stays neutral with regard to jurisdictional claims in published maps and institutional affiliations.

