1. Introduction
Hepatocellular carcinoma (HCC) accounts for the third leading cause of cancer mortality worldwide. In Korea, 12% of all malignancies account for HCC and it is one of the leading causes of cancer-related deaths [
1]. To date, there is no definitive curative drug for the treatment of HCC. Chemotherapy is often used to control tumor progression when it reaches an unresectable condition [
2], however, there is an increasing development of drug-resistance and poor responders to the available conventional drugs. Hence, the development of a novel chemotherapeutic drug or a combinational therapy that improves the efficacy and sensitivity towards cancer with the currently available drugs is an area of intense research.
Cisplatin (CP) is a commonly used single chemotherapeutic agent with modest anti-tumor potential and safety in patients with HCC [
3]. The anti-tumor effect of CP is attributed to the formation of adducts between inter and intra-strands of DNA. The cytotoxic effect of CP is likely to the results of the inhibition of DNA replication and induction of apoptosis. Nevertheless, its efficacy is incessantly limited due to the high incidence of chemo-resistance [
4]. Therefore, rather than developing a new drug, it is imperative to develop newer methods to conquer the drug-resistance. We believe that combination therapy might be effective in preventing drug-resistance by altering the expression of different proteins.
Recent studies have investigated the role of multiple signaling pathways responsible for CP-resistance in a variety of cancers, of which PARP-1-HMGB1 pathway-mediated autophagy activation plays a key role [
5,
6]. PARP-1 is an intra-nuclear enzyme, which leads to the conversion of β-nicotinamide adenine dinucleotide (NAD
+) to the polymer of poly (ADP ribose) (PAR) to regulate nuclear homeostasis. Chemical induced DNA damage in cells activates PARP-1, which depletes NAD
+ and ATP, subsequently leading to irreversible energy scarcity and cell death [
7]. The physio-pathological role of PARP-1 hyper-activation through DNA damage is well exemplified by using PARP-1 inhibitors in the experimental model of diabetes, inflammation and cancer [
8]. The role of poly-ADP-ribosylation in cell death shows that PARP-1 activation occurs during apoptosis. Despite the pathogenic relevance, PARP-1 leads to poly-ADP-ribosylation of HMGB1, which in turn contributes to chemotherapy resistance via upregulation of autophagy through three different mechanisms; (1) nuclear HMGB1 activates autophagy by HSPB1 (heat shock 27 kDa protein 1) regulation, (2) cytoplasmic HMGB1 binds Beclin1 to initiate autophagosome formation and (3) extracellular HMGB1 leads to advanced glycation end product-specific receptor (AGER)-mediated activation of class III phosphatidylinositol 3-kinase to induce autophagy [
9]. Since alterations in the expression of HMGB1 and its sub-cellular translocation are associated with the regulation of tumor development and cancer treatment, we propose that HMGB1-mediated autophagy activation is a possible target for chemotherapy [
10]. In our previous study, we have reported the regulatory role of morin hydrate (Mh) in CP-induced autophagy activation induced by PARP-1 activation in CP-resistance HepG2
DR multi-drug resistant cell line. According to these findings, the cisplatin/morin hydrate combination was effective in the reversal of the HepG2
DR cell resistance via suppression of PARP1-mediated autophagy by regulating the HMGB1 and microtubule-associated protein 1A/1B light chain 3B (LC3) I/II [
11]. In continuation of our previous report, present study validates the adjuvant effect of Mh in combination with CP to regulate the PARP-1-HMGB1 pathway of autophagy and enhances apoptosis in various HCC cell lines and in xenograft mice model of HCC.
Morin hydrate (Mh) or (3,5,7,2′,4-pentahydroxyflavone) is a bioflavonoid, naturally isolated from the
Moraceae family members, mostly found in different small plants, fruits and wine [
12]. In recent studies, Mh has exhibited several pharmacological properties, including anti-oxidant, anti-inflammatory, apoptosis, anti-proliferative and chemo-sensitivity in multiple cancer cell lines. Mh supplementation to cancer xenograft model of rodents significantly attenuates tumor development by reducing oxidative damages generally induced by free radicals [
13,
14]. The chemical structure of Mh can be distinguished from other bioflavonoids by the presence of two aromatic rings interconnected by a
c-pyrone ring with polar hydroxyl groups at various positions. These hydroxyl groups are thought to be harboring free radical scavenging properties shared by Mh and other bioflavonoids [
15]. On the other hand, Mh also possesses a characteristic feature of minimal toxicity even at higher dose usage [
16]. Based on the demonstrated anti-tumor activities, different mechanisms of action and toxicity profiles, we intended to study combinational therapeutic effect of CP and Mh in HepG2 cells and anticipated a synergistic interaction of CP-Mh combination.
3. Discussion
Hepatocellular carcinoma (HCC) is one of the leading causes of cancer-mediated deaths across the world. Although combinational therapy is considered to be the foremost method to restrict the invasion of metastatic disease, there are minimal chances of survival due to reduced chemosensitivity of cancerous cells. Therefore, to enhance the chemosensitivity towards cancer cells or tumor, conventional drugs are essential for improving the efficacy of available medications in clinical use [
18]. The results of the present study show that CP-induced PARP-1 expression is capable of developing chemoresistance in HepG2 cells, which is facilitated through the HMGB1-mediated autophagy activation which also validate our previous report studied with HepG2
DR multi drug resistance cells [
11]. Autophagy is a homeostatic cellular mechanism that plays a crucial role in response to metabolic and therapeutic stresses and attempts to sustain homeostatic balance through the lysosomal digestion of accumulated proteins and damaged organelles. Recent reports indicate that autophagy is a constitutive target towards chemotherapy, the induction of autophagy in response to chemotherapeutics is beheld as having a pro-death or a pro-survival role, thereby contributing to the anticancer sensitivity of these drugs as well as resistance [
19]. Therefore, the combination of autophagy inhibitors and chemotherapeutic agents or molecular-targeted drugs is regarded as promising therapeutic strategy in the treatment of HCC. Autophagy is functionally activated in squamous cell carcinoma and HCC after cisplatin and oxaliplatin treatment and the suppression of autophagy by targeted inhibitors, such as 3-MA enhances apoptotic cell death [
20,
21]. The combined treatment of an autophagy inhibitor and bevacizumab markedly inhibits the growth of HCC; however, autophagy contributed in HCC cells survival [
22]. Moreover, the combination of sorafenib and chloroquine generates ER stress-mediated cell death in HCC, both in vitro and in vivo [
23]. In the present study, we used Mh to target PARP-1-mediated autophagy activation on CP treatment in HepG2 cells. Although the role of Mh as an inhibitor of LPS-induced autophagic cell death in RAW 264.7 cells has already been reported, the mechanisms need to be explored [
24].
CP is a conventional platinum-based drug globally used to treat extremely progressive HCC. Even though responsiveness is high at the commencement, in due course, the cells start evolving resistance towards these drugs. Emerging evidences have demonstrated that PARP-1 overexpression leads to chemoresistance to cisplatin in non-small cell lung carcinoma [
25]. However, inhibition of PARP-1 expression induces increased sensitivity towards the cell death in breast cancer cells [
26]. Moreover, it has also been shown that PARP-1 is capable of poly-ADP-ribosylation of HMGB1 to induce chemoresistance through autophagy activation in Jurkat cells (human T lymphocyte cells), mouse embryonic fibroblast cells and HepG2
DR cells [
11]. These cells were sensitized towards drugs by 4-amino-1, 8-naphthalimide and ethyl pyruvate. These studies determine that endogenous PARP-1 induces innumerable factors in cancer cells which account for the development of chemo-resistance [
11,
27,
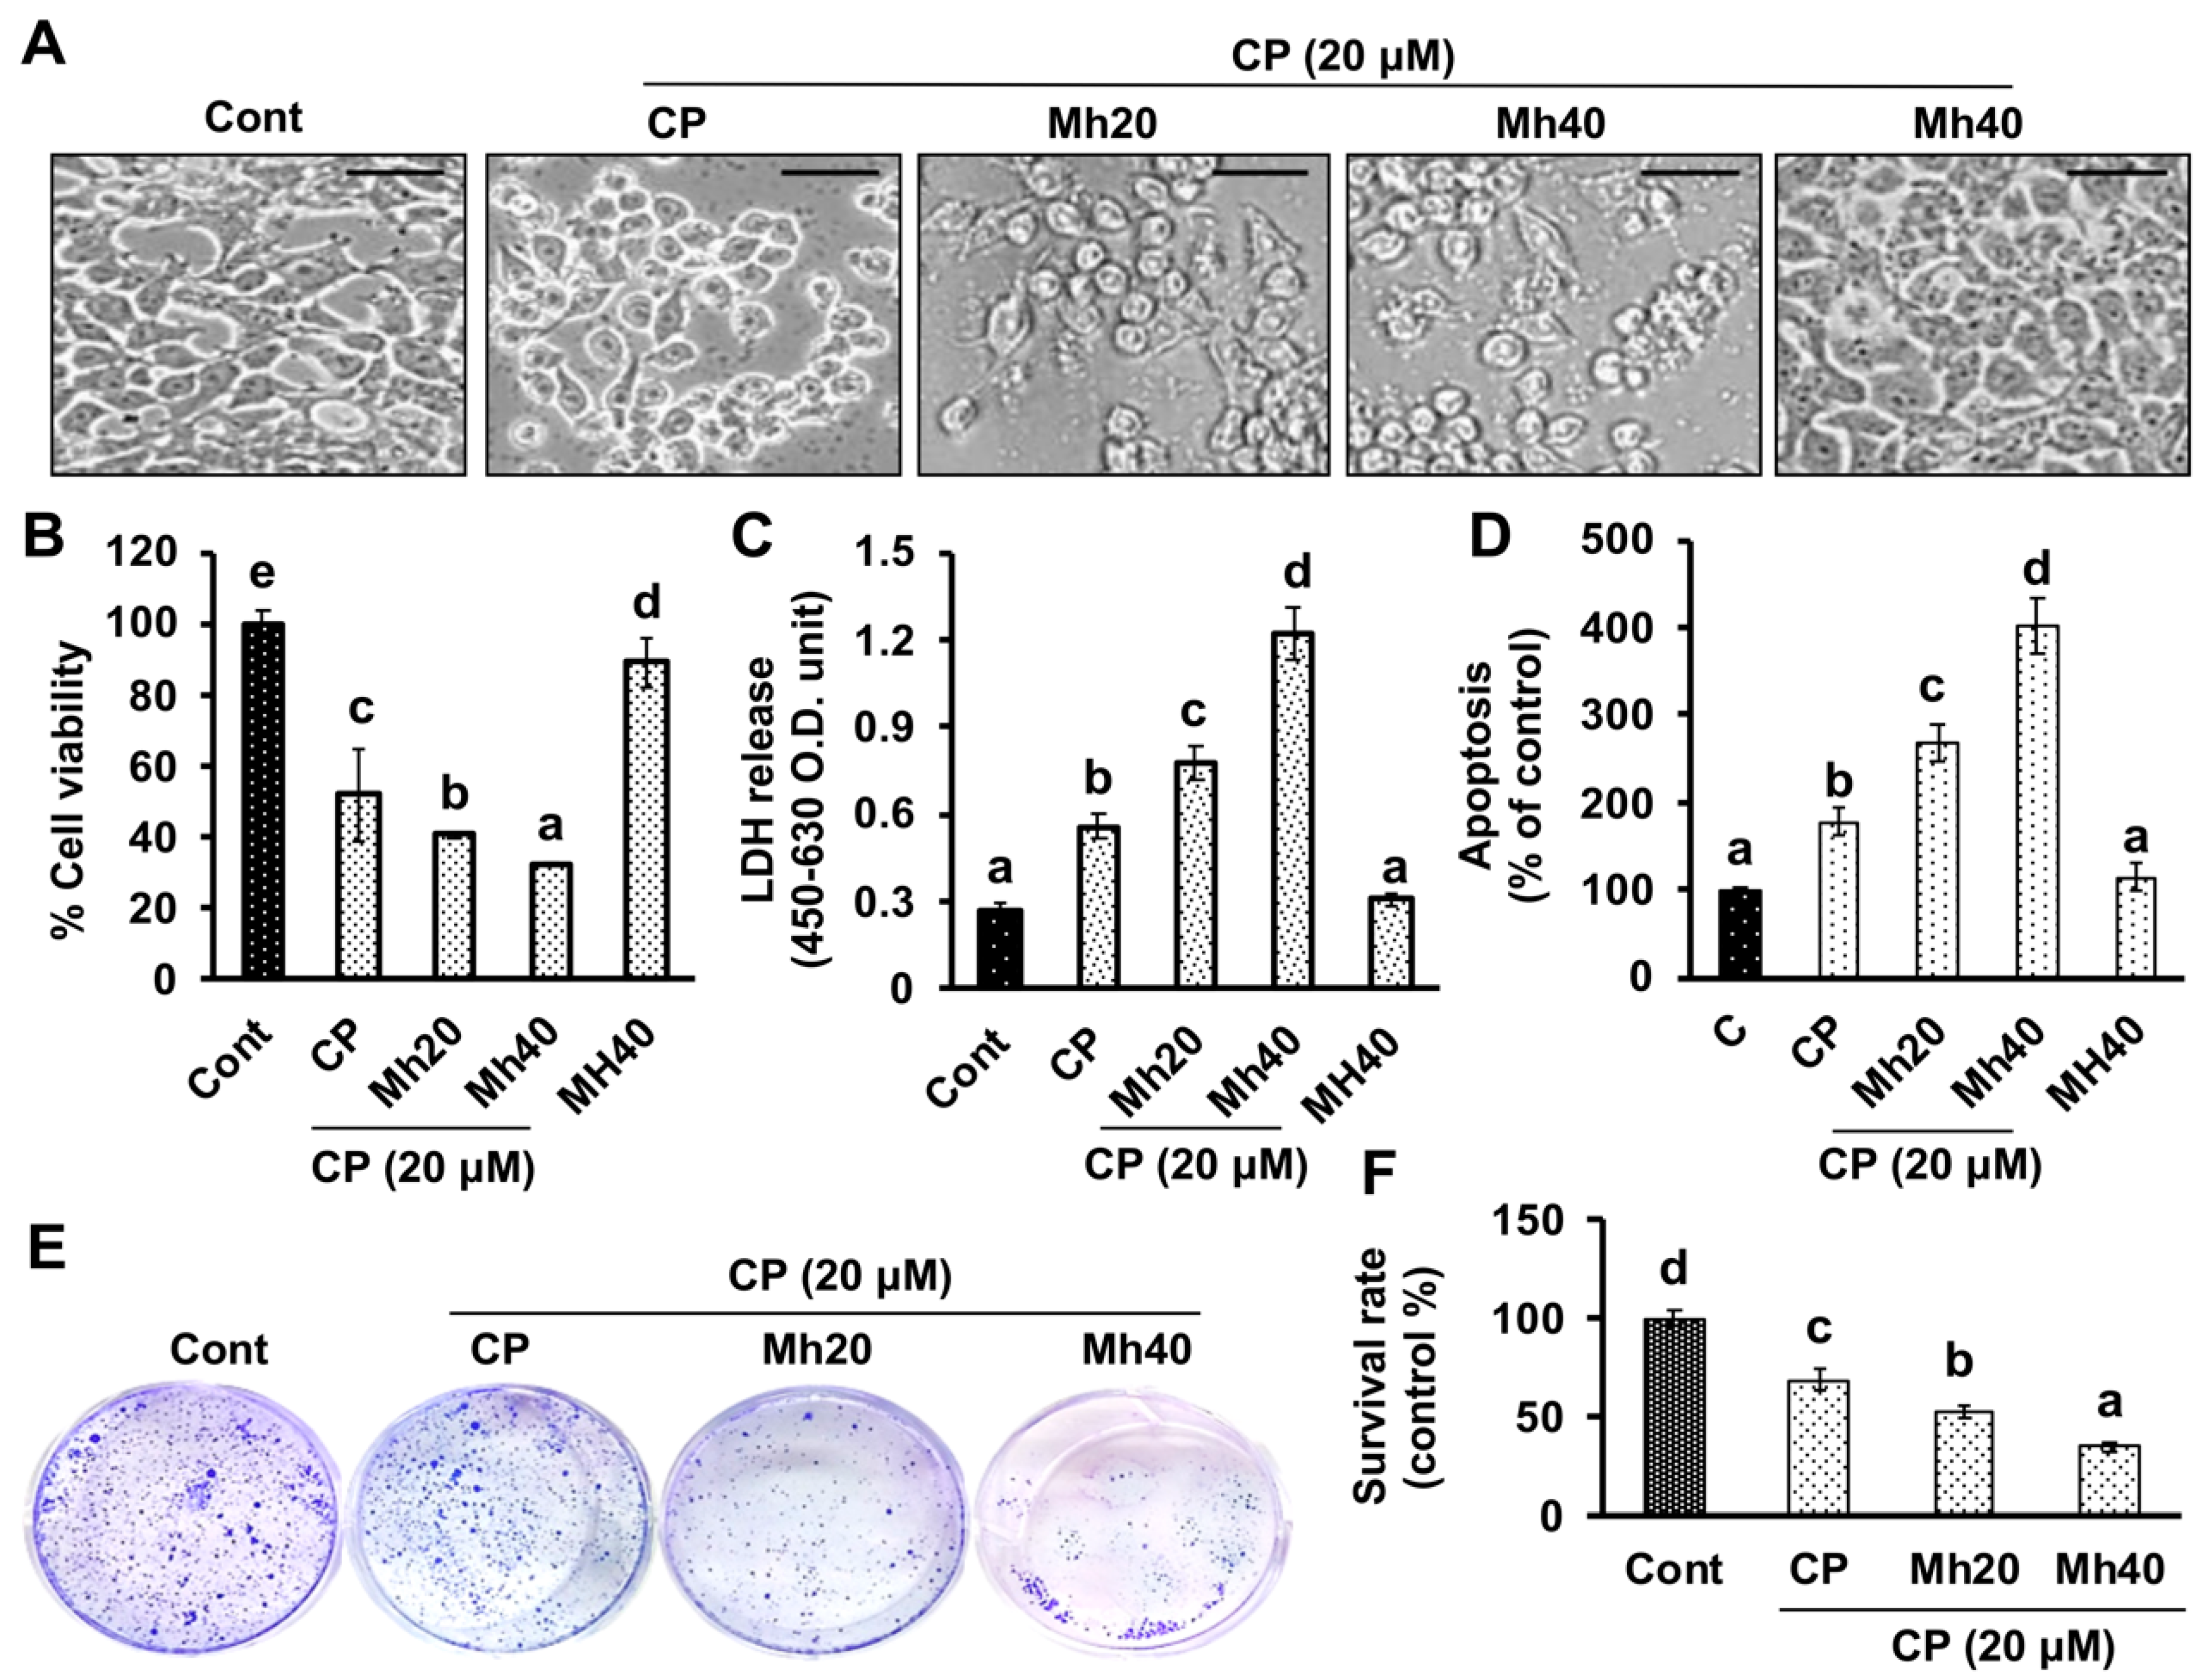
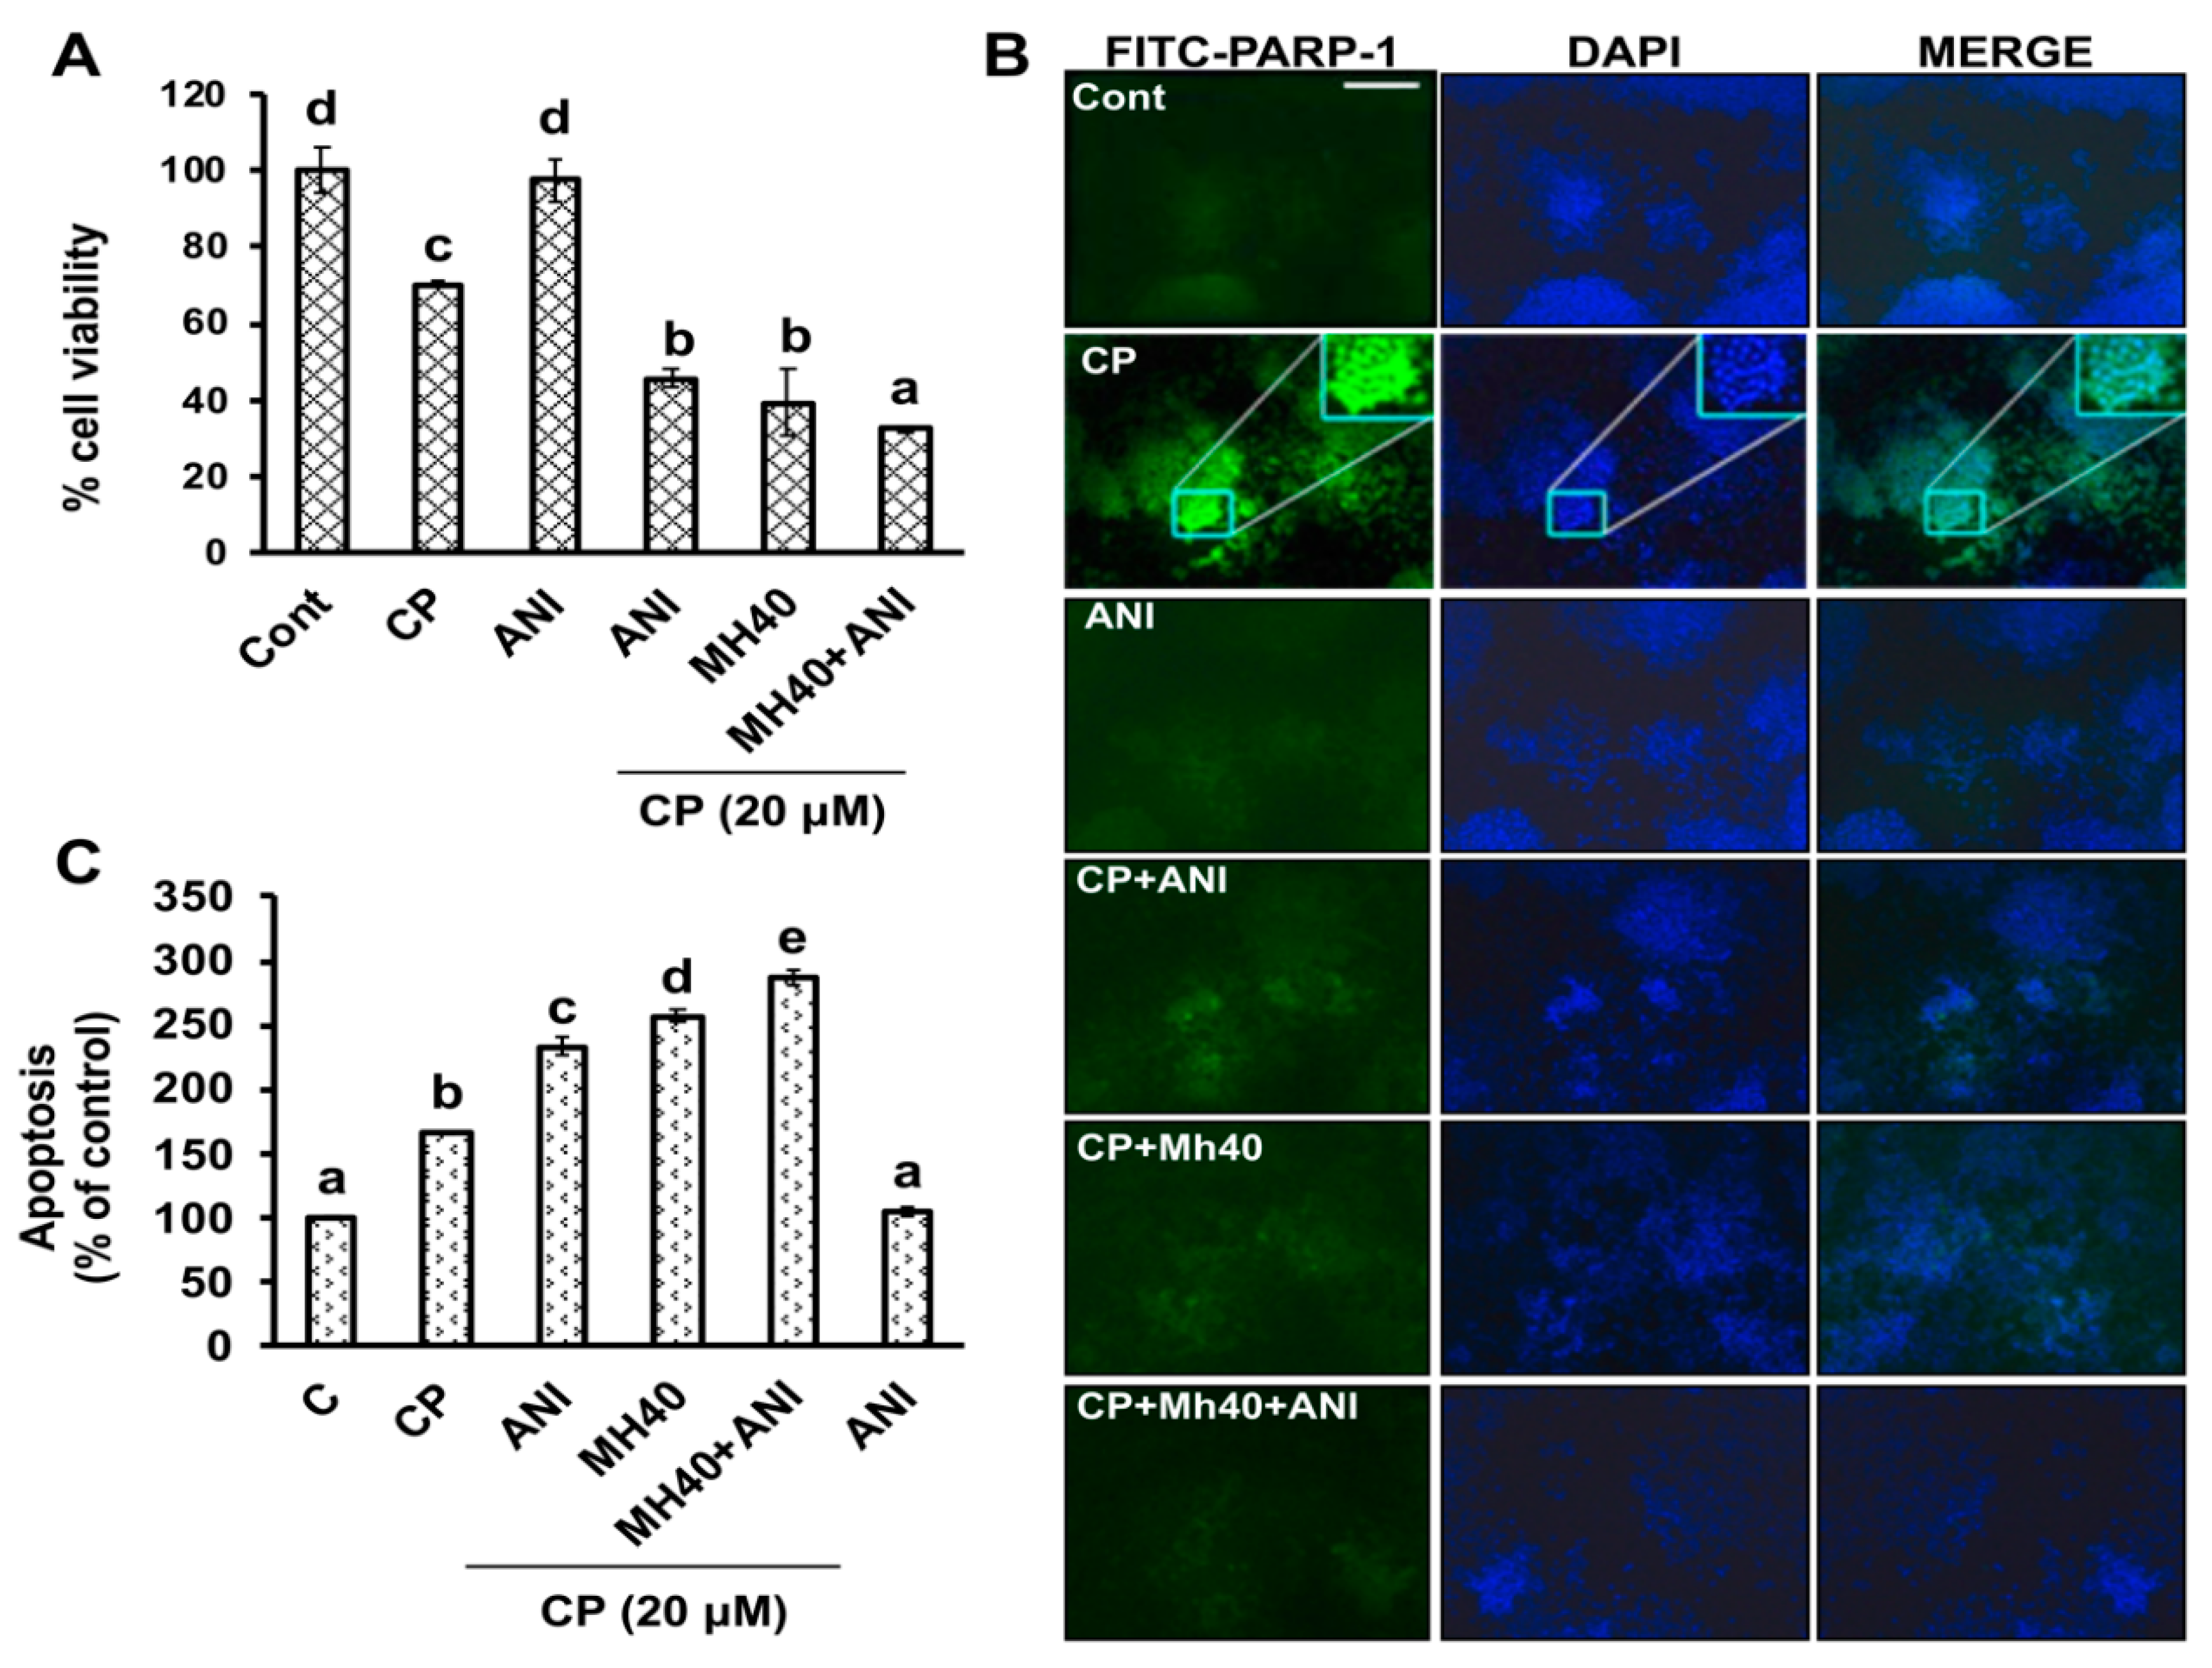
28]. In our study, we demonstrate that HepG2 cells were able to sensitize against CP in the presence of Mh by targeting PARP-1. We also found that a PARP-1 inhibitor such as ANI could sensitize the HepG2 cells towards CP treatment, which was comparable with Mh. This suggests that the increase in the level of PARP-1 can develop chemoresistance in HepG2 cells and confirms the role of PARP-1 in chemo-resistance, similar to our previous findings [
11].
Previous studies have reported that autophagy reduces the sensitivity of chemotherapeutic agents against cancer cells by decreasing the apoptotic potential of drugs [
19]. Although the molecular mechanism of developing chemoresistance by autophagy is as yet unclear, this has led autophagy to be a fundamental target to disrupt the chemoresistance in cancer cells. Studies have demonstrated that chemically induced excessive oxidative stress leads to DNA damage and further PARP-1 activation, consequently as a positive feedback mechanism that exacerbates necrotic cell death [
19]. PARP-1 activation following DNA damage results in the PARylation of several proteins, including PARP-1. In addition, PARP-1 is involved in autophagy activation, thus promoting cell survival [
11,
29]. CP-induced upregulation of the full-length PARP-1 correlated well with PAR formation, while the PARP-1 inhibitor ANI enhanced CP-induced cell death. The roles of PARP-1 inhibitors such as ANI and 3-AB in cancer chemotherapy have been reported previously [
11,
29]. PARylated PARP-1 is accompanied by obvious upregulation of HMGB1 and LC3II in breast cancer cells [
28,
30]. In this study, we observed significant development of ROS, DNA damage and induced expression of DNA damage associated protein such as H2AX and PARP-1. In addition, we also observed significant increase in comet tail and comet head diameter of CP-treated HepG2 cells. Moreover, we demonstrated that the induced PARP-1 expression increased the expression of LC3II in the progression of autophagy. However, these CP-induced changes in parameters were significantly mitigated after Mh treatment in a concentration-dependent manner in HepG2 cells, which progressed to apoptotic cell death. On the basis of current findings, we propose that PARP-1 is able to induce autophagic flux in response to CP treatment. However, the signaling mechanism needs to be elaborated in detail.
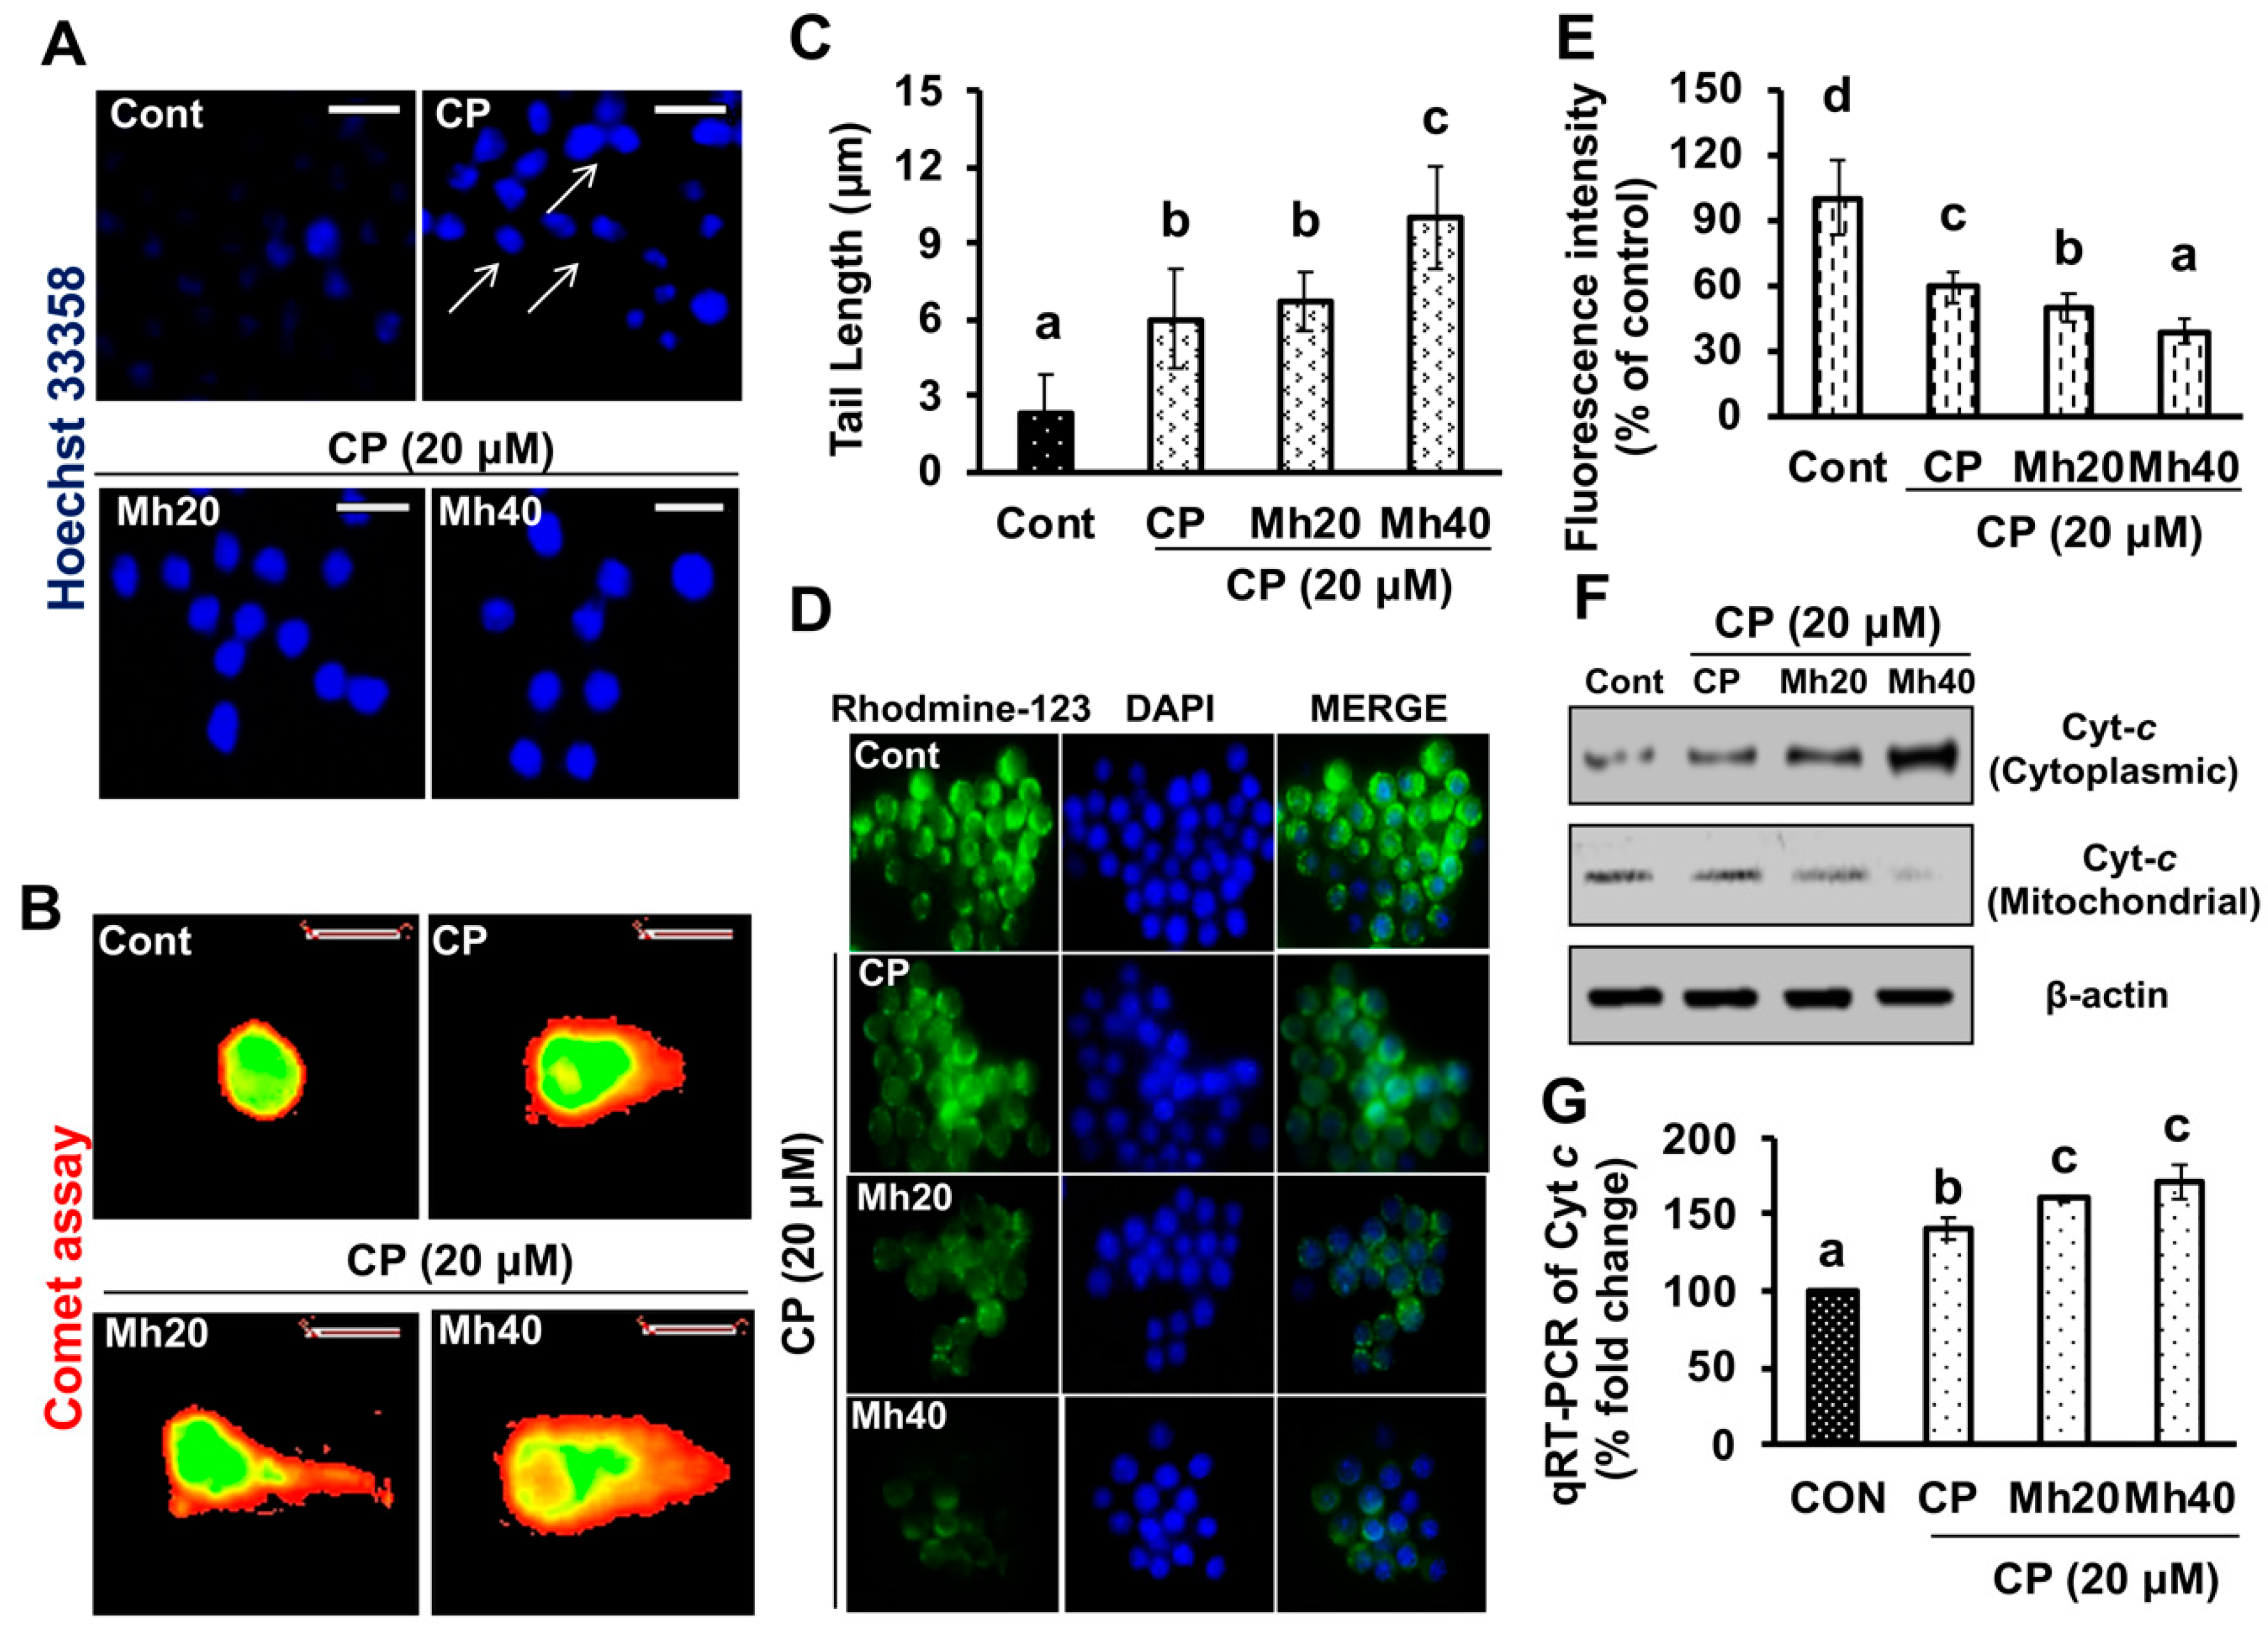
Previous researches have suggested that the cytosolic release of Cyt
c during apoptosis is sought to occur through the increase mitochondrial permeability, swelling and rupture of the mitochondrial outer membrane due to loss of mitochondrial membrane potential by chemotherapeutic drugs [
31]. It has further been reported that cisplatin-based chemotherapies induce apoptosis by reducing the mitochondrial membrane potential in ovarian cancer cells [
32]. Conversely, cancer cells have developed strategies like autophagy to protect drug-induced mitochondrial damage. A recent report has published that, in ovarian cells, increased autophagy activation diminishes mitochondrial apoptosis and membrane potential loss induced by CP [
33]. However, inhibition of autophagy with specific inhibitors and siRNA in cisplatin-treated ovarian cancer cells has augmented apoptosis through the mitochondrial signaling pathway [
33]. Above mentioned studies suggested that CP-induced autophagy is capable of inhibiting the mitochondrial membrane potential loss which provides chemoresistance towards certain types of cancers. In our previous and current study, we did find loss of mitochondrial membrane potential in CP-treated hepatoma cells with respect to control; this loss of MMP was significantly increased after combination treatment of CP and Mh [
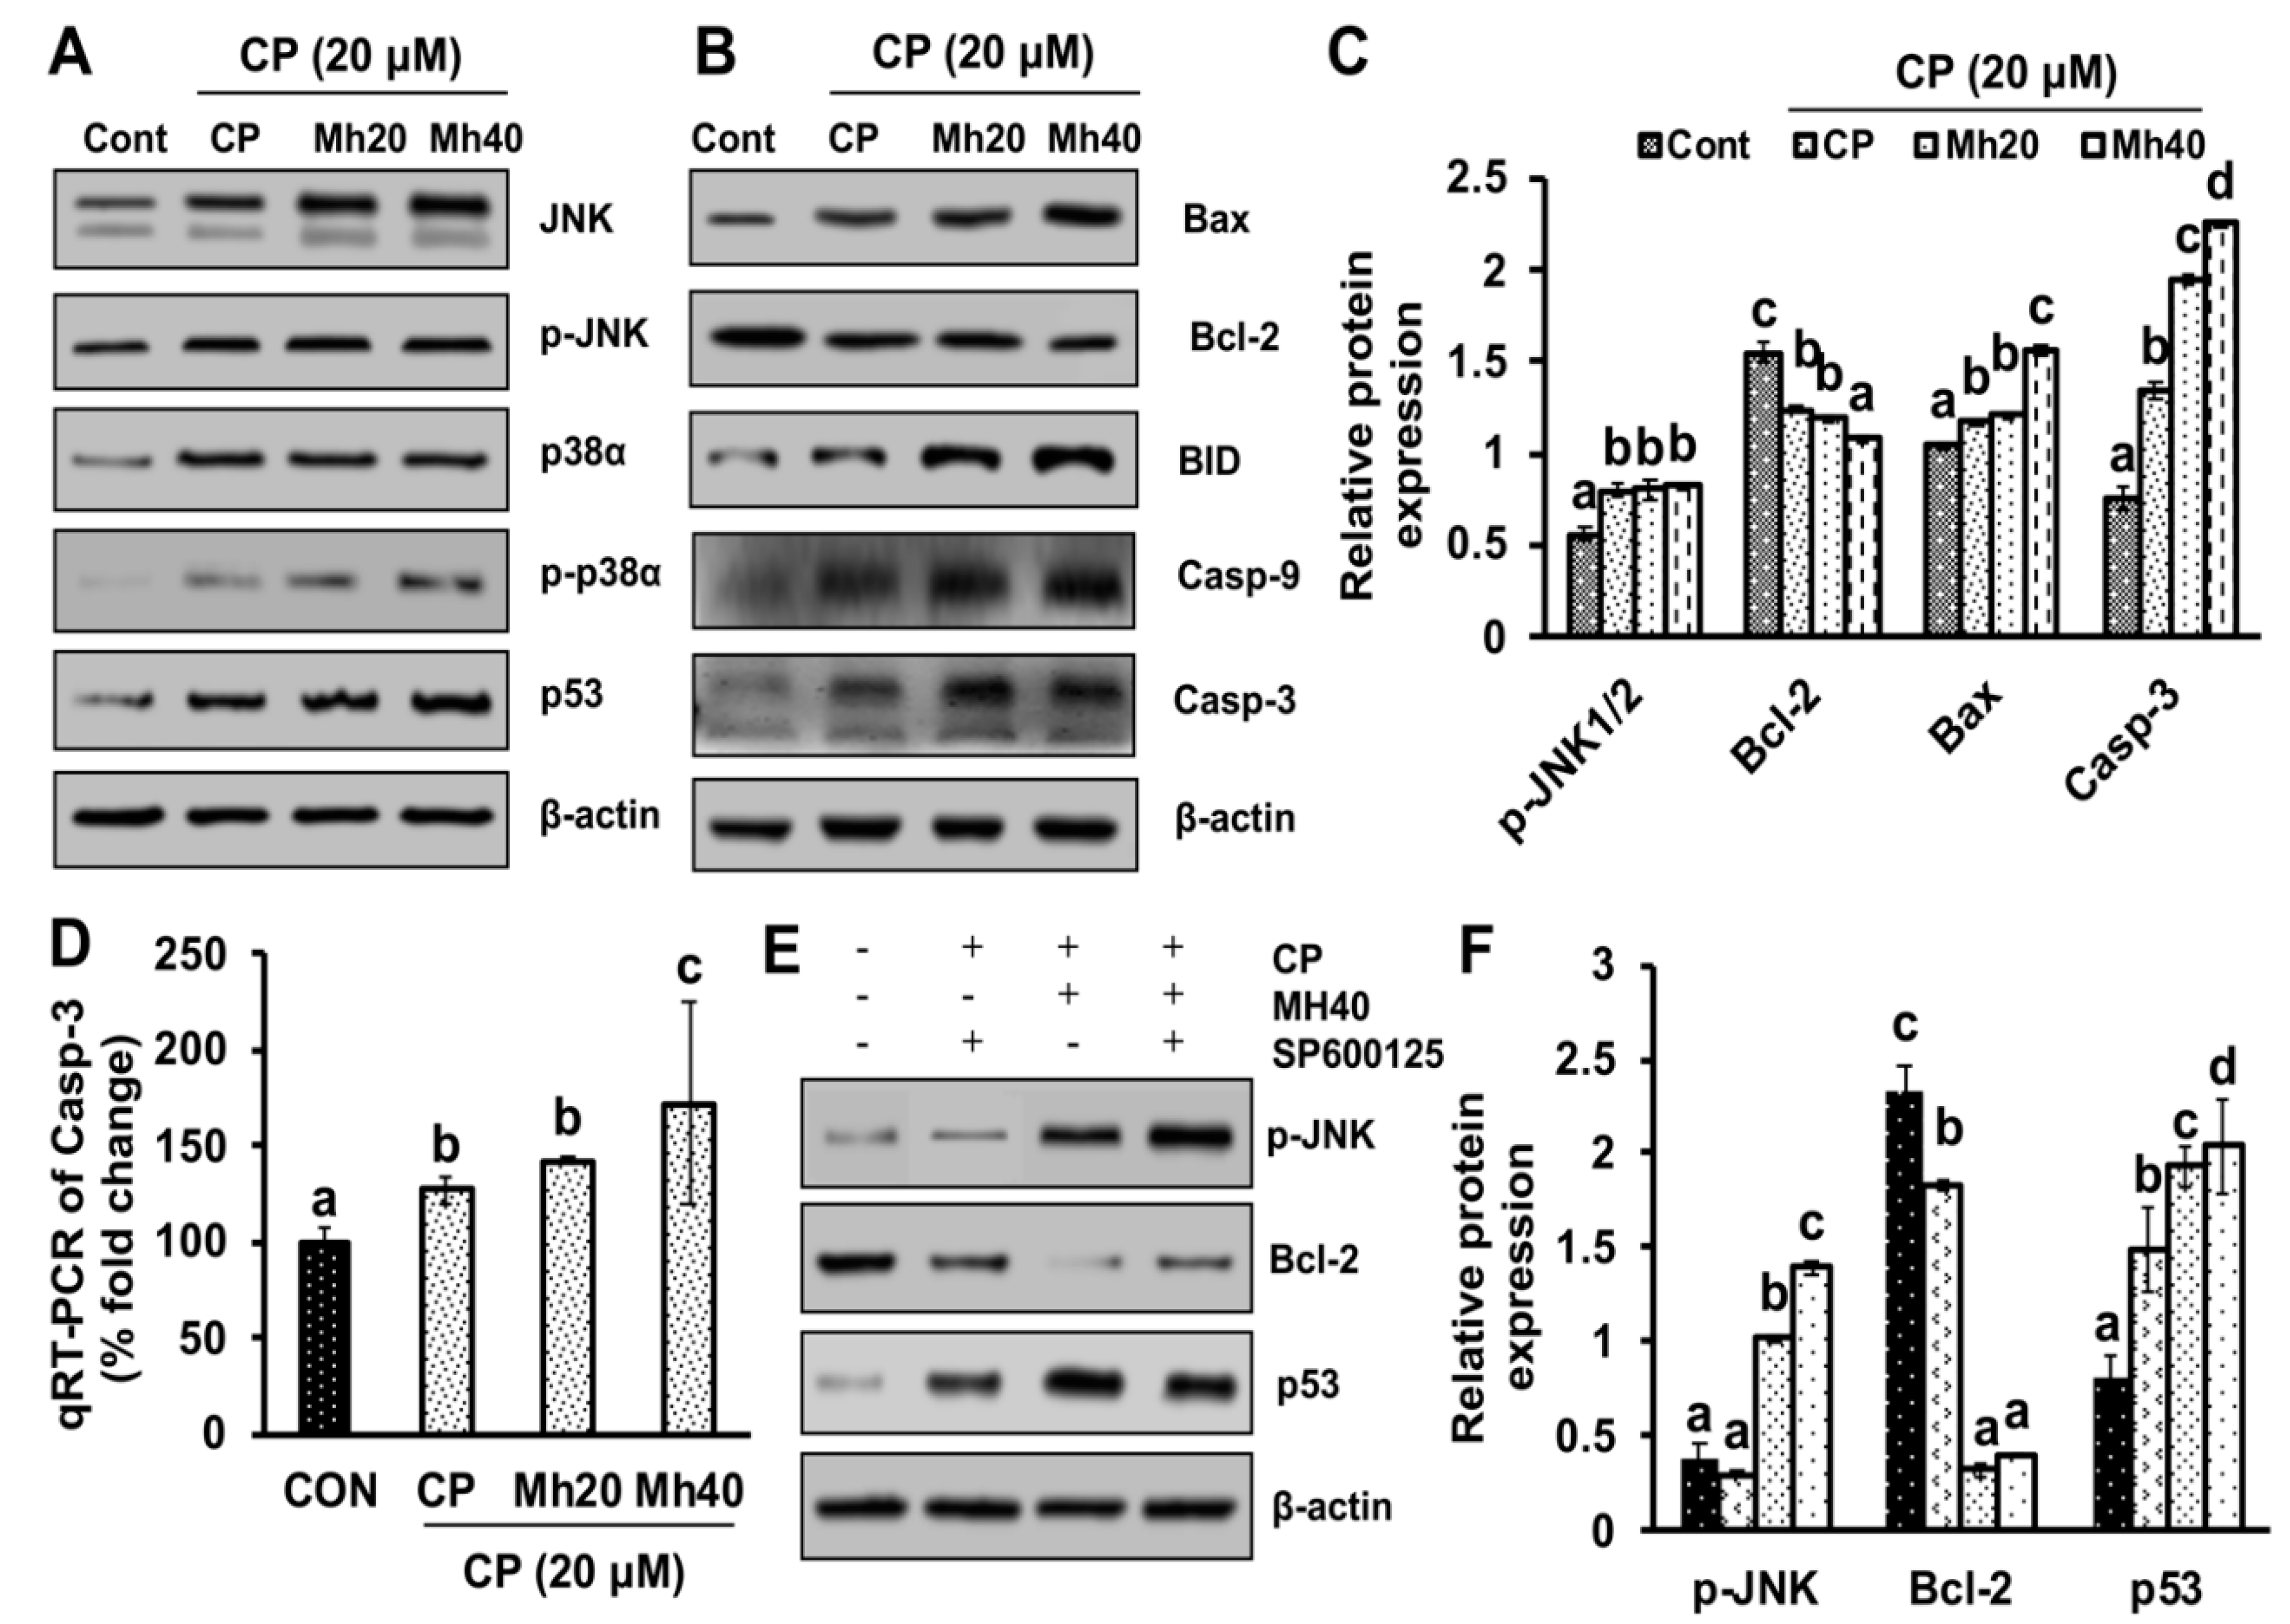
29]. Therefore, the results indicate that the PARP-1-triggered autophagy helps to suppress mitochondrial apoptosis and develops resistance to CP towards HepG2 cells. However, our results suggest that adjuvant effect of Mh with CP induces cell death in HepG2 cells, which is mediated by the JNK signaling pathway of apoptosis.
According to previous reports, chemical-induced oxidative stress leads to the development of ROS, which subsequently induces PARP-1 expression; the role of PARP-1 in Ca
++ efflux through endoplasmic reticulum (ER) has been evidenced in several studies [
34]. ER facilitates the proper proteins folding and serves as an intracellular Ca
++ store. ER stress appears in response to different physiological and pathological conditions, such as protein aggregation, limited protein glycosylation, lack of glucose and hypoxia [
35]. In these situations, a specific unfold protein response (UPR) pathway of nuclear signaling is activated, that results in the regulation of global protein synthesis and leads to increased production of proteins required for proper folding at ER, such as chaperones. GRP78 is a cytoprotective protein overexpressed by ER stress causing factors, such as unfolded protein response (UPR), intracellular Ca
++ efflux, glucose deprivation and pathological conditions [
36]. However, the up-regulation of GRP78 protein promotes cell survival; in that way helps the normal cells in tissue preservation and organ fortification. Conversely, it is also believed to cause immune resistance, induce tumor progression, malignancy and drug-resistance [
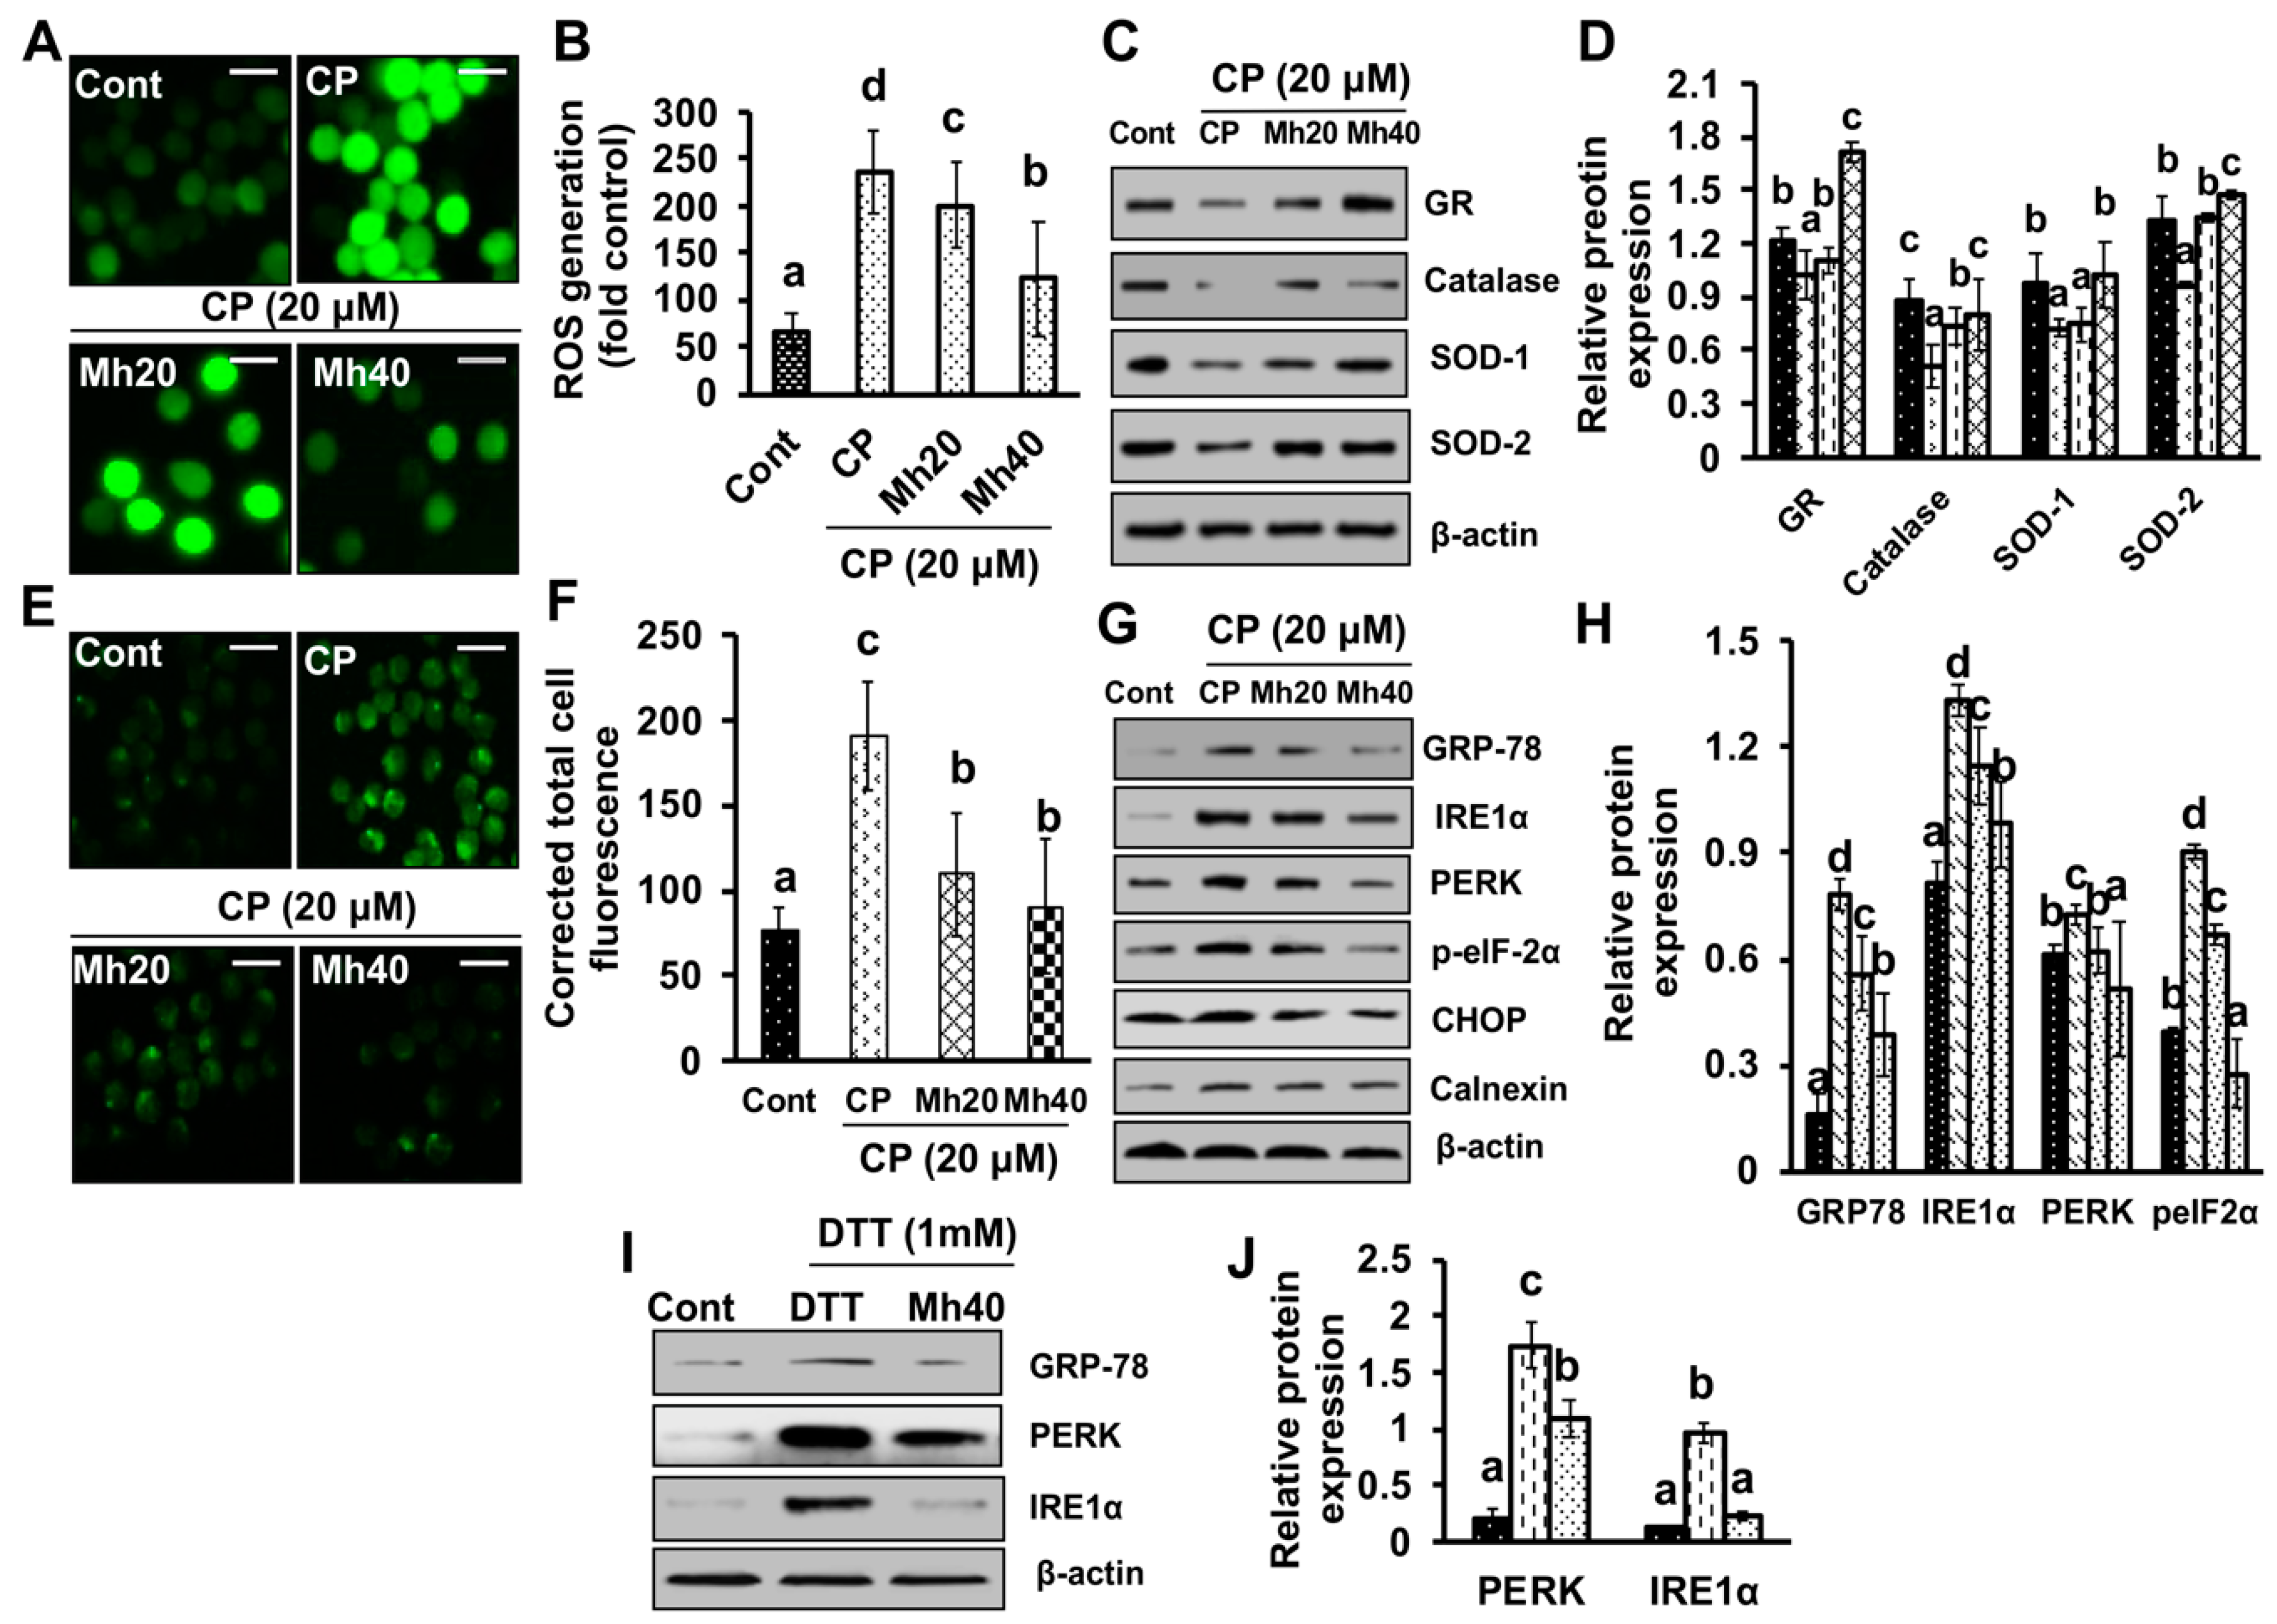
37]. In the present study, we found increased intracellular ROS production and Ca
++ release in CP-treated HepG2 cells. Moreover, the expression of IRE1α, calnexin and GRP78 was also increased. However, the expression of the above-stated parameters was significantly ameliorated in a concentration-dependent manner in CP-Mh-treated HepG2 cells. On the basis of our findings, we suggest that ER-stress positively regulates autophagy activation induced by CP treatment in HepG2 cells. We also suggest that in an oxidant milieu, co-treatment of Mh and CP creates an anti-oxidant environment that protects the host from the prevalence of HepG2 cells.
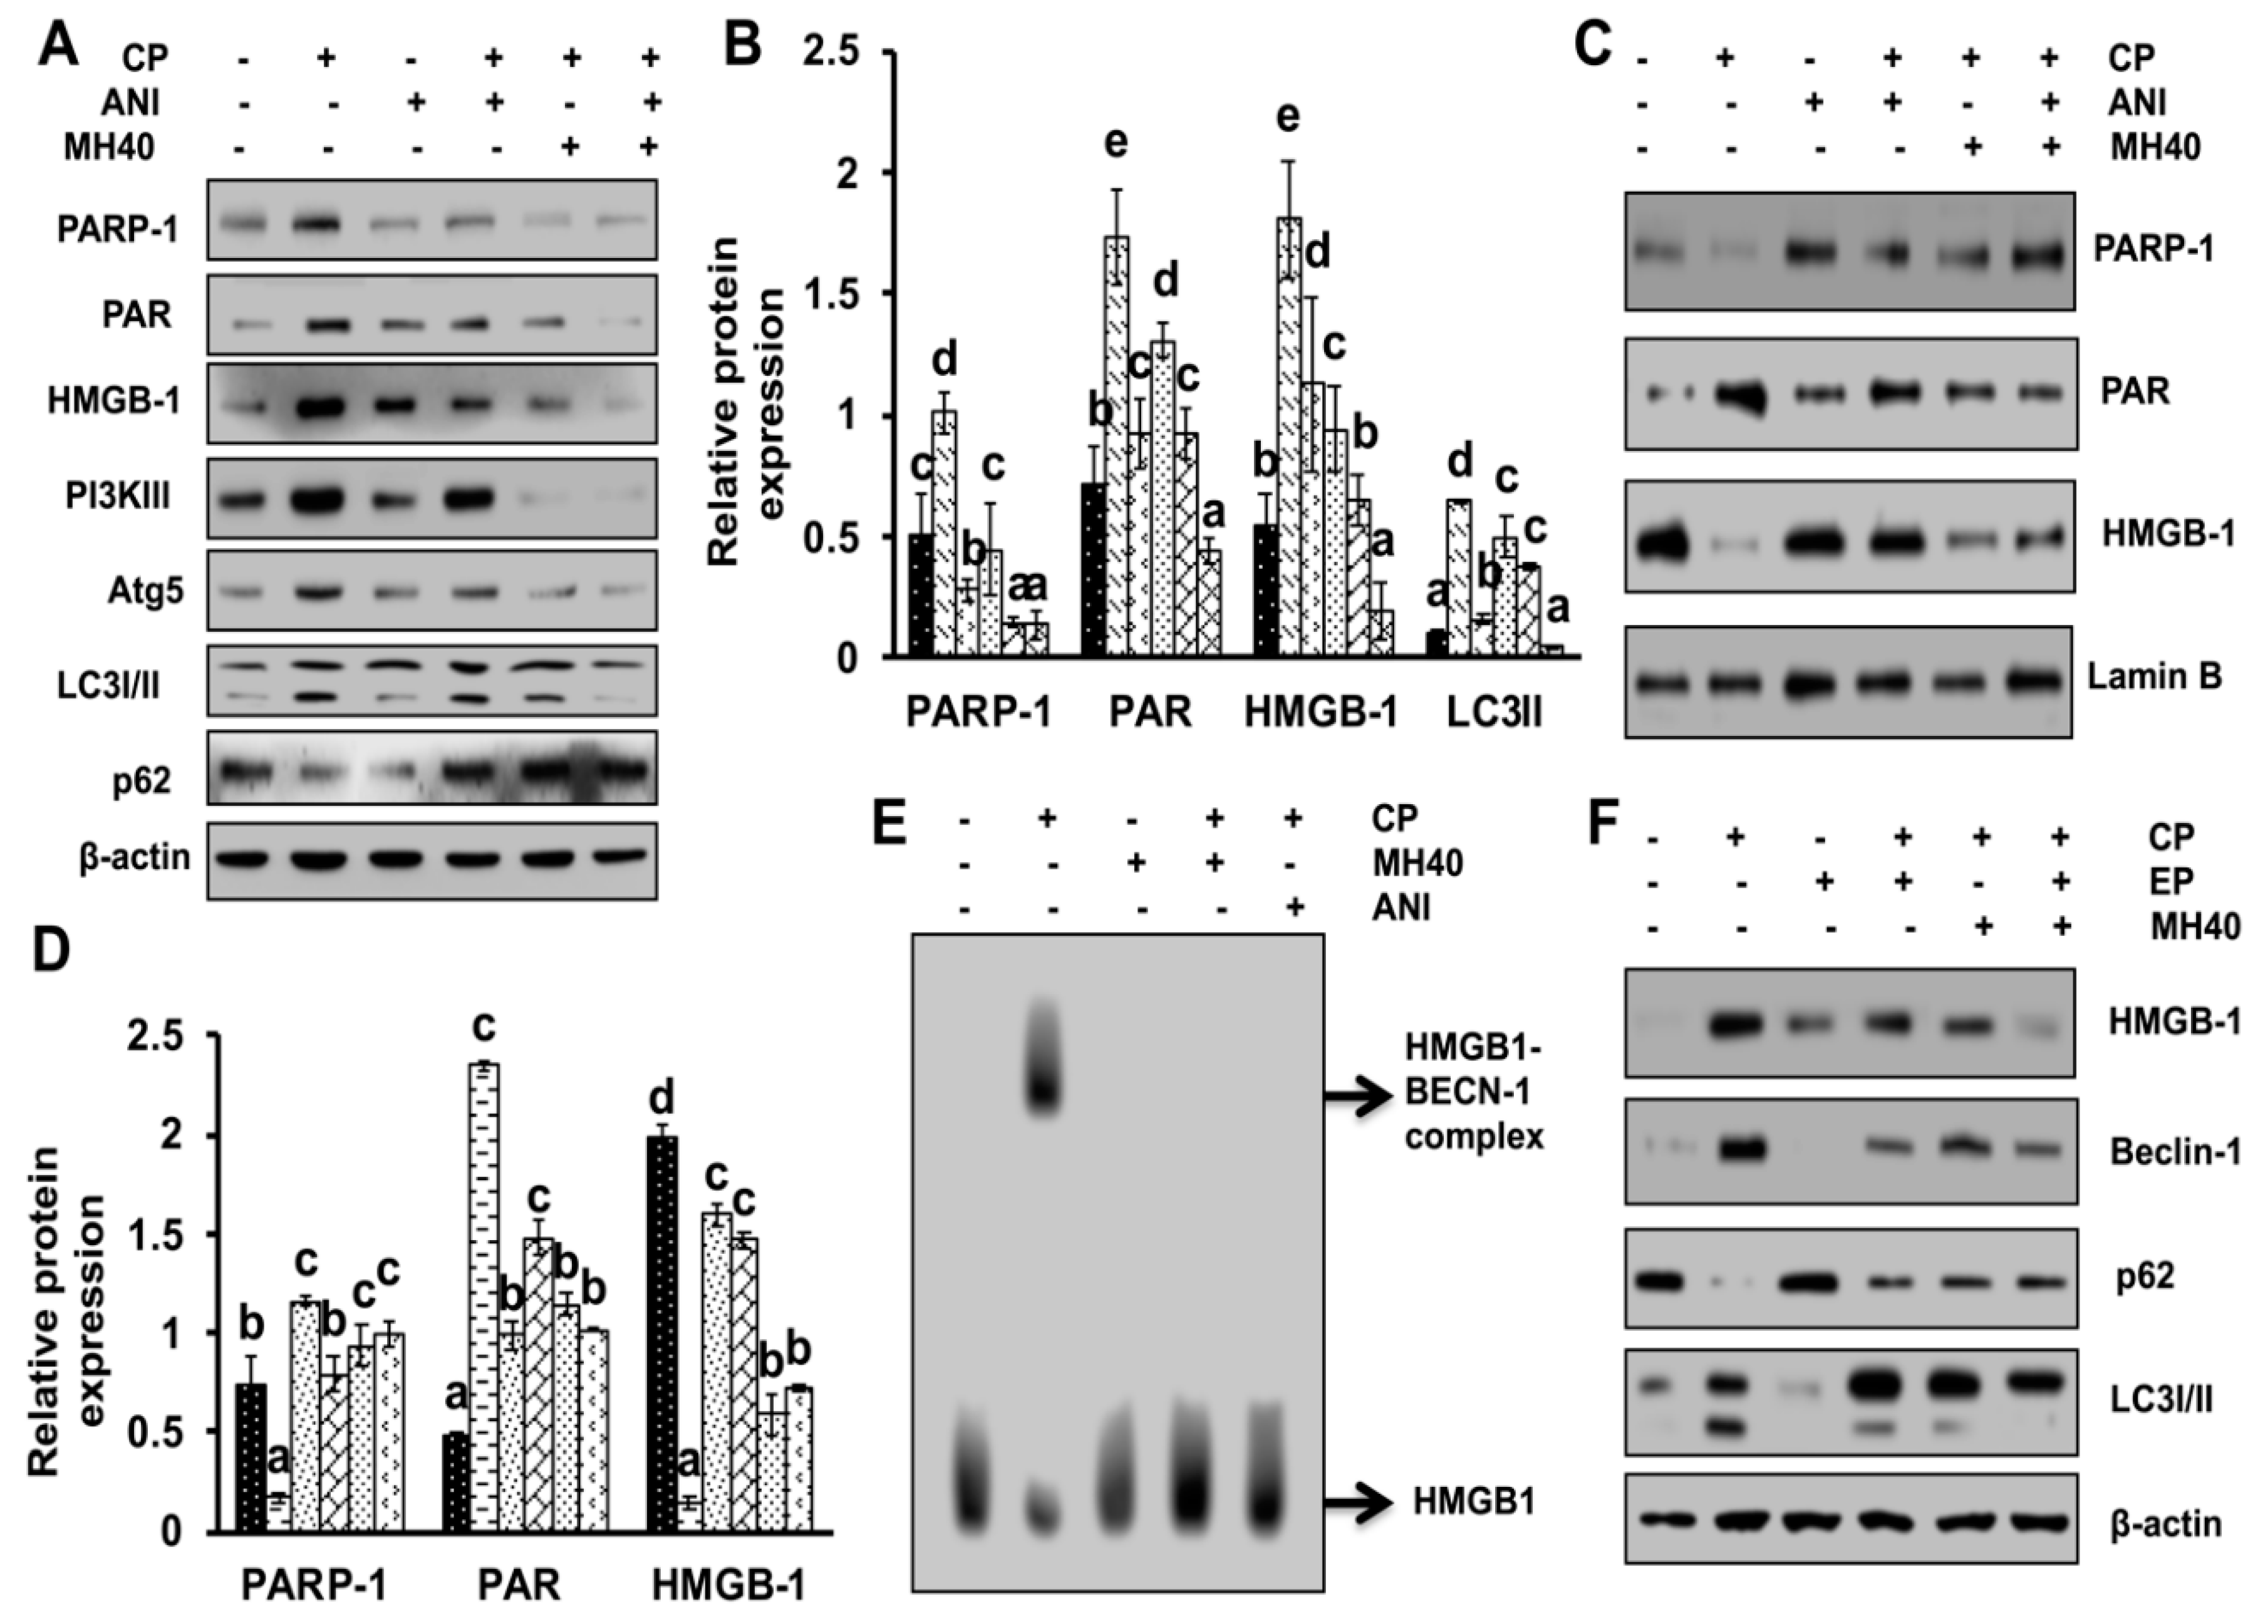
To validate whether CP-induced PARP-1 develops autophagy-mediated chemo-resistance in HepG2 cells, we found PARP-1 to be the key molecule that induces HMGB1-mediated autophagy activation [
11]. It has been demonstrated that autophagic stimuli promote HMGB1 translocation and direct interaction with Beclin1 in the cytosol to induce autophagy [
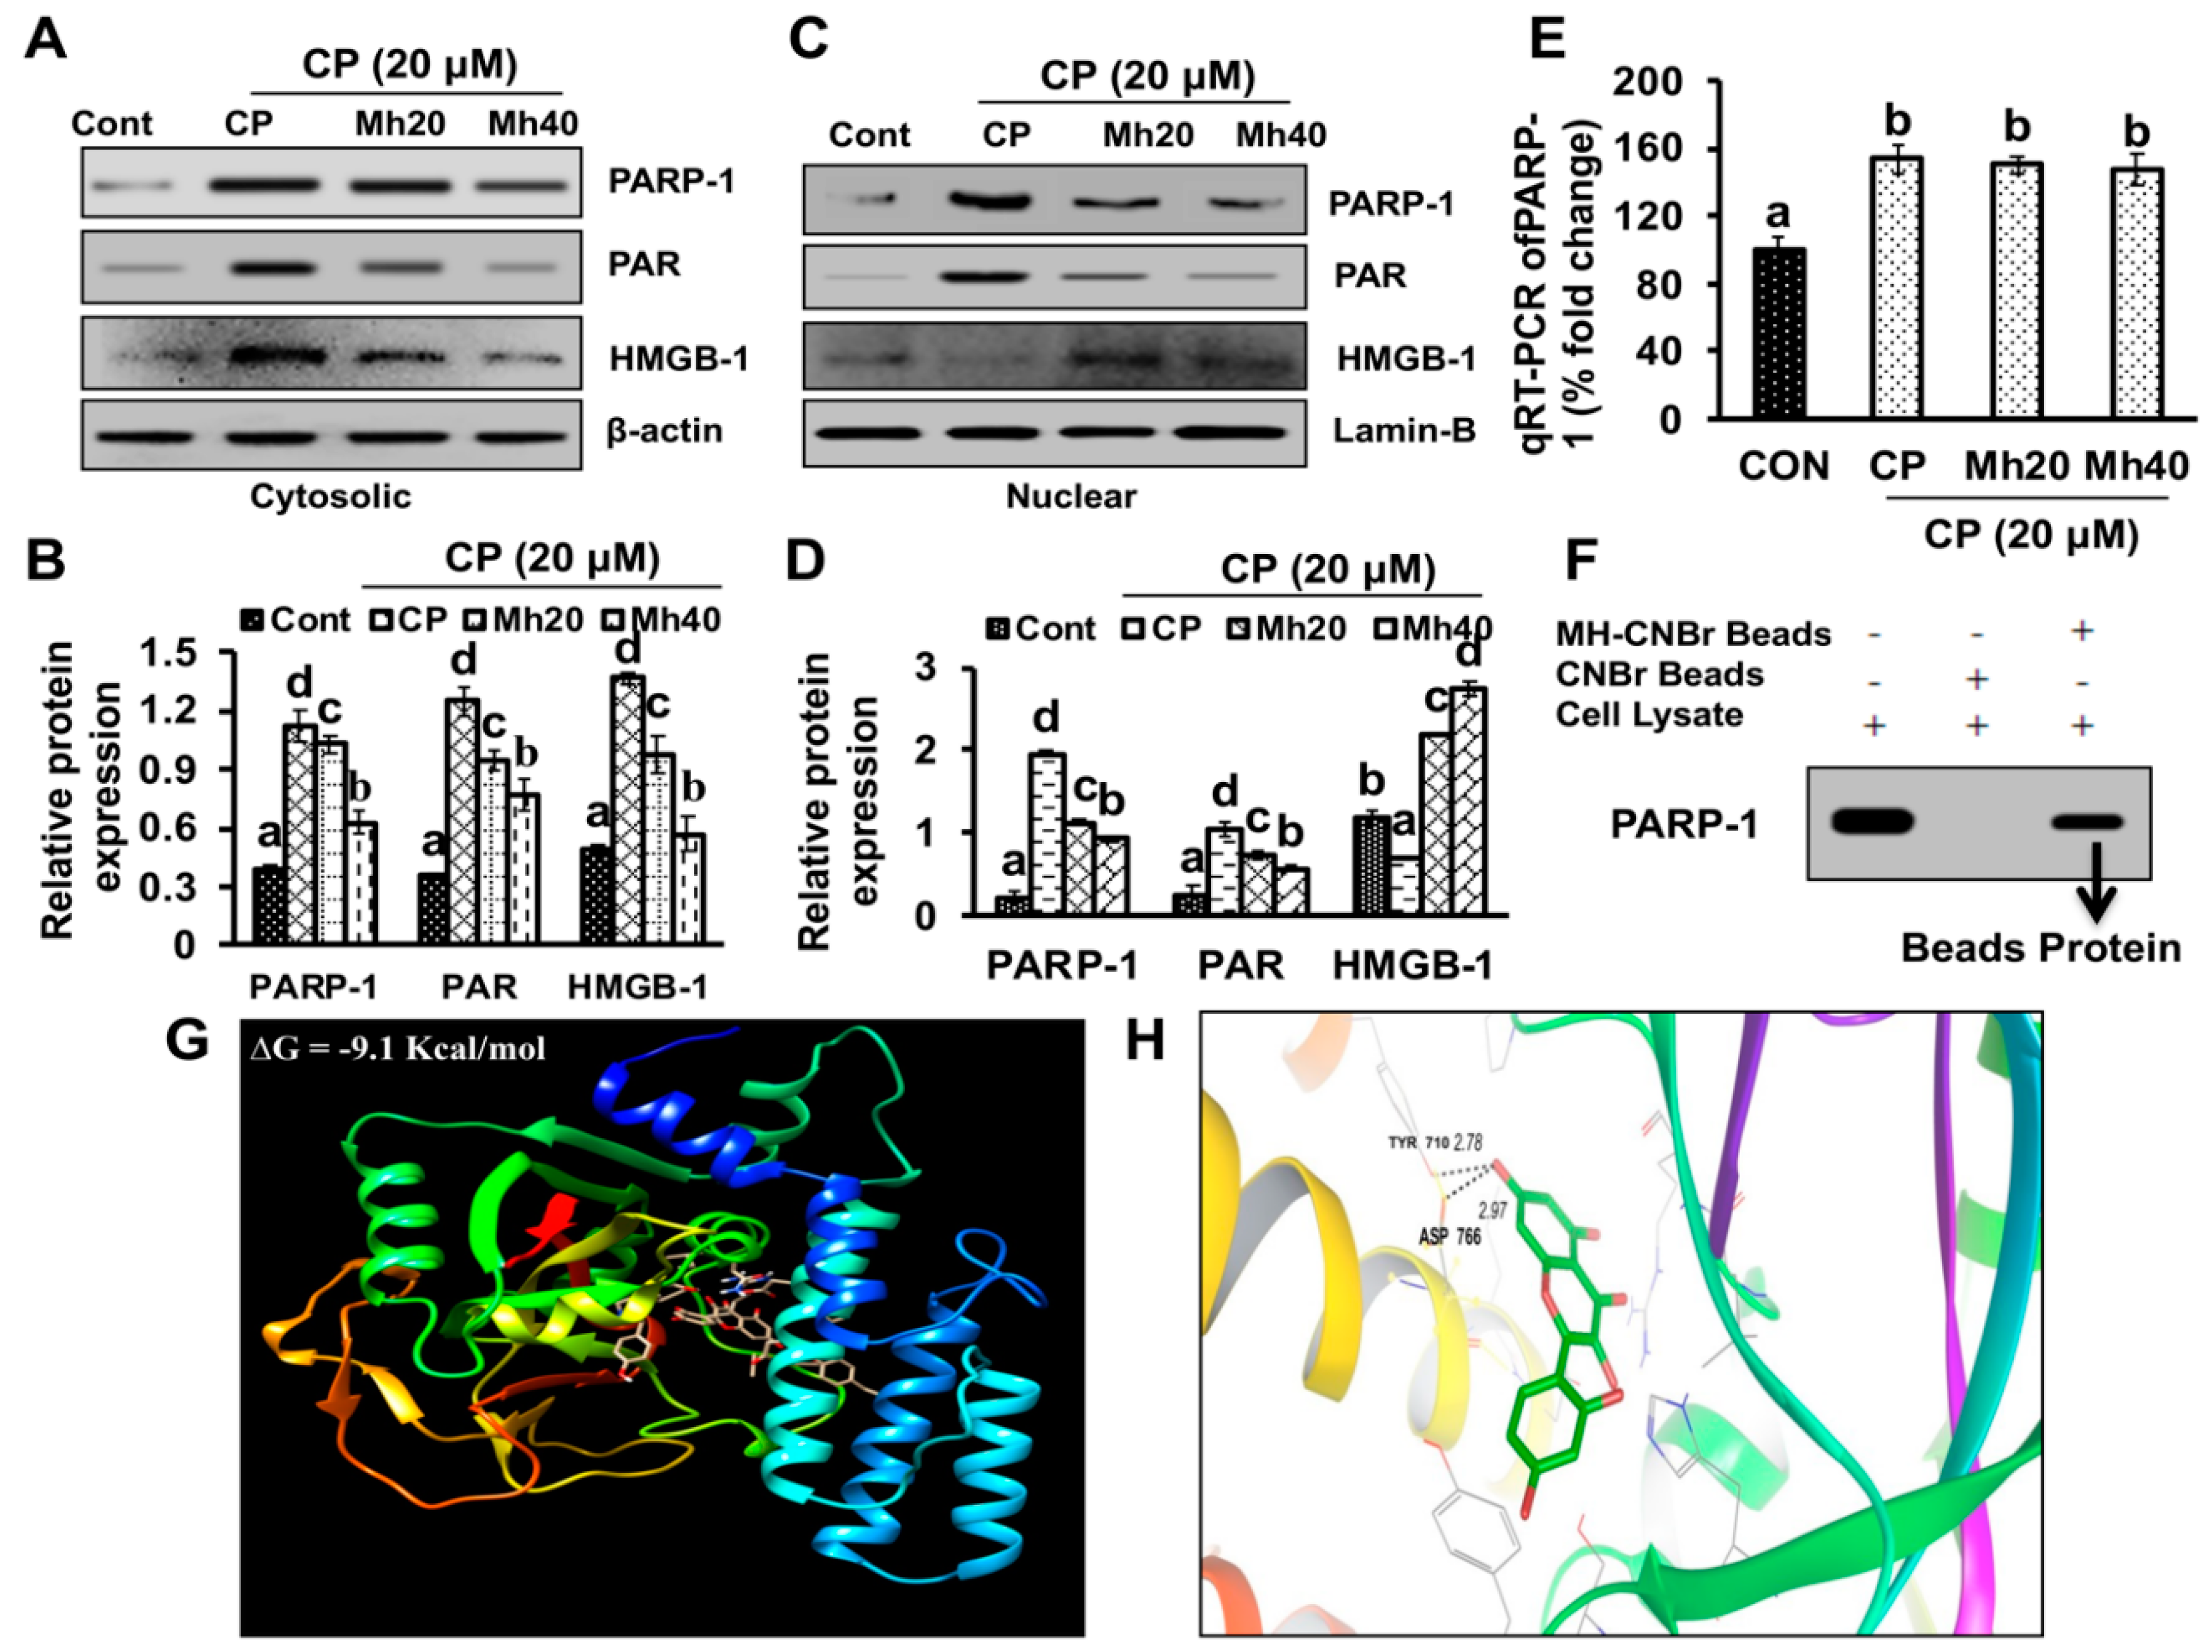
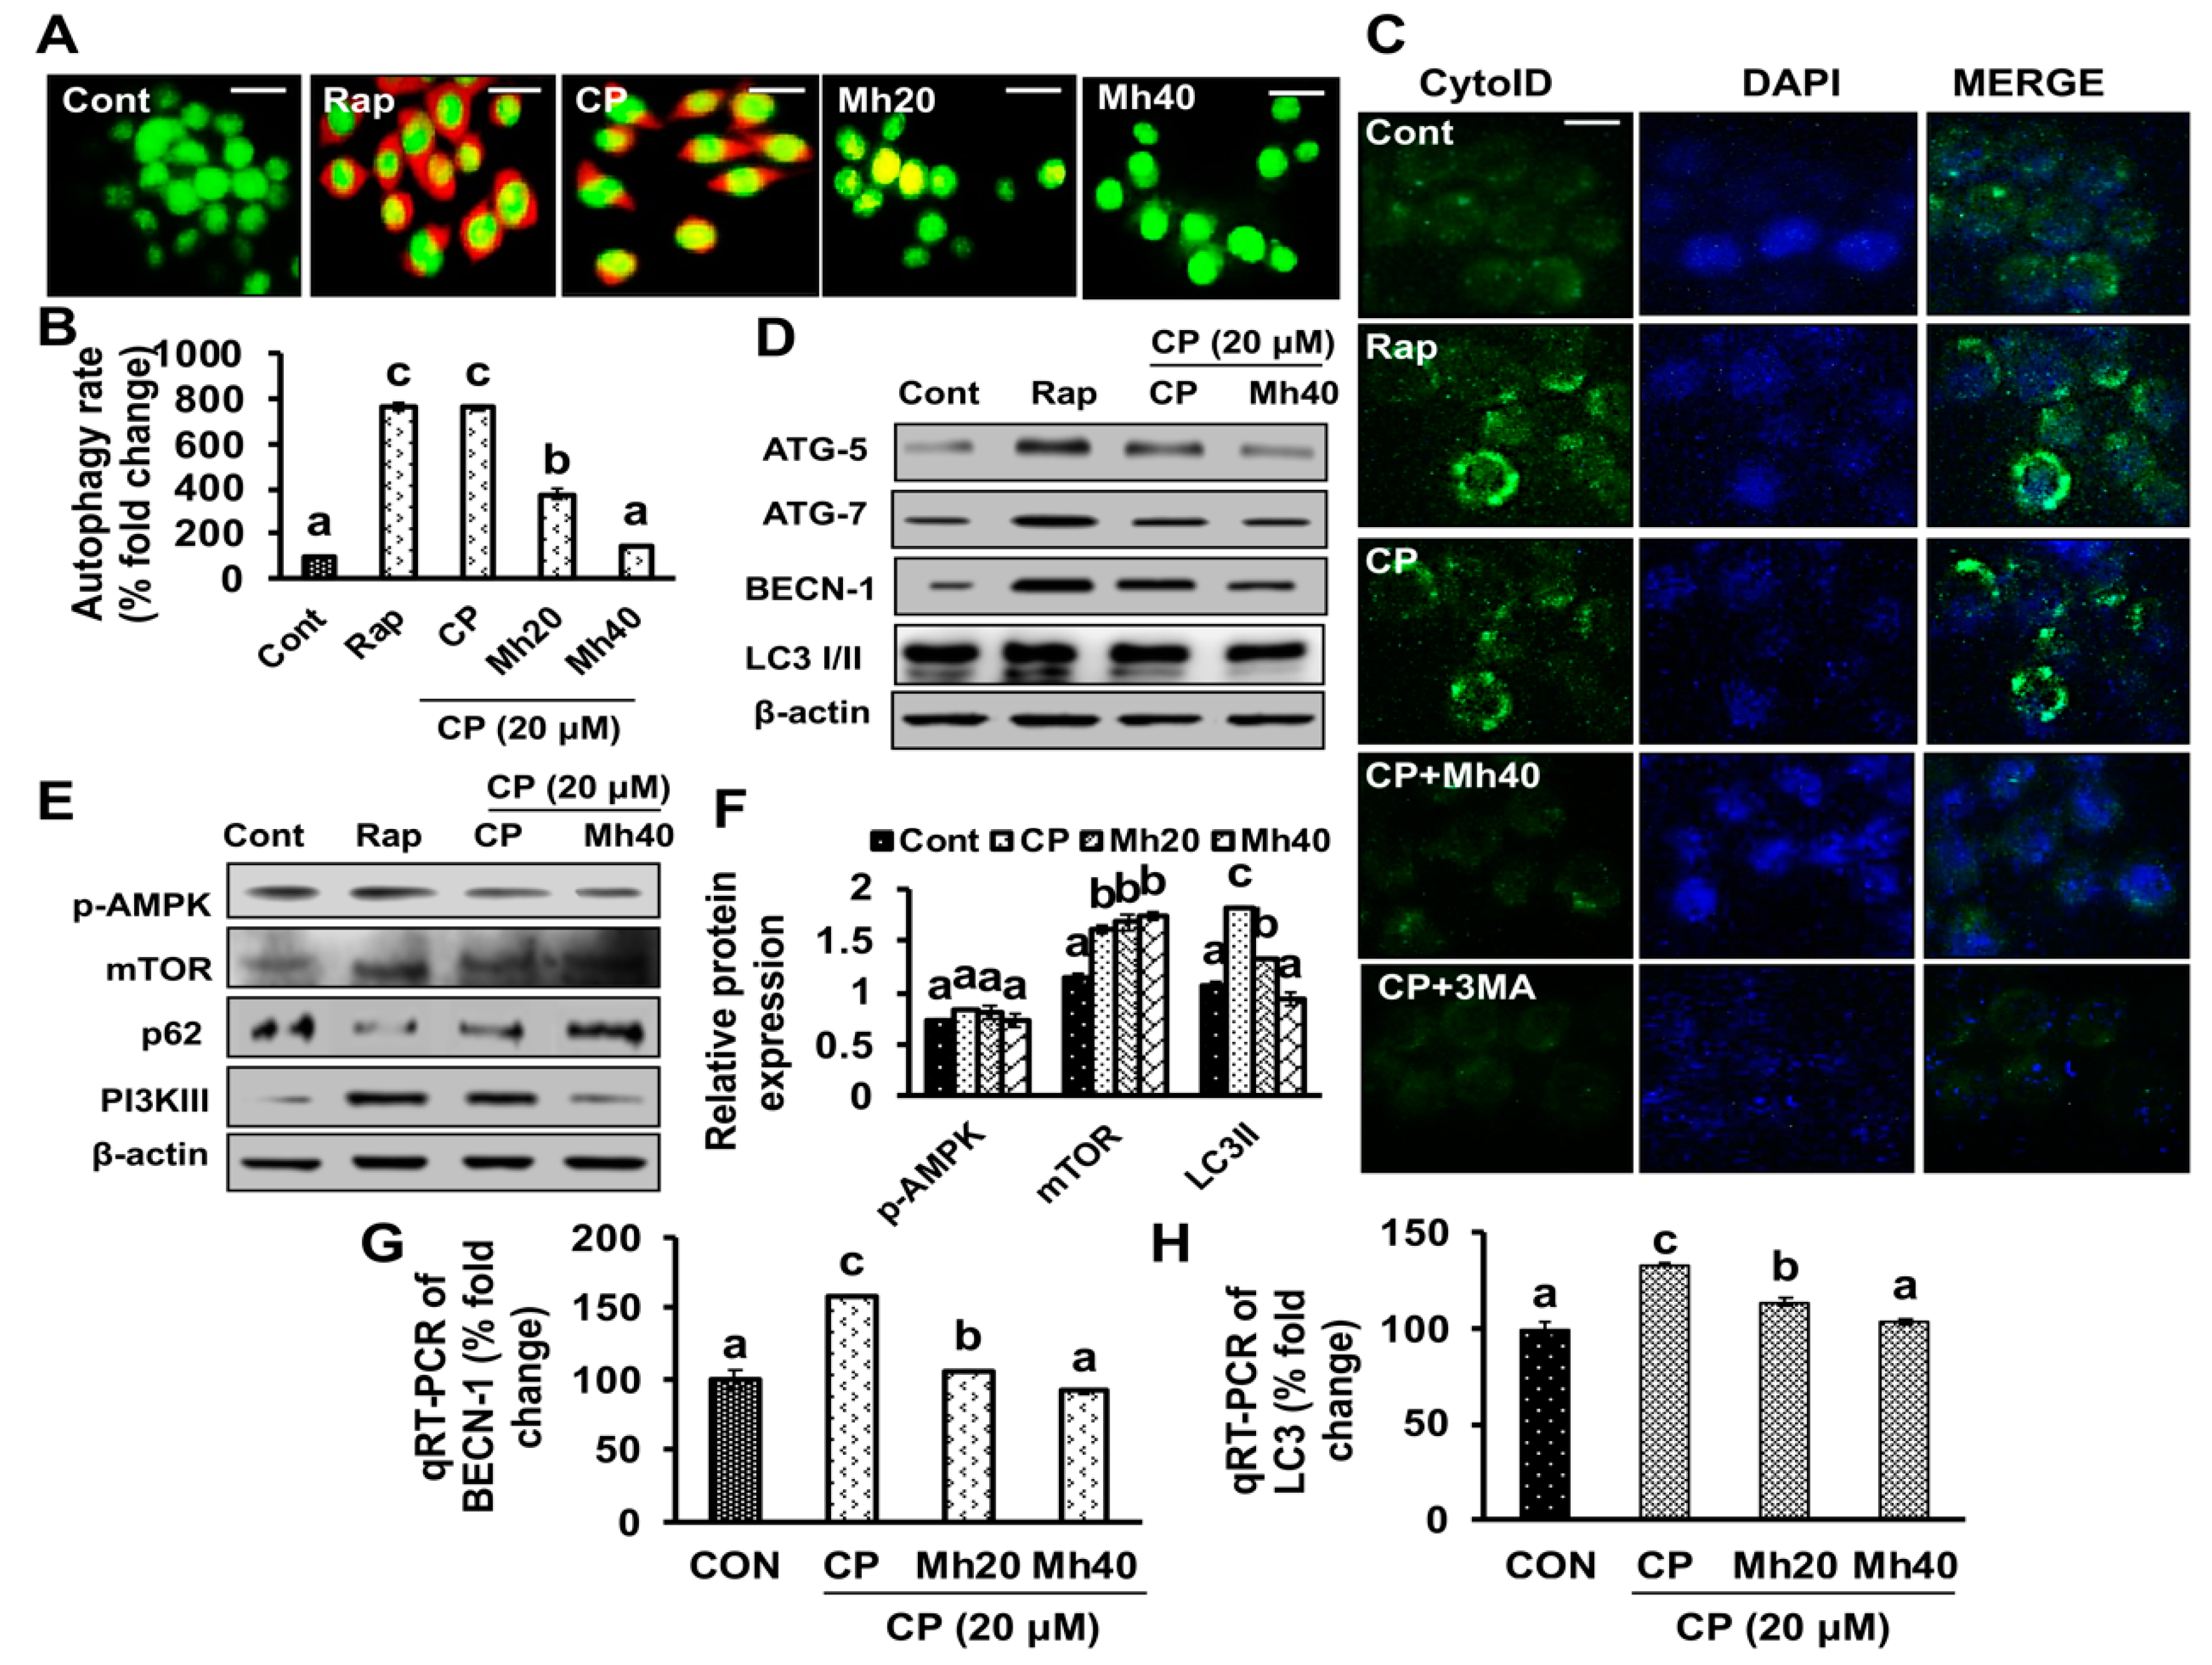
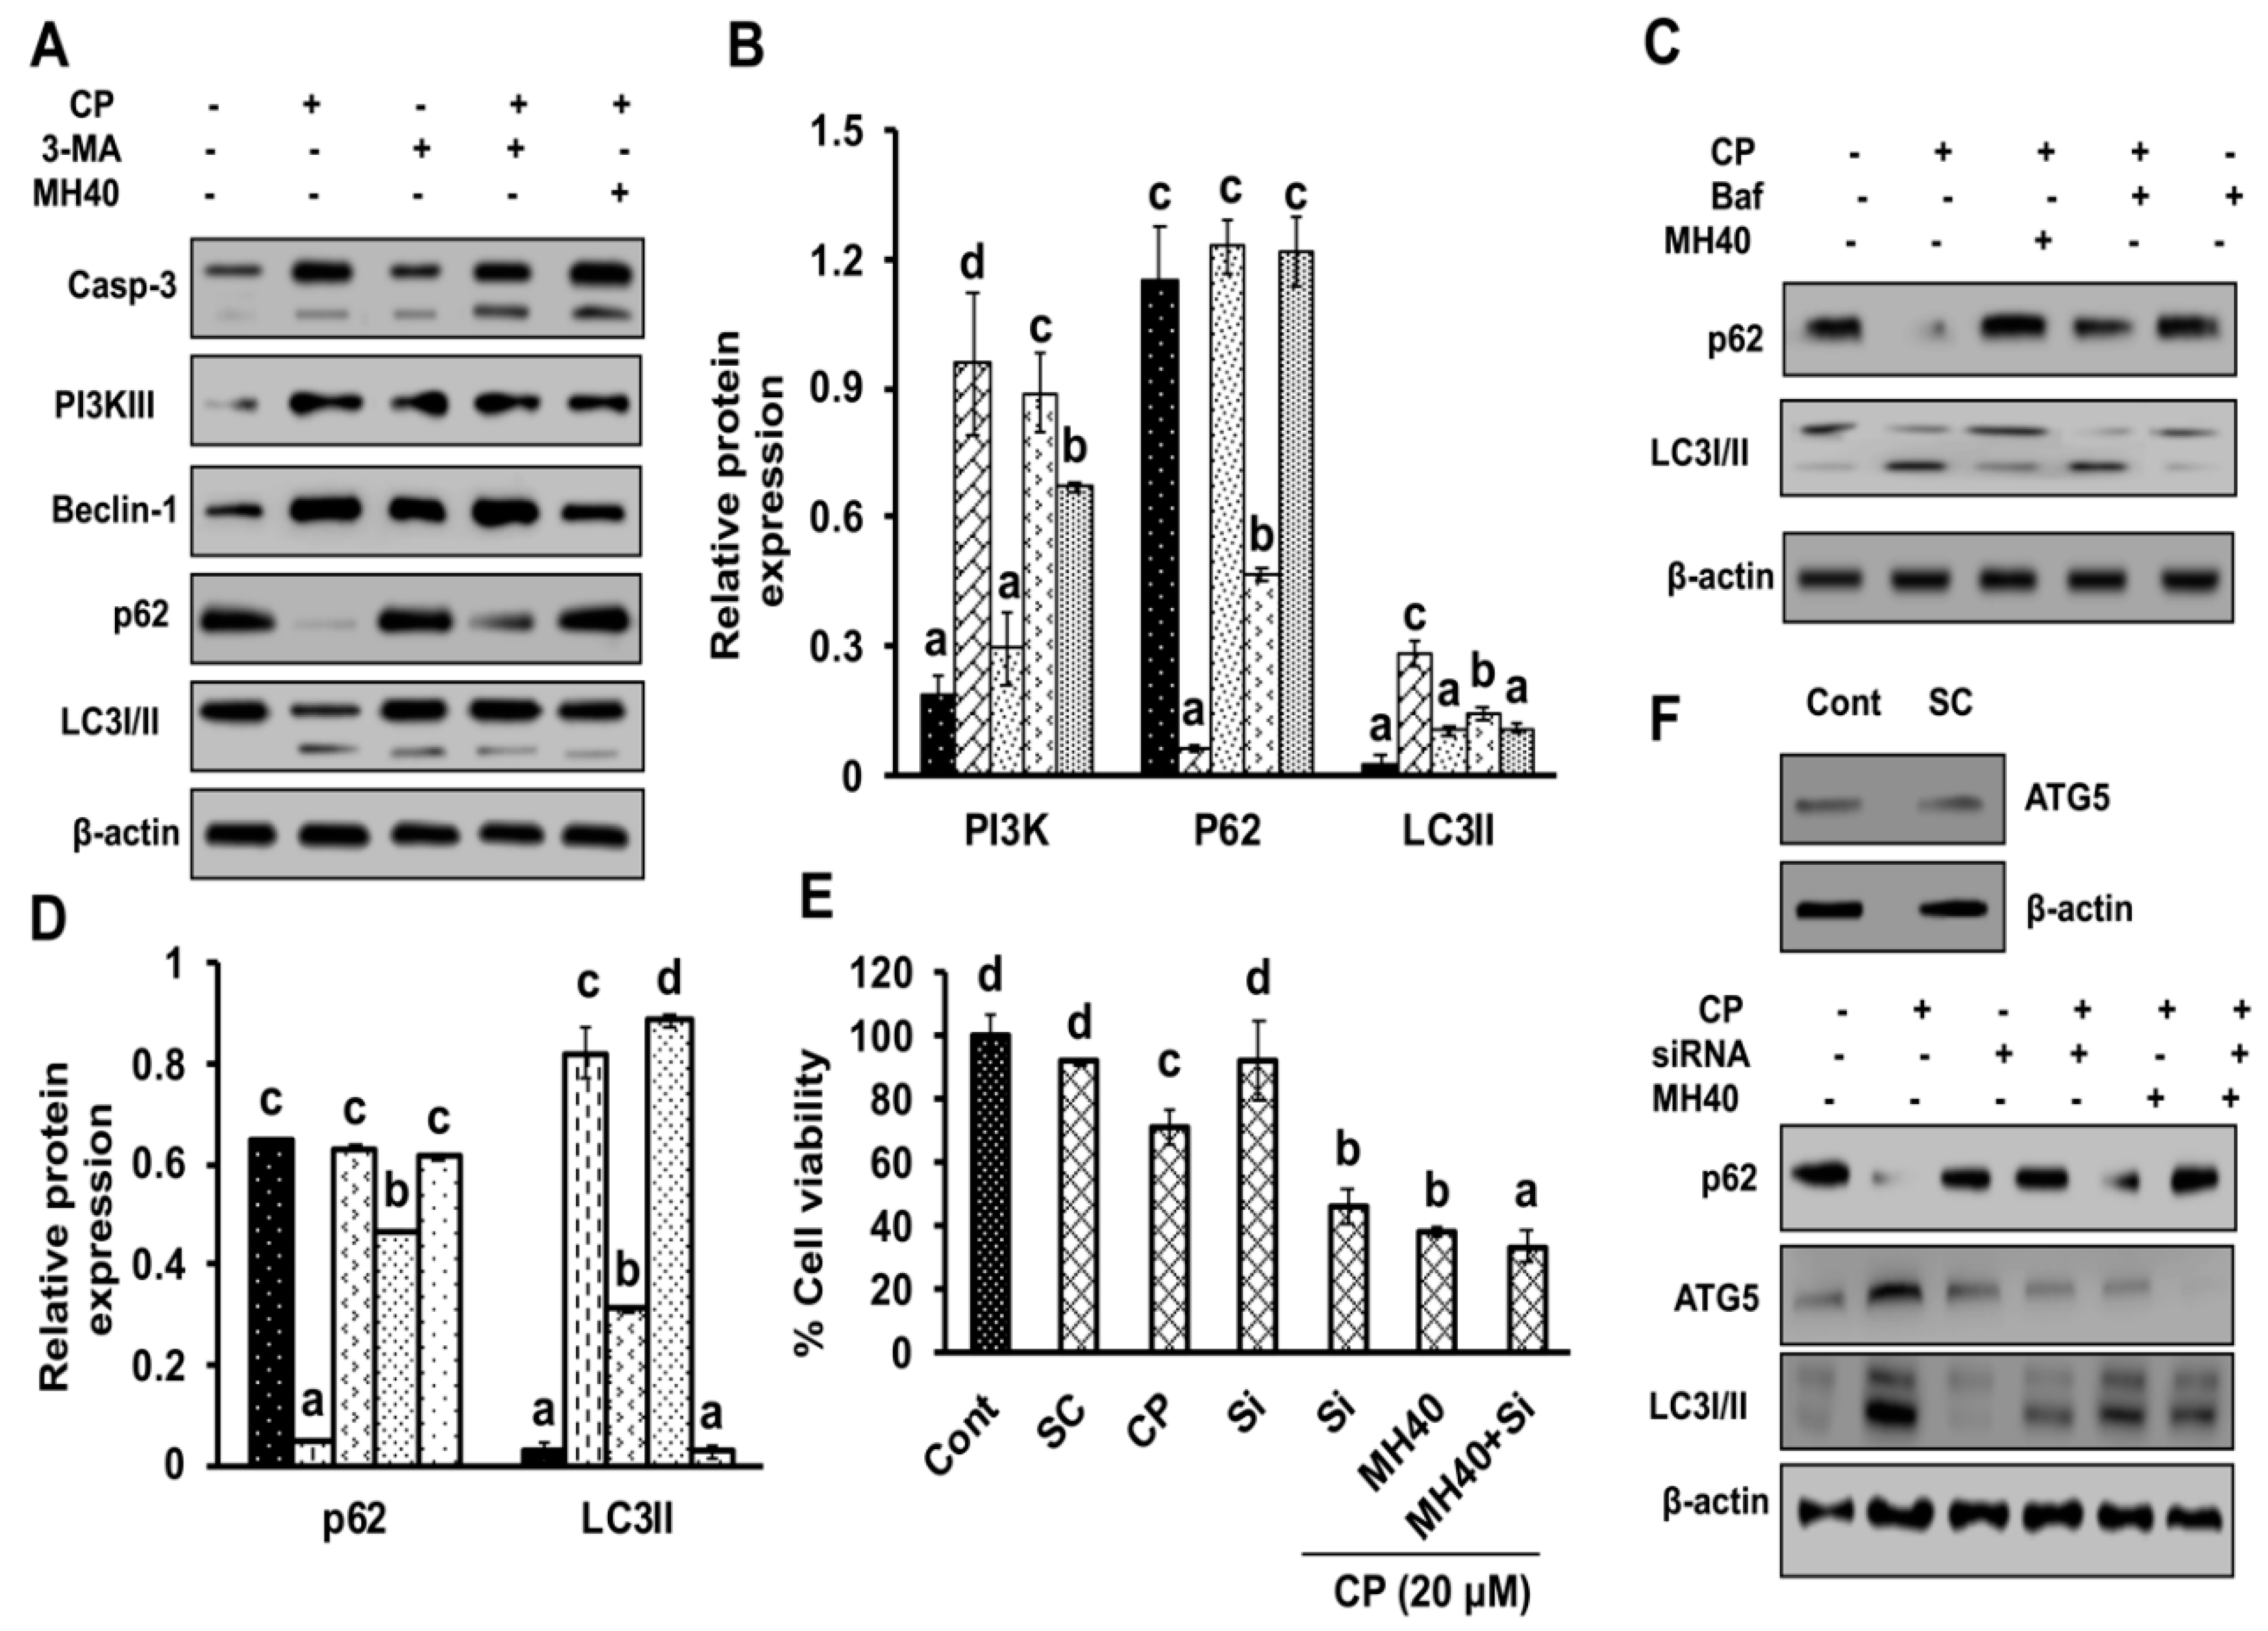
9]. In our data, the downstream signals of PARP-1-HMGB1 pathway, such as PAR, BECN-1, Atg5 and LC3I/II in the cytosolic protein, were up-regulated in CP-treated HepG2 cells. The expression of these major autophagy inducing proteins was attenuated in HepG2 cells during co-treatment with CP plus a higher concentration of Mh; suppression of PARP-1 also inhibited CP-induced HMGB1-BECN-1 complex formation as well as autophagy activation which was also consistent with our previous report [
11]. We further did a comparative study with ANI (a PARP-1 inhibitor) and EP (HMGB1 inhibitor). In addition, co-treatment of CP with Mh, 3-MA, baf and Atg5-siRNA mitigated the autophagy activation and induced HepG2 cell death. Above stated results indicate that CP-induced upstream PARP-1 activation plays a pivotal role in downstream HMGB1, PAR, p62, Atg5 and LC3I/II activation, which plays a protective role in HCC subjected to cytotoxicity of CP [
38]. In contrast, our findings validate that Mh plays a death-promoting role in HepG2
DR and HepG2 cells via PARP-1-regulated inhibition of autophagy [
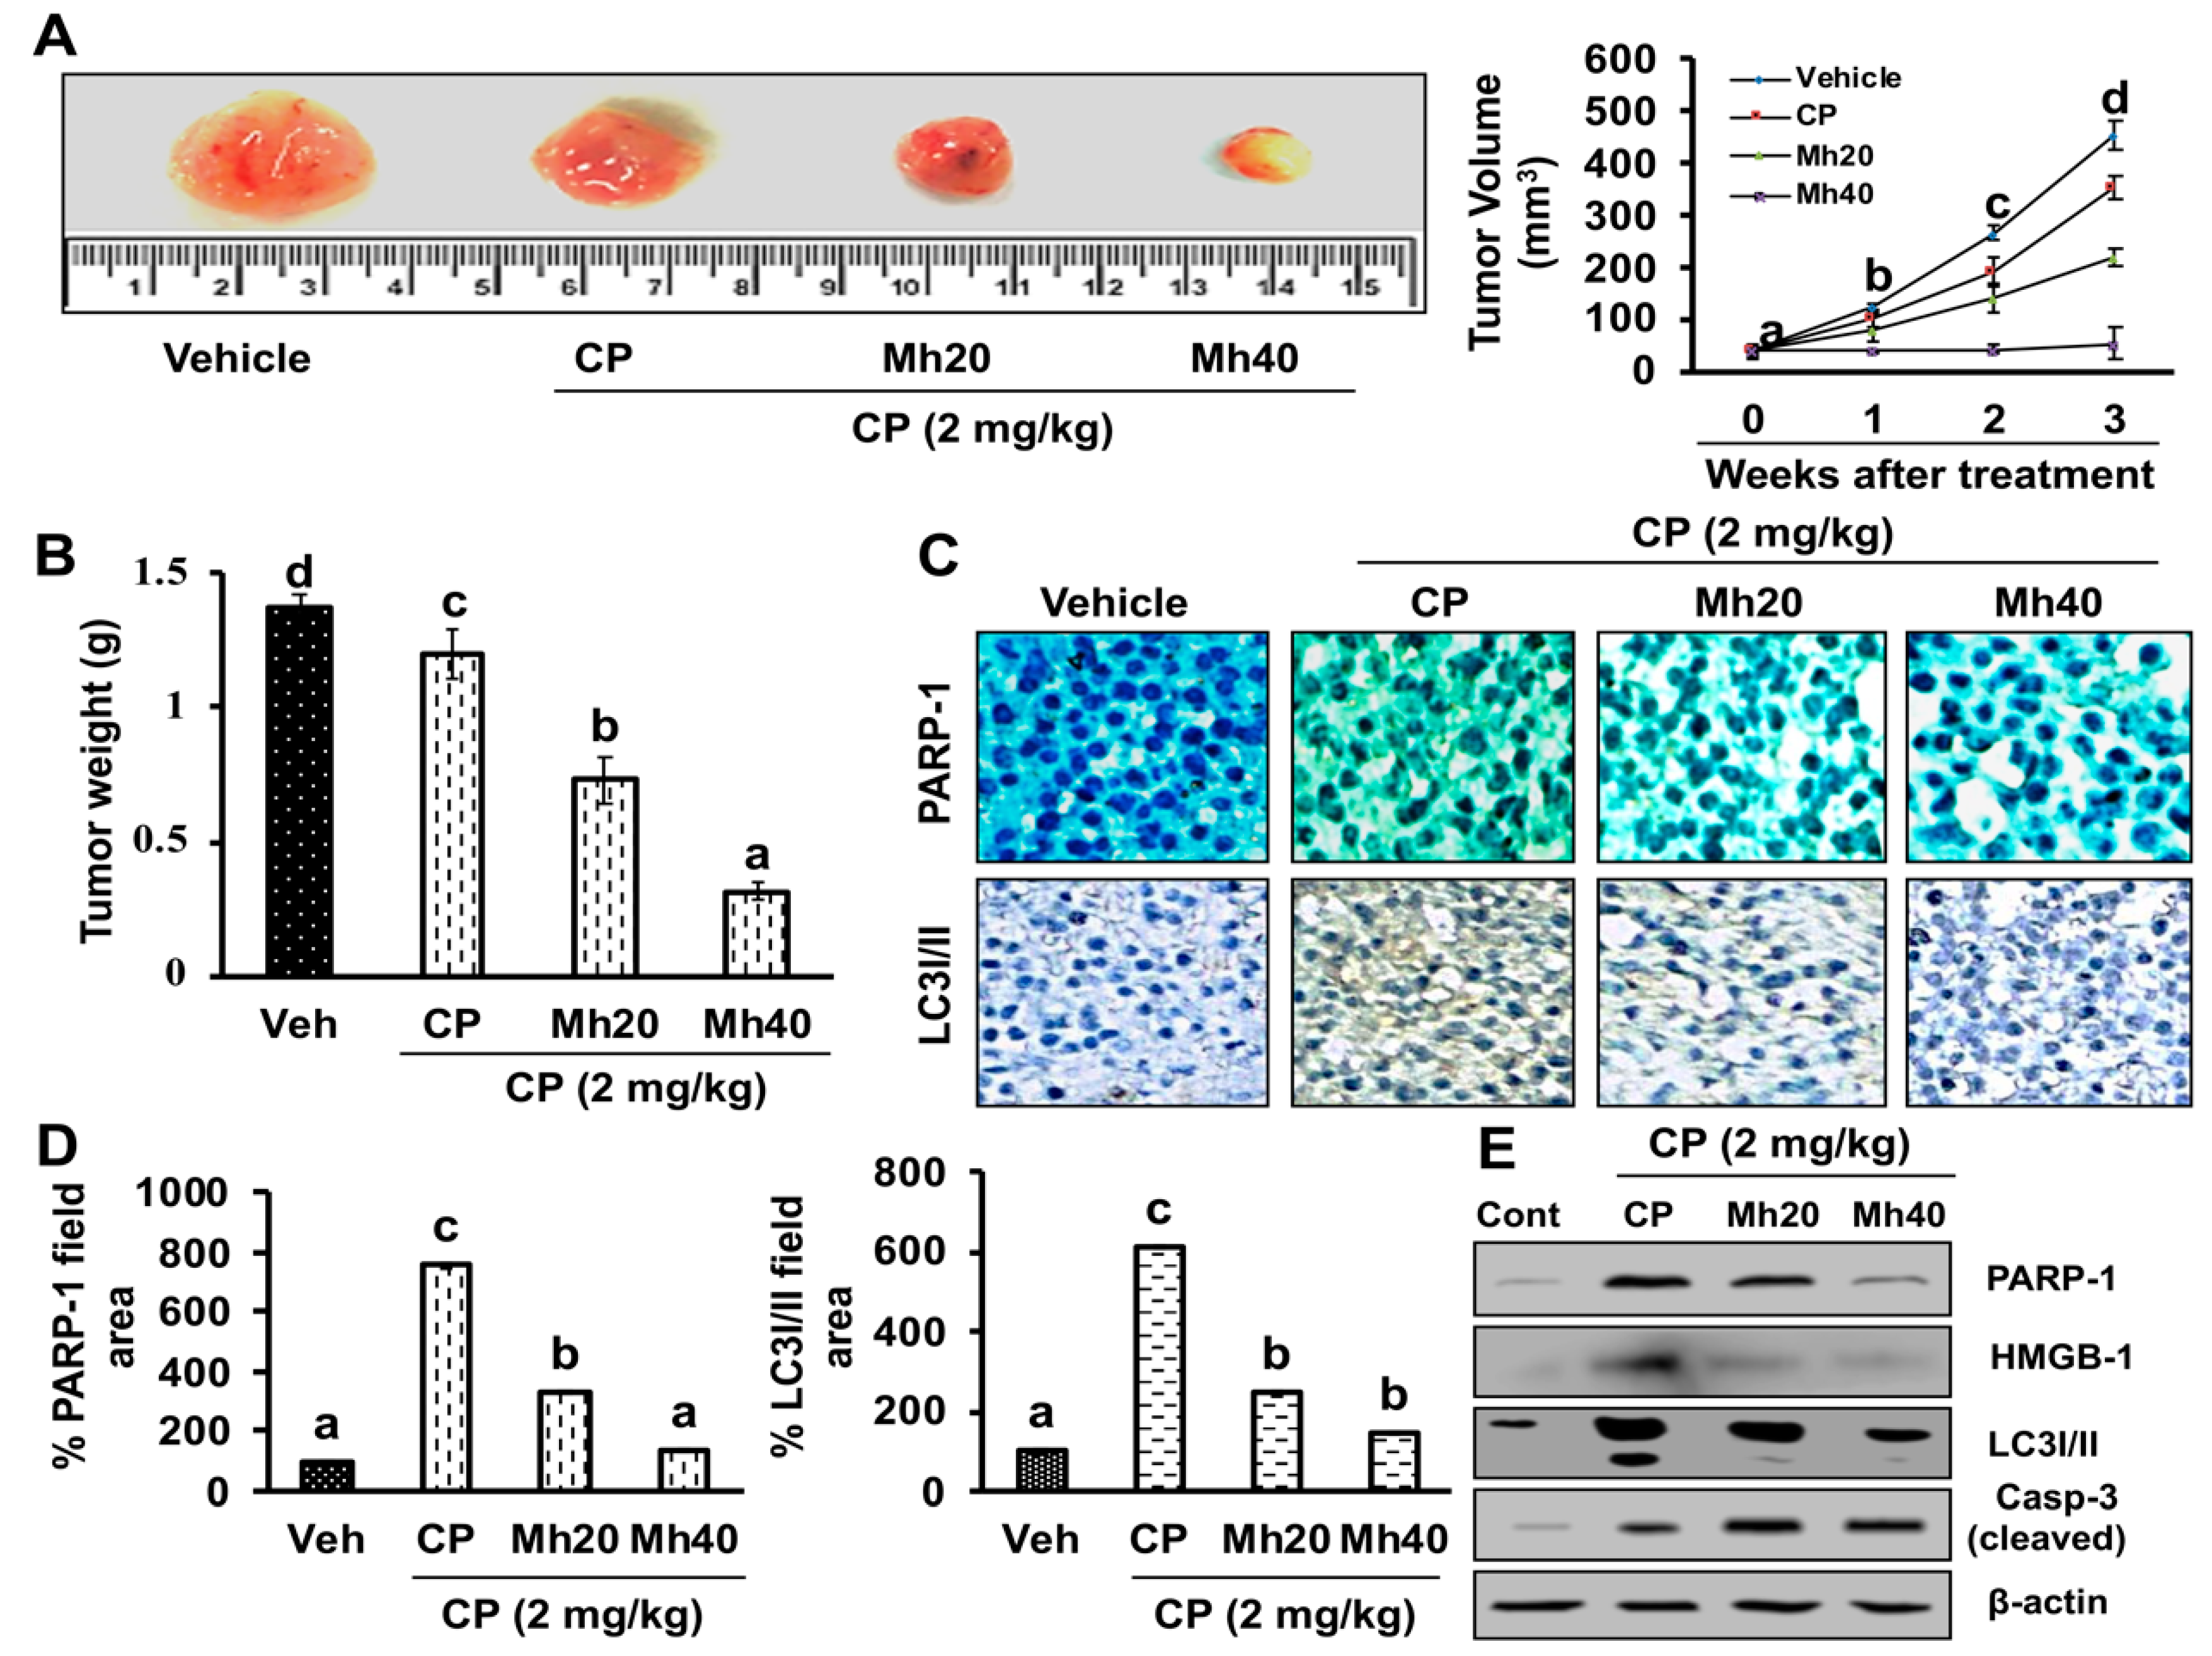
11,
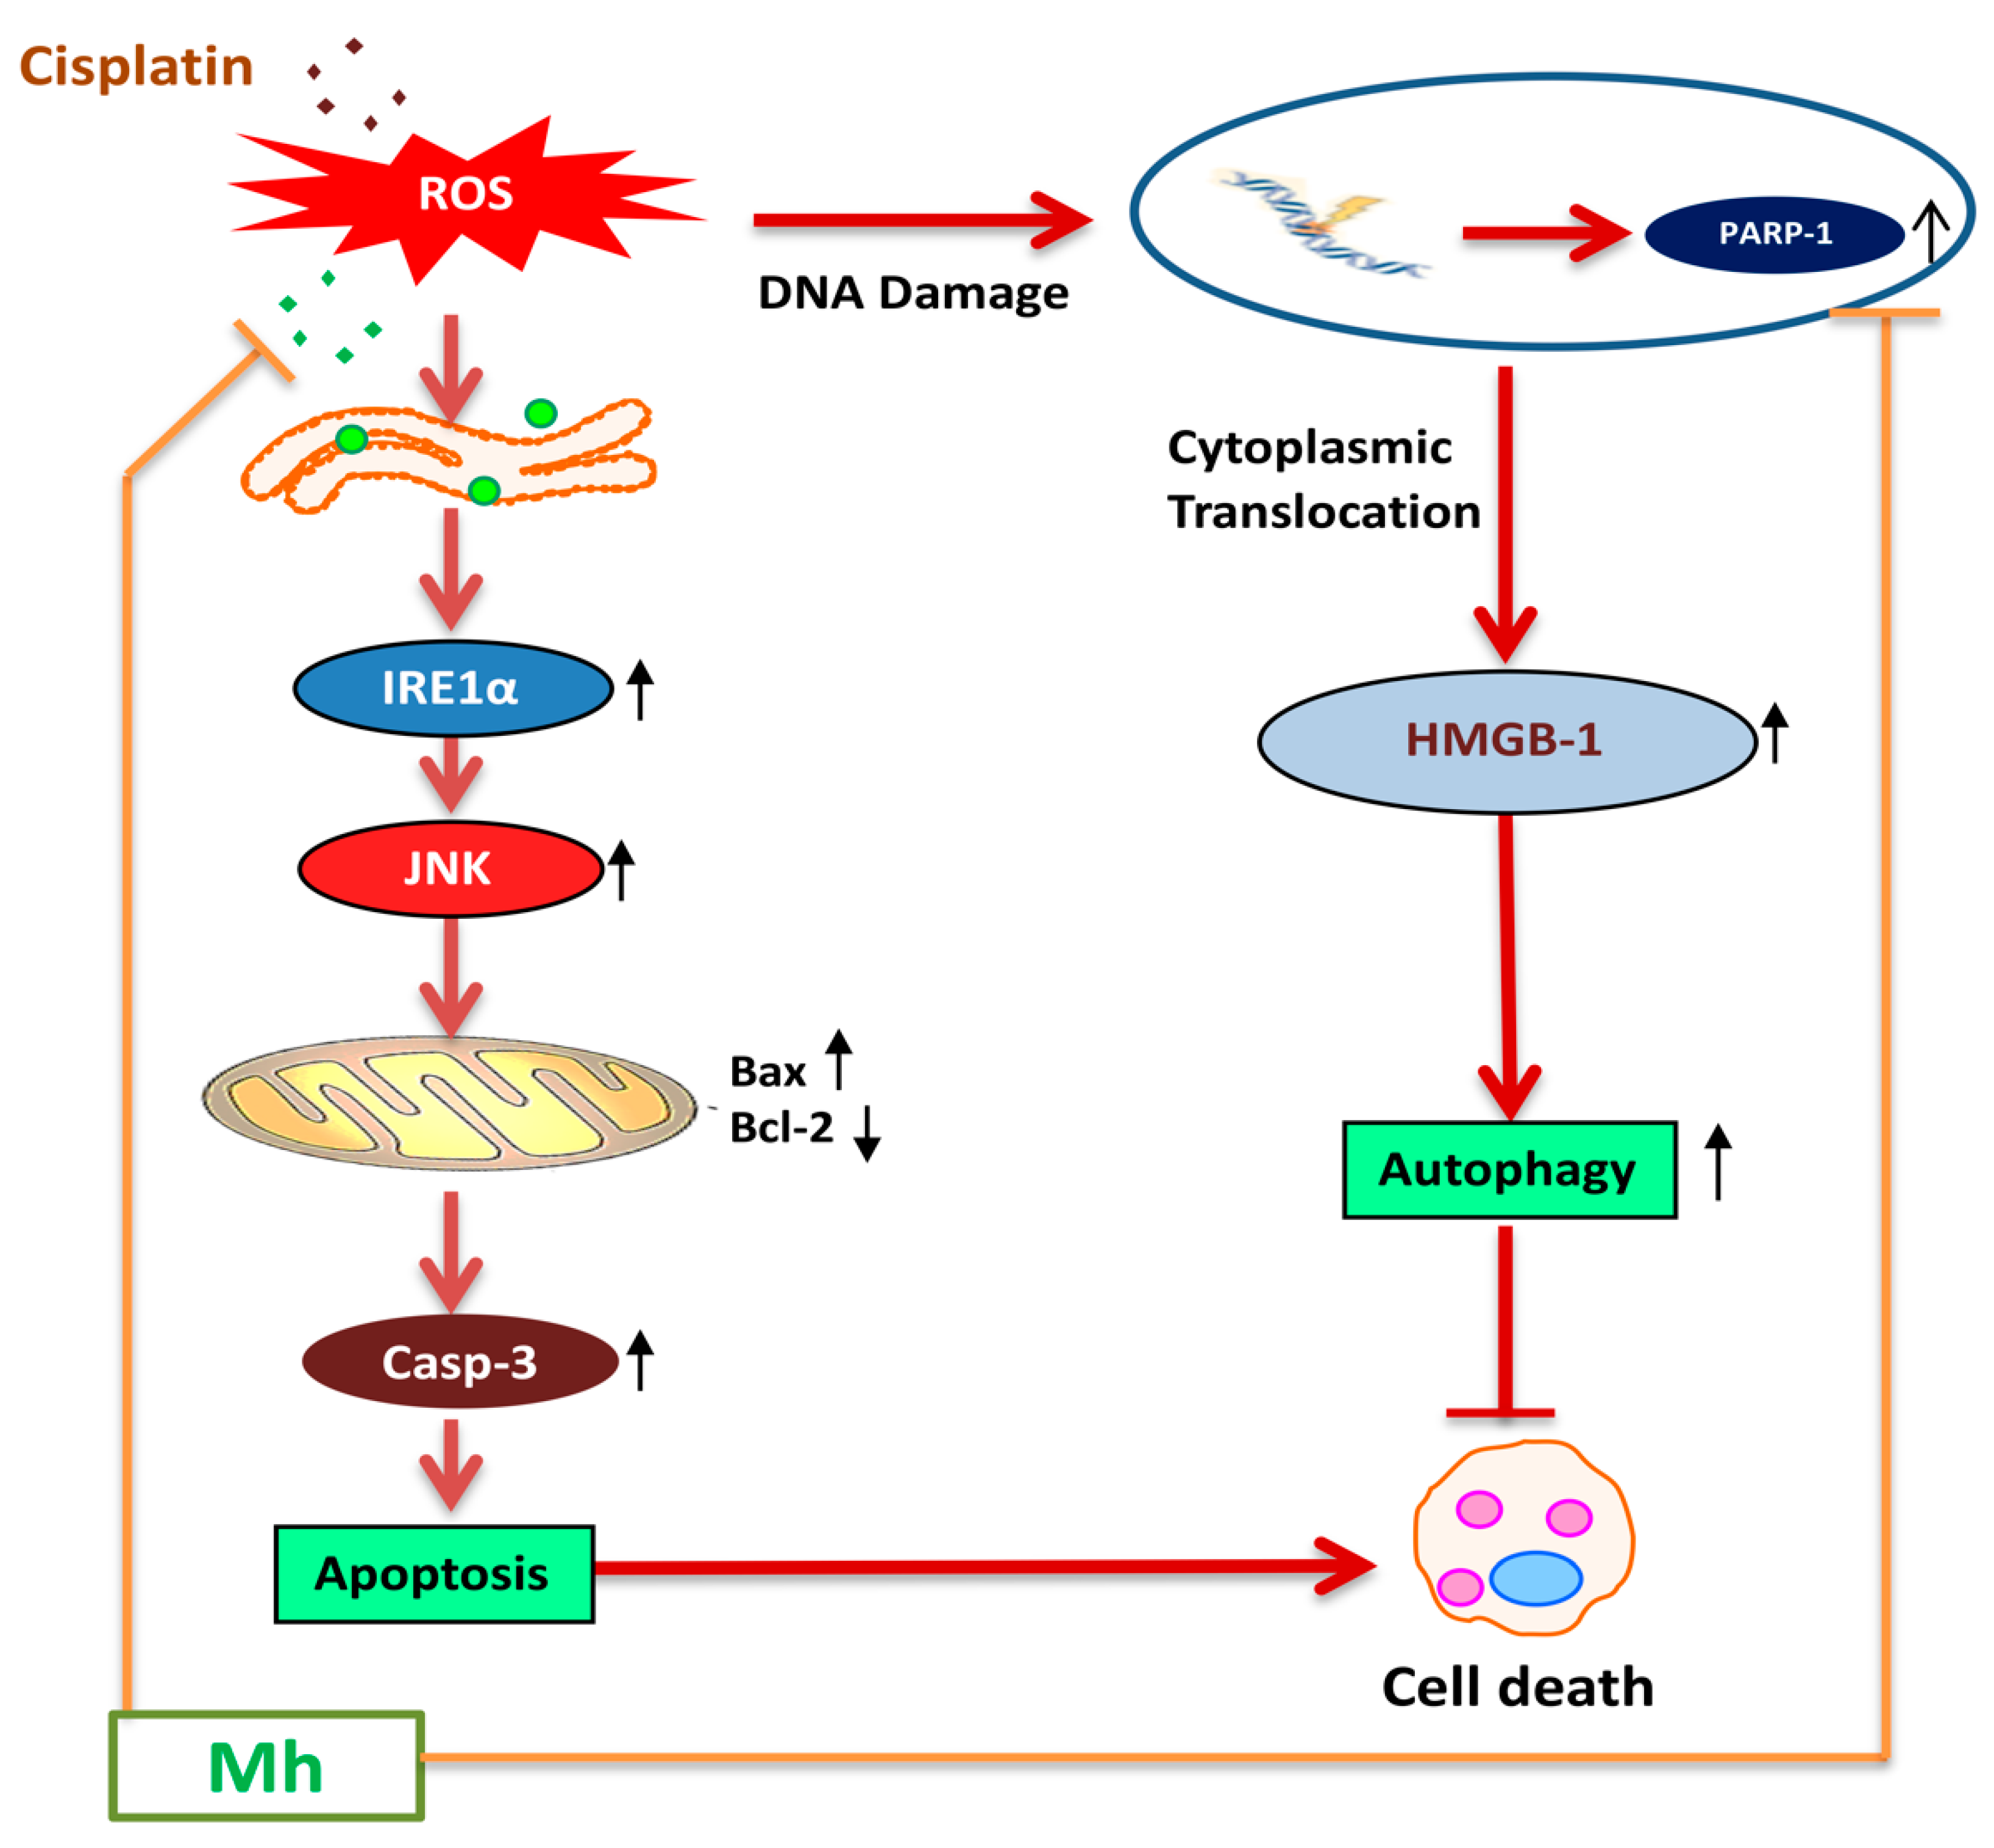
39]. Furthermore, in the hepatoma xenograft model, CP-Mh pre-treatment inhibited tumor growth and tumor weight. Translational expression analysis confirmed the decrease in PARP-1, HMGB1 and LC3I/II levels following the combinational treatment of CP-Mh, revealing that Mh exerts a therapeutic efficacy against HCC in the combination of CP chemotherapy. A detailed schematic summary of plausible mechanisms of CP-Mh regulated apoptosis and autophagic cascade has been illustrated in
Figure 11.
4. Materials and Methods
4.1. Chemicals
Morin hydrate (Mh), cisplatin (CP), DMEM, 3-(4,5-dimethylthiazol-2-yl)-2,5-diphenyltetra-zolium bromide (MTT), acridine orange (AO), Hoechst-33342, 4′-6-diamidino-2-phenylindole (DAPI), JC-1, 2′,7′-dichloro-fluorescin diacetate (H
2DCFDA), fura-2AM, Rhodamine-123, rapamycin (rap), dithiothreitol (DTT), ethyl pyruvate (EP), SP600125, 4-amino-1,8-naphthalimide (ANI), 3-methyl adenine (3-MA) and bafilomycin, were supplied by Sigma-Aldrich, St. Louis, MO, USA. Fetal bovine serum (FBS) was delivered by Gibco (Gaithersburg, MD, USA). The information of antibodies used in the present study has been provided in the
Supplementary Table S1.
4.2. Cell Culture and Treatment
HepG2, Huh7, Hep3B and SK-Hep1 human liver hepatoma cells were purchased from ATCC and cultured in DMEM media with 10% heat-inactivated FBS and 1% penicillin/streptomycin in a CO2 incubator at 37 °C. 1 × 10⁵ cells/well were cultured in 12-wells microtiter plates and treated with varying concentrations of CP (20 μM) and Mh (20 and 40 μM) for 24 h; cells were then centrifuged (600g × 3 min) and harvested. All the drugs were solubilized in 100% dimethyl sulfoxide (DMSO) (with final concentration of 0.1%).
4.3. MTT Bioassay
The 3-(4,5-dimethylthiazol-2-yl)-2,5-diphenyltetrazolium bromide (MTT) assay is also known as cell viability assay, which measures the metabolic status of cells, particularly in mitochondria by reflecting early cellular redox changes. Briefly, cells (1 × 10
5 cells) were seeded in a 96-well plate and incubated with CP, CP-Mh and Mh alone (20 and 40 μM) for 24 h in a CO
2 incubator at 37 °C. Afterwards, the cells were exposed to MTT (5 mg/mL) for 4 h. The dark-blue formazan crystals were dissolved in 100% DMSO and optical density was measured at 540 nm using an ELISA plate reader (Bio-Tek Instrument Co., Winooski, WA, USA). The percent cell viability was calculated with respect to control by the following formula.
4.4. Lactate Dehydrogenase Assay
Intra- and extra-cellular activities of lactate dehydrogenase (LDH) in CP, Mh and CP-Mh-treated HepG2 cells were measured spectrophotometrically. Cytotoxicity Detection Kit (Sigma-Aldrich, St. Louis, MO, USA) was used following the manufacturer’s instructions.
4.5. Evaluation of Cell Morphology
HepG2 cell morphological assessment was performed following post-exposure of CP, Mh and CP-Mh for 24 h at 37 °C. For that purpose, cells were visualized under a compound microscope (Nikon Eclipse TS200, Nikon Corp., Tokyo, Japan) at 200× magnification.
4.6. Apoptotic Cell Death Assay
Since the DNA present in the cell nucleus, showing apoptotic characteristics, is sensitive to formamide exposure. This denatured DNA can be detected using a monoclonal antibody against single-stranded (ss) DNA provided by ApoStrand™ enzyme-linked immunosorbent assay (ELISA) apoptosis detection kit (Enzo Life Sciences, Plymouth Meeting, PA, USA), following the manufacturer’s protocol.
4.7. Clonogenic Assay
Clonogenic assay was performed to evaluate the cytotoxicity of CP and CP-Mh. Briefly, HepG2 cells (300 cells/well) were seeded in 6-well tissue culture plates (BD Falcon, Sandiego, CA, USA) and allowed to attach overnight. Afterwards, the cells were exposed to various concentrations of corresponding drugs for 24 h. Then the cells were washed in phosphate buffer saline (PBS) and re-seeded in fresh medium till 10 days to form colonies. Cells were subsequently washed with PBS, fixed with methanol/acetic acid (3:1 ratio) solution and stained with 0.1% (
w/
v) crystal violet dye for 10 min. The stained colonies were rinsed with tap water and, counted manually using the ImageJ software (
www.rsbweb.nih.gov/ij/).
4.8. Acridine Orange (AO) Staining
Acidic intracellular compartments formed during autophagy activation were visualized by acridine orange (AO) staining. Briefly, CP and CP-Mh exposed HepG2 cells were washed with PBS and stained with AO (10 μg/mL) (Sigma-Aldrich, St. Louis, MO, USA) for 15 min at 37 °C. Cells were then rinsed with PBS and observed under a fluorescence microscope at 200× magnification.
4.9. Cyto-ID Green Fluorescence Staining for Autophagy Detection
CytoID green fluorescence dye was used to specify the location of autophagic vacuoles in HepG2 cells, for this, cells were grown on a cell culture cover glass (SPL, Seoul, Korea). After that cells were pre-treated with 3-MA (2.5 mM) for 1 h, followed by exposure to various concentrations of corresponding drugs for 24 h at 37 °C. Cells were then fixed with 4% paraformaldehyde for 10 min. Cells were stained with Cyto-ID Green Detection Reagent (Enzo Life Sciences, Plymouth Meeting, PA, USA) and visualized using fluorescence microscope as per the manufacturer’s instructions. Briefly, cells were gently washed with PBS and stained for 30 min with Cyto-ID green dye prepared in an indicator-free medium with 5% FBS and incubated at 37 °C. Hoechst 33342 was used as a counter stain to stain the nucleus. The cover slips were rinsed with assay buffer and observed under a fluorescence microscope at 200× magnification.
4.10. Mitochondrial Membrane Potential (MMP) Assay
Mitochondrial membrane potential (MMP) assay was performed as described previously [
11]. MMP (∆Ψm) was monitored by fluorescence dye. HepG2 cells were cultured on glass coverslips in 12-well plates following treatment with various concentrations of drugs for 24 h at 37 °C. The cells were then rinsed with PBS and stained with the Rhodamine-123 dye (1 μg/mL). Afterwards, cells were visualized by fluorescence microscope at 400× magnification.
4.11. Detection of Intracellular Reactive Oxygen Species (ROS)
ROS generation was detected by the method described previously [
11]. For the detection of intracellular ROS generation in HepG2 cells, cells were treated with various concentrations of corresponding drugs for 24 h at 37 °C, rinsed with PBS, exposed to 10 µM peroxide-sensitive fluorescent probe H
2DCFDA for 30 min at 37 °C. Cells were then analyzed for ROS production with a fluorescence microscope at 400× magnification.
4.12. Detection of Ca++ Production
Ca
++ measurement was performed as described previously [
11]. HepG2 cells was exposed to various concentrations of CP and CP-Mh. Cells were then immersed in Fura 2-AM (5 μM) dye for 60 min at 37 °C and dissolved in Hank’s balanced salt solution (HBSS) buffer. Cells were then rinsed 3x with HBSS buffer to remove extracellular dye [
40]. Stained cells were visualized under fluorescence microscope at 400× magnification.
4.13. Sub-Cellular Fractionation
Cytosolic and nuclear fractions of cells were isolated by the method described previously [
11], using an NE-PER nuclear protein extraction kit (Thermo Scientific, Seoul, Korea), according to the manufacturer’s protocol.
4.14. Isolation of Mitochondrial Protein
The method of preparation of mitochondrial-enriched fractions was described in our previous research [
11]. Cells were pelleted by centrifugation, re-suspended in mitochondrial extraction buffer. Cells were homogenized using a Dounce homogenizer and centrifuged at 600×
g for 10 min. The resulting pellet was discarded and the supernatant was collected into a fresh Eppendorf tube; and centrifuged again at high speed (11,000×
g, 10 min) to separate mitochondria from soluble cytosolic contents.
4.15. Immunoblotting
Cells were harvested and re-suspended in radioimmunoprecipitation assay (RIPA) lysis buffer (Sigma, St. Louis, MO, USA) to isolate the total fraction of protein. The amount of protein was quantified by Bradford assay. An equal amount of protein (30 μg/well) was loaded to SDS–polyacrylamide gel electrophoresis or native-PAGE (for interaction study) to perform Western blot analysis. Protein from sodium dodecyl sulfate polyacrylamide gel electrophoresis (SDS-PAGE) was transferred to a polyvinyldenefluoride (PVDF) membrane (Roche Diagnostics, Indianapolis, IN, USA) by electroplating. The blots were exposed to primary antibodies for minimum 4–5 h, followed by horseradish peroxidase-conjugated secondary antibody for 2 h. Afterwards, blots were developed by using enhanced chemiluminescence (ECL), as per recommended protocol (Amersham Pharmacia, Piscataway, NJ, USA).
4.16. Detection of Nuclear DNA Condensation with Hoechst-33342 Stain
To detect the morphologic features of chromatin, HepG2 cells were stained with Hoechst- 33342 dye according to Diaz-Ruiz et al. [
41]. Briefly, cells were seeded in a 96 well plate, treated with desired concentrations of CP and CP-Mh for 24 h at 37 °C. Cells were then washed 2× with sterile PBS and fixed by using 4% formaldehyde. Cells were rinsed again with PBS and exposed to Hoechst-33342 (1 µg/mL) for 10 min at 37 °C. Cells were washed with PBS to remove the extra stain and observed under a fluorescence microscope at 400× magnification.
4.17. Comet Assay
To determine the intracellular DNA damage by comet assay, cells were treated, harvested and washed 3x with PBS and followed the procedure described by Singh et al. [
42] with slight modifications. Briefly, normal glass slides were covered with 1% melting agarose dissolved in PBS and kept in 4 °C to solidify. Cells were suspended in 85 µL of low-melting agarose and layered onto the solidified agarose containing slide and left on ice for 10 min. The coated slides were immersed in cold lysis buffer (0.1 M Na
2EDTA, 1% Triton X-100, 2.5 mM NaCl, 10 mM Tris and 10% DMSO, pH 10) for 1 h. After that slides were placed in alkaline buffer (0.3 M NaOH and 1 mM Na
2EDTA, pH 13) for 25 min to allow DNA unwinding. Then electrophoresed for 30 min at 20 V adjusted at 300 mA. Finally, slides were gently immerged in neutralization buffer (0.4 M Tris, pH 7.5) for 25 min and apply 20 µg/mL of ethidium bromide. The relative amount of damaged DNA was observed under fluorescence microscope at 400× magnification.
4.18. Real-Time PCR
HepG2 cells were treated with CP and CP-Mh and RNA was isolated using RNA-spin™ Total RNA Extraction Kit (Intron Biotechnology, Seoul, Korea), following the manufacturer’s instructions. RNA was quantified using a Qubit22
® 2.0 fluorometer RNA Assay Kit (Life technologies, USA). Maxime RT Premix cDNA Synthesis Kit (Intron Biotechnology, Korea) was used to prepare cDNA. β-actin gene was also amplified under the same reverse transcription polymerase chain reaction (RT-PCR) parameters to normalize the quantitative data. Quantitative RT-PCR amplification was executed in Agilent Technology quantitative polymerase chain reaction (qPCR) System (Foster, CA, USA). Detailed list of the primers used for Cyt
c, Casp-3, PARP-1, Beclin-1 and LC3 amplification is stated in
Table S2.
4.19. Immunocytological Analysis
Immunocytological staining was performed according to the method described previously [
11]. Cells were grown on a glass cover slip (SPL, Seoul, Korea) for 24 h, treated with indicated amount of drug. Cells were washed, fixed (4% paraformaldehyde in PBS) for 20 min and blocked with 3% normal goat serum. Afterwards, incubated with PARP-1 primary antibody for overnight at 4 °C. Next day, cells were washed and applied fluorescein isothiocyanate (FITC)-labeled goat anti-rabbit IgG secondary antibody for 1 h. The coverslips were washed with PBS, mounted with DAPI anti-fade mounting medium and visualized under a fluorescence microscope at 200× magnification.
4.20. siRNA Transfection
Cells were seeded and transfected with siRNA (25 pM) against Atg5 and negative control (Integrated DNA Technologies, Maryland, MD, USA), using 7.5 μL of lipofectamine
® RNAiMAX transfection reagent (Invitrogen, Maryland, MD, USA) in a 6-wells microtiter plate followed by 24 h of CP and CP-Mh treatment. Afterwards, the cells were lysed to extract proteins and expression levels of different autophagic markers, including β-actin were determined by Western blot analysis. The sequence of siRNA used for Atg5 knock down is mentioned in
Table S3.
4.21. Protein-Ligand Interaction In-Silico
The 3D structure of PARP-1 was obtained from the Protein Data Bank (
www.rcsb.org) (PBD ID: 5DS3), whereas the structure of Mh was retrieved from the ZINC database (ZINC03881558). The protein-ligand binding of PARP-1 and Mh was predicted by using Autodock (Hex v8.0.0 CUDA), followed by a visualization of the interaction using PyMol (ver 4.0). Protein residue sharing hydrogen and hydrophobic interactions with ligand molecules were calculated by shape complementary-based algorithm.
4.22. Cell-Based Pull-Down Assay
Mh was coupled with CNBr-activated agarose beads as per the manufacturer’s suggested protocol. Proteins (500 μg) from HepG2 cells and morin-coupled beads (100 μL) were mixed in a reaction buffer (150 mM NaCl, 1 mM phenylmethylsulfonyl fluoride (PMSF), 50 mM Tris (pH 7.5), 5 mM ethylenediaminetetraacetic acid (EDTA), 0.01% NP-40, 2 μg/mL bovine serum albumin (BSA), 1% protease inhibitor cocktail) and allowed to incubate with gentle rocking for overnight at 4 °C. After incubation, the beads were washed (5x) with washing buffer [5 mM EDTA, 50 mM Tris (pH 7.5), 1 mM PMSF, 150 mM NaCl, 0.01% NP-40] and binding was analyzed using Western blotting [
43].
4.23. Antitumor Effect of CP-Mh In Vivo
Four-week aged male BALB/c-nu nude mice (15 ± 5 g) were supplied by Oriental Biotechnology (Seoul, Korea). All the animals were kept under specific germ-free environment with ad libitum food and water supply in the Laboratory Animal Care of Daegu University (LMO No. LML-16-1134). Experiments were performed according to the guidelines of Care and Use of Laboratory Animals of the National Institutes of Health, which were approved by the Committee on the Ethics of Animal Experiments of the Daegu University, South Korea.
HepG2 cells were cultured, harvested and re-suspended in sterile PBS. A total of five million cells (5 × 10⁶) were injected into the right flank of the animals subcutaneously. We used following formula: V= (L × W2)/2 to measure the volume of the tumor, in this formula, L stands for the length and W for width of the tumor nodules measured with Vernier calipers. Once the tumors volume reached 25–50 mm3, the mice were separated into four different groups (each n = 5). Every twice a week for 3 weeks, mice were injected (IP) of vehicle (0.1% DMSO, control group), CP (2 mg/kg body weight), CP-Mh20 (2 mg/kg–20 mg/kg body weight) and CP-Mh40 (2 mg/kg–40 mg/kg body weight). Body weights of mice were measured before each injection of drug. On the 21th day, the mice were sacrificed; the tumors were taken away, weighed and photographed.
To determine the antitumor effect of CP-Mh in vivo, histological analysis of hepatoma xenografts was performed. Briefly, the tissues were fixed in a 10% formalin solution for 24 h, processed with graded volumes of ethanol, embedded in paraffin, sectioned and stained for immunohistochemistry (IHC) using antibodies against PARP-1 and LC3I/II. The IHC images were taken under a light microscope at 200× magnification. The immune-reactive areas were quantified manually by the ImageJ software.
4.24. Statistical Analysis
SPSS (Statistical Package for the Social Sciences) 22.0 was used for statistical analysis. All the results were expressed as the mean ± standard deviation (SD) of three independent experiments. The data were analyzed using one-way analysis of variance (ANOVA), the significance difference between samples was considered statistically significant for values of p < 0.05, calculated by Duncan’s multiple range test (SPSS Inc., Chicago, IL, USA). Significant differences among the groups are indicated by the letters a, b, c, d & e, where, a, b, c, d, and, e represent p > 0.05, p < 0.05, p < 0.01, p < 0.001 and p < 0.0001, respectively.


 and
and 