Article

Revealing Alteration in the Hepatic Glucose Metabolism of Genetically Improved Carp, Jayanti Rohu Labeo rohita Fed a High Carbohydrate Diet Using Transcriptome Sequencing

1
Fish Genetics and Biotechnology Division, ICAR-Central Institute of Freshwater Aquaculture, Bhubaneswar 751 002, India
2
Centre for Agricultural Bioinformatics (CABin), ICAR-Indian Agricultural Statistics Research Institute, Library Avenue, PUSA, New Delhi 110012, India
*
Author to whom correspondence should be addressed.
Int. J. Mol. Sci. 2020, 21(21), 8180; https://doi.org/10.3390/ijms21218180
Submission received: 11 September 2020 / Revised: 20 October 2020 / Accepted: 21 October 2020 / Published: 31 October 2020
(This article belongs to the Section Molecular Genetics and Genomics)

Abstract

:
Although feed cost is the greatest concern in aquaculture, the inclusion of carbohydrates in the fish diet, and their assimilation, are still not well understood in aquaculture species. We identified molecular events that occur due to the inclusion of high carbohydrate levels in the diets of genetically improved ‘Jayanti rohu’ Labeo rohita. To reveal transcriptional changes in the liver of rohu, a feeding experiment was conducted with three doses of gelatinized starch (20% (control), 40%, and 60%). Transcriptome sequencing revealed totals of 15,232 (4464 up- and 4343 down-regulated) and 15,360 (4478 up- and 4171 down-regulated) differentially expressed genes. Up-regulated transcripts associated with glucose metabolisms, such as hexokinase, PHK, glycogen synthase and PGK, were found in fish fed diets with high starch levels. Interestingly, a de novo lipogenesis mechanism was found to be enriched in the livers of treated fish due to up-regulated transcripts such as FAS, ACCα, and PPARγ. The insulin signaling pathways with enriched PPAR and mTOR were identified by Kyoto Encyclopedia of Genes and Genome (KEGG) as a result of high carbohydrates. This work revealed for the first time the atypical regulation transcripts associated with glucose metabolism and lipogenesis in the livers of Jayanti rohu due to the inclusion of high carbohydrate levels in the diet. This study also encourages the exploration of early nutritional programming for enhancing glucose efficiency in carp species, for sustainable and cost-effective aquaculture production.

1. Introduction

Aquaculture production is increasing significantly at the global level, contributing to 6.7% of total fishery production as compared to marine production (captured) [1]. For sustainable aquaculture, the availability of the feed and its cost is the greatest concern. During feed formulation, carbohydrate sources are inexpensive and broadly available, and they can be well utilized in aquaculture [1,2]. Earlier studies showed that carbohydrates have great energy value and that the inclusion of carbohydrate sources in fish feed has positive effects in terms of growth and digestibility [3,4,5,6]. However, the metabolism of those feed ingredients is dependent on their source materials, percentage of inclusion, type of fish, and their feeding habits (carnivorous/omnivorous/herbivorous), etc. Thus, the inclusion of a higher level of digestible starch in the diet is economically beneficial in aquaculture [6,7].
Carbohydrates are the main energy source in humans, animals and several vertebrates. In order to determine nutritional requirements, the digestive physiology of commercially important aquaculture species has been reported [7]. Studies have indicated that carbohydrate sources could be incorporated into the fish diet, however glucose homeostasis varies among the teleost species, which leads to changes in the blood glucose level in different fish species [8,9]. Thus, carbohydrate metabolism, which affects glycolysis, glucogenesis, lipogenesis and glycogen metabolism directly or indirectly, was reported by several groups, based on different feed types, and different sizes and species of fish [6,8]. The liver is the largest vital organ, and is associated with important physiological processes such as glycogen synthesis (metabolism), glycogen storage, de novo lipogenesis, detoxification, antioxidant activity, etc. [9]. Gluconeogenesis is an important strategy to regulate the blood glucose level in fish livers, and it may happen due to an inability to utilize carbohydrates [10]. Glucose tolerance tests (GTTs) are commonly used to examine the ability of the fish to use carbohydrates upon inclusion in the fish diets [8]. Regulation of glucose metabolism in the liver by the interaction of the glucose transporter (GLUT) with AMPK and insulin signaling has been depicted by several studies [11]. Digestibility and enzyme activity in response to dietary carbohydrates differ between fish species, and usually depend on the level of dietary intake, and the source and composition of the diet [12,13]. Overall, studies suggest that the livers of most fish species are apparently capable of regulating glucose metabolism and storage. Several hypotheses were proposed for the deficiency of carbohydrate utilization, such as a lack of insulin deficiency, a lack of dependent glucose transporter, and a lack of hepatic glucokinase, but these have been proven wrong [14,15]. In addition to these, it has been reported that temperature and oxygen level are also important factors that affect the metabolic activities of fish [16,17]. However, the mechanism by which insulin regulates plasma glucose levels in the fish liver remains unknown, and the relative contribution of the main sensitive peripheral tissues to this hormone remains still to be clarified. Over the past decade, molecular tools has been used to address some of the downstream components of carbohydrate/glucose metabolism and regulatory processes. Currently, the physiological and molecular basis of this apparent glucose intolerance in aquaculture fish is not fully understood.
The recent progress in sequencing technologies and advancement in computational tools has facilitated an in-depth understanding of gene function/regulation on a genome-wide scale. Large numbers of transcripts, including novel transcripts, have been successfully identified in various organisms using next generation sequencing (NGS) technology, including model as well as non-model aquaculture species [18,19]. In the present study, we have analyzed the transcriptional changes in the livers of farmed rohu, L. rohita (Jayanti), upon the inclusion of different levels of carbohydrates in the diet. Farmed rohu is an economically important carp species in South Asia, and it contributes significantly to aquaculture production [20]. Jayanti is an improved variety of Labeo rohita produced by selective breeding [20]. The feed cost is the major concern in rohu grow-out culture and feeds with 30–35% protein are required, which in turn increases the production cost [21]. Earlier studies have shown that rohu showed an optimal starch requirement in the diet, of 20–24% [22,23]. Rohu is omnivorous in nature, and supposed to be better at carbohydrate utilization [24]. However, molecular-level investigation with respect to carbohydrate metabolism is lacking in the improved rohu (Jayanti). In this work, we have investigated the molecular mechanism of carbohydrate metabolism in the liver tissues of rohu using NGS technology and computational tools. The generated information will help us to undertake nutritional programming research in rohu as well as other carp species.

2. Results

2.1. Illumina Sequencing and read Mapping

Through IlluminaHiSeq (2 × 150 bp) pair-end sequence technology, totals of 23,396,281, 24,004,149 and 35,558,985 raw reads were generated in the liver tissue of rohu fish of the 20% (control), 40% and 60% CHO (Carbohydrate) level groups, respectively. After pre-processing and the removal of the adaptor sequences, low-quality sequences and reads with poly-N sequences, totals of 21,202,572, 21,608,231 and 30,800,241 clean reads were obtained in the liver of with the fish in the 20% (control), 40% and 60% CHO level groups, respectively. The obtained raw reads were uploaded to the NCBI SRA database with the following accession numbers: BioSample accession SAMN11246841, SAMN11246839 and SAMN11246840. A total of 88.35% of the reads were successfully mapped to reference genome of rohu. HTSeq v0.6.1 software was employed to measure the number of clean reads mapped to each gene and estimate or calculate transcript abundance. The summary of the analysis of raw and pre-processed read sequences is shown in Table 1.

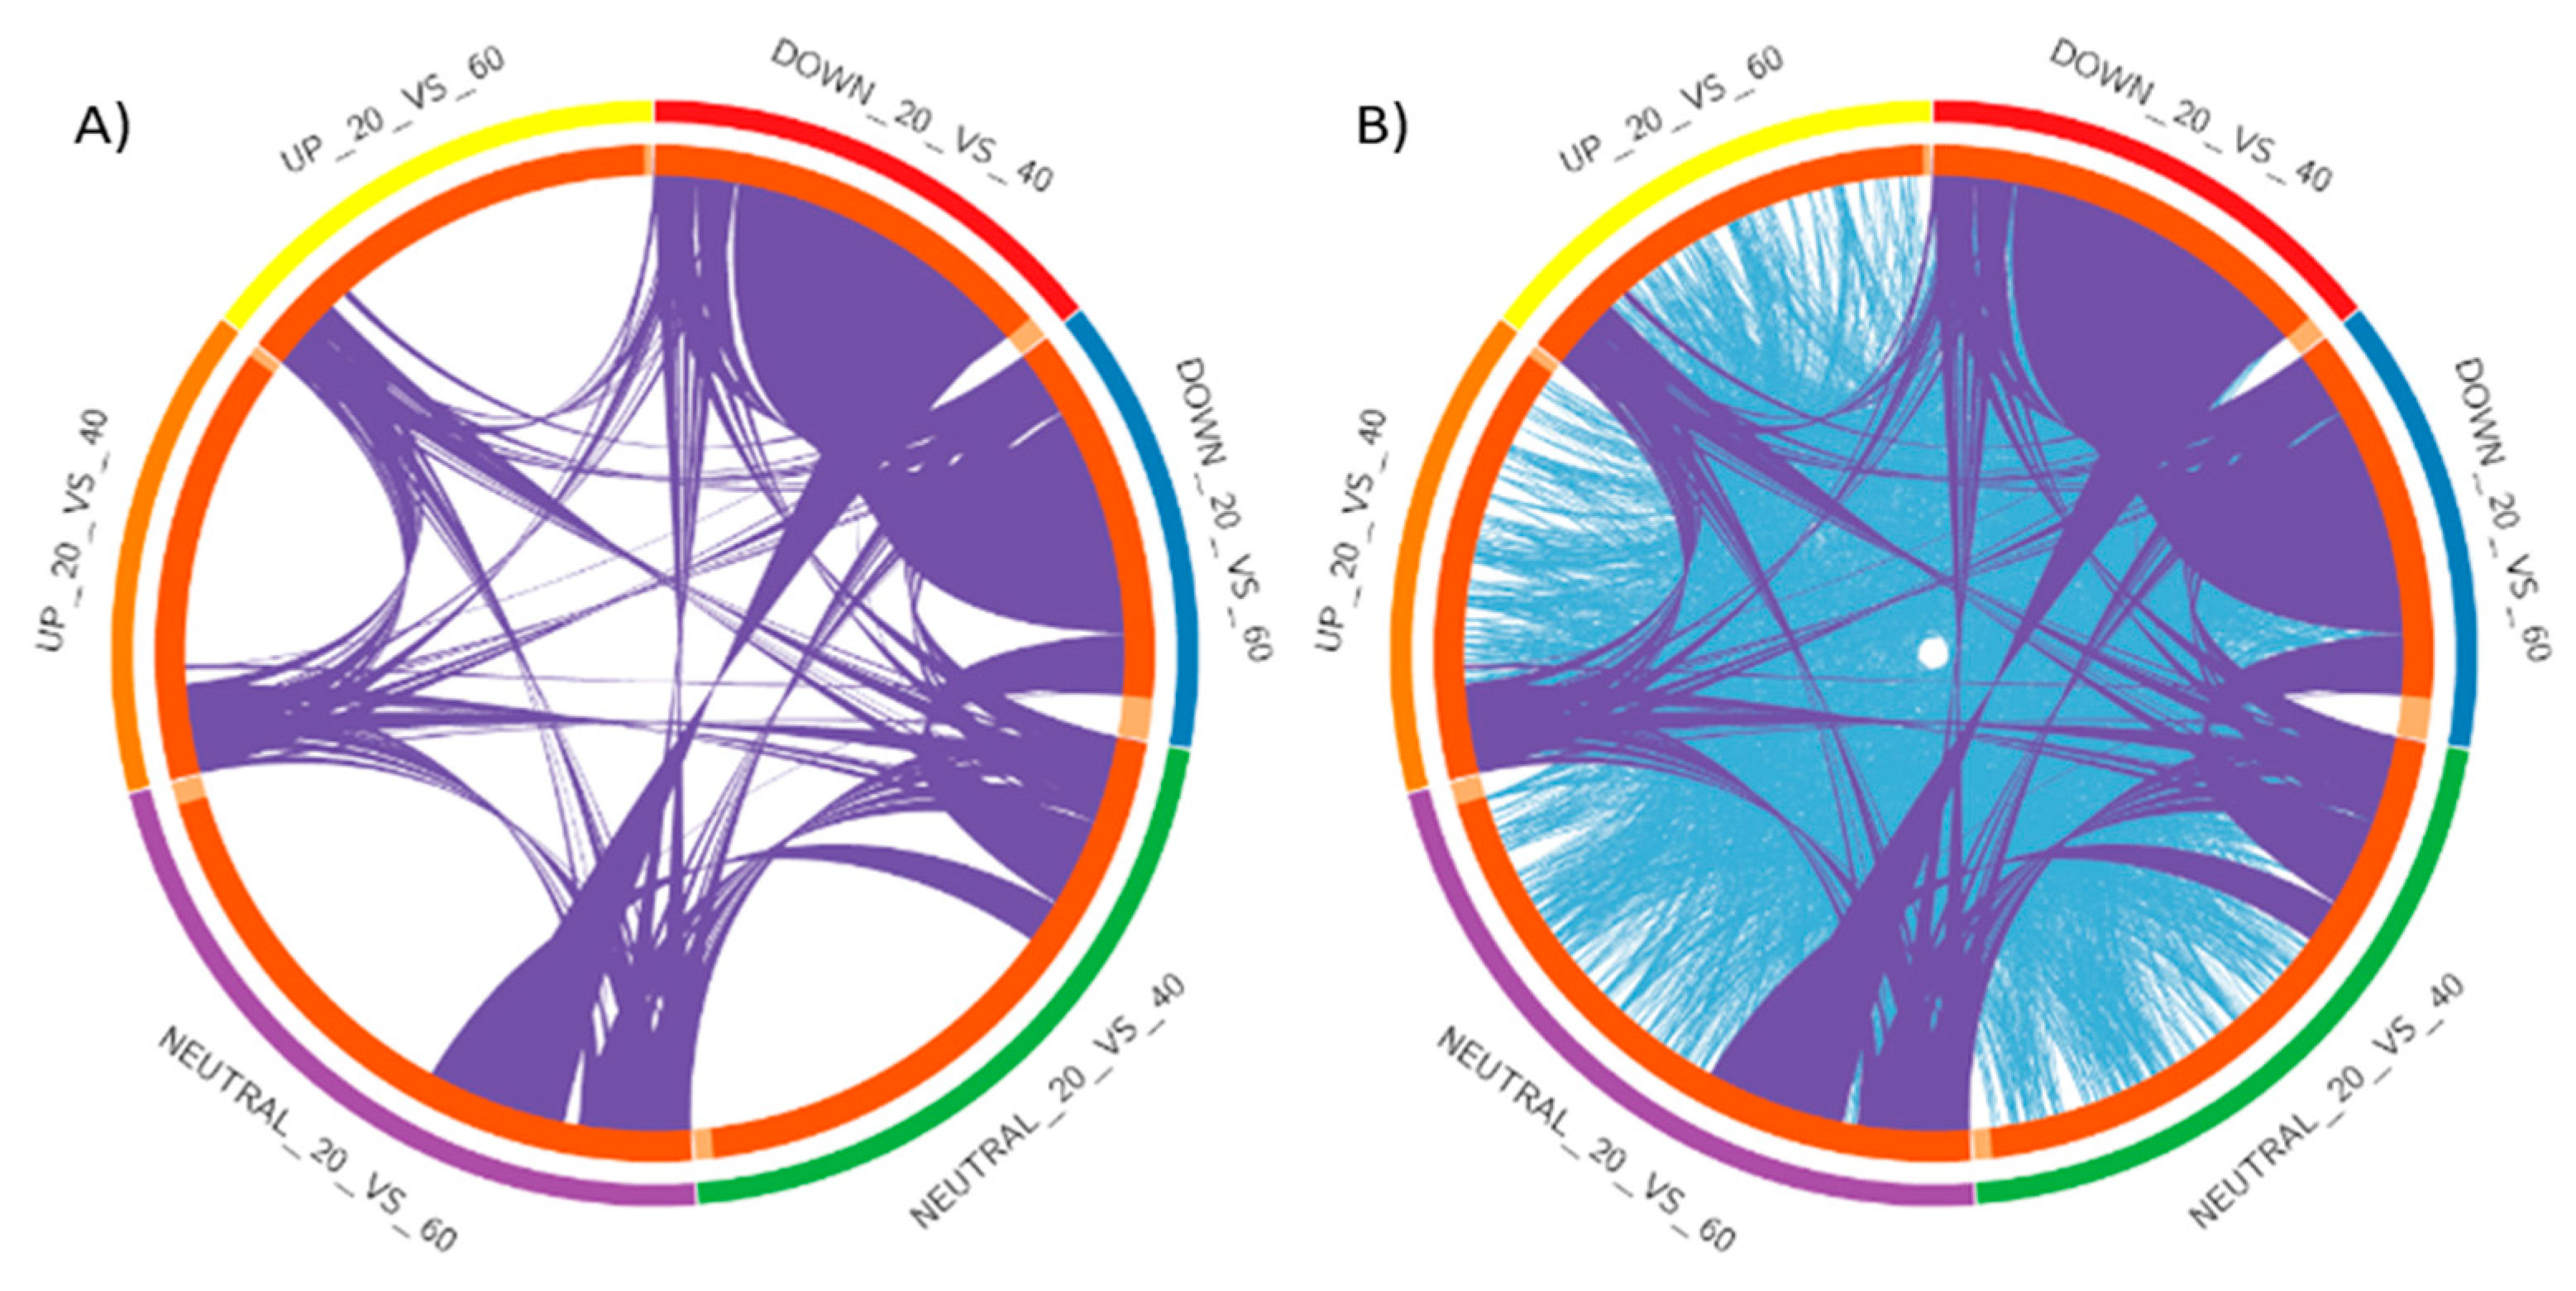
2.2. Analysis of DEGs and Annotation

In order to identify differentially expressed transcripts/genes (DEGs) among the liver transcriptomes of control and high CHO-fed fish, comparative analyses were performed. The differential expression analysis revealed that totals of 15,232 and 15,360 transcripts were differentially expressed in the liver tissues of rohu fish fed with 40 and 60% CHO as compared to the control group (20%). Among that, 4464 transcripts were up-regulated, while 4343 transcripts were found to be down-regulated and 6425 were neutral in the control versus fish fed with 40% CHO. In the fish fed a high CHO (60%) diet, 4478 transcripts were up-regulated, while 4171 transcripts were down-regulated and 6711 were found to be neutral compared to the control (Figure 1). Table 2 describes the number of differentially expressed genes in the control and treated groups. The volcano plot (scatter plot) depicts the distribution of up- and down-regulated transcripts, including neutral expression, in both the control and treated groups (Figure 2). Among these DEGs, a total of 30 were identified as significantly differentially expressed transcripts/genes, and were associated with metabolism, among the control and fish fed a high-CHO diet using the criteria of adjusted P-value < 0.05 and (Log2 (fold change)) > 1. For the validation of DEGs among control and treated groups, six transcripts/genes associated with metabolism were selected for qPCR, and their relative expression patterns were consistent with the resulting liver RNAseq data. The reads were mapped to a reference database for annotation, and the liver transcriptome data of rohu were annotated with the zebrafish public database (Nr protein, KEGG, GO and COG) using BLAST2GO with an E-value cut-off of <10−5. In the BLAST search, gene names and the associated protein accession numbers with respect to transcripts were retrieved, and further gene ontology (GO) terms were assigned. The gene ontology (GO) assignments were performed for classifying the functions of expressed genes/transcripts of the livers of rohu fish based on homology searching. The functional enrichment analysis indicated that all the differentially expressed transcripts of control and treated groups were significantly enriched in three GO terms (Table S1). In the liver, the 446 up-regulated DEGs found in fish fed a high-CHO (40%) diet were significantly enriched GO terms, with 1749 in the biological processes, 1275 in the cellular components and 2286 in the molecular function categories, while the enriched GO terms in fish fed a high-CHO (60%) diet included 3119 in the biological category, 1278 in the cellular category and 2298 in the molecular function category.
The top gene ontology terms were found to be associated with biological process categories, such as behavior, cell adhesion molecules, threonine phosphatase, developmental process, growth, immunity, localization, locomotion, metabolic process receptor binding, response to the stimulus, insulin signaling, signaling liver development, etc. In the cellular component categories, GO terms were well represented in the cytoplasm, mitochondrion, exocyst, nucleoplasm, organelles, membrane, extracellular region, extracellular matrix, cell, cell junction, synapse, extracellular space, an integral component of the membrane, etc. In the molecular function group, GO terms such as binding, catalytic activity, molecular function regulator, RNA polymerase, motor activity, nucleic acid binding, signal transducer activity, protein binding, protein kinase, transcription cofactor activity, structural constituent of the ribosome, actin-binding and hormone activity were abundantly represented (Figure 3). The Circos3 plot describes overlaps between the differentially expressed genes based on their functions or shared pathways (Figure 4).

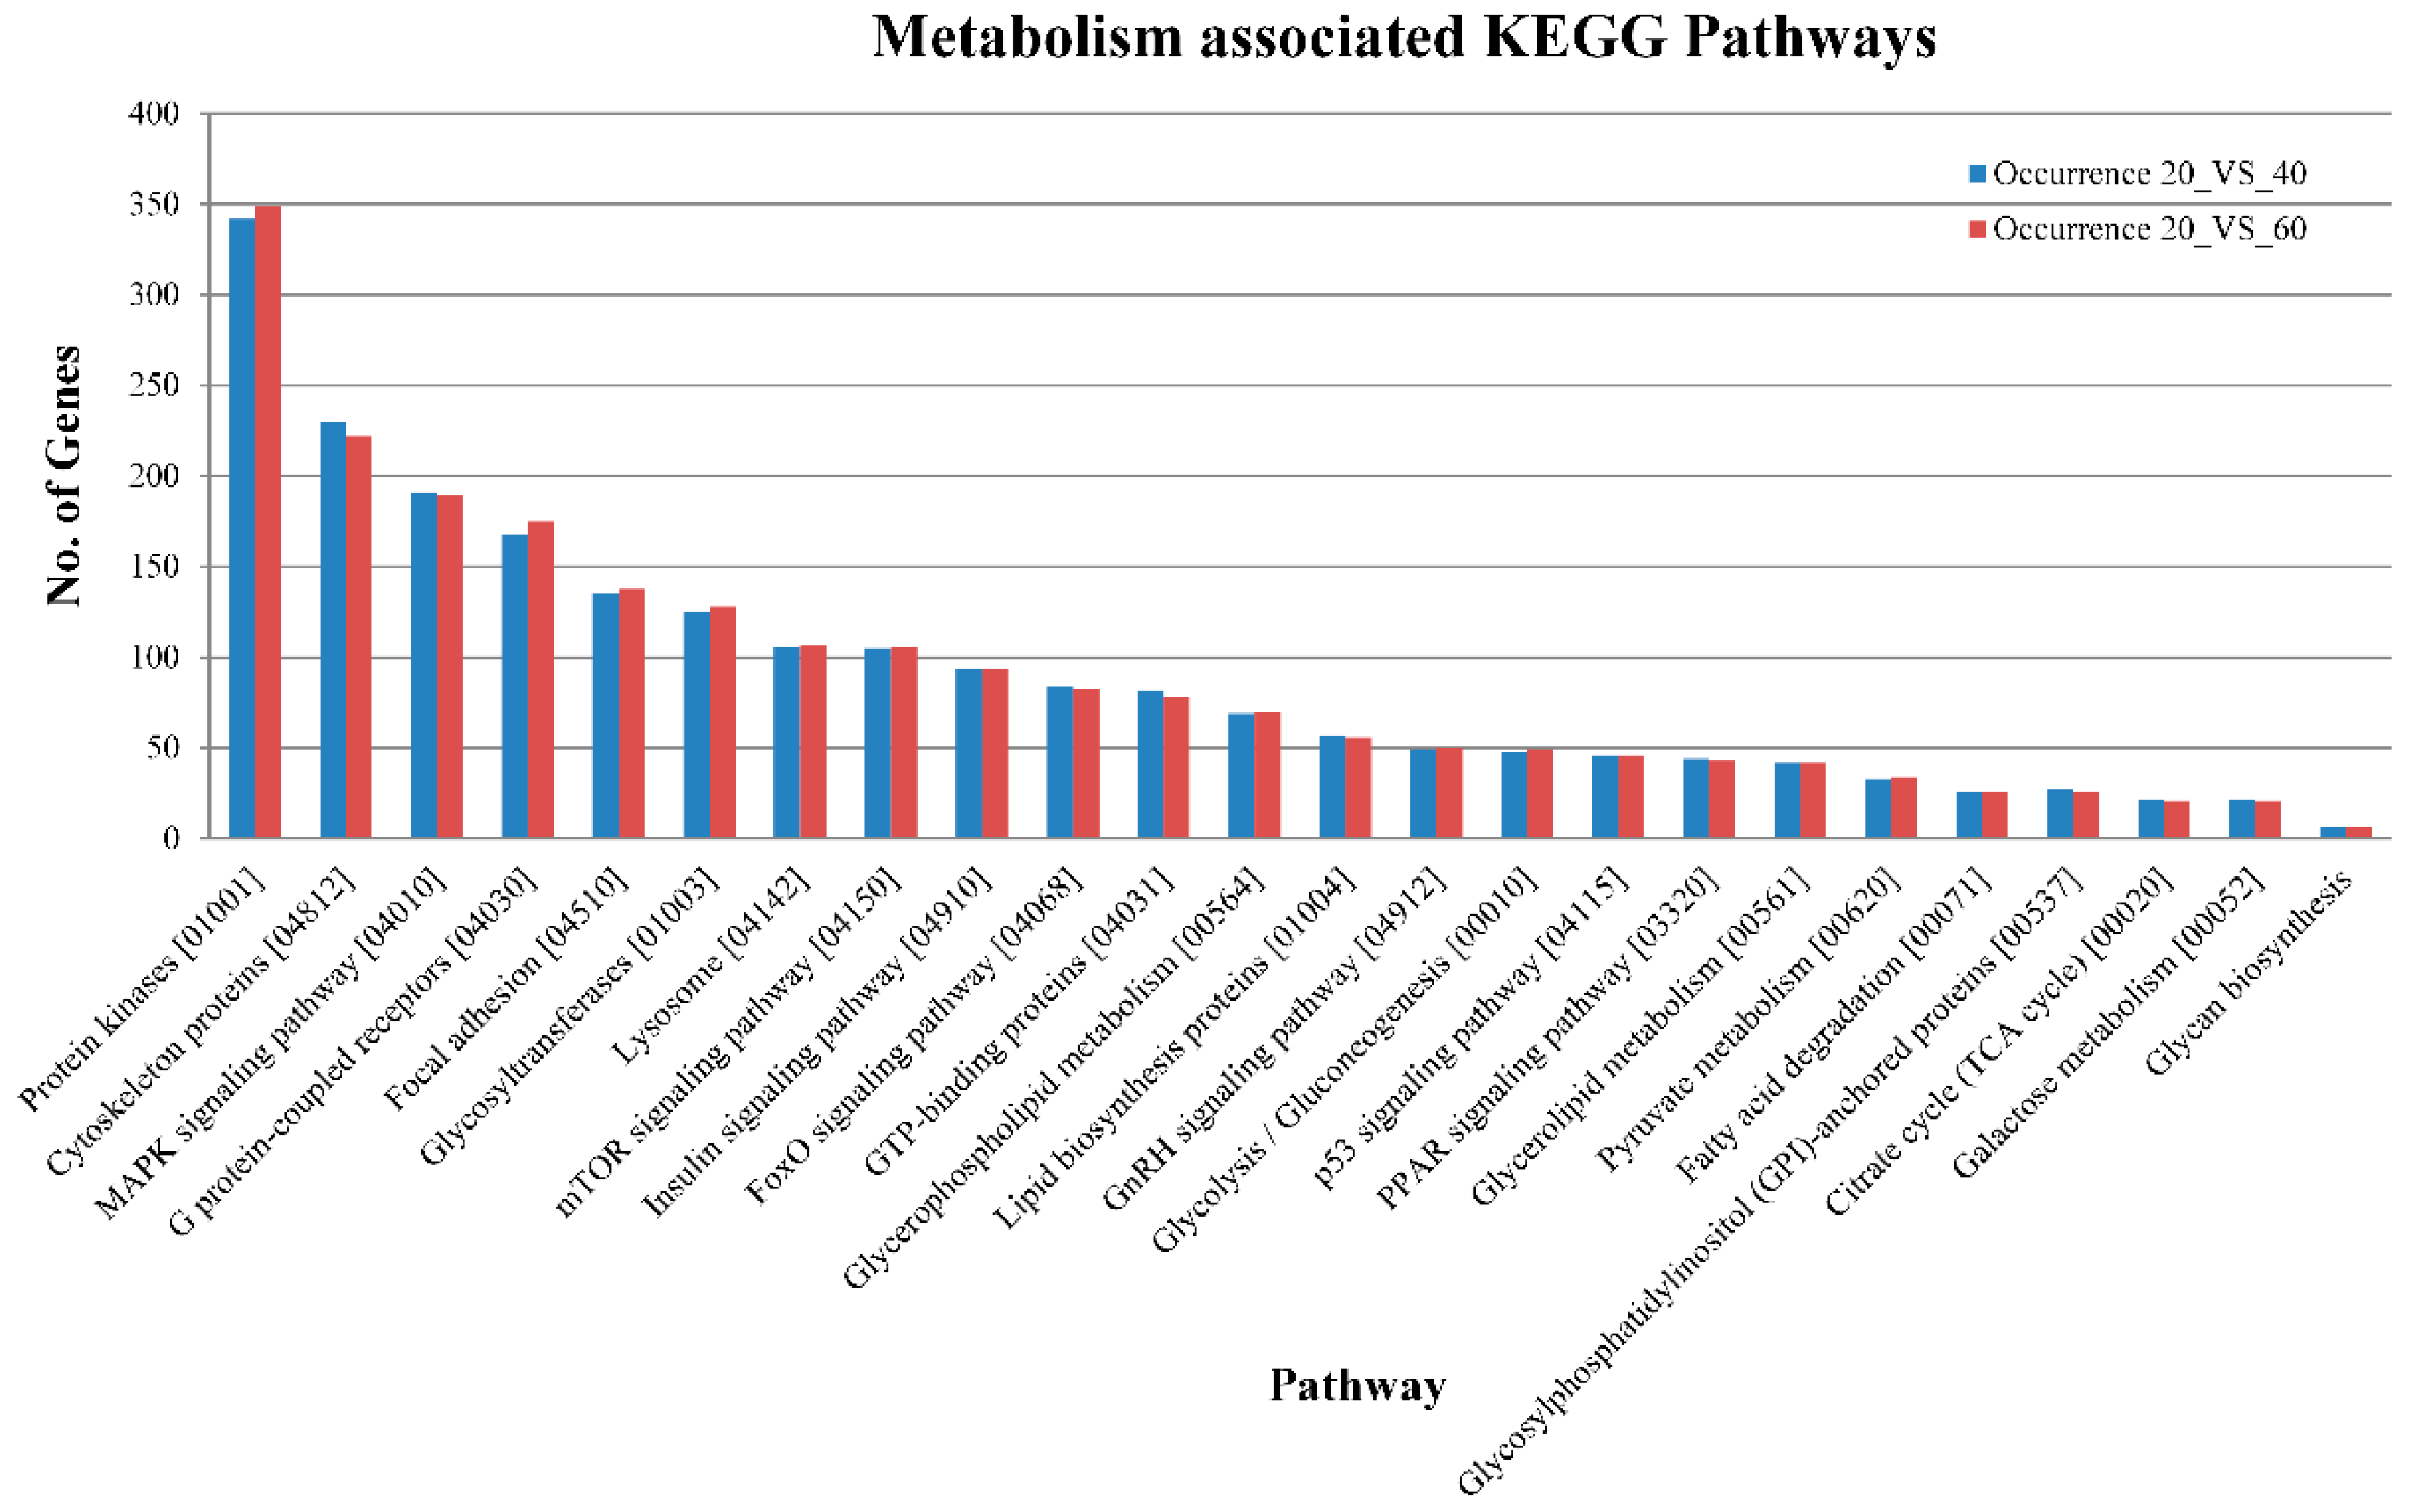
2.3. Pathway Analysis

KEGG (Kyoto Encyclopedia of Genes and Genomes) pathway analysis is mainly utilized for the systematic representation of gene/transcript functions through their network, which leads to the discovery of gene/transcript functions and their associated metabolic pathways [25]. In this study, the annotated sequences were mapped to the zebrafish reference pathways available in the KEGG database. The sequences were successfully assigned to 433 KEGG pathways in different categories, as shown in Figure 5 and Table S2. We found that metabolism-associated pathways, such as protein kinases (KID: 01001), the MAPK signaling pathway (04010), G protein-coupled receptors (04030), the insulin signaling pathway (04910), the mTOR signaling pathway (04150), G protein-coupled receptors (04030), the FoxO signaling pathway (04068), lipid biosynthesis proteins (01004), glycolysis/gluconeogenesis (00010) and the PPAR signaling pathway (03320), were the most abundant in control vs. treated groups. As per our experiment on carbohydrate metabolism, we found that 30 genes/transcripts were involved in the glycolysis/gluconeogenesis pathway in the livers of the control vs. 40% CHO and control vs. 60% CHO groups. The hexokinase, ATP dependent PFK, glycogen synthase, PHK, PGK, ACCα, PPARγ and FAS genes/transcripts were mapped against the insulin signaling pathway (04910), which depicted the involvement of genes in glucose metabolism as well as glycogen synthesis and lipogenesis (Figure 6). The insulin signaling pathways of the liver tissues of the control and treated (high-CHO) rohu fish are depicted in Figure 7.
Clusters of orthologous groups (COG) analyses were carried out to assign or classify orthologous gene products. In this study, totals of 420,648, 409,738 and 489,475 genes/transcripts in the fish of the control 20%, 40% and 60% CHO level groups were clustered into 153, 154 and 164 COG categories, respectively. Among these COGs, most were sequence mapped or assigned to cytoskeleton, general function prediction, translation, ribosomal structure, biogenesis, signal transduction mechanisms, intracellular trafficking, secretion, vesicular transport, etc. The top 26 COG categories in the control and treated groups of the fish are shown in Figure 8.
In the gene regulatory network (GRN), carbohydrate metabolism is coordinated with key candidate genes and hub genes, which were depicted in the GRN (Figure 9). These hub genes included the synaptopodin gene, the LIM and senescent cell antigen-containing domain 1-like protein, reticulon, apolipoprotein, cytochrome P450, parvalbumin alpha, protein O-mannosyl-transferase 2, supervillin-like isoform X2, transient receptor potential, melastatin 4a, myosin, light polypeptide 3, skeletal muscle, guanylate-binding protein 2, phenylalanine hydroxylase complement C4-2, TC1-like transposase, coagulation factor IXb (Zgc:136807), complement factor B/C2A, phospholipid-transporting ATPase, alpha-2-macroglobulin (fragment), S-adenosyl methionine synthase, thrombospondin 2b, notch less homolog 1 (Drosophila), very-long-chain (3R)-3-hydroxyacyl-CoAdehydratase, obscurin-like 1b, and Sk-tropomodulin (tropomodulin 4 (muscle)). The detailed roles of each of the hub genes involved in the gene regulatory network are described in Table 3. Other major functional classes included the improvement of glucose homeostasis, the control of the oxidative glycolytic pathway in carbohydrate metabolism, association with fatty acid uptake by adipocytes, signaling the central hub gene, controlling glucose, and lipid metabolism by insulin. The hub genes in a given GRN have a strong tendency to exhibit pleiotropic effects. A study of these can help identify tissue- and time-specific hub gene regulators.

3. Discussion

Recent progress in sequencing technologies has led to improved genomic and transcriptomic resources in various model and non-model species, which has opened doors to address key biological questions. Through omics technologies, several studies reported a molecular-level underpinning of digestive physiology via the inclusion of nutrients and/or other dietary ingredients in the target organs of mammals and aquaculture species. In aquaculture fish, for enhancing production and sustainability, understanding fish nutrition and dietary requirements is a major concern [50]. Carbohydrates are the cheapest source of energy, which determines the input cost of aquaculture production. A few studies revealed that the inclusion of carbohydrates in the diets of fish has positive impacts on aquaculture. Prolonged postprandial hyperglycemia is mainly observed in several fish species (specifically in carnivorous fish) upon feeding with a high-carbohydrate diet [10,51]. The molecular level of glucose intolerance is not understood for several commercially important aquaculture species. Therefore, a study of the system biology network integrated with high-throughput sequencing technologies needs to be applied to delineate the molecular events of key metabolic genes and pathways, which could be used as indicators of carbohydrate/glucose digestibility. In this study, to delineate the molecular level responses of Jayanti rohu, L. rohita, upon feeding with different levels of gelatinized starch (20%, 40% and 60%), we performed a total liver transcriptome sequencing to identify the modulation of the key metabolic transcripts/genes and pathways involved in carbohydrate metabolism. Earlier studies hypothesized that the lower metabolic use of enriched carbohydrates/glucose in fish has been attributed to a poor molecular-level regulation of key metabolic genes, as well as their associated pathways, i.e., inefficient glycolysis, inability to produce glucose via gluconeogenesis, and low efficiency of lipogenesis [14,52,53,54].
In this work, the differential expression profiles of all the key metabolic genes/transcripts, changes in the hepatic glucose transporters, and associated pathways, were systematically analyzed using the liver transcriptome data, and they were found to be involved in processes of carbohydrate metabolism such as glycolysis, glycogenesis, gluconeogenesis and lipogenesis (Figure 10 and Table S3). The liver is a vital organ and the main source of energy for different activities of metabolism, and it synthesizes key enzymes/hormones and transporters [55]. It plays an essential role in glucose homeostasis via the modification/induction of glucose transporters (GT), as well as key enzymes, including the pathways associated with net glucose flux in the hepatocytes, for achieving successful glucose production from the substrate energy yield [10,56].

3.1. Alteration in Alpha Amylase and Glucose Transporter Activity

Most fish possess α-amylase (EC 3.2.1.1) activities, which mainly break down the polymers of glucose molecules (α-glycosidic linkages), such as starch/glycogen, but are unable to cleave the β-glycosidicanomeric bonds of some polysaccharides, for example cellulose or hemi-cellulose, etc., which determine CHO digestion efficiency [32]. In the present study, we used a gelatinized starch in the feed preparation, and upon feeding we observed an increase in α-amylase expression activities in the fish fed at a 40% CHO level as compared to the control. This was also increased in the fish fed a 60% CHO diet. Several studies emphasized that the inclusion of a gelatinized starch polysaccharide is the best method to achieve carbohydrate digestibility [32,33]. However, carnivorous fish, such as catfish, exhibited lower amylase activity as compared to herbivorous and omnivorous fish (for example, carp, tilapia) [37].
Several isoforms of the glucose transporters (GLUT) are reported to act as glucosensing systems, and play a vital role in the transport of glucose molecules into hepatocytes or muscle cells during carbohydrate metabolism mediated by insulin [53,57,58,59]. There are 14 members of the glucose transporters/GLUT protein family [60,61]. In our studies, we observed that hepatic glucose transporter 2 and solute carrier family 2 (facilitated glucose transporter), member 8 (slc2a8), activities were increased in the livers of fish fed a high-CHO diet as compared to the control, while the sodium-dependent glucose transporter 1 expression was neutral in both groups. However, recent studies have shown that modulations of the gene expression activities of glucose transporter 1 occur in grass carp, Ctenopharyngodon idellus, fed with high dietary carbohydrate levels [62]. Contrastingly, hepatic GLUT1 and GLUT2 were dysregulated in tilapia after 1–3 h due to the inclusion of high CHO in the diet, while an increase in the plasma glucose level was observed [63]. In carnivorous fish, such as rainbow trout and Atlantic cod, the expression level of hepatic glucose transporters 2 (GLUT2) did not rely on the feeding regime (i.e., feeding or fasting status), but hepatic GLUT2 and muscle-specific GLUT4 gene expression were stimulated in the rainbow trout during re-feeding [64,65,66,67].
Recent studies have implied that the down-regulation of hepatic GLUT2 gene activity occurred due to the inclusion of high CHO in the diet of Japanese flounder and rainbow trout, and thereby reduced the activity of the PI3K-AKT signal transduction pathway and glycolysis [68,69]. The present study is also in line with an earlier report, which demonstrated that high dietary CHO assimilation was inhibited due to the failure of mechanistic glucose transportation across hepatic cells [6]. In higher vertebrates, the hepatic GLUT4 gene expression in hybrid giant grouper was increased due to the inclusion of digestible CHO, such as maize starch, in the diet [70]. In our study, we did not observe any expression transcripts of GLUT4 in any of the treated groups compared to the control.

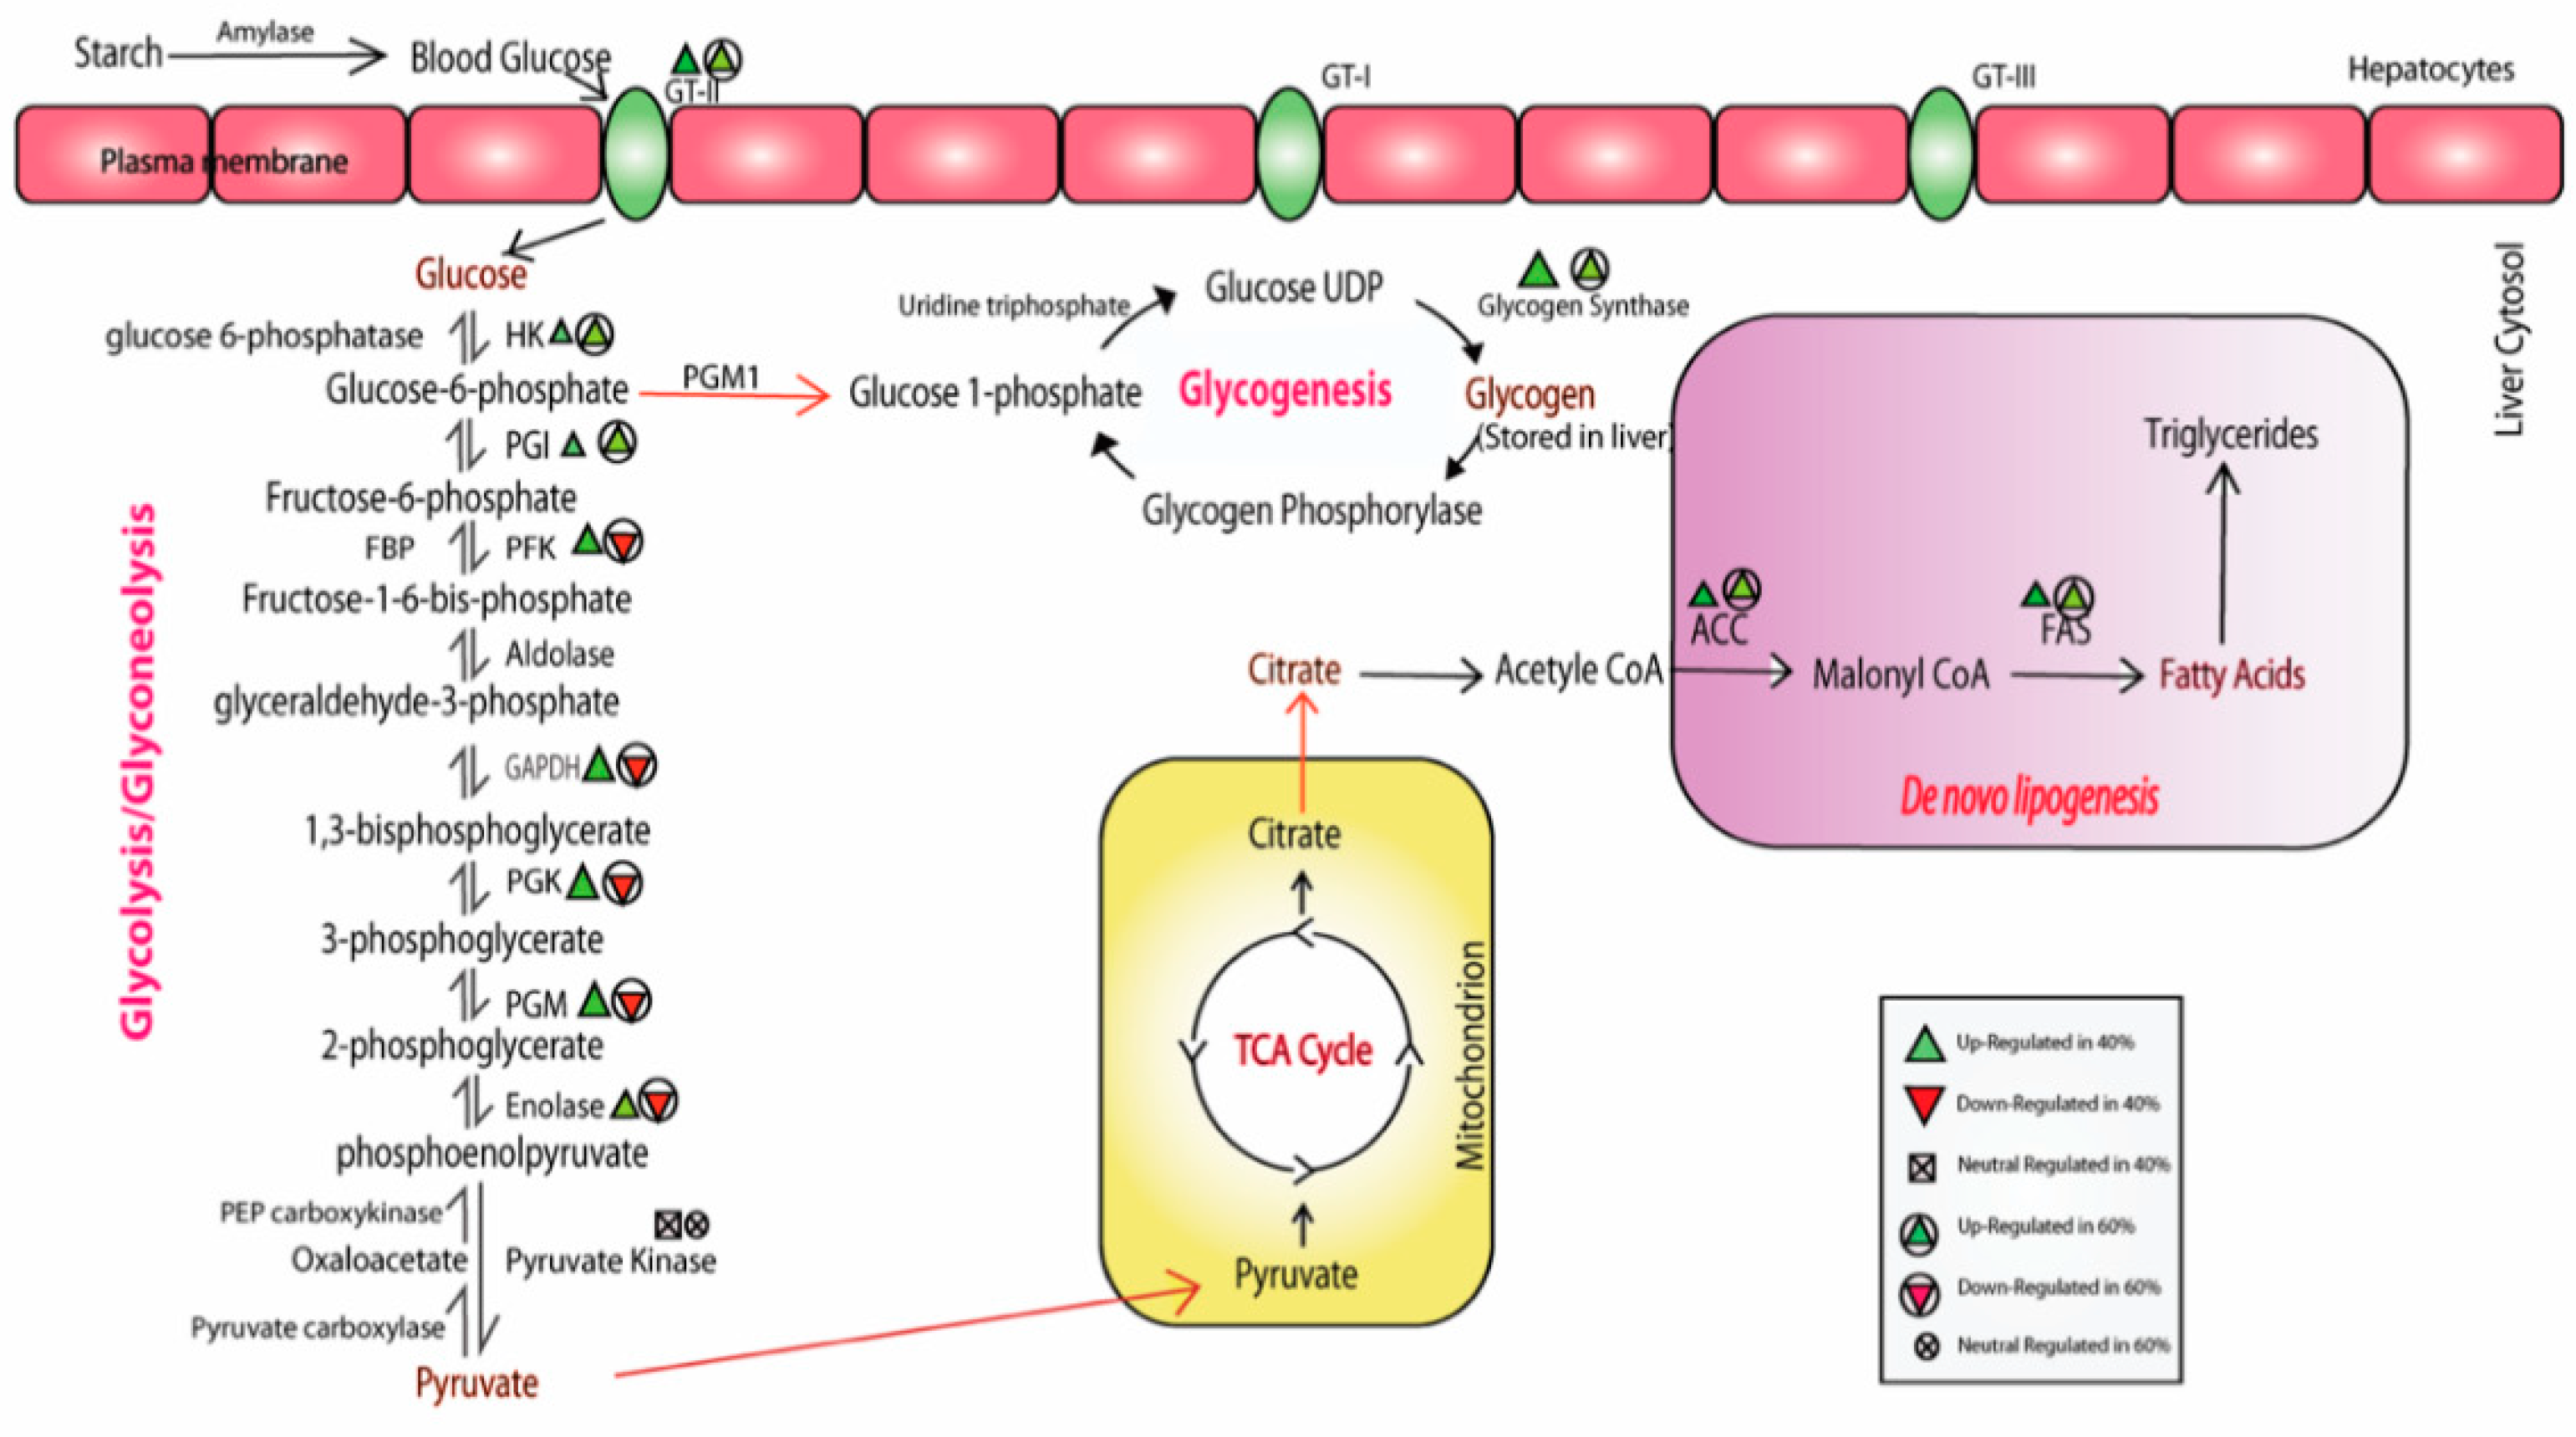
3.2. Modulation of the Glycolytic Mechanism

The metabolic activities in the liver are tightly controlled and mediated by the insulin signaling pathway, which in turn maintains glucose homeostasis [55,71]. In the liver, glucose is taken up by hepatocytes with the help of glucose transporters, and further converted into pyruvate via glycolysis. ATP energy generation, followed by the TCA cycle and further excesses of CHO, induces the process of glycogen synthesis and de novo lipogenesis. The key regulatory enzymes, such as glucokinase, (GK/GCK) or hexokinase (HK), pyruvate kinase (PK) and phosphofructokinase (PFK), play a vital role in glycolysis in the liver [72,73,74]. The inclusion of high levels of CHO/glucose in the diet enhanced GK gene expression in several aquaculture species, such as rainbow trout [64], which is the first key enzyme in the glycolysis process.
In our study, we also observed a heightened expression of the hexokinase 1 gene in the 40% CHO-fed fish as compared to the control; contrastingly, HK1 expression was down-regulated in the 60% CHO-fed fish as compared to the control. Similarly, the phosphofructokinase (PFK) expression level showed similar trends to hexokinase in all treatment groups. GK and PFK are two key indicators for effective hepatic glycolysis in several fish, such as tilapia [53,63]. Recent studies showed increases in the GK, PK, PFK and G6PDH gene activities in the livers of Megalobrama amblycephala due to the incorporation of high CHO levels in the diet [62,75,76], and similar trends were observed in other species, such as gilthead sea bream (Sparus aurata) [71], rainbow trout (Oncorhynchus mykiss) [10,12,77,78], tilapia [63], giant grouper (Epinephelus lanceolatus) [70], juvenile largemouth bass, and Micropterus salmoides. Subsequently, we observed an increased level of expression of the key enzymes of glycolysis in the control vs. fish fed a 40% CHO diet, while they were down-regulated in the control vs. fish fed a 60% CHO diet. The enzymes associated with gluconeogenesis were found to be down-regulated in both the groups of fish.
The pyruvate kinase (PK) gene is the major key regulatory enzyme of the glycolytic pathway, and studies have reported an increase in its expression profile due to high CHO levels in the diets of fish [79] such as perch (Perca fluviatilis) [80], gilthead sea bream (Sparus aurata) [81], European sea bass [82], gibel carp (Carassius auratusgibelio) and Chinese long snout catfish (Leiocassis longirostris gunther) [83]. The hepatic PK gene expression activities were enhanced significantly in grass carp with an increase in the percentage of CHO levels in the diet [74]. Interestingly, our results showed a neutral expression profile for the PK gene in all the treatments, including the control. In common carp (Cyprinus carpio), pck transcription was strongly inhibited as a result of feeding [84], while g6pc expression was sharply down-regulated after feeding in gilthead sea bream [64,84].

3.3. Glycogen Synthesis Enrichment due to High CHO in the Diet

It has been reported that excess glucose available from the diet is stored in the form of glycogen in the liver through the process of glyconeogenesis [56,85,86]. We observed an increase in the glycogen synthase (GYS) and UDP-Pyrophosporylase expression levels, possibly due to induction in the process of glycogenesis in the liver of rohu for glycogen storage. This trend was similarly reported in Megalobrama amblycephala, gilthead sea bream and golden pompano (Trachinotus ovatus) [75,77,87] when fed a diet with increased CHO levels. In tilapia, glycogen accumulation in the liver is induced with the help of the key gene glycogen synthase (GYS) [63].

3.4. Impact of High-CHO Diet on Gluconeogenesis and Lipogenesis

Gluconeogenesis is the reverse process of glycolysis, which produces glucose using pyruvate as a substrate. Several studies reported that this process is only activated during fasting challenges in fish for ATP energy production. Excess glucose availability in the liver represses the enzymatic activities of gluconeogenesis. The regulatory enzymes include fructose bisphosphatase (FBPase) and phosphoenolpyruvate carboxylase (PEPCK-C), which mainly control the key steps of gluconeogenesis. A higher level of FBPase gene expression was observed in fish fed with a starch diet, namely, European sea bream and gilthead sea bass [10,82]. A down-regulation of the key enzyme G6Pase’s activity in the gluconeogenesis pathway has been observed in Megalobrama amblycephala fed with dextrin [88], and this was up-regulated during fasting in the livers of rainbow trout [89,90,91]. The hepatic gluconeogenesis pathway (PEPCK mRNA expression and activity, and G6Pase activity) in zebrafish, D. rerio adults, was repressed by feeding them with early high CHO after CHO intake [92]. In the juvenile golden pompano (Trachinotus ovatus), the endogenous glycolysis pathways were enhanced, while the gluconeogenesis process was down-regulated by an increase in the dietary CHO level [93].
In the liver, excess amounts of carbohydrates (pyruvate) convert into fatty acid via the de novo lipogenesis pathway [7]. The acetyl-CoA produced through the citrate acid cycle converts into malonyl-CoA using acetyl-CoA carboxylase (ACC), and then palmitic acid is produced by fatty acid synthase (FAS) with NADPH as a precursor. It has been reported that de novo lipid synthesis is modulated by enhancement of the dietary carbohydrate level or increases in the glucose load in the diets of fish [75,94,95,96,97,98,99,100]. Here, fatty acid synthase (FAS) plays a critical role in the process of de novo lipid synthesis. This study also showed an increase in the expression levels of fatty acid synthase (FAS), acetyl-CoA carboxylase α and malonyl-CoA in fish with higher CHO levels in the diet compared to the control group. In blunt snout bream, Megalobrama amblycephala, the hepatic FAS, acetyl-CoA carboxylase α, delta-6 fatty acyl desaturase, and peroxisome proliferator-activated receptor γ (PPARγ) showed elevated expression levels, which indicates induction of the lipogenesis pathways in the liver due to increases in CHO level in the diet [75]. Recently, a study on the liver of tilapia showed the up-regulation of transcripts such as accα, fas and dgat2 due to the incorporation of high CHO levels in the diet, but hepatic lpl and fatp5 expression showed no significant consequences [98,101,102,103].
The heightened level of cd36 gene expression was also observed in large yellow croakers fed with high-CHO (starch) and low-lipid diets, which implied that cd36 is crucial for lipid homeostasis via regulation of the PPAR pathway [104]. Elevated levels of hepatic accα, fas and dgat2 gene expression have been demonstrated in rainbow trout (Oncorhynchus mykiss) due to high levels of dietary CHO carbohydrates [105,106]. The induction of lipogenesis was observed in our study, with evidence of associated elevated gene expression, which may not be directly linked with glucose metabolism, but the enriched pathways implicated their role in glucose homeostasis via converting excess glucose into fatty acids.

3.5. Immune-Associated and Stress-Related Transcriptional Changes in the Liver due to the Inclusion of a High-CHO Diet

It was plausible to enhance the stress response and immunity-related gene modulation in fish fed with a formulated diet [107]. It has been reported that the cortisol level increased in M. amblycephala and Erythroculterilishaeformis bleeker [3] due to the high CHO level in the diet, which indicated stressful conditions for the fish. Similarly, plasma lysozyme activity decreased in several fish, with an increase in dietary CHO, of the species Epinephelus malabaricus and M. Amblycephala [108]. The down-regulation of constitutive immune genes was observed in the liver of Atlantic salmon under starvation using a transcriptome study [107]. At the molecular level, heat shock proteins (HSPs) are stress indicators that are involved in stress response, cell protection and improved tolerance level [109]. In rainbow trout, higher levels of CHO increased the HSP70 gene expression [73] and levels of hepatic HSP70 in Wuchang bream (M. amblycephala) fed with 53% CHO compared to control [110]. In contrast to this, we could not observe any differential expression pattern of HSP70 among control and treated rohu fish. The HSP70 transcript was detected only in fish fed with the 40% and 60% CHO-level diets. Interestingly, fish fed with high percentages of CHO (40% and 60%) showed an increase in HSP90 and associated transcription factors, which act as chaperones and folding catalysts, such as hsp90b1, dnajb1b, hspa4a, hspb7/8, etc. Specifically, we detected higher expression levels of Activator of HSP90 ATPase homolog 1, DnaJ (HSP40) homolog and HSP60 in the fish fed a 60% CHO diet compared to the control group counterpart, which indicated the emergence of stress in liver cells.
We detected increased expressions of cytokine receptors such as IL-6 and suppressor of cytokine signaling 3 (SOCS3) in the livers of fish fed with high CHO as compared to the control. This is in line with earlier studies, in which the augmented levels of the expressions of IL-6 and SOCS3 resulted in chronic stress, as well as impacteing the glucose transport system of Japanese flounder (Paralichthys olivaceus) fed with high dietary CHO [68]. Recent studies revealed that immune-associated transcriptional changes in the liver of Epinephelus akaara occurred due to a high level (30%) of carbohydrates in their diet, which in turn resulted in the over-expression of immune-related genes such as CXCR4, CCL4, IL8, TLR9 and NFκB inhibitor alpha, etc. [111]. In this study, the genes associated with the chemokine signaling pathway, such as C-C motif chemokine 4 (CCL4), C-X-C chemokine receptor type 4 (CXCR4) and C-X-C motif chemokine 10 (CXCL10), were significantly expressed in the group fed a high-carbohydrate diet.
A high CHO level can lead to the over-expression of immune-related genes, which may activate acute inflammatory processes in the liver. Toll-like receptors (TLR), tumor necrosis factor (TNF), interferon regulatory factor 3 (IRF3) and tumor necrosis factor receptor (TNFR) belonging to the Toll-like receptor signaling pathway showed differential levels of expression patterns in fish fed with different levels of CHO in their diet. TLR3, TLR5, IRF3, IRF5 and IRF5 were up-regulated in the livers of fish fed with high CHO levels compared to the control group. This is in line with earlier reports, which demonstrated that modulation of the liver transcripts was associated with the Toll-like receptor signaling pathway in fish fed a high-carbohydrate diet [111]. Interestingly, some of the TLR isoforms, such as TLR22, TLR1 and TRAF3, were found to be down-regulated in the livers of fish with high CHO levels in their diet. Subsequently, our analysis of fish fed with high levels of CHO reported the up-regulation of transcripts such as Death-domain-associated protein, Caspase-6, Lamin B3, Cathepsin Z, DAB2-interacting protein b, and Membrane protein, palmitoylated 5b (MAGUK p55 subfamily member 5), which are associated with the apoptosis pathway, possibly inducing hepatic cell death through the extrinsic pathway of programmed cell death (PCD) via the modulation of the p53 signaling pathway. The incorporation of dietary carbohydrates may lead to stress as well as lower immunity through the innate and adaptive immune system. Overall, the up-regulation of a large number of immunity- and stress-related genes in the immune system pathway revealed that the rohu fish’s liver may experience an inflammatory response. The stress in the hepatic cells occurred due to the excess levels of glucose, via modulation of the isoform of the enzymes. Overall alteration in metabolic pathways may occur in liver tissues due to the effects of temperature or oxygen levels on the metabolism of fish, which is a vital area of research and is lacking in the present work.

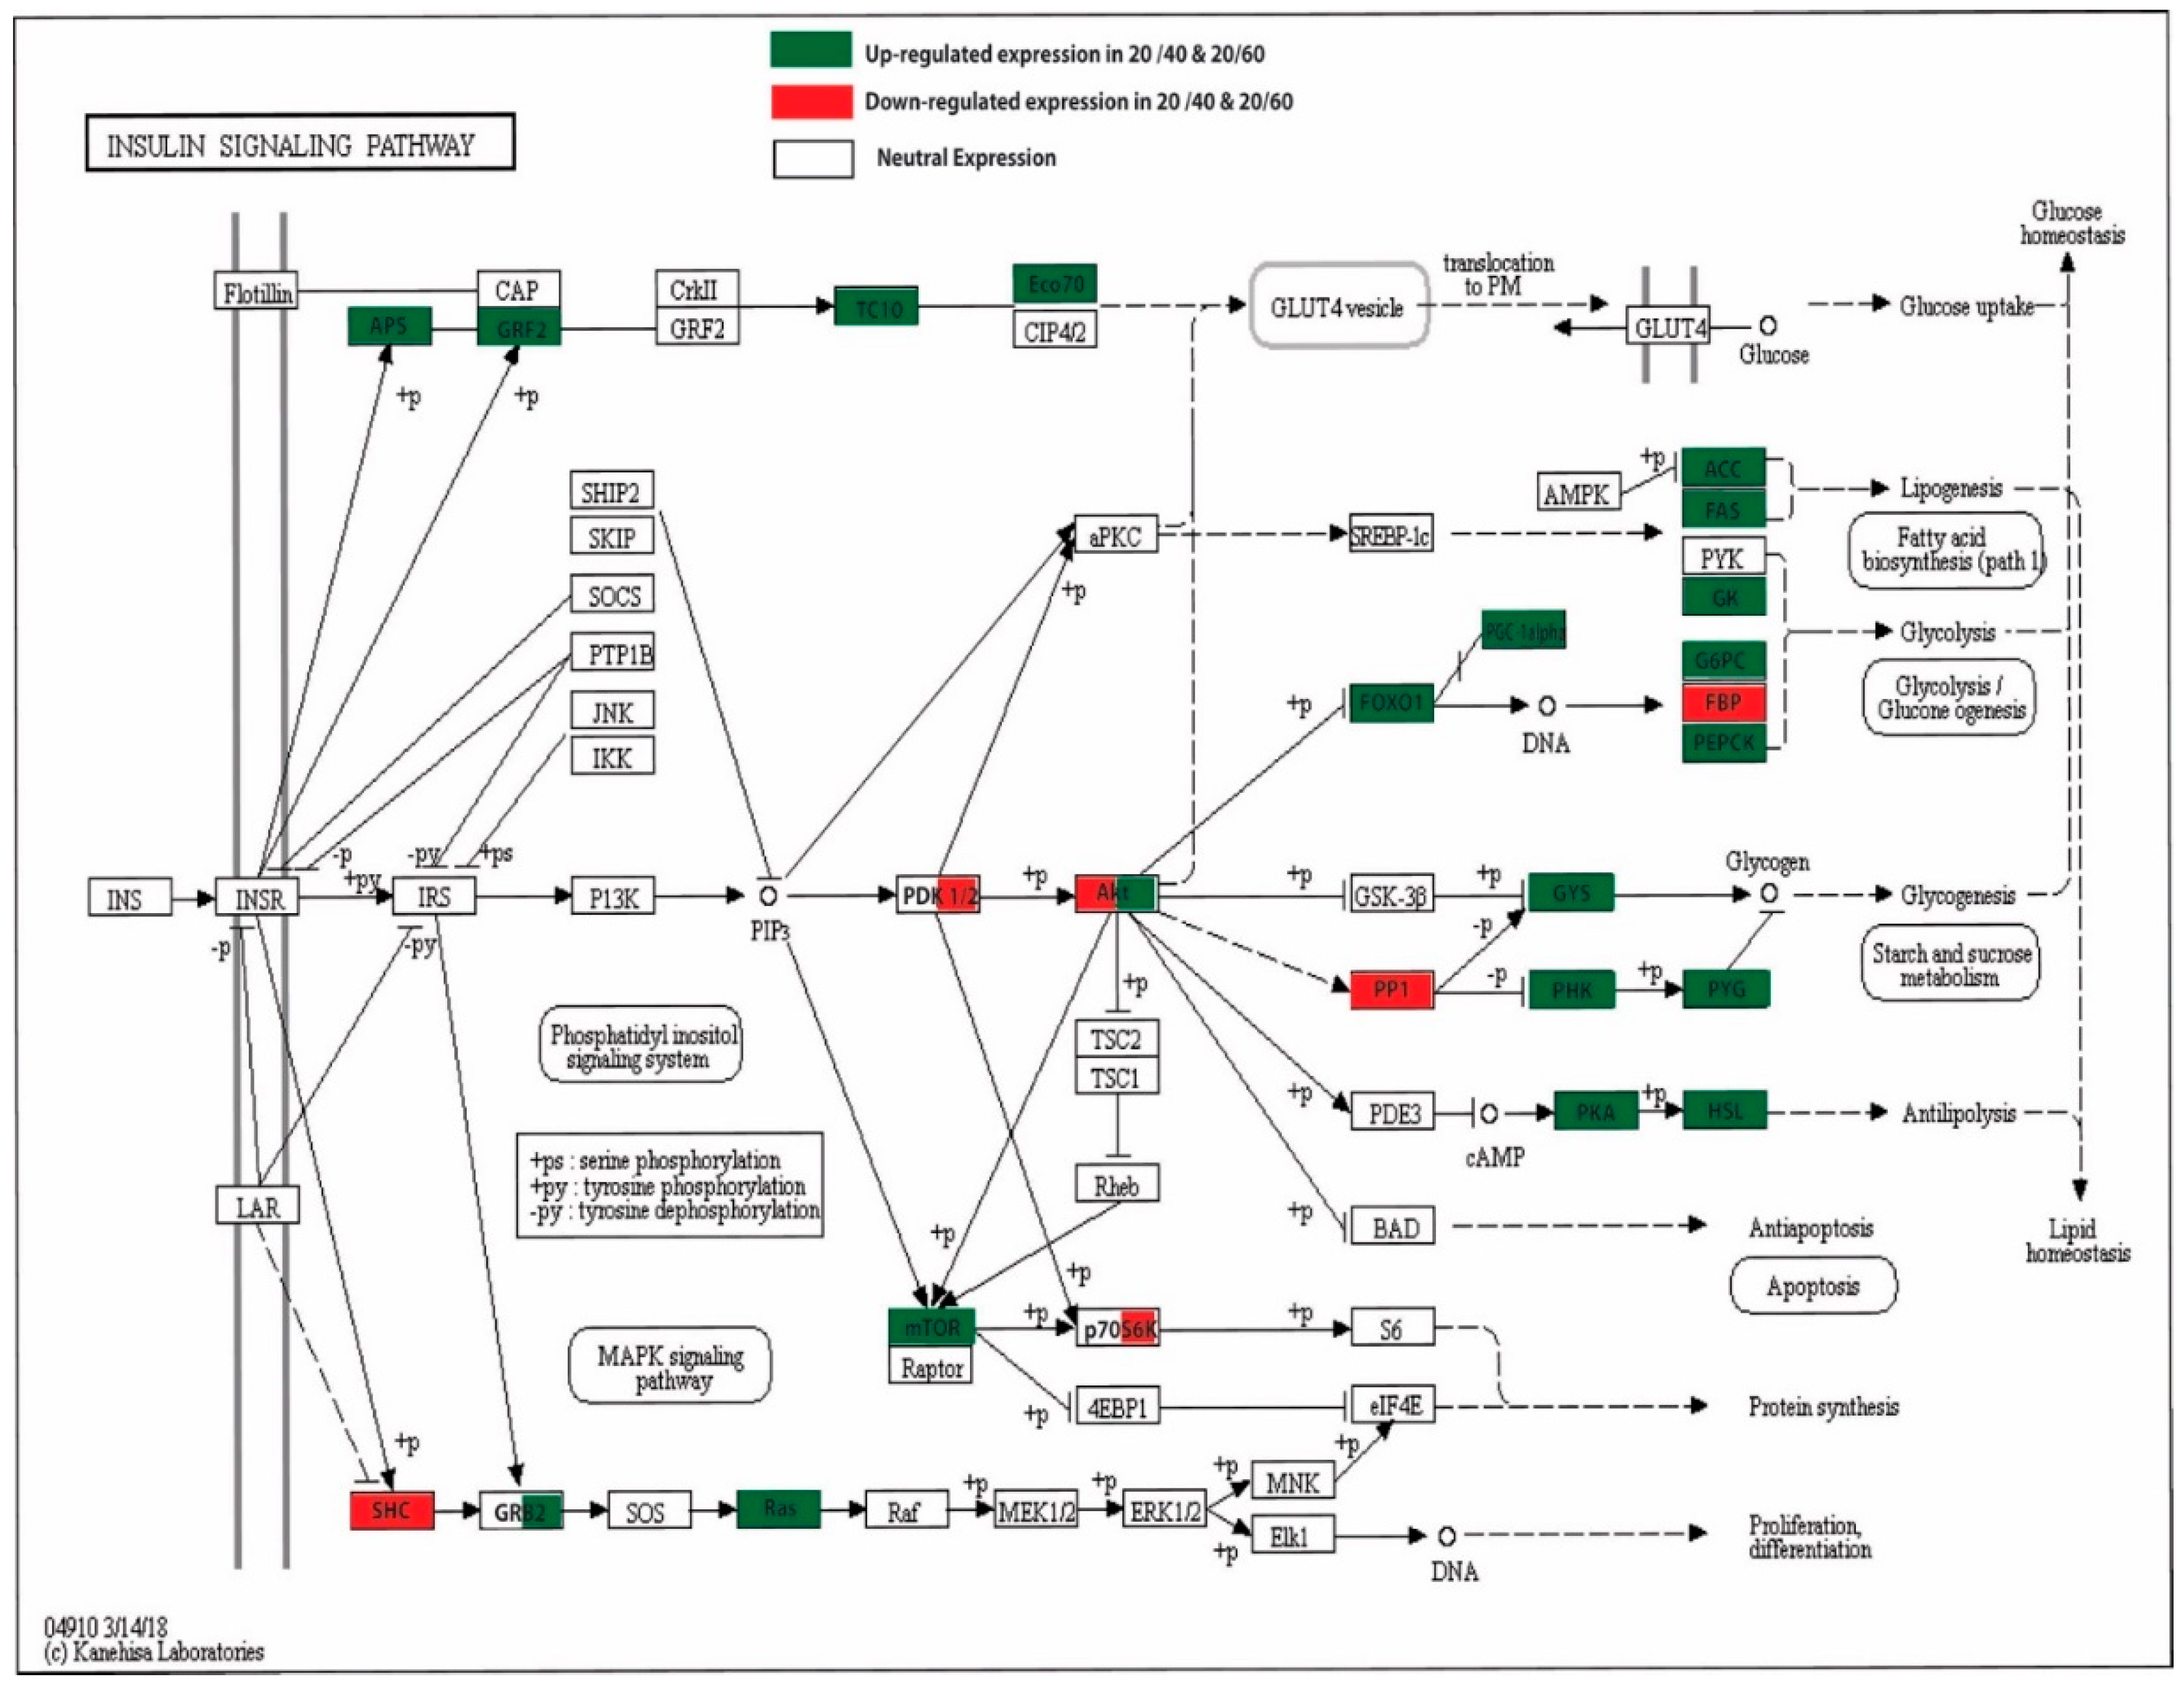
3.6. Insulin Signaling Pathways, mTOR, and the PPAR Signaling Pathway

The insulin signaling pathways are mainly involved in maintaining glucose homeostasis via the uptake of glucose for substrate energy generation, as well as excess glucose storage in the liver (in the form of glycogen via glycogenesis) and the induction of de novo lipid biosynthesis. After the consumption of carbohydrates, insulin promotes the entry of blood glucose using glucose transporters via modulating various series of genes, including GTs, insulin receptors, IRS and hexokinase, and activates the IRS-PI3k-Akt pathways. In our study, we observed active insulin signaling pathways in the livers of fish fed a high-CHO diet, which is in line with earlier reports (Figure 7). In this pathway, INS actions are mediated via insulin receptors (receptor tyrosine kinase family), and then by further modulating pathways [112]. High CHO levels in the diet result in hyperglycemia in rainbow trout, which activates the components of the insulin-signaling cascade. The modulation of the insulin signaling pathway (Akt/TOR) and a postprandial expression pattern of the genes related to metabolism were observed in rainbow trout fed with different carbohydrate to protein dietary ratios [78].
We observed increased levels of expression of key genes of the insulin signaling cascade, such as phosphatidylinositol 3-kinase (PI3K), which subsequently phosphorylates other proteins such as AKT, also known as protein kinase B. This cascade (IRS-PI3K-AKT) further modulates the mTOR pathway, which activates other cascade molecules regulation, such as ribosomal S6 kinase protein (S6K1), and this leads to an increase in metabolism and cell growth. In our study, heightened expression levels of insulin receptor substrate (IRS) were observed. We highlighted the up- and/or down-regulation of important genes involved in the insulin signaling pathway. Our study implied that the up-regulation of GLUT2 mediated glucose uptake in the livers of fish. Earlier studies also indicated the modulation of Akt for insulin signaling, and S6k for mTOR, which regulates the metabolic pathways in the liver [69]. In contrast, in our study, the Akt and S6k expressions were not significant in fish fed high-CHO diets. Recently, researchers have depicted the up-regulation of S6K1 and IRS-1 in the livers of blunt snout bream due to an increase in arginine level (2.70%), which indicated a controlled expression of insulin [113]. In this study, we found a neutral expression of IRS and PI3K in the fish fed a high-CHO diet, and in control fish.
Lipid homeostasis is maintained through key enzymes under the control of PPARα (regulation of fatty acid catabolism) and PPARγ (regulation of fatty acid storage), which belong to the nuclear receptor super family. We observed increased levels of expression of PPAR enzymes, which enhances the lipid biosynthesis mechanism. Researchers have suggested that treatment with bovine insulin mediated the up-regulation of PPARγ and PPARα genes in yellow catfish [114,115]. In tilapia, the modulation of peroxisome proliferator-activated receptor (PPAR) and the insulin signaling pathways was observed for de novo lipogenesis due to high dietary CHO levels [101]. The AKT–mTOR pathway also represents an important pathway during metabolism, as reported in Senegalese sole fed with different dietary protein to carbohydrate ratios [116,117]. It has been reported that the de novo lipogenesis mechanism was enhanced due to the modulation of genes such as sterol regulatory element-binding protein 1c (SREBP1c) and TORC1 [118,119], and that transcripts linked with lipogenesis and SREBP1 were up-regulated via the mTOR-dependent pathway. In this study, the FAS, ACCα and PPARγ genes associated with de novo lipogenesis were found to be up-regulated significantly in the livers of fish fed a high CHO diet compared to control fish, but we could not detect transcripts for the sterol responsive element binding protein (SREBP1) in the livers of either control or treated fish. This clearly indicates that the inclusion of high CHO levels in the diet can promote de novo fatty acid biosynthesis and fat accumulation in the livers of fish via activation of the mTOR pathway.

4. Materials and Methods

4.1. Experimental Diet Preparation and Feeding Experiment

The experimental feed was formulated in our laboratory and contained three different levels (20%, 40%, and 60%) of dietary carbohydrates (gelatinized starch) (Table 4). The 20% carbohydrate diet was considered as the control and the 40% and 60% carbohydrate levels were designated as high-carbohydrate diets (CHO). Fish meal and casein served as protein sources and corn starch was used as the main source of carbohydrates. The corn starch was gelatinized with the addition of water in an autoclave at 120 °C for 1 hr. All the ingredients were weighed and mixed properly with the addition of oil and water. The prepared dough was pelleted using a hand pelletizer and dried in hot air over night at 60–80 °C. The dried pellets were broken and sized using a grinder into pieces with a 2–3 mm diameter and stored in polyethylene bags at room temperature (30 ± 2 °C) for further use. The experimental fish (40–50 g) were collected from nursery ponds of the Division of Fish Genetics and Biotechnology, Central Institute of Freshwater Aquaculture, Bhubaneswar, Odisha, India. All the experimental procedures were performed with the approval of the Institute Bio-Safety Committee (IBSC) on Ethics. The procured fish were acclimatized in the circular tanks (1000 L) of the wet-laboratory for a period of one week. After acclimatization, the fish were randomly distributed in experimental tanks (500 L) with 10 fish per tank. The experiment was performed in triplicate and the respective diets were fed twice at 2–3% body weight. The water was partially changed and refilled with fresh water. During the feeding trial, the experimental fish were reared with optimum water quality parameters, with water temperature 27–31 °C, pH 7.3–7.8 and dissolved oxygen 5.0–6.0 mg/L, measured as per standard procedure (APHA 1985). After 45 days of the experiment, liver tissue samples were collected from three experimental fish per each treatment (total 12 fish from each treatment). The fish were anesthetized in a water tank containing 100 mg/L of MS-222 (tricainemethanesulfonate, Sigma, Milwaukee, WA, USA). The liver tissue samples were immediately collected and frozen in liquid nitrogen (LN2) and subsequently stored at −80 ˚C for further processing for RNA isolation.

4.2. RNA Isolation and cDNA Library Preparation, NGS Sequencing

Total RNA from liver tissues was isolated using an RNAiso kit (TakaRa, Clontech, Mountain View, CA, USA) according to the manufacturer’s instructions. The three fish livers from each treatment tank were pooled for total RNA extraction. The concentrations of total RNA were checked using a Qubit 2.0 Fluorometer (Life Technologies, Carlsbad, CA, USA). The quality of RNA was assessed using the Agilent2100 Bioanalyzer system (Agilent Technologies, Santa Cruz, CA, USA) and those samples with an RNA Integrity Number (RIN) > 7.0 were utilized for Illumina RNA library preparation. Nine cDNA Illumina libraries were generated from the total RNAs of liver samples. RNA was fragmented using nebulization techniques using the NEB Next First Strand Synthesis Reaction Buffer (5 ×), followed by first strand cDNA synthesis with the help of hexamer primers and M-MuLV Reverse Transcriptase, then subsequently synthesized into a second strand of cDNA. The Illumina adaptors were used for the preparation of the library and purified using Agencourt Ampure XP SPRI beads, then further enriched using PCR amplification for cluster generation. The cDNA libraries were generated using the NEBNext Ultra directional RNA Library Preparation kit (Illumina) as per the manufacturer’s protocol and the quality of the library was assessed using the Agilent 2100 Bioanalyzer system (Agilent Technologies, Santa Cruz, CA, USA). Then, all the treatment and control group libraries were pooled for sequencing. The adaptor-ligated libraries of rohu liver samples processed for sequencing using an Illumina Hiseq 500 platform and paired-end reads (150 bp) were generated. The generated raw reads of rohu liver samples were submitted through the NCBI SRA, and are accessible via the NCBI BioProject accession.

4.3. Quality Check, Assembly and Mapping

The generated raw reads were further checked for quality using FastQC software (http://www.bioinformatics.babraham.ac.uk/projects/fastqc). Initially, the raw reads were pre-processed to remove the adapter sequences and the low-quality bases (<q30). The Cutadapt2 algorithm was employed to remove reads with adapters using Python scripts. The quality check and filtered reads were further subjected to HISAT software for alignment, and the clean reads were aligned to the reference genome (PRJNA437789) with default parameter sets. Based on that, reads were classified into aligned reads (aligned to the reference genome) and unaligned reads. The cleaned aligned reads were mapped to multiple reference genes.

4.4. Gene Regulatory Network

Cytoscape (version 3.7.2) was used for the analysis of the gene regulatory network between the 20% (control), 40% and 60% (carbohydrate regime) groups. Carbohydrates related to up- and down-regulated genes were selected for network construction. Algorithms like ARACNE (algorithm for the reconstruction of accurate cellular networks) and the Network Analyzer plug-in were used for analyzing the gene regulatory network of all three sets of DEGs. On the basis of high degree and betweenness, hub genes were selected. The genes within a network with a higher connectivity played a central regulatory role, and were important in detecting highly connected genes in a network.

4.5. Differential Expression Analysis of Transcripts, Gene Ontology and KEGG Pathway

Here, the transcripts were annotated using a homology approach to assign functional annotation with BLAST2GO. Transcripts were assigned with a homolog protein from other organisms if the match was found with an E-value 1.0 × 10⁻⁵ and minimum similarity greater than 30%. HTSeq v0.6.1 was utilized to measure the number of clean reads mapped to each gene, and estimate or calculate their abundance. The transcripts were normalized using the standard method—the number of count genes divided by the number of FPKM (fragments per kilo base per million reads) of transcripts for each sample. The absolute counts for each transcript were identified and were used in differential expression calculations. In order to check the differential expressions of those transcripts in fish fed a high-carbohydrate diet (40% and 60% CHO) compared to control groups (20%), DESeq was used to calculate the differentially expressed transcripts, and transcripts were categorized into up-, down- and neutral-regulated based on the log2fold change cut-off of 1 value. The transcripts/genes recognized by DESeq with an adjusted P-value < 0.05 were categorized as differentially expressed genes (DEGs). The P-values of differentially expressed transcripts were adjusted using the Benjamini–Hochberg method to control the false discovery rate. Here, the difference in the expression levels of transcripts was estimated between the control group and fish fed a high-carbohydrate diet.
The functional annotations were performed by homology searching against the public databases, such as the non-redundant nucleotide (Nt) and non-redundant protein (Nr) database of NCBI (http://www.ncbi.nlm.nih.gov/), Swiss-Prot (http://www.ebi.ac.uk/uniprot/), clusters of orthologous groups (COG, http://www.ncbi.nlm.nih.gov/COG/), Gene Ontology (GO, http://www.geneontology.org/), and the Kyoto Encyclopedia of Genes and Genomes (KEGG, http://www.genome.jp/kegg/). The results obtained through BLAST2GO were further subjected to WEGO software for classification of Gene Ontology (GO) categories such as biological processes, molecular functions, and cellular components (http://wego.genomics.org.cn/cgi-bin/wego/index.pl). The GO and KEGG analyses were carried out to find the differential expressions of transcripts/genes involved in various enriched metabolic pathways. The GO enrichment analysis was performed using the R-package (Bioconductor) software EdgeR (Empirical Analysis of Digital Gene Expression in R, http://www.bioconductor.org/packages/2.12/bioc/html/edgeR.html). The categorized GO terms were ranked as per their corrected P-values < 0.05. The metabolism-associated KEGG pathway analysis was carried out using online KEGG Automatic Annotation Server (KAAS) software (http://www.genome.jp/tools/kaas/). The Bi-directional Best Hit (BBH) method was employed in KEGG pathway identification. Due to the absence of an annotated genome of rohu in the database, we used Zebrafish (Danio rerio) as a reference organism for pathway identification. The pathways per transcript were mapped to differentially expressed transcripts. The relevant metabolism associated pathways were significantly enriched based on the false discovery rate (FDR) ≤ 0.05 of regulated genes. The COG database (clusters of orthologous groups) was used to detect the putative function of transcripts based on known or conserved orthologous genes or their products.

4.6. Quantitative Real-Time PCR (qPCR)

In order to validate the generated liver transcriptome data, we selected six significant transcripts/genes associated with carbohydrate metabolism of rohu for performing quantitative real-time PCR (qPCR) analysis. The primers were designed using FastPCR (version 5.2.113) software for the selected transcripts and one housekeeping gene (β actin). The cDNA of the total RNA pool of the liver tissues of fish was generated using a BluePrintTMfirst Strand cDNA Synthesis kit (TakaRa, Clontech, Mountain View, CA, USA). The primer sequences were found in the total RNA from the liver tissues (in triplicate from each treatment) of the control fish and fish treated with high CHO levels, extracted using the RNAiso kit (TakaRa) according to the manufacturer’s instructions. The RNA samples were taken as three technical replicates for performing qPCR. The quantitative PCR was carried out using a Light Cycler-480 SYBR Green I kit (Roche Diagnostics, Mannhein, Germany) as per the manufacturer’s instructions. The PCR mixture consisted of 20 μL, which included a 2 μL DNA template, 0.4 μL each of forward primer and reverse primer, 10 μL SYBR®Premix and 0.4 μL ROX Reference Dye (50×), and the total volume was made up with RNase-free water. The qPCR analyses were performed with the following conditions: initial denaturation at 95 °C for 30 s, then followed by 35–40 cycles of denaturation at 95 °C for 10 s, annealing at 60 °C for 30 s, and extension at 72 °C for 30 s. The difference between the cycle threshold (ct) value of selected genes and that of the internal control housekeeping gene was calculated and then the relative gene expression was measured using the 2−ΔΔCt method. The box plot was used to analyze the variation distribution in the normalized count data. A Pearson’s correlation coefficient analysis was carried out to check the co-linearity of count data among control and treated fish. The significant difference between control and high-CHO-fed fish was analyzed using a Student’s paired t test and a one-way ANOVA test (significance value; P ≤ 0.05).

5. Conclusions

In order to understand the regulatory mechanisms of carbohydrate metabolism in the liver, Jayanti rohu fish fed a high-carbohydrate/glucose diet were analyzed using a series of key genes/transcripts associated with hepatic glucose transport and assimilation. The liver is a major organ in fish, and it indicates the nutritional and physiological status of fish. Hepatic genes were modulated due to the increased dietary carbohydrate levels in the livers of fish fed with a higher proportion of CHO in the diet. The present study suggested that the inclusion of high levels of CHO in the diet promotes glucose transport activities, glycolysis, glycogenesis, lipogenesis, and the pentose phosphate pathway. The transcripts associated with glycogen synthesis, such as hexokinase, glycogen synthase, PHK and PGK, were found to be up-regulated in the livers of fish fed with high levels of CHO as compared to the control, indicating the enrichment of the glycogenesis mechanism in the liver. In addition to this, the increased levels of expression of ACCα, PPARγ and FAS in the livers of fish fed with high levels of CHO indicated the activation of de novo fatty acid biosynthesis. Altogether, we have highlighted the enhanced glycolytic process as facilitated by the uptake of glucose and further activated or mediated by the insulin signaling pathway. We also identified enrichment of the insulin signaling pathways and the peroxisome proliferator-activated receptor (PPAR) pathway for de novo lipid biosynthesis. This study emphasized the fine balance of the ratio of dietary carbohydrates to protein in fish, and that the best available energy sources should be used. This work also encourages the investigation of the impact of temperature or oxygen levels on the metabolic pathways of rohu. Overall, this work suggests the incorporation of a higher level of digestible carbohydrate (gelatinized starch) in the diets of rohu, and encourages the undertaking of nutritional programming research in carp aquaculture.

Supplementary Materials

The following are available online at https://www.mdpi.com/1422-0067/21/21/8180/s1.

Author Contributions

D.K. and J.K.S. conceptualized the idea. K.D.R., S.D., M.V., L.S., S.N., K.D.M., A.R. (Avinash Rasal), M.R., U.K.U., P.K.M., and K.M. performed the experiment and collected the samples. K.D.R., M.A.I., S.J., U.B.A. analyzed the data. K.D.R. and M.A.I. drafted the manuscript. A.R. (Anil Rai) performed the statistical interpretation. D.K. performed the biological interpretation. All authors have read and agreed to the published version of the manuscript.

Funding

The financial assistance to carry out this work was provided in the form of CABin grant (F. no. Agril. Edn.4-1/2013-A&P), Indian Council of Agricultural Research, Ministry of Agriculture and Farmers’ Welfare, Govt. of India.

Acknowledgments

The authors are thankful to Indian Council of Agricultural Research, Ministry of Agriculture and Farmers’ Welfare, Govt. of India for providing financial assistance in the form of CABin grant (F. no. Agril. Edn.4-1/2013-A&P) as well as Advanced Super Computing Hub for Omics Knowledge in Agriculture (ASHOKA) facility at Indian Council of Agricultural Research-Indian Agricultural Statistics Research Institute, New Delhi, India, where all the analyses were done. The authors are thankful to the Director, Indian Council of Agricultural Research—Indian Agricultural Statistics Research Institute, New Delhi, India and Director, Indian Council of Agricultural Research—Central Institute of Freshwater Aquaculture, Bhubaneswar, Odisha, India, for providing the research facility.

Conflicts of Interest

The authors have declared that no competing interests exist.

Abbreviations

CHOCarbohydrate
KEGGKyoto Encyclopedia of Genes and Genomes
PHKPhosphorylase kinase
PGKPhosphoglycerate kinase
FASFatty acid synthase
ACCαAcetyle-CoA carboxylase
PPARγPeroxisome proliferator-activated receptor
mTORMammalian target of rapamycin
GKGlucokinase
6PGDH6-phosphogluconate dehydrogenase
PFK-16-phosphofructokinase
PKPyruvate Knaser
G6PDHGlucose-6-phospate dehydronated
FBPFructose-Bisphosphate

References

  1. Zhao, N.; Ma, Y.; Zhang, S.; Fang, X.; Liang, Z.; Liu, G. New muramyl dipeptide (MDP) mimics without the carbohydrate moiety as potential adjuvant candidates for a therapeutic hepatitis B vaccine (HBV). Bioorganic Med. Chem. Lett. 2011, 21, 4292–4295. [Google Scholar] [CrossRef] [PubMed]
  2. Gao, W.; Liu, Y.-J.; Tian, L.-X.; Mai, K.-S.; Liang, G.-Y.; Yang, H.-J.; Huai, M.-Y.; Luo, W.-J. Effect of dietary carbohydrate-to-lipid ratios on growth performance, body composition, nutrient utilization and hepatic enzymes activities of herbivorous grass carp (Ctenopharyngodon idella). Aquac. Nutr. 2010, 16, 327–333. [Google Scholar] [CrossRef]
  3. Liu, Y.; Chen, F.; Li, Q.; Odle, J.; Lin, X.; Zhu, H.; Pi, D.; Hou, Y.; Hong, Y.; Shi, H. Fish oil alleviates activation of the hypothalamic-pituitary-adrenal axis associated with inhibition of TLR4 and NOD signaling pathways in weaned piglets after a lipopolysaccharide challenge. J. Nutr. 2013, 143, 1799–1807. [Google Scholar] [CrossRef] [PubMed] [Green Version]
  4. Hung, C.C.; Guo, L.; Santschi, P.H.; Alvarado-Quiroz, N.; Haye, J.M. Distributions of carbohydrate species in the Gulf of Mexico. Mar. Chem. 2003, 81, 119–135. [Google Scholar] [CrossRef]
  5. Watanabe, I.; Kunito, T.; Tanabe, S.; Amano, M.; Koyama, Y.; Miyazaki, N.; Petrov, E.A.; Tatsukawa, R. Accumulation of heavy metals in Caspian seals (Phoca caspica). Arch. Environ. Contam. Toxicol. 2002, 43, 109–120. [Google Scholar] [CrossRef] [PubMed]
  6. Kamalam, B.S.; Medale, F.; Panserat, S. Stephane Panserat, Utilisation of dietary carbohydrates in farmed fishes: New insights on influencing factors, biological limitations and future strategies. Aquaculture 2017, 467, 3–27. [Google Scholar] [CrossRef]
  7. NRC. Nutrient Requirements of Fish and Shrimp; National Academies Press: Washington, DC, USA, 2011. [Google Scholar]
  8. Hemre, G.-I.; Mommsen, T.P.; Krogdahl, Å. Carbohydrates in fish nutrition: Effects on growth, glucose metabolism and hepatic enzymes. Aquac. Nutr. 2002, 8, 175–194. [Google Scholar] [CrossRef]
  9. Chiang, J. Liver Physiology: Metabolism and Detoxification. In Pathobiology of Human Disease; McManus, L.M., Mitchell, R.N., Eds.; Academic Press: San Diego, CA, USA, 2014; pp. 1770–1782. [Google Scholar]
  10. Enes, P.; Peres, H.; Couto, A.; Oliva-Teles, A. Growth performance and metabolic utilization of diets including starch, dextrin, maltose or glucose as carbohydrate source by gilthead sea bream (Sparus aurata) juveniles. Fish Physiol. Biochem. 2010, 36, 903–910. [Google Scholar] [CrossRef]
  11. Viollet, B.; Andreelli, F. AMP-Activated Protein Kinase and Metabolic Control. In Diabetes—Perspectives in Drug Therapy; Schwanstecher, M., Ed.; Springer: Berlin/Heidelberg, Germany, 2011; pp. 303–330. [Google Scholar]
  12. Enes, P.; Panserat, S.; Kaushik, S.; Oliva-Teles, A. Dietary Carbohydrate Utilization by European Sea Bass (Dicentrarchus labrax L.) and Gilthead Sea Bream (Sparus aurata L.) Juveniles. Rev. Fish. Sci. 2011, 19, 201–215. [Google Scholar] [CrossRef]
  13. Péres, A.; Cahu, C.L.; Zambonino Infante, J.L.; Le Gall, M.M.; Quazuguel, P. Amylase and trypsin responses to intake of dietary carbohydrate and protein depend on the developmental stage in sea bass (Dicentrarchus labrax) larvae. Fish Physiol. Biochem. 1996, 15, 237–242. [Google Scholar]
  14. Panserat, S.; Médale, F.; Blin, C.; Brèque, J.; Vachot, C.; Plagnes-Juan, E.; Gomes, E.; Krishnamoorthy, R.; Kaushik, S. Hepatic glucokinase is induced by dietary carbohydrates in rainbow trout, gilthead seabream, and common carp. Am. J. Physiol. Regul. Integr. Comp. Physiol. 2000, 278, R1164–R1170. [Google Scholar] [CrossRef] [PubMed] [Green Version]
  15. Planas, J.V.; Capilla, E.; Gutiérrez, J. Molecular identification of a glucose transporter from fish muscle 1. FEBS Lett. 2000, 481, 266–270. [Google Scholar] [CrossRef] [Green Version]
  16. Das, T.; Pal, A.K.; Chakraborty, S.K.; Manush, S.M.; Sahu, N.P.; Mukherjee, S.C. Thermal tolerance, growth and oxygen consumption of Labeo rohita fry (Hamilton, 1822) acclimated to four temperatures. J. Therm. Biol. 2005, 30, 378–383. [Google Scholar] [CrossRef]
  17. Ashaf-Ud-Doulah, M.; Mamun, A.A.; Rahman, M.L.; Islam, S.M.M.; Jannat, R.; Hossain, M.A.R.; Shahjahan, M. High temperature acclimation alters upper thermal limits and growth performance of Indian major carp, rohu, Labeo rohita (Hamilton, 1822). J. Therm. Biol. 2020, 93, 102738. [Google Scholar] [CrossRef]
  18. Qian, X.; Ba, Y.; Zhuang, Q.; Zhong, G. RNA-Seq technology and its application in fish transcriptomics. Omics A J. Integr. Biol. 2014, 18, 98–110. [Google Scholar] [CrossRef] [Green Version]
  19. Chakrapani, V.; Patra, S.K.; Mohapatra, S.D.; Rasal, K.D.; Deshpande, U.; Nayak, S.; Sundaray, J.K.; Jayasankar, P.; Barman, H.K. Comparative transcriptomic profiling of larvae and post-larvae of Macrobrachium rosenbergii in response to metamorphosis and salinity exposure. Genes Genom. 2016, 38, 1061–1076. [Google Scholar] [CrossRef]
  20. Rasal, K.D.; Sundaray, J.K. Status of genetic and genomic approaches for delineating biological information and improving aquaculture production of farmed rohu, Labeo rohita (Ham, 1822). Rev. Aquacult. 2020. [Google Scholar] [CrossRef]
  21. Renukaradhya, K.M.; Varghese, T.J. Protein requirement of the carps, Catla catla (Hamilton) and Labeo rohita (Hamilton). Proc. Anim. Sci. 1986, 95, 103–107. [Google Scholar] [CrossRef]
  22. Mohapatra, M.; Sahu, N.P.; Chaudhari, A. Utilization of gelatinized carbohydrate in diets of Labeo rohita fry. Aquac. Nutr. 2003, 9, 189–196. [Google Scholar] [CrossRef]
  23. Kumar, S.; Sahu, N.P.; Pal, A.K.; Choudhury, D.; Yengkokpam, S.; Mukherjee, S.C. Effect of dietary carbohydrate on haematology, respiratory burst activity and histological changes in L. rohita juveniles. Fish Shellfish Immunol. 2005, 19, 331–344. [Google Scholar] [CrossRef]
  24. Satpathy, B.B.; Ray, A.K. Effect of dietary protein and carbohydrate levels on growth, nutrient utilization and body composition in fingerling rohu, Labeo rohita (Hamilton). J. Appl. Ichthyol. 2009, 25, 728–733. [Google Scholar] [CrossRef]
  25. Kanehisa, M.; Goto, S. KEGG: Kyoto encyclopedia of genes and genomes. Nucleic Acids Res. 2000, 28, 27–30. [Google Scholar] [CrossRef] [PubMed]
  26. Clar, J.; Gri, B.; Calderaro, J.; Birling, M.-C.; Hérault, Y.; Smit, G.P.A.; Mithieux, G.; Rajas, F. Targeted deletion of kidney glucose-6 phosphatase leads to nephropathy. Kidney Int. 2014, 86, 747–756. [Google Scholar] [CrossRef] [PubMed] [Green Version]
  27. Huang, I.H.; Hsiao, C.-T.; Wu, J.-C.; Shen, R.-F.; Liu, C.-Y.; Wang, Y.-K.; Chen, Y.-C.; Huang, C.-M.; del Álamo, J.C.; Chang, Z.-F.; et al. GEF-H1 controls focal adhesion signaling that regulates mesenchymal stem cell lineage commitment. J. Cell Sci. 2014, 127, 4186–4200. [Google Scholar] [CrossRef] [PubMed] [Green Version]
  28. Grumati, P.; Morozzi, G.; Hölper, S.; Mari, M.; Harwardt, M.-L.I.E.; Yan, R.; Müller, S.; Reggiori, F.; Heilemann, M.; Dikic, I. Full length RTN3 regulates turnover of tubular endoplasmic reticulum via selective autophagy. eLife 2017, 6, e25555. [Google Scholar] [CrossRef] [PubMed]
  29. Qu, J.; Ko, C.-W.; Tso, P.; Bhargava, A. Apolipoprotein A-IV: A Multifunctional Protein Involved in Protection against Atherosclerosis and Diabetes. Cells 2019, 8, 319. [Google Scholar] [CrossRef] [Green Version]
  30. Gangadhariah, M.H.; Dieckmann, B.W.; Lantier, L.; Kang, L.; Wasserman, D.H.; Chiusa, M.; Caskey, C.F.; Dickerson, J.; Luo, P.; Gamboa, J.L.; et al. Cytochrome P450 epoxygenase-derived epoxyeicosatrienoic acids contribute to insulin sensitivity in mice and in humans. Diabetologia 2017, 60, 1066–1075. [Google Scholar] [CrossRef] [Green Version]
  31. Pocai, A.; Obici, S.; Schwartz, G.J.; Rossetti, L. A brain-liver circuit regulates glucose homeostasis. Cell Metab. 2005, 1, 53–61. [Google Scholar] [CrossRef] [Green Version]
  32. Spiro, R.G. Protein glycosylation: Nature, distribution, enzymatic formation, and disease implications of glycopeptide bonds. Glycobiology 2002, 12, 43R–56R. [Google Scholar] [CrossRef]
  33. Oh, S.W.; Pope, R.K.; Smith, K.P.; Crowley, J.L.; Nebl, T.; Lawrence, J.B.; Luna, E.J. Archvillin, a muscle-specific isoform of supervillin, is an early expressed component of the costameric membrane skeleton. J. Cell Sci. 2003, 116, 2261–2275. [Google Scholar] [CrossRef] [Green Version]
  34. Groenestege, W.M.T.; Hoenderop, J.G.; van den Heuvel, L.; Knoers, N.; Bindels, R.J. The Epithelial Mg2+ Channel Transient Receptor Potential Melastatin 6 Is Regulated by Dietary Mg2+ Content and Estrogens. J. Am. Soc. Nephrol. 2006, 17, 1035–1043. [Google Scholar] [CrossRef] [PubMed] [Green Version]
  35. Nunnally, M.H.; Stull, J.T. Mammalian skeletal muscle myosin light chain kinases. A comparison by antiserum cross-reactivity. J. Biol. Chem. 1984, 259, 1776–1780. [Google Scholar] [PubMed]
  36. Qiu, X.; Guo, H.; Yang, J.; Ji, Y.; Wu, C.-S.; Chen, X. Down-regulation of guanylate binding protein 1 causes mitochondrial dysfunction and cellular senescence in macrophages. Sci. Rep. 2018, 8, 1679. [Google Scholar] [CrossRef] [PubMed]
  37. Stewart, R.M.; Hemli, S.; Kolodny, E.H.; Miller, A.L.; Pallotta, J.A. Carbohydrate metabolism in phenylketonuria. Pediatric Res. 1980, 14, 849–853. [Google Scholar] [CrossRef]
  38. McMillan, D.E. Elevation of complement components in diabetes mellitus. Diabete Metab. 1980, 6, 265–270. [Google Scholar]
  39. Zhang, D.D.; Zhang, J.G.; Wang, Y.Z.; Liu, Y.; Liu, G.L.; Li, X.Y. Per-Arnt-Sim Kinase (PASK): An Emerging Regulator of Mammalian Glucose and Lipid Metabolism. Nutrients 2015, 7, 7437–7450. [Google Scholar] [CrossRef] [Green Version]
  40. Van Geet, C.; Jaeken, J. A unique pattern of coagulation abnormalities in carbohydrate-deficient glycoprotein syndrome. Pediatric Res. 1993, 33, 540–541. [Google Scholar] [CrossRef] [Green Version]
  41. Coan, P.M.; Barrier, M.; Alfazema, N.; Carter, R.N.; Marion de Proce, S.; Dopico, X.C.; Garcia Diaz, A.; Thomson, A.; Jackson-Jones, L.H.; Moyon, B.; et al. Complement Factor B Is a Determinant of Both Metabolic and Cardiovascular Features of Metabolic Syndrome. Hypertension 2017, 70, 624–633. [Google Scholar] [CrossRef]
  42. Tocher, D.R.; Bendiksen, E.Å.; Campbell, P.J.; Bell, J.G. The role of phospholipids in nutrition and metabolism of teleost fish. Aquaculture 2008, 280, 21–34. [Google Scholar] [CrossRef] [Green Version]
  43. Causey, D.R.; Pohl, M.A.N.; Stead, D.A.; Martin, S.A.M.; Secombes, C.J.; Macqueen, D.J. High-throughput proteomic profiling of the fish liver following bacterial infection. BMC Genom. 2018, 19, 719. [Google Scholar] [CrossRef] [Green Version]
  44. Elshorbagy, A.K.; Nijpels, G.; Valdivia-Garcia, M.; Stehouwer, C.D.A.; Ocke, M.; Refsum, H.; Dekker, J.M. S-Adenosylmethionine Is Associated with Fat Mass and Truncal Adiposity in Older Adults. J. Nutr. 2013, 143, 1982–1988. [Google Scholar] [CrossRef]
  45. Kong, P.; Gonzalez-Quesada, C.; Li, N.; Cavalera, M.; Lee, D.-W.; Frangogiannis, N.G. Thrombospondin-1 regulates adiposity and metabolic dysfunction in diet-induced obesity enhancing adipose inflammation and stimulating adipocyte proliferation. Am. J. Physiol. Endocrinol. Metab. 2013, 305, E439–E450. [Google Scholar] [CrossRef] [PubMed] [Green Version]
  46. Bi, P.; Kuang, S. Notch signaling as a novel regulator of metabolism. Trends Endocrinol. Metab. 2015, 26, 248–255. [Google Scholar] [CrossRef] [PubMed] [Green Version]
  47. Kihara, A.; Sakuraba, H.; Ikeda, M.; Denpoh, A.; Igarashi, Y. Membrane topology and essential amino acid residues of Phs1, a 3-hydroxyacyl-CoA dehydratase involved in very long-chain fatty acid elongation. J. Biol. Chem. 2008, 283, 11199–11209. [Google Scholar] [CrossRef] [Green Version]
  48. Danzmann, R.G.; Kocmarek, A.L.; Norman, J.D.; Rexroad, C.E.; Palti, Y. Transcriptome profiling in fast versus slow-growing rainbow trout across seasonal gradients. BMC Genom. 2016, 17, 60. [Google Scholar] [CrossRef] [PubMed] [Green Version]
  49. Almenar-Queralt, A.; Gregorio, C.C.; Fowler, V.M. Tropomodulin assembles early in myofibrillogenesis in chick skeletal muscle: Evidence that thin filaments rearrange to form striated myofibrils. J. Cell Sci. 1999, 112, 1111–1123. [Google Scholar]
  50. Naylor, R.L.; Hardy, R.W.; Bureau, D.P.; Chiu, A.; Elliott, M.; Farrell, A.P.; Forster, I.; Gatlin, D.M.; Goldburg, R.J.; Hua, K.; et al. Feeding aquaculture in an era of finite resources. Proc. Natl. Acad. Sci. USA 2009, 106, 15103–15110. [Google Scholar] [CrossRef] [Green Version]
  51. Skiba-Cassy, S.; Panserat, S.; Larquier, M.; Dias, K.; Surget, A.; Plagnes-Juan, E.; Kaushik, S.; Seiliez, I. Apparent low ability of liver and muscle to adapt to variation of dietary carbohydrate:protein ratio in rainbow trout (Oncorhynchus mykiss). Br. J. Nutr. 2012, 109, 1359–1372. [Google Scholar] [CrossRef] [Green Version]
  52. Panserat, S.; Skiba-Cassy, S.; Seiliez, I.; Lansard, M.; Plagnes-Juan, E.; Vachot, C.; Aguirre, P.; Larroquet, L.; Chavernac, G.; Medale, F.; et al. Metformin improves postprandial glucose homeostasis in rainbow trout fed dietary carbohydrates: A link with the induction of hepatic lipogenic capacities? Am. J. Physiol. Regul. Integr. Comp. Physiol. 2009, 297, R707–R715. [Google Scholar] [CrossRef] [Green Version]
  53. Polakof, S.; Skiba-Cassy, S.; Kaushik, S.; Seiliez, I.; Soengas, J.L.; Panserat, S. Glucose and lipid metabolism in the pancreas of rainbow trout is regulated at the molecular level by nutritional status and carbohydrate intake. J. Comp. Physiol. B Biochem. Syst. Environ. Physiol. 2012, 182, 507–516. [Google Scholar] [CrossRef]
  54. Marandel, L.; Seiliez, I.; Véron, V.; Skiba-Cassy, S.; Panserat, S. New insights into the nutritional regulation of gluconeogenesis in carnivorous rainbow trout (Oncorhynchus mykiss): A gene duplication trail. Physiol. Genom. 2015, 47, 253–263. [Google Scholar] [CrossRef] [PubMed] [Green Version]
  55. Rui, L. Energy metabolism in the liver. Compr. Physiol. 2014, 4, 177–197. [Google Scholar] [PubMed] [Green Version]
  56. Jordan, S.D.; Könner, A.C.; Brüning, J.C. Sensing the fuels: Glucose and lipid signaling in the CNS controlling energy homeostasis. Cell. Mol. Life Sci. 2010, 67, 3255–3273. [Google Scholar] [CrossRef] [Green Version]
  57. Diaz, L.E.; Chuan, Y.C.; Lewitt, M.; Fernandez-Perez, L.; Carrasco-Rodriguez, S.; Sanchez-Gomez, M.; Flores-Morales, A. IGF-II regulates metastatic properties of choriocarcinoma cells through the activation of the insulin receptor. Mol. Hum. Reprod. 2007, 13, 567–576. [Google Scholar] [CrossRef] [PubMed] [Green Version]
  58. Diaz, M.; Vraskou, Y.; Gutierrez, J.; Planas, J.V. Expression of rainbow trout glucose transporters GLUT1 and GLUT4 during in vitro muscle cell differentiation and regulation by insulin and IGF-I. Am. J. Physiol. Regul. Integr. Comp. Physiol. 2009, 296, R794–R800. [Google Scholar] [CrossRef] [PubMed] [Green Version]
  59. Deng, H.-Z.; Deng, H.; Cen, C.-Q.; Chen, K.-Y.; Du, M.-L. Post-receptor crosstalk between growth hormone and insulin signal in rats born small for gestational age with catch-up growth. PLoS ONE 2014, 9, e100459. [Google Scholar] [CrossRef] [Green Version]
  60. Balmaceda-Aguilera, C.; Cortes-Campos, C.; Cifuentes, M.; Peruzzo, B.; Mack, L.; Tapia, J.C.; Oyarce, K.; Garcia, M.A.; Nualart, F. Glucose transporter 1 and monocarboxylate transporters 1, 2, and 4 localization within the glial cells of shark blood-brain-barriers. PLoS ONE 2012, 7, e32409. [Google Scholar] [CrossRef] [Green Version]
  61. Pyla, R.; Poulose, N.; Jun, J.Y.; Segar, L. Expression of conventional and novel glucose transporters, GLUT1, -9, -10, and -12, in vascular smooth muscle cells. Am. J. Physiol. Cell Physiol. 2013, 304, C574–C589. [Google Scholar] [CrossRef] [Green Version]
  62. Zhang, K.; Xie, J.; Yu, D.-G.; Wang, G.-J.; Yu, E.-M.; Gong, W.-B.; Li, Z.-F.; Wang, C.-C.; Xia, Y. A comparative study on the budget of nitrogen and phosphorus in polyculture systems of snakehead with bighead carp. Aquaculture 2018, 483, 69–75. [Google Scholar] [CrossRef]
  63. Chen, B.; Zheng, T.; Qin, L.; Hu, X.; Zhang, X.; Liu, Y.; Liu, H.; Qin, S.; Li, G.; Li, Q. Strong association between plasma dipeptidyl peptidase-4 activity and impaired cognitive function in elderly population with normal glucose tolerance. Front. Aging Neurosci. 2017, 9, 247. [Google Scholar] [CrossRef] [Green Version]
  64. Panserat, S.; Capilla, E.; Gutierrez, J.; Frappart, P.O.; Vachot, C.; Plagnes-Juan, E.; Aguirre, P.; Breque, J.; Kaushik, S. Glucokinase is highly induced and glucose-6-phosphatase poorly repressed in liver of rainbow trout (Oncorhynchus mykiss) by a single meal with glucose. Comp. Biochem. Physiol. Part B Biochem. Mol. Biol. 2001, 128, 275–283. [Google Scholar] [CrossRef]
  65. Hall, J.R.; Richards, R.C.; MacCormack, T.J.; Ewart, K.V.; Driedzic, W.R. Cloning of GLUT3 cDNA from Atlantic cod (Gadus morhua) and expression of GLUT1 and GLUT3 in response to hypoxia. Biochim. Biophys. Acta 2005, 1730, 245–252. [Google Scholar] [CrossRef]
  66. Seiliez, I.; Gabillard, J.-C.; Riflade, M.; Sadoul, B.; Dias, K.; Avérous, J.; Tesseraud, S.; Skiba, S.; Panserat, S. Amino acids downregulate the expression of several autophagy-related genes in rainbow trout myoblasts. Autophagy 2012, 8, 364–375. [Google Scholar] [CrossRef] [PubMed]
  67. Jin, J.; Médale, F.; Kamalam, B.S.; Aguirre, P.; Véron, V.; Panserat, S. Comparison of glucose and lipid metabolic gene expressions between fat and lean lines of rainbow trout after a glucose load. PLoS ONE 2014, 9, e105548. [Google Scholar] [CrossRef] [PubMed] [Green Version]
  68. Deng, K.; Pan, M.; Liu, J.; Yang, M.; Gu, Z.; Zhang, Y.; Liu, G.; Liu, D.; Zhang, W.; Mai, K. Chronic stress of high dietary carbohydrate level causes inflammation and influences glucose transport through SOCS3 in Japanese flounder Paralichthys olivaceus. Sci. Rep. 2018, 8, 7415. [Google Scholar] [CrossRef] [PubMed]
  69. Song, X.; Marandel, L.; Skiba-Cassy, S.; Corraze, G.; Dupont-Nivet, M.; Quillet, E.; Geurden, I.; Panserat, S. Regulation by dietary carbohydrates of intermediary metabolism in liver and muscle of two isogenic lines of rainbow trout. Front. Physiol. 2018, 9, 1579. [Google Scholar] [CrossRef]
  70. Lu, S.; Wu, X.; Gao, Y.; Gatlin, D.M.; Wu, M.; Yao, W.; Jin, Z.; Li, X.; Dong, Y. Effects of dietary carbohydrate sources on growth, digestive enzyme activity, gene expression of hepatic GLUTs and key enzymes involved in glycolysis-gluconeogenesis of giant grouper Epinephelus lanceolatus larvae. Aquaculture 2018, 484, 343–350. [Google Scholar] [CrossRef]
  71. Meton, I.; Caseras, A.; Fernandez, F.; Baanante, I.V. Molecular cloning of hepatic glucose-6-phosphatase catalytic subunit from gilthead sea bream (Sparus aurata): Response of its mRNA levels and glucokinase expression to refeeding and diet composition. Comp. Biochem. Physiol. Part B Biochem. Mol. Biol. 2004, 138, 145–153. [Google Scholar] [CrossRef]
  72. Iynedjian, P.B. Molecular physiology of mammalian glucokinase. Cell. Mol. Life Sci. CMLS 2009, 66, 27–42. [Google Scholar] [CrossRef] [Green Version]
  73. Wegener, G.; Krause, U. Different modes of activating phosphofructokinase, a key regulatory enzyme of glycolysis, in working vertebrate muscle. Biochem. Soc. Trans. 2002, 30, 264–270. [Google Scholar] [CrossRef]
  74. Yuan, X.; Wood, E.F. Multimodel seasonal forecasting of global drought onset. Geophys. Res. Lett. 2013, 40, 4900–4905. [Google Scholar] [CrossRef]
  75. Wang, B.-K.; Liu, W.-B.; Xu, C.; Cao, X.-F.; Zhong, X.-Q.; Shi, H.-J.; Li, X.-F. Dietary carbohydrate levels and lipid sources modulate the growth performance, fatty acid profiles and intermediary metabolism of blunt snout bream Megalobrama amblycephala in an interactive pattern. Aquaculture 2017, 481, 140–153. [Google Scholar] [CrossRef]
  76. Li, X.-F.; Xu, C.; Zhang, D.-D.; Jiang, G.-Z.; Liu, W.-B. Molecular characterization and expression analysis of glucokinase from herbivorous fish Megalobrama amblycephala subjected to a glucose load after the adaption to dietary carbohydrate levels. Aquaculture 2016, 459, 89–98. [Google Scholar] [CrossRef]
  77. Enes, P.; Panserat, S.; Kaushik, S.; Oliva-Teles, A. Growth performance and metabolic utilization of diets with native and waxy maize starch by gilthead sea bream (Sparus aurata) juveniles. Aquaculture 2008, 274, 101–108. [Google Scholar] [CrossRef]
  78. Seiliez, I.; Panserat, S.; Skiba-Cassy, S.; Polakof, S. Effect of acute and chronic insulin administrations on major factors involved in the control of muscle protein turnover in rainbow trout (Oncorhynchus mykiss). Gen. Comp. Endocrinol. 2011, 172, 363–370. [Google Scholar] [CrossRef]
  79. Lehninger, A.L. Proton and electric charge translocation in mitochondrial energy transduction. Adv. Exp. Med. Biol. 1982, 148, 171–186. [Google Scholar] [PubMed]
  80. Borrebaek, B.; Christophersen, B. Activities of glucose phosphorylation, glucose-6-phosphatase and lipogenic enzymes in the liver of perch, Perca fluviatilis, after different dietary treatment. Aquac. Res. 2001, 32, 221–224. [Google Scholar] [CrossRef]
  81. Metón, I.; Caseras, A.; Mediavilla, D.; Fernández, F.; Baanante, I.V. Molecular cloning of a cDNA encoding 6-phosphofructo-2-kinase/fructose-2,6-bisphosphatase from liver of Sparus aurata: Nutritional regulation of enzyme expression. Biochim. Et Biophys. Acta (BBA) Gene Struct. Expr. 1999, 1444, 153–165. [Google Scholar]
  82. Enes, P.; Panserat, S.; Kaushik, S.; Oliva-Teles, A. Effect of normal and waxy maize starch on growth, food utilization and hepatic glucose metabolism in European sea bass (Dicentrarchus labrax) juveniles. Comp. Biochem. Physiol. Part A Mol. Integr. Physiol. 2006, 143, 89–96. [Google Scholar] [CrossRef]
  83. Tanan, C.L.; Ventura, D.F.; de Souza, J.M.; Grotzner, S.R.; Mela, M.; Gouveia, A., Jr.; Oliveira-Ribeiro, C.A. Effects of mercury intoxication on the response of horizontal cells of the retina of thraira fish (Hoplias malabaricus). Braz. J. Med Biol. Res. Rev. Bras. Pesqui. Med. E Biol. 2006, 39, 987–995. [Google Scholar] [CrossRef]
  84. Caseras, A.; Meton, I.; Vives, C.; Egea, M.; Fernandez, F.; Baanante, I.V. Nutritional regulation of glucose-6-phosphatase gene expression in liver of the gilthead sea bream (Sparus aurata). Br. J. Nutr. 2002, 88, 607–614. [Google Scholar] [CrossRef] [Green Version]
  85. Agius, L. Glucokinase and molecular aspects of liver glycogen metabolism. Biochem. J. 2008, 414, 1–18. [Google Scholar] [CrossRef] [Green Version]
  86. Foufelle, F.; Girard, J.; Ferré, P. Regulation of lipogenic enzyme expression by glucose in liver and adipose tissue: A review of the potential cellular and molecular mechanisms. Adv. Enzym. Regul. 1996, 36, 199–226. [Google Scholar] [CrossRef]
  87. Moreira, I.S.; Peres, H.; Couto, A.; Enes, P.; Oliva-Teles, A. Temperature and dietary carbohydrate level effects on performance and metabolic utilisation of diets in European sea bass (Dicentrarchus labrax) juveniles. Aquaculture 2008, 274, 153–160. [Google Scholar] [CrossRef]
  88. Ren, M.; Habte-Tsion, H.-M.; Xie, J.; Liu, B.; Zhou, Q.; Ge, X.; Pan, L.; Chen, R. Effects of dietary carbohydrate source on growth performance, diet digestibility and liver glucose enzyme activity in blunt snout bream, Megalobrama amblycephala. Aquaculture 2015, 438, 75–81. [Google Scholar] [CrossRef]
  89. Nordlie, R.C.; Foster, J.D.; Lange, A.J. Regulation of glucose production by the liver. Annu. Rev. Nutr. 1999, 19, 379–406. [Google Scholar] [CrossRef]
  90. van de Werve, G.; Lange, A.; Newgard, C.; Méchin, M.-C.; Li, Y.; Berteloot, A. New lessons in the regulation of glucose metabolism taught by the glucose 6-phosphatase system. Eur. J. Biochem. 2000, 267, 1533–1549. [Google Scholar] [CrossRef]
  91. Argaud, D.; Zhang, Q.; Pan, W.; Maitra, S.; Pilkis, S.J.; Lange, A.J. Regulation of rat liver glucose-6-phosphatase gene expression in different nutritional and hormonal states: Gene structure and 5’-flanking sequence. Diabetes 1996, 45, 1563–1571. [Google Scholar] [CrossRef]
  92. Fang, X.; Zhang, B.; Thisse, B.; Bloom, G.S.; Thisse, C. IQGAP3 is essential for cell proliferation and motility during zebrafish embryonic development. Cytoskeleton 2015, 72, 422–433. [Google Scholar] [CrossRef] [Green Version]
  93. Zhou, C.P.; Ge, X.P.; Liu, B.; Xie, J.; Miao, L.H. Effect of High Dietary Carbohydrate on the Growth Performance and Physiological Responses of Juvenile Wuchang Bream, Megalobrama amblycephala. Asian-Australas. J. Anim. Sci. 2013, 26, 1598–1608. [Google Scholar] [CrossRef] [Green Version]
  94. Tian, Y.; Kidokoro, H.; Watanabe, T.; Igeta, Y.; Sakaji, H.; Ino, S. Response of yellowtail, Seriola quinqueradiata, a key large predatory fish in the Japan Sea, to sea water temperature over the last century and potential effects of global warming. J. Mar. Syst. 2012, 91, 1–10. [Google Scholar] [CrossRef]
  95. Zamora-Sillero, J.; Ramos, L.R.V.; Romano, L.A.; Monserrat, J.M.; Tesser, M.B. Effect of dietary dextrin levels on the growth performance, blood chemistry, body composition, hepatic triglicerides and glycogen of Lebranche mullet juveniles (Mugil liza Valenciennes 1836, Mugilidae). J. Appl. Ichthyol. 2013, 29, 1342–1347. [Google Scholar] [CrossRef]
  96. Azaza, M.S.; Assad, A.; Maghrbi, W.; El-Cafsi, M. The effects of rearing density on growth, size heterogeneity and inter-individual variation of feed intake in monosex male Nile tilapia Oreochromis niloticus L. Anim. Int. J. Anim. Biosci. 2013, 7, 1865–1874. [Google Scholar] [CrossRef] [Green Version]
  97. Moro, G.V.; Silva, T.S.C.; Cyrino, J.E.P. Feed processing affected the digestibility of carbohydrate sources for dourado Salminus brasiliensis. Aquac. Nutr. 2017, 23, 40–45. [Google Scholar] [CrossRef]
  98. He, R.; Zhang, D.; Lu, W.; Zheng, T.; Wan, L.; Liu, F.; Jia, W. SLC47A1 gene rs2289669 G>A variants enhance the glucose-lowering effect of metformin via delaying its excretion in Chinese type 2 diabetes patients. Diabetes Res. Clin. Pract. 2015, 109, 57–63. [Google Scholar] [CrossRef]
  99. Zhou, K.; Yee, S.W.; Seiser, E.L.; van Leeuwen, N.; Tavendale, R.; Bennett, A.J.; Groves, C.J.; Coleman, R.L.; van der Heijden, A.A.; Beulens, J.W.; et al. Variation in the glucose transporter gene SLC2A2 is associated with glycemic response to metformin. Nat. Genet. 2016, 48, 1055. [Google Scholar] [CrossRef] [PubMed] [Green Version]
  100. Borges, P.; Valente, L.M.; Veron, V.; Dias, K.; Panserat, S.; Medale, F. High dietary lipid level is associated with persistent hyperglycaemia and downregulation of muscle Akt-mTOR pathway in Senegalese sole (Solea senegalensis). PLoS ONE 2014, 9, e102196. [Google Scholar] [CrossRef] [PubMed] [Green Version]
  101. Xiong, X.; Hu, Y.; Yan, N.; Huang, Y.; Peng, N.; Liang, Y.; Zhao, S. PCR-DGGE analysis of the microbial communities in three different Chinese “Baiyunbian” liquor fermentation starters. J. Microbiol. Biotechnol. 2014, 24, 1088–1095. [Google Scholar] [CrossRef] [Green Version]
  102. Chen, Y.-J.; Zhang, T.-Y.; Chen, H.-Y.; Lin, S.-M.; Luo, L.; Wang, D.-S. An evaluation of hepatic glucose metabolism at the transcription level for the omnivorous GIFT tilapia, Oreochromis niloticus during postprandial nutritional status transition from anabolism to catabolism. Aquaculture 2017, 473, 375–382. [Google Scholar] [CrossRef]
  103. Xie, D.; Yang, L.; Yu, R.; Chen, F.; Lu, R.; Qin, C.; Nie, G. Effects of dietary carbohydrate and lipid levels on growth and hepatic lipid deposition of juvenile tilapia, Oreochromis niloticus. Aquaculture 2017, 479, 696–703. [Google Scholar] [CrossRef]
  104. Yan, Y.; Wang, H.; Hamera, S.; Chen, X.; Fang, R. miR444a has multiple functions in the rice nitrate-signaling pathway. Plant J. 2014, 78, 44–55. [Google Scholar] [CrossRef] [PubMed]
  105. Alvarez, M.J.; Diez, A.; Lopez-Bote, C.; Gallego, M.; Bautista, J.M. Short-term modulation of lipogenesis by macronutrients in rainbow trout (Oncorhynchus mykiss) hepatocytes. Br. J. Nutr. 2000, 84, 619–628. [Google Scholar] [CrossRef] [PubMed] [Green Version]
  106. Rollin, X.; Mambrini, M.; Abboudi, T.; Larondelle, Y.; Kaushik, S.J. The optimum dietary indispensable amino acid pattern for growing Atlantic salmon (Salmo salar L.) fry. Br. J. Nutr. 2003, 90, 865–876. [Google Scholar] [CrossRef] [PubMed] [Green Version]
  107. Martin, S.A.M.; Krol, E. Nutrigenomics and immune function in fish: New insights from omics technologies. Dev. Comp. Immunol. 2017, 75, 86–98. [Google Scholar] [CrossRef] [Green Version]
  108. Liu, C.-H.; Chiu, C.-H.; Wang, S.-W.; Cheng, W. Dietary administration of the probiotic, Bacillus subtilis E20, enhances the growth, innate immune responses, and disease resistance of the grouper, Epinephelus coioides. Fish Shellfish Immunol. 2012, 33, 699–706. [Google Scholar] [CrossRef] [PubMed]
  109. Basu, N.; Todgham, A.E.; Ackerman, P.A.; Bibeau, M.R.; Nakano, K.; Schulte, P.M.; Iwama, G.K. Heat shock protein genes and their functional significance in fish. Gene 2002, 295, 173–183. [Google Scholar] [CrossRef]
  110. Zhou, C.; Liu, B.; Ge, X.; Xie, J.; Xu, P. Effect of dietary carbohydrate on the growth performance, immune response, hepatic antioxidant abilities and heat shock protein 70 expression of Wuchang bream, Megalobrama amblycephala. J. Appl. Ichthyol. 2013, 29, 1348–1356. [Google Scholar] [CrossRef]
  111. Yang, Y.; Han, T.; Xiao, J.; Li, X.; Wang, J. Transcriptome analysis reveals carbohydrate-mediated liver immune responses in Epinephelus akaara. Sci. Rep. 2018, 8, 639. [Google Scholar] [CrossRef] [Green Version]
  112. Figueiredo, M.A.; Mareco, E.A.; Silva, M.D.P.; Marins, L.F. Muscle-specific growth hormone receptor (GHR) overexpression induces hyperplasia but not hypertrophy in transgenic zebrafish. Transgenic Res. 2012, 21, 457–469. [Google Scholar] [CrossRef]
  113. Prisingkorn, W.; Prathomya, P.; Jakovlic, I.; Liu, H.; Zhao, Y.H.; Wang, W.M. Transcriptomics, metabolomics and histology indicate that high-carbohydrate diet negatively affects the liver health of blunt snout bream (Megalobrama amblycephala). BMC Genom. 2017, 18, 856. [Google Scholar] [CrossRef] [Green Version]
  114. Zhang, A.-H.; Sun, H.; Yan, G.-L.; Han, Y.; Zhao, Q.-Q.; Wang, X.-J. Chinmedomics: A Powerful Approach Integrating Metabolomics with Serum Pharmacochemistry to Evaluate the Efficacy of Traditional Chinese Medicine. Engineering 2019, 5, 60–68. [Google Scholar] [CrossRef]
  115. Zhuo, C.-X.; Zheng, C.; You, S.-L. Transition-Metal-Catalyzed Asymmetric Allylic Dearomatization Reactions. Acc. Chem. Res. 2014, 47, 2558–2573. [Google Scholar] [CrossRef] [PubMed]
  116. Polak, P.; Hall, M.N. mTOR and the control of whole body metabolism. Curr. Opin. Cell Biol. 2009, 21, 209–218. [Google Scholar] [CrossRef] [PubMed]
  117. Dai, W.; Panserat, S.; Mennigen, J.; Terrier, F.; Dias, K.; Seiliez, I.; Skiba-Cassy, S. Postprandial regulation of hepatic glucokinase and lipogenesis requires the activation of TORC1 signaling in rainbow trout (Oncorhynchus mykiss). J. Exp. Biol. 2013. [Google Scholar] [CrossRef] [Green Version]
  118. Wan, Y.; Kertesz, M.; Spitale, R.C.; Segal, E.; Chang, H.Y. Understanding the transcriptome through RNA structure. Nat. Rev. Genet. 2011, 12, 641–655. [Google Scholar] [CrossRef] [PubMed] [Green Version]
  119. Yecies, J.L.; Zhang, H.H.; Menon, S.; Liu, S.; Yecies, D.; Lipovsky, A.I.; Gorgun, C.; Kwiatkowski, D.J.; Hotamisligil, G.S.; Lee, C.H.; et al. Akt stimulates hepatic SREBP1c and lipogenesis through parallel mTORC1-dependent and independent pathways. Cell Metab. 2011, 14, 21–32. [Google Scholar] [CrossRef] [PubMed] [Green Version]
Figure 1. Venn diagram of differentially expressed genes. The sum of numbers in each big circle is the total number of differentially expressed genes in each comparison group, and the overlapping part is the number of common differentially expressed genes among the comparison groups.
Ijms 21 08180 g001
Figure 2. Volcano plot for differential gene expression. Fish feed with (A) 40% CHO vs. 20% CHO and (B) 60% CHO vs. 20% CHO. Scattered points represent genes: the x-axis is the fold change for the ratio of treated vs. control, whereas the y-axis is the statistic or -Log 10 (P-value), which shows the probability that a gene has statistical significance in its differential expression. The green dots are thus genes significantly up-regulated after treatment, red dots are genes significantly down-regulated after treatment and black dots are genes significantly neutrally regulated after treatment.
Ijms 21 08180 g002
Figure 3. Gene ontology distribution (CHO-related) for the molecular function, biological process and cellular component, of (A) Control versus fishes fed with 40% CHO, and (B) control versus fishes fed with 60% CHO. The y-axis indicates the number of genes annotated to one GO term. The up-regulated genes under Molecular Function are shown as blue and light blue represents down-regulated genes, biological process up-regulated genes are shown as red and down-regulated genes are shown as light red, and cellular component genes are shown in green for up-regulation and light green for down-regulation.
Ijms 21 08180 g003aIjms 21 08180 g003b
Figure 4. Circos plot showing overlap between gene lists (A) only at the gene level, where purple curves link identical genes; (B) including the shared term level, where blue curves link genes that belong to the same enriched ontology term. The inner circle represents gene lists, where hits are arranged along the arc. Genes that hit multiple lists are colored in dark orange, and genes unique to a list are shown in light orange.
Ijms 21 08180 g004
Figure 5. Kyoto Encyclopedia of Genes and Genomes (KEGG) pathway enrichment analysis for selected genes between control (20%) versus fish fed with 40% CHO (blue), and control (20%) versus fish fed with 60% CHO (red), represented on a graph, with pathways on the x-axis and number of genes on the y-axis.
Ijms 21 08180 g005
Figure 6. Up-regulation and down-regulation of key metabolic genes in hepatocytes.
Ijms 21 08180 g006
Figure 7. Insulin signaling pathway. Key components of pathways are depicted, red indicates down-regulation, green indicates up-regulation and black indicates neutral regulation of key genes/enzymes.
Ijms 21 08180 g007
Figure 8. COG functional classifications of Labeo rohita fish fed with 20% (Control), 40% and 60% CHO. In total, 26 selected KOG categories were taken for the histogram. The x-axis indicates KOG categories on the right side of the histogram; the y-axis indicates the number of gene fragments in each functional cluster.
Ijms 21 08180 g008
Figure 9. Protein–protein interaction network of control vs. treated. Different colors indicate different components identified in the gene lists.
Ijms 21 08180 g009
Figure 10. Heat map for hierarchical clustering of differential gene expression for selected genes. Fish feed 20% CHO was used as the control, and we also used 40% CHO and 60% CHO. Different colors indicate different P-value (−1 to 1).
Ijms 21 08180 g010
Table 1. Statistics of Labeo rohita liver tissue transcriptome sequences.
Sample NameRaw ReadsProcessed Reads% of Aligned Reads
60A_LV35,558,98530,800,24189.58%
20_LV23,396,28121,202,57292.89%
40_LV24,004,14921,608,23189.84%
Table 2. Differential gene expression statistics for (A) 20_LV-Vs-40_LV and (B) 20_LV-Vs-60_LV.
(A)
Differential Gene Expression Statistics
SummaryTotalUpDownNeutral
No. of transcripts expressed in both samples15,232446443436425
No. of transcripts expressed only in 20_LV3653NANANA
No. of transcripts expressed only in 40_LV2814NANANA
No. of P significant transcripts5744081660
No. of Q significant transcripts0000
(B)
Differential Gene Expression Statistics
SummaryTotalUpDownNeutral
No. of transcripts expressed in both samples15,360447841716711
No. of transcripts expressed only in 20_LV3525NANANA
No. of transcripts expressed only in 60A_LV2840NANANA
No. of P significant transcripts6334322010
No. of Q significant transcripts0000
Table 3. The hub genes and their roles, and functional evidence.
Sl. No.Hub genesFunctionReference
1SynaptopodinDown-regulation of Synaptopodin is known to facilitate glycogen accumulation.[26]
2LIM and senescent cell antigen-containing domain 1-like proteinLIM and senescent cell antigen-containing domain 1-like protein (fragment) is down-regulated to increase abiogenesis.[27]
3ReticulonRegulates fragmentation of ER during starvation but when glucose is in excess.[28]
4ApolipoproteinApoA-IV improves glucose homeostasis by promoting insulin secretion at high levels of glucose.[29]
5Cytochrome P450Improves glucose homeostasis.[30]
6Parvalbumin alphaRegulates brain–liver circuit for glucose homeostasis.[31]
7Protein O-mannosyl-transferase 2Involved in biosynthesis of glycopeptides.[32]
8Supervillin-like isoform X2Controls myogenesis and contributes to myogenic membrane structure and differentiation.[33]
9Transient receptor potential melastatin 4a Plays role as gatekeeper in transepithelial Mg2+ transport to maintain Mg2+ homeostasis.[34]
10Myosin, light polypeptide 3, skeletal muscleControls oxidative glycolytic pathway in carbohydrate metabolism.[35]
11Guanylate-binding protein 2 Plays role in increasing activation of AMPK-p53 pathway and β-galactosidase. [36]
12Phenylalanine hydroxylaseControls insulin secretion and glucose transport.[37]
13Complement C4-2Associated with glucose intolerance.[38]
14TC1-like transposaseReported to be associated with down-regulation of glycogenesis.[39]
15Coagulation factor IXb (Zgc:136807)Reported to be associated with carbohydrate deficiency.[40]
16Complement factor B/C2AElevated level in adipose tissue leads to redistribution of visceral to subcutaneous fat and insulin resistance.[41]
17Phospholipid-transporting ATPase (EC 7.6.2.1)Controls efficiency of transport of dietary fatty acids and lipids in fish.[42]
18Alpha-2-macroglobulin (Fragment)Primarily associated with immunity by remodeling of liver metabolism in fish. It controls activation of the PI3K/Akt, ERK1, and MAPK pathways leading to mobilization of energetic resources away from growth and protein synthesis.[43]
19S-adenosylmethionine synthase (EC 2.5.1.6) Associated with BMI and adiposity. [44]
20Thrombospondin 2b Associated with fatty acid uptake by adipocytes. [45]
21Notchless homolog 1 (Drosophila)Notch signaling central hub gene controlling glucose and lipid metabolism by insulin; also involved in inhibition of liver glucose production, including glycogenolysis and gluconeogenesis.[46]
22Very-long-chain (3R)-3-hydroxyacyl-CoA dehydratase (EC 4.2.1.134) Involved in lipid biosynthesis especially in elongation of very-long-chain fatty acids.[47]
23Obscurin-like 1bIn fish myofibrillar component genes, obscurin is up-regulated with growth.[48]
24Sk-tropomodulin (tropomodulin 4 (muscle))Regulates thin filament lengths in muscles.[49]
Table 4. Depicts the ingredients of different levels of carbohydrate treatments.
IngredientsTreatment_1
(20%)
Treatment_2
40%
Treatment_3
60%
Fish Meal202020
Casein10.210.210.2
Gelatinized Starch204060
Glucose000
Cellulose40200
Fish Oil444
Vegetable Oil333
Carboxy methyl cellulose (Binder)0.50.50.5
Mineral Mix111
Vitamin Mix111
Vitamin C0.20.20.2
Butylhydroxytoluene
(BHT)
0.10.10.1
100100100
Publisher’s Note: MDPI stays neutral with regard to jurisdictional claims in published maps and institutional affiliations.

