Control of the Photo-Isomerization Mechanism in 3H-Naphthopyrans to Prevent Formation of Unwanted Long-Lived Photoproducts


 and
and
Abstract
1. Introduction
2. Results and Discussion
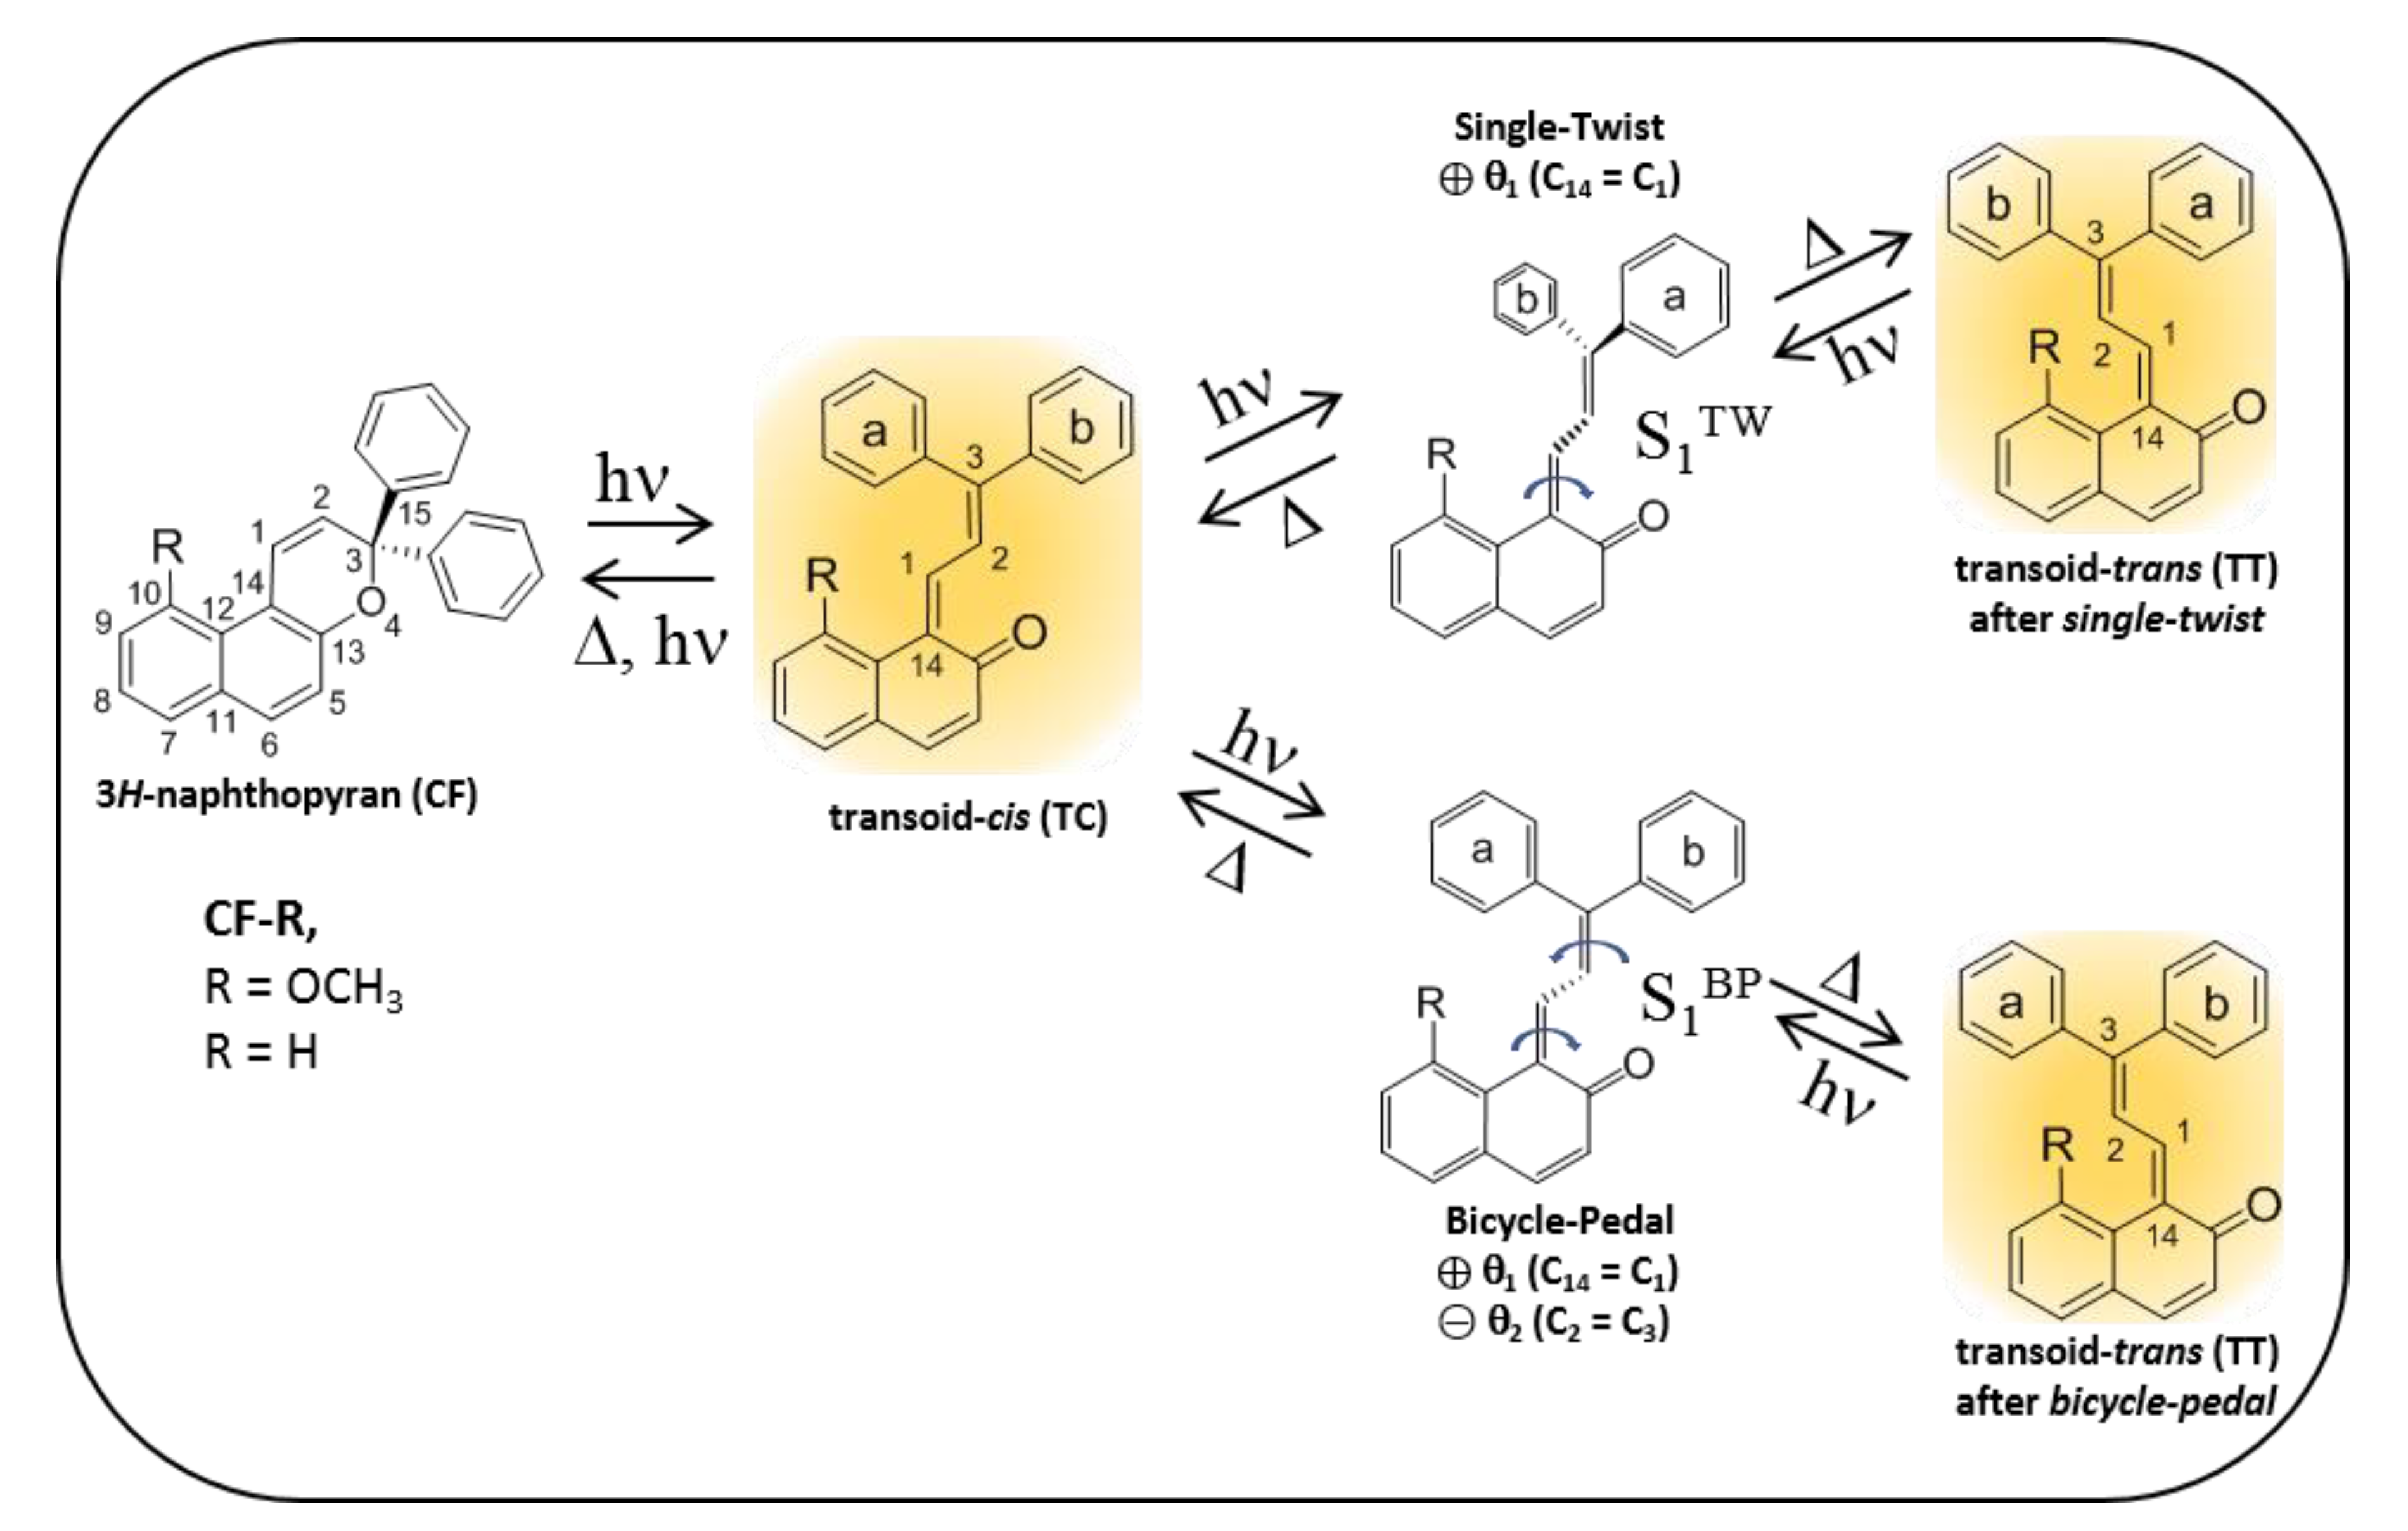
2.1. The Effect of Methoxy Group Presence on the Ground-State Energy Landscape and the UV Absorption Spectrum
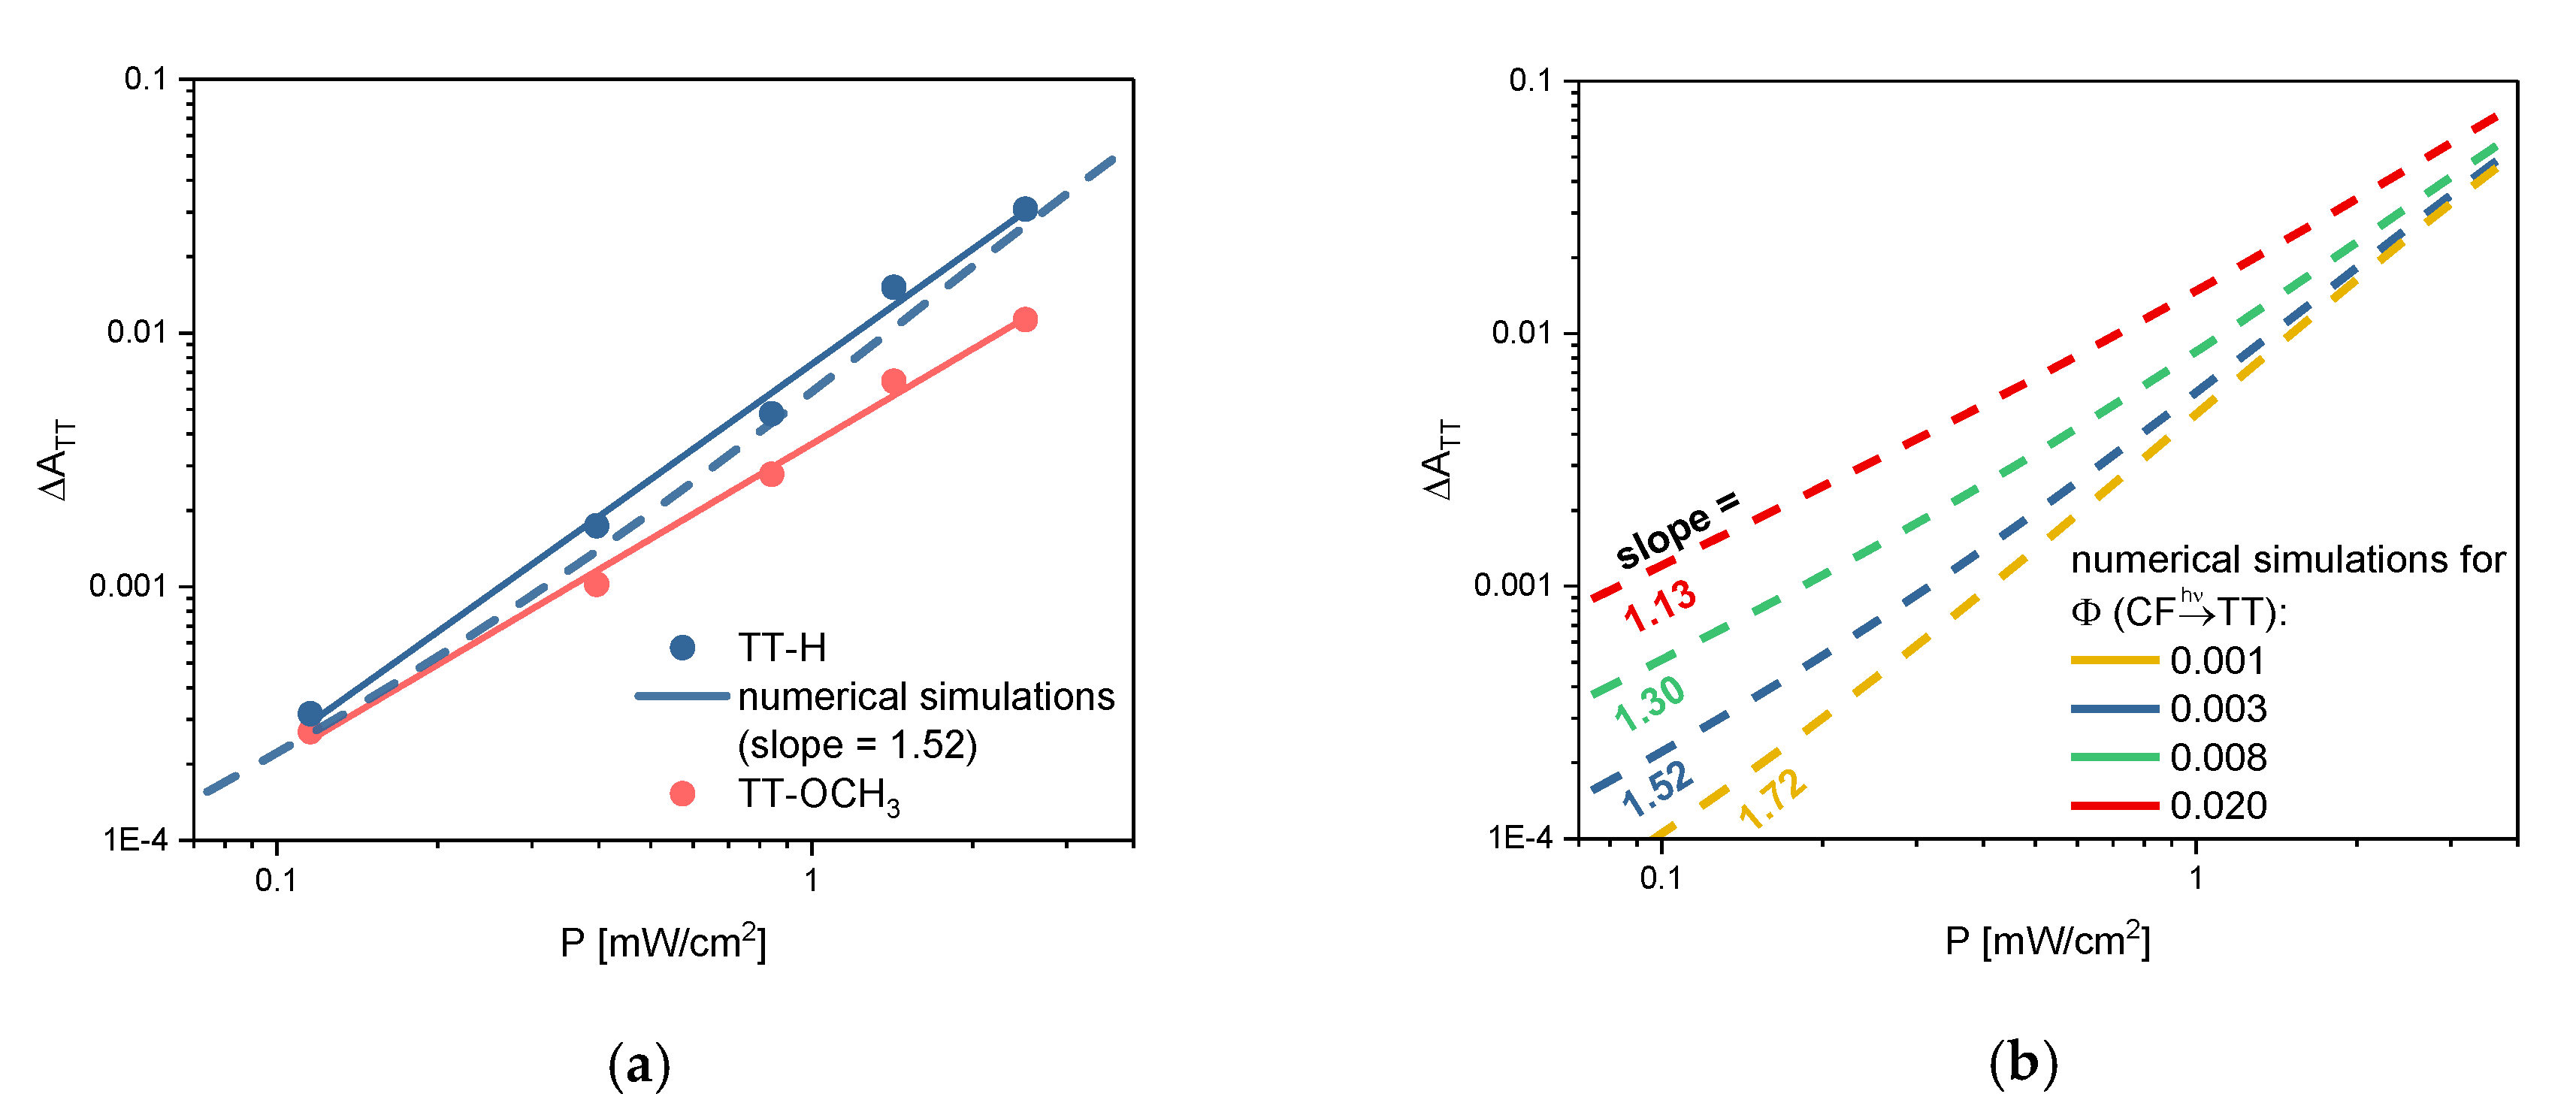
2.2. TT Formation, Single-vs. Two-Photon Mechanism
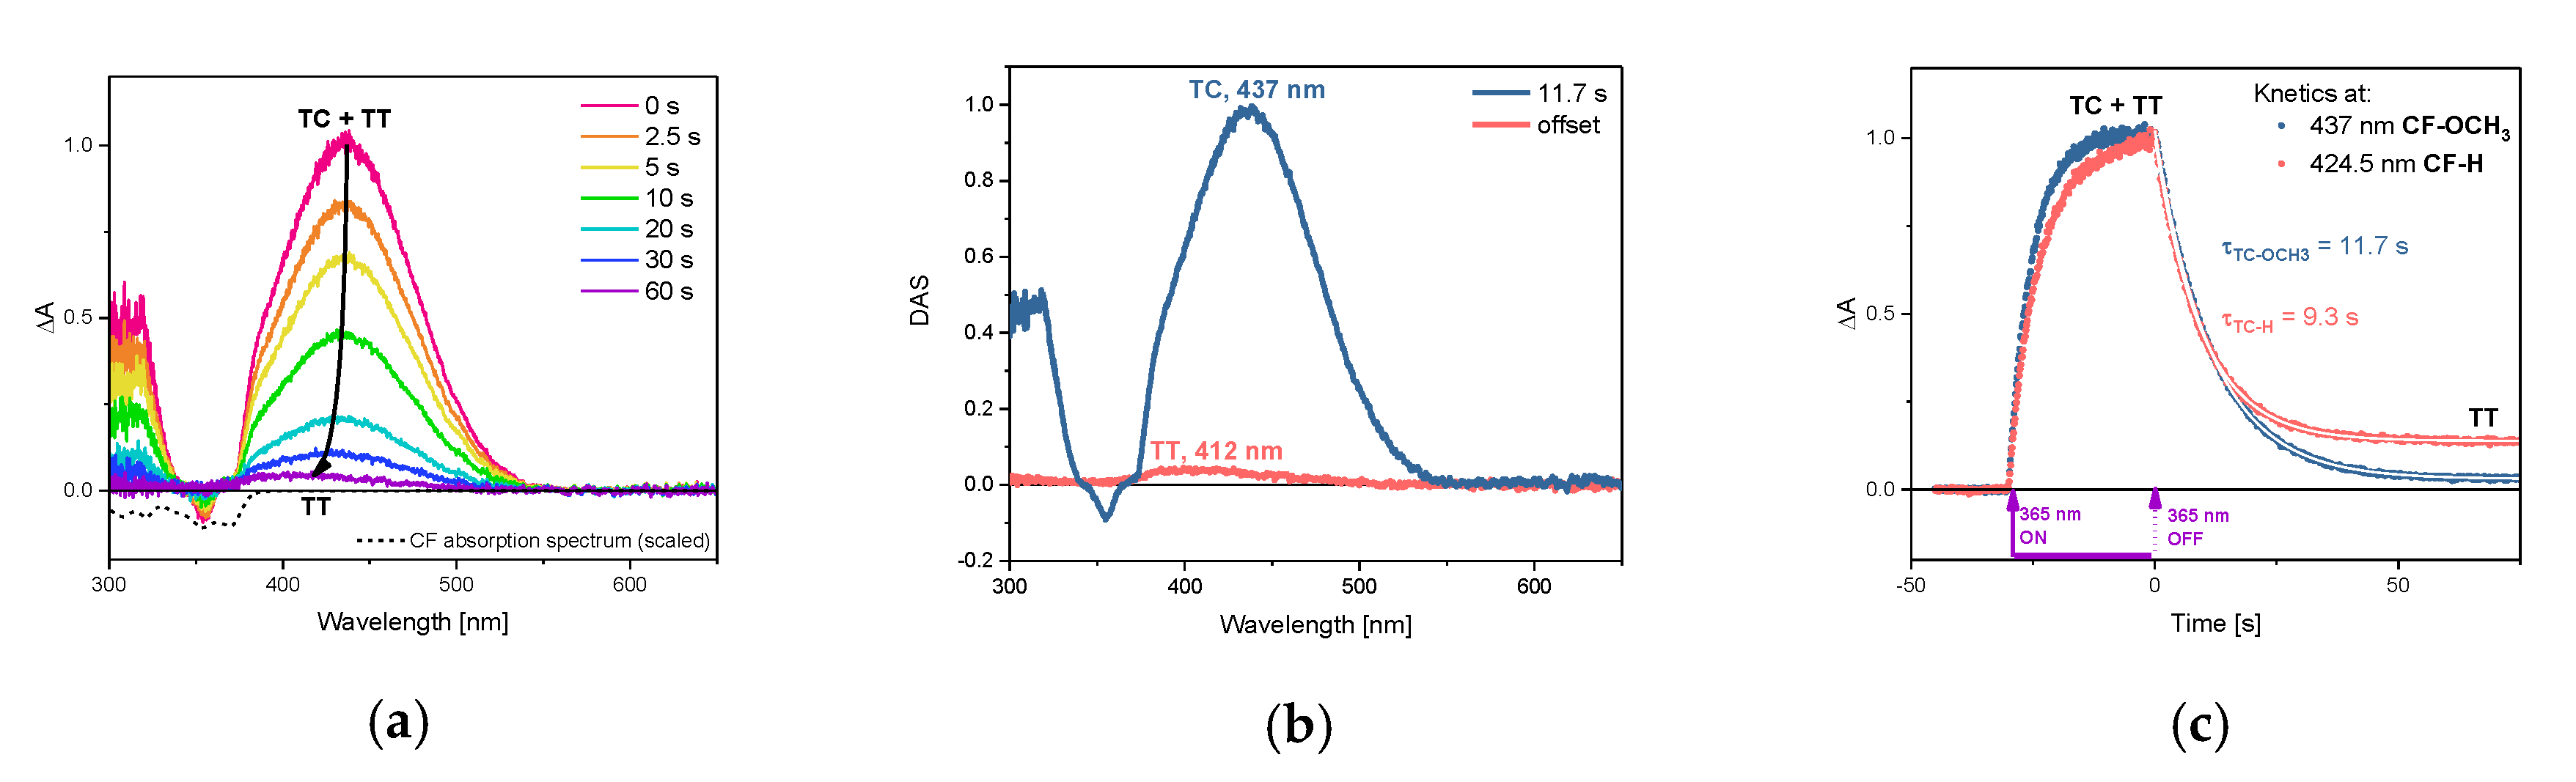
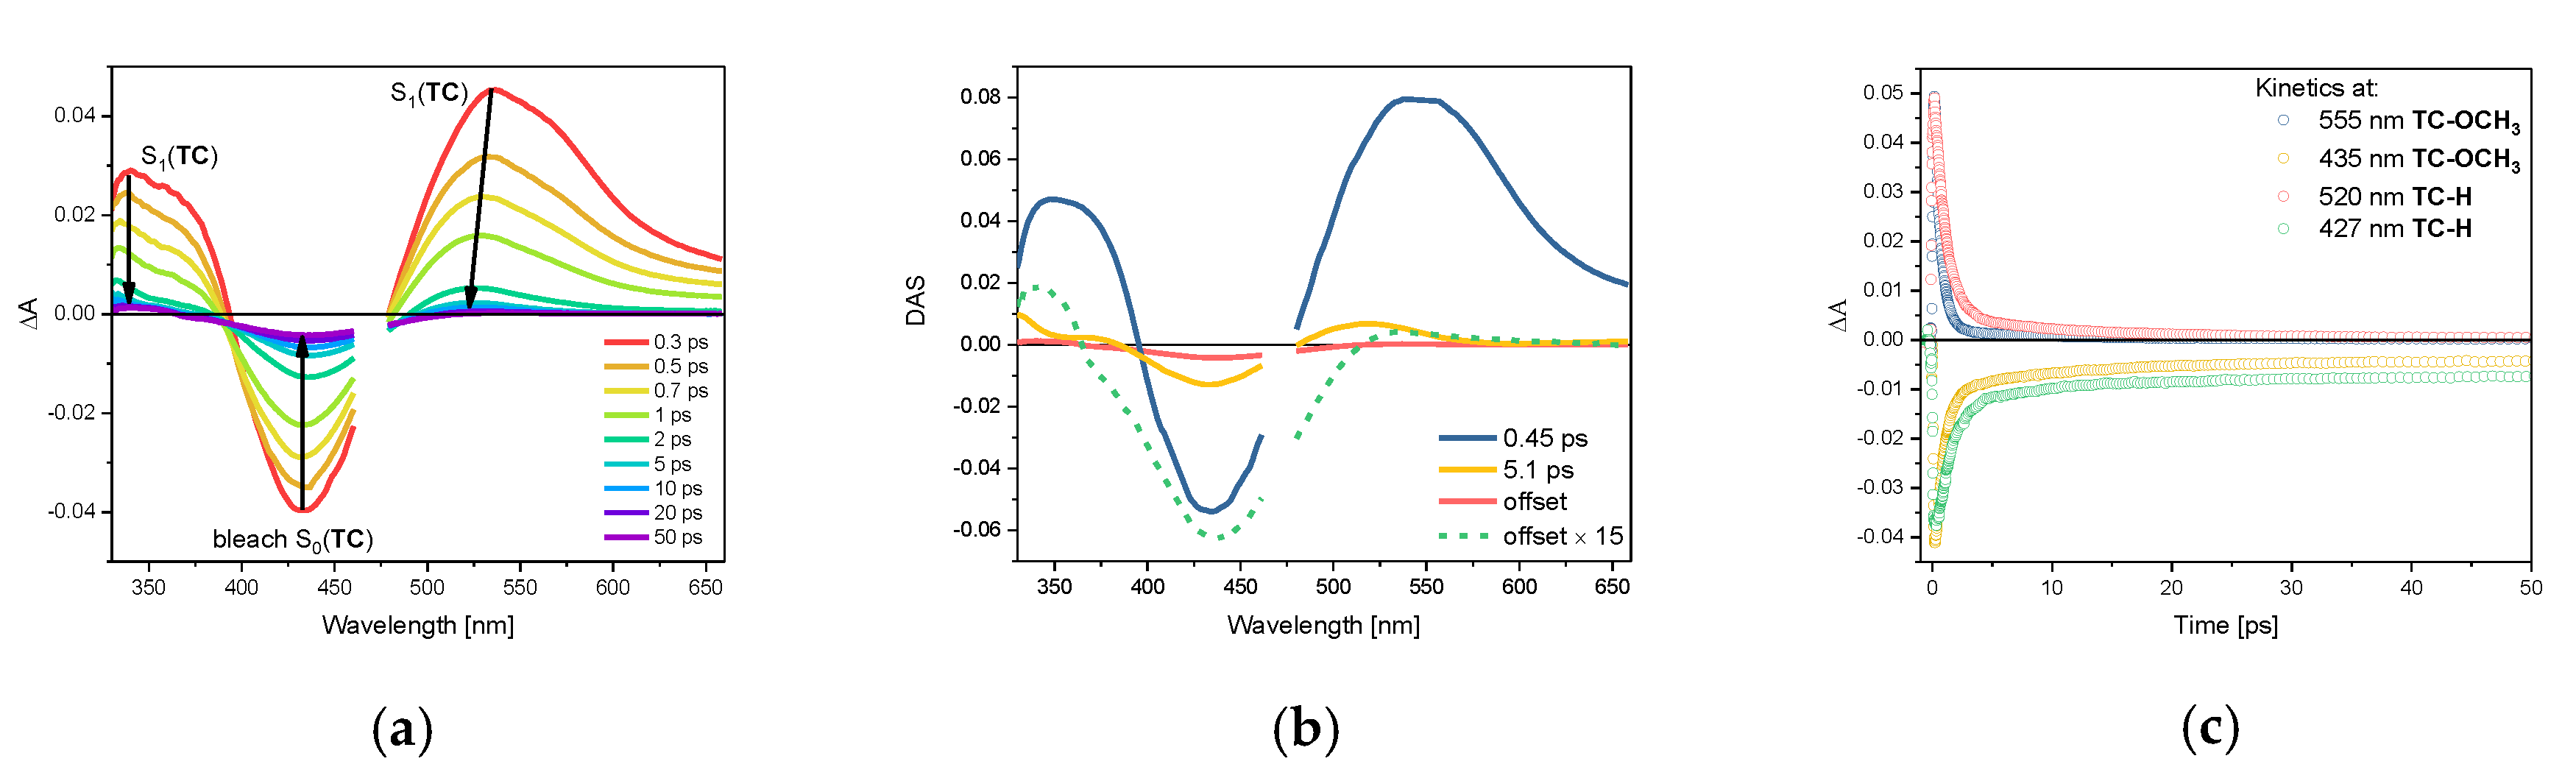
2.3. Photophysical Properties of TC-OCH3 in the Singlet Excited State
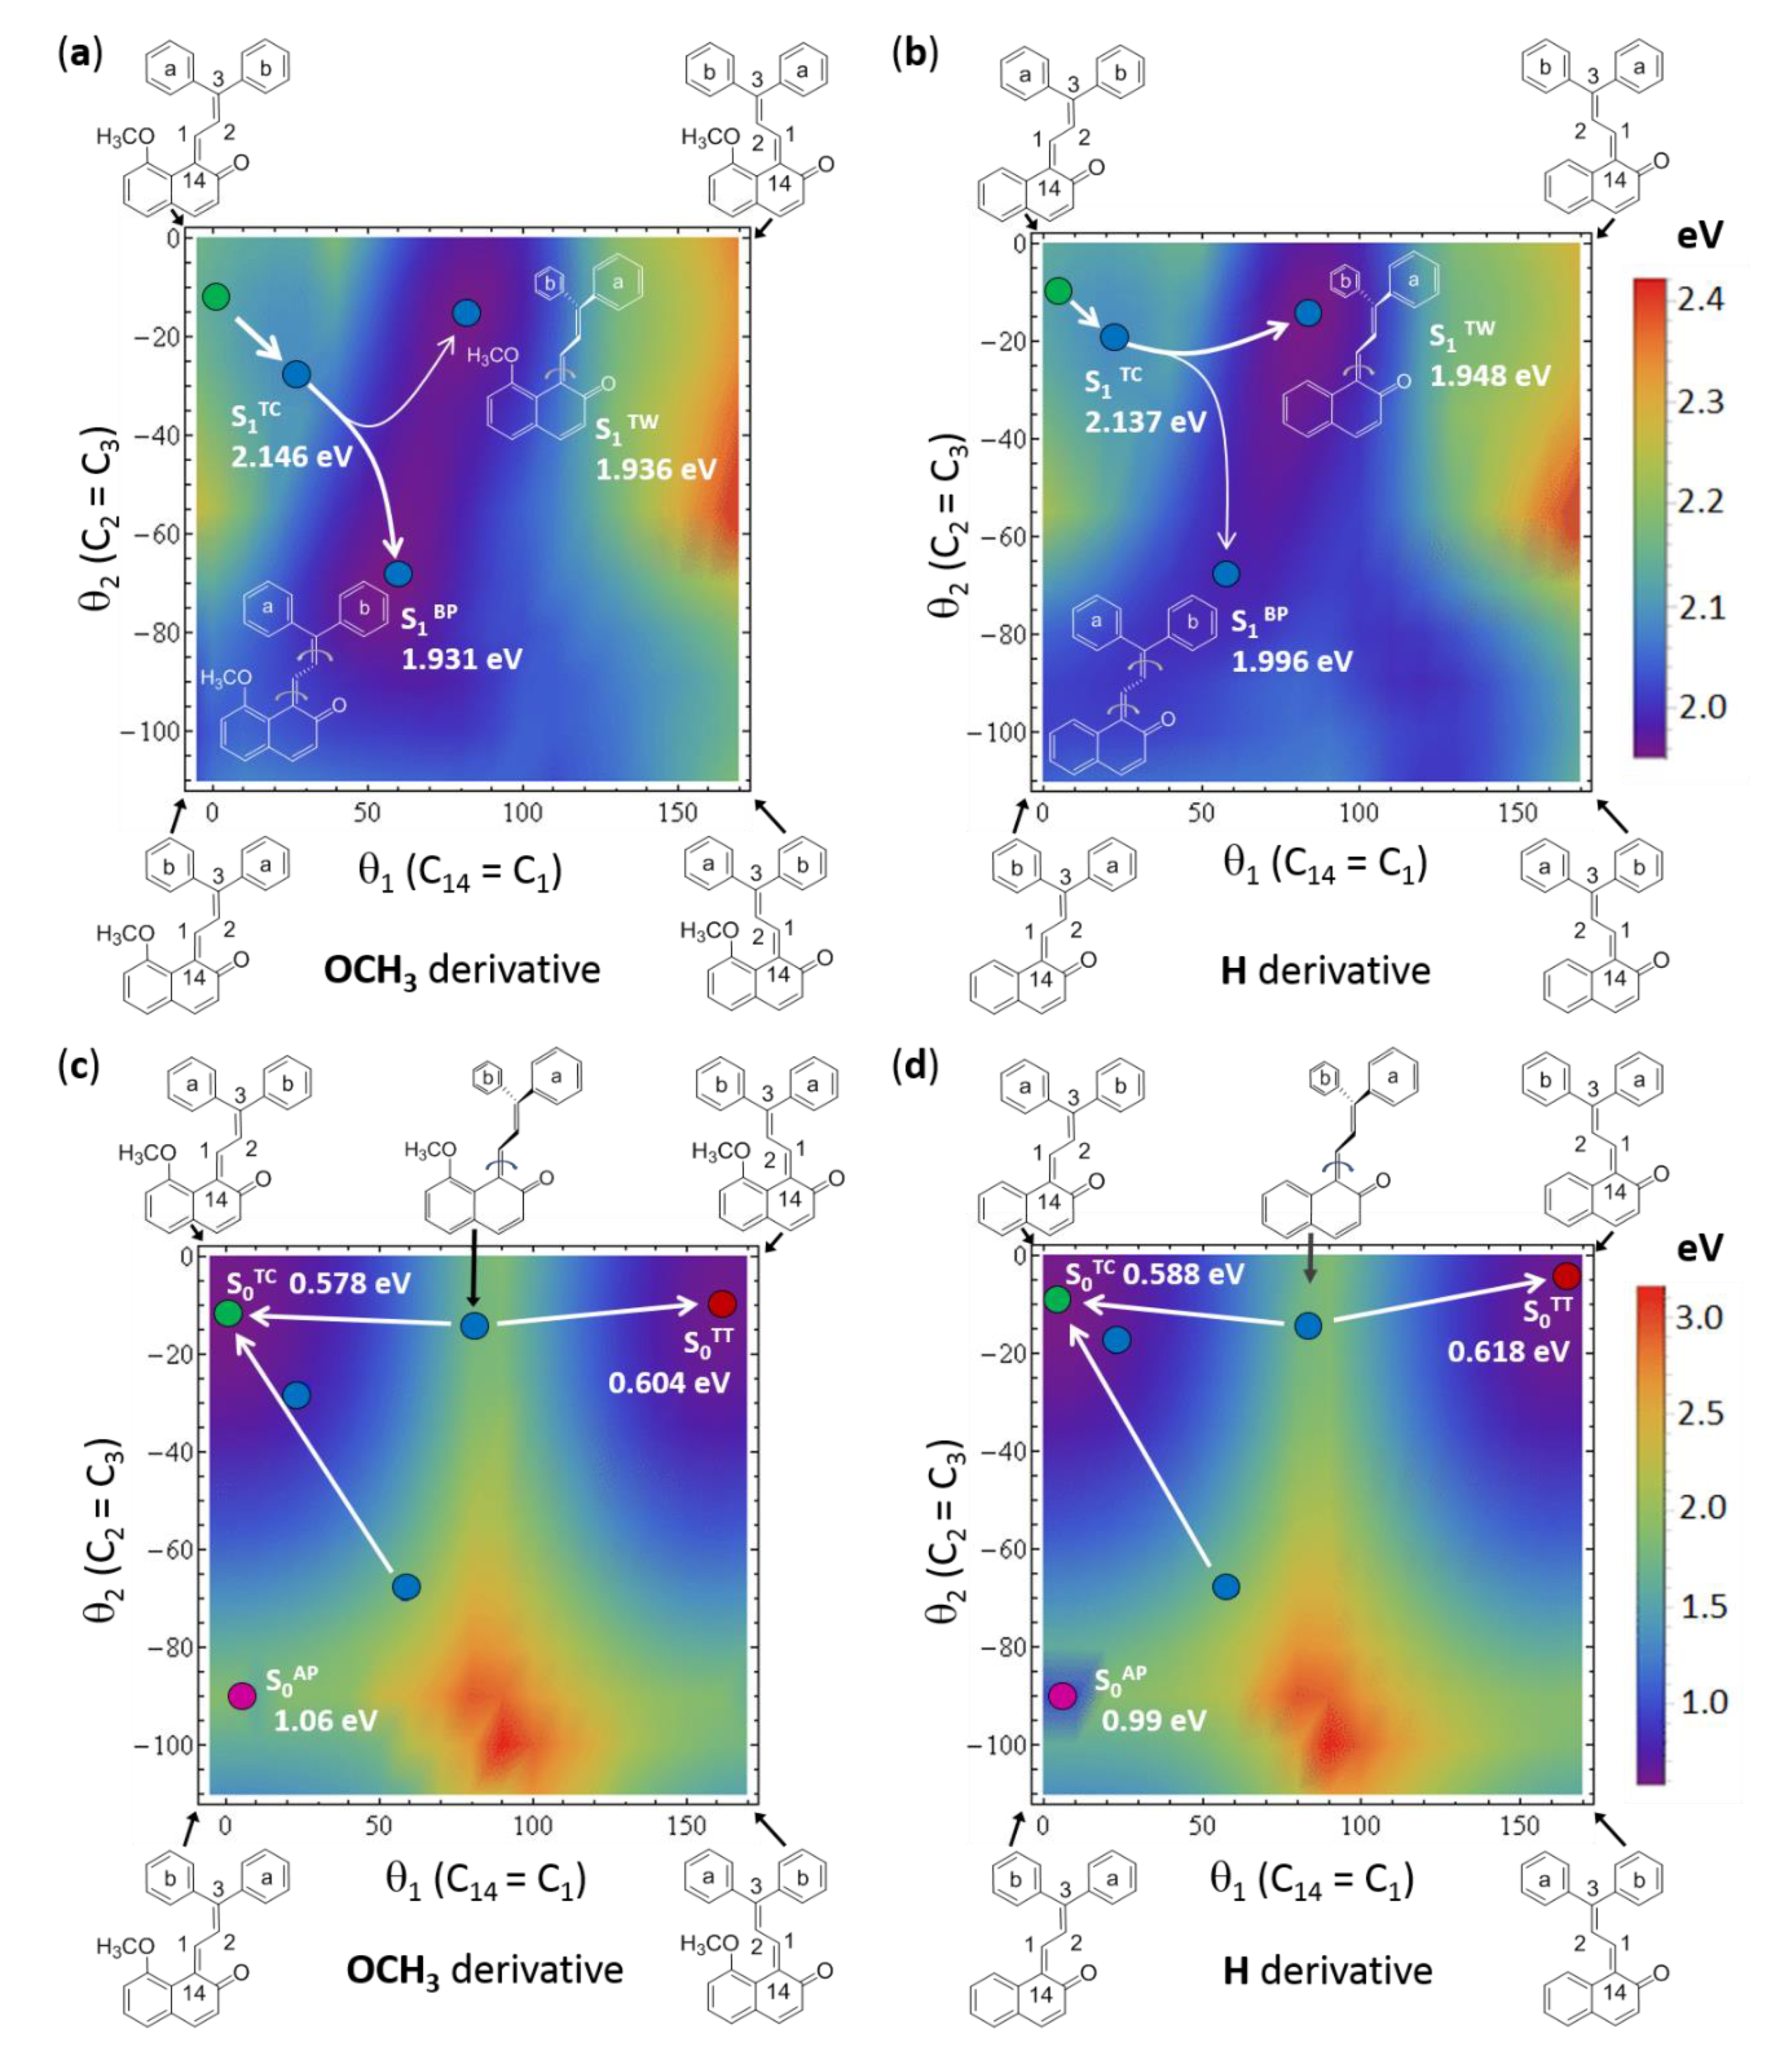
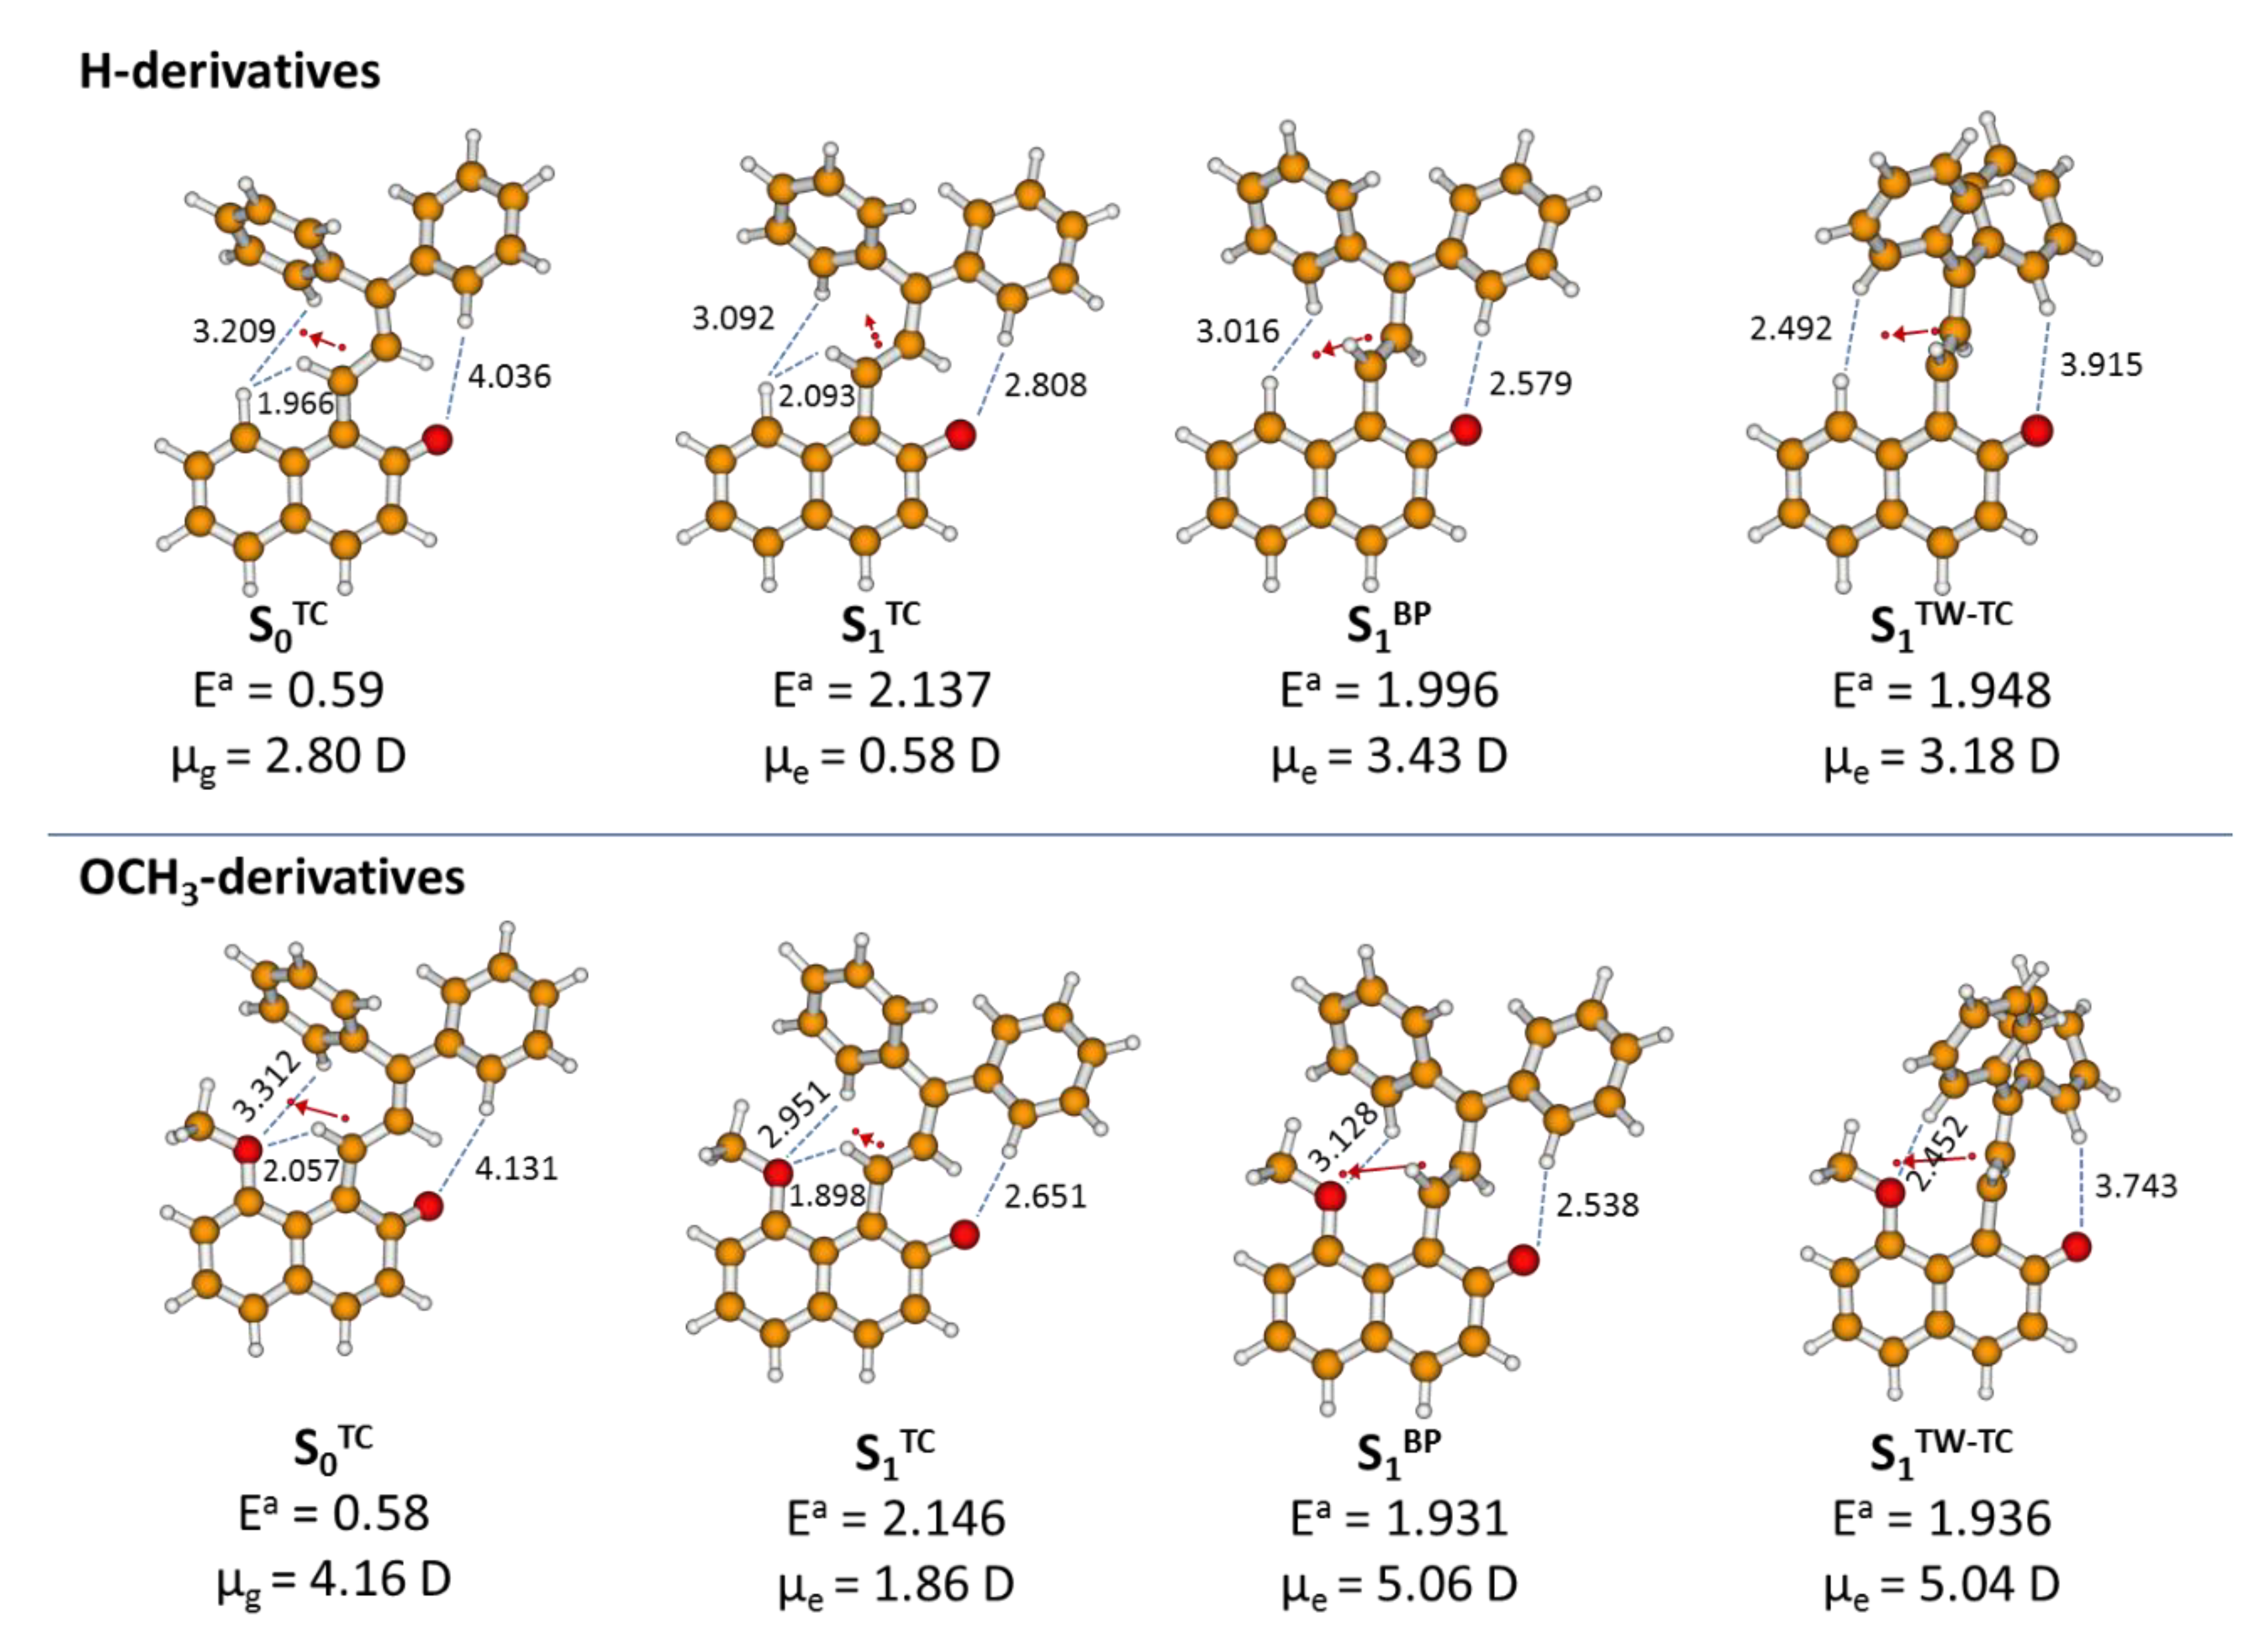
2.4. Theoretical Modelling of TC→TT Photoisomerization Mechanism
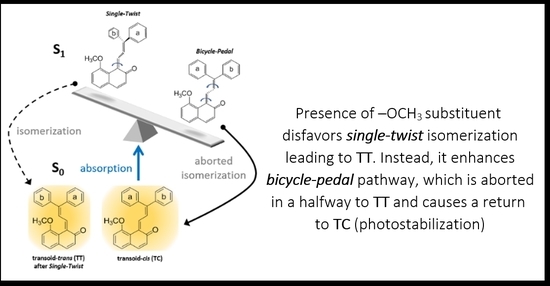
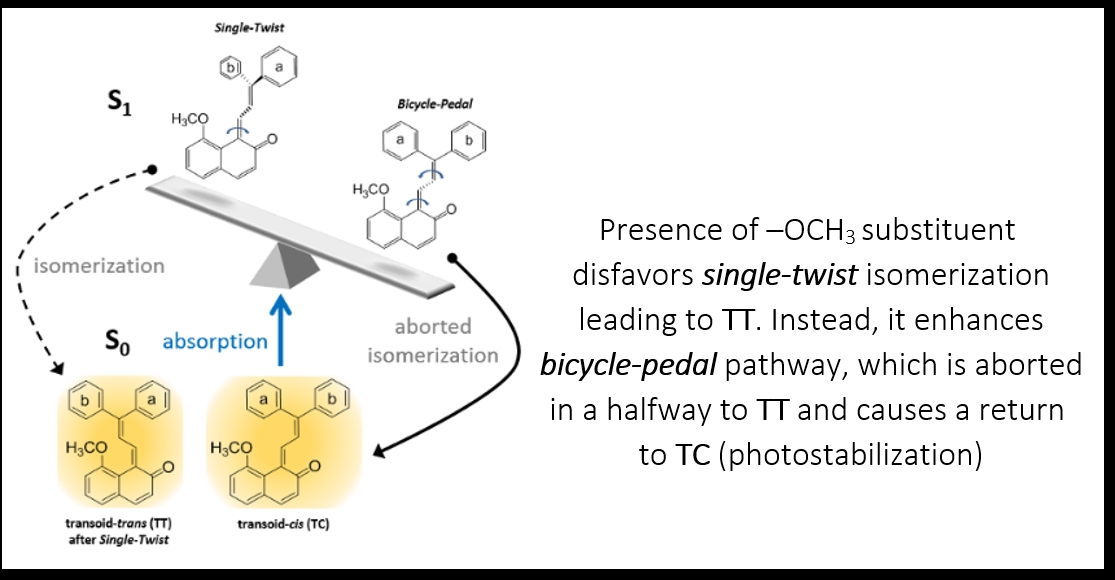
2.5. Role of the Methoxy Group
3. Materials and Methods
3.1. Materials
3.2. Transient UV-Vis Absorption Spectra Over Seconds
3.3. Transient UV-Vis Absorption Over Picoseconds
3.4. Computational Details
4. Conclusions
Supplementary Materials
Author Contributions
Funding
Conflicts of Interest
References
- Becker, R.S.; Michl, J. Photochromism of synthetic and naturally occurring 2H-chromenes and 2H-pyrans. J. Am. Chem. Soc. 1966, 88, 5931–5933. [Google Scholar] [CrossRef]
- Alberti, A.; Teral, Y.; Roubaud, G.; Faure, R.; Campredon, M. On the photochromic activity of some diphenyl-3H-naphtho[2, 1-b]pyran derivatives: Synthesis, NMR characterisation and spectrokinetic studies. Dyes. Pigm. 2009, 81, 85–90. [Google Scholar] [CrossRef]
- Aubard, J.; Maurel, F.; Buntinx, G.; Poizat, O.; Levi, G.; Guglielmetti, R.; Samat, A. Femto/picosecond transient absorption spectroscopy of photochromic 3,3-diphenyl-naphtho[2,1-b]pyran. Mol. Cryst. Liq. Cryst. 2000, 345, 215–220. [Google Scholar] [CrossRef]
- Coelho, P.J.; Carvalho, L.M.; Goncalves, L.F.F.F.; Silva, C.J.R.; Campos, A.M.; Gomes, M.J. Photochromic hybrid sol–gel films containing naphthopyrans. J. Sol. Gel Sci. Technol. 2010, 56, 203–211. [Google Scholar] [CrossRef]
- Crano, J.C.; Flood, T.; Knowles, D.; Kumar, A.; Van Gemert, B. Photochromic compounds: Chemistry and application in ophthalmic lenses. Pure Appl. Chem. 1996, 68, 1395–1398. [Google Scholar] [CrossRef]
- Crano, J.C.; Guglielmetti, R. Organic Photochromic and Thermochromic Compounds: Main Photochromic Families; Plenum Press: New York, NY, USA, 1999; Volume 1. [Google Scholar]
- Delbaere, S.; Luccioni-Houze, B.; Bochu, C.; Teral, Y.; Campredon, M.; Vermeersch, G. Kinetic and structural studies of the photochromic process of 3H-naphthopyrans by UV and NMR spectroscopy. J. Chem. Soc. Perkin Trans. 1998, 2, 1153–1157. [Google Scholar] [CrossRef]
- Delbaere, S.; Vermeersch, G. NMR characterization of allenyl-naphthol in the photochromic process of 3,3-diphenyl-[3H]-naphtho[2-1,b]pyran. J. Photochem. Photobiol. A 2003, 159, 227–232. [Google Scholar] [CrossRef]
- Frigoli, M.; Maurel, F.; Berthet, J.; Delbaere, S.; Marrot, J.; Oliveira, M.M. The control of photochromism of [3H]-naphthopyran derivatives with intramolecular CH-π bonds. Org. Lett. 2012, 14, 4150–4153. [Google Scholar] [CrossRef]
- Frigoli, M.; Mehl, G.H. Room temperature photochromic liquid crystal [3H]-naphtho[2,1-b]pyrans—photochromism in the mesomorphic state. Chem. Commun. 2004, 18, 2040–2041. [Google Scholar] [CrossRef]
- Gentili, P.L.; Danilov, E.; Ortica, F.; Rodgers, M.A.J.; Favaro, G. Dynamics of the excited states of chromenes studied by fast and ultrafast spectroscopies. Photochem. Photobiol. Sci. 2004, 3, 886–891. [Google Scholar] [CrossRef]
- Görner, H.; Chibisov, A.K. Photoprocesses in 2,2-diphenyl-5,6-benzo(2H)chromene. J. Photochem. Photobiol. A 2002, 149, 83–89. [Google Scholar] [CrossRef]
- Hepworth, J.D.; Heron, B.M. Photochromic naphthopyrans. In Functional Dyes; Kim, S.H., Ed.; Elsevier: Amsterdam, The Netherlands, 2006; pp. 85–135. [Google Scholar]
- Herzog, T.T.; Ryseck, G.; Ploetz, E.; Cordes, T. The photochemical ring opening reaction of chromene as seen by transient absorption and fluorescence spectroscopy. Photochem. Photobiol. Sci. 2013, 12, 1202–1209. [Google Scholar] [CrossRef] [PubMed]
- Kumar, A. The relationship between the structure and the absorption spectra of naphtho[2,1-b]pyran. Mol. Cryst. Liq. Cryst. 1997, 297, 139–145. [Google Scholar] [CrossRef]
- Liu, L.; Zhang, Y.; Wang, G.; Zhang, M.; Guan, H. High stability of photoinduced merocyanine in naphthopyran-doped polyvinylpyrrolidone electrospun nanofibers. Polym. Int. 2014, 63, 1991–1996. [Google Scholar] [CrossRef]
- Ottavi, G.; Favaro, G.; Malatesta, V. Spectrokinetic study of 2,2-diphenyl-5,6-benzo(2H) chromene: A thermoreversible and photoreversible photochromic system. J. Photochem. Photobiol. A 1998, 115, 123–128. [Google Scholar] [CrossRef]
- Pardo, R.; Zayat, M.; Levy, D. Thin film photochromic materials: Effect of the sol-gel ormosil matrix on the photochromic properties of naphthopyrans. C. R. Chimie 2010, 13, 212–226. [Google Scholar] [CrossRef]
- Salemi-Delvaux, C.; Aubert, C.; Campredon, M.; Giusti, G.; Guglielmetti, R. On the photodegradation of 3,3-diphenyl-[3H]-naphtho[2,1-b]pyrane in solution: Mechanistic aspect. Mol. Cryst. Liq. Cryst. 1997, 298, 45–51. [Google Scholar] [CrossRef]
- Zayat, M.; Levy, D. Photochromic naphthopyrans in sol–gel ormosil coatings. J. Mater. Chem. 2003, 13, 727–730. [Google Scholar] [CrossRef]
- Inagaki, Y.; Kobayashi, Y.; Mutoh, K.; Abe, J. A simple and versatile strategy for rapid color fading and intense coloration of photochromic naphthopyran families. J. Am. Chem. Soc. 2017, 139, 13429–13441. [Google Scholar] [CrossRef]
- Brazevic, S.; Sliwa, M.; Kobayashi, Y.; Abe, J.; Burdzinski, G. Disclosing whole reaction pathways of photochromic 3H-naphthopyrans with fast color fading. J. Phys. Chem. Lett. 2017, 8, 909–914. [Google Scholar] [CrossRef]
- Moine, B.; Buntinx, G.; Poizat, O.; Rehault, J.; Moustrou, C.; Samat, A. Transient absorption investigation of the photophysical properties of new photochromic 3H-naphtho[2,1-b]pyran. J. Phys. Org. Chem. 2007, 20, 936–943. [Google Scholar] [CrossRef]
- Moine, B.; Rehault, J.; Aloise, S.; Micheau, J.-C.; Moustrou, C.; Samat, A.; Poizat, O.; Buntinx, G. Transient absorption studies of the photochromic behavior of 3H-naphtho[2,1-b]pyrans linked to thiophene oligomers via an acetylenic junction. J. Phys. Chem. A 2008, 112, 4719–4726. [Google Scholar] [CrossRef] [PubMed]
- Brazevic, S.; Baranowski, M.; Sikorski, M.; Rode, M.F.; Burdziński, G. Ultrafast dynamics of the transoid-cis isomer formed in photochromic reaction from 3H-naphthopyran. ChemPhysChem 2020, 21, 1402–1407. [Google Scholar] [CrossRef] [PubMed]
- Arai, K.; Kobayashi, Y.; Abe, J. Rational molecular designs for drastic acceleration of the color-fading speed of photochromic naphthopyrans. Chem. Commun. 2015, 51, 3057–3060. [Google Scholar] [CrossRef] [PubMed]
- Mutoh, K.; Kobayashi, Y.; Abe, J. Efficient coloration and decoloration reactions of fast photochromic 3H-naphthopyrans in PMMA-b-PBA block copolymer. Dyes Pigm. 2017, 137, 307–311. [Google Scholar] [CrossRef]
- Brazevic, S.; Nizinski, S.; Szabla, R.; Rode, M.F.; Burdzinski, G. Photochromic reaction in 3H-naphthopyrans studied by vibrational spectroscopy and quantum chemical calculations. Phys. Chem. Chem. Phys. 2019, 21, 11861–11870. [Google Scholar] [CrossRef]
- Van Gemert, B.; Kumar, A.; Knowles, D.B. Naphthopyrans. Structural features and photochromic properties. Mol. Cryst. Liq. Cryst. 1997, 297, 131–138. [Google Scholar] [CrossRef]
- Gozem, S.; Luk, H.L.; Schapiro, I.; Olivucci, M. Theory and simulation of the ultrafast double-bond isomerization of biological chromophores. Chem. Rev. 2017, 117, 13502–13565. [Google Scholar] [CrossRef]
- Redwood, C.; Bayda, M.; Saltiel, J. Photoisomerization of pre- and provitamin D3 in EPA at 77 K: One-bond-twist, not hula-twist. J. Phys. Chem. Lett. 2013, 4, 716–721. [Google Scholar] [CrossRef]
- Saltiel, J.; Megarity, E.D.; Kneipp, K.G. The mechanism of direct cis-trans photoisomerization of the stilbenes. J. Am. Chem. Soc. 1966, 88, 2336–2338. [Google Scholar] [CrossRef]
- Schapiro, I.; Weingart, O.; Buss, V. Bicycle-pedal isomerization in a rhodopsin chromophore model. J. Am. Chem. Soc. 2009, 131, 16–17. [Google Scholar] [CrossRef]
- Warshel, A. Bicycle-pedal model for the first step in the vision process. Nature 1976, 260, 679–683. [Google Scholar] [CrossRef] [PubMed]
- Hu, D.; Liu, Y.F.; Sobolewski, A.L.; Lan, Z. Nonadiabatic dynamics simulation of keto isocytosine: A comparison of dynamical performance of different electronic-structure methods. Phys. Chem. Chem. Phys. 2017, 19, 19168–19177. [Google Scholar] [CrossRef] [PubMed]
- Perun, S.; Sobolewski, A.L.; Domcke, W. Conical intersections in thymine. J. Phys. Chem. A 2006, 110, 13238–13244. [Google Scholar] [CrossRef]
- Ozimiński, W.P.; Dobrowolski, J.C. σ- and π-electron contributions to the substituent effect: Natural population analysis. J. Phys. Org. Chem. 2009, 22, 769–778. [Google Scholar] [CrossRef]
- Dobrowolski, J.C.; Lipiński, P.F.J.; Karpińska, G. Substituent effect in the first excited singlet state of monosubstituted benzenes. J. Phys. Chem. A 2018, 122, 4609–4621. [Google Scholar] [CrossRef] [PubMed]
- Wendel, M.; Nizinski, S.; Tuwalska, D.; Starzak, K.; Szot, D.; Prukala, D.; Sikorski, M.; Wybraniec, S.; Burdzinski, G. Time-resolved spectroscopy of the singlet excited state of betanin in aqueous and alcoholic solutions. Phys. Chem. Chem. Phys. 2015, 17, 18152–18158. [Google Scholar] [CrossRef] [PubMed]
- Møller, C.; Plesset, M.S. Note on an aproximation treatment for many-electron systems. Phys. Rev. 1934, 46, 618–622. [Google Scholar] [CrossRef]
- Hättig, C. Structure optimizations for excited states with correlated second-order methods: CC2 and ADC(2). Advances in Quantum Chemistry 2005, 50, 37–60. [Google Scholar]
- Schirmer, J. Beyond the random-phase approximation: A new approximation scheme for the polarization propagator. Phys. Rev. A 1982, 26, 2395–2416. [Google Scholar] [CrossRef]
- Trofimov, A.B. An efficient polarization propagator approach to valence electron excitation spectra. J. Phys. B: At. Mol. Opt. Phys. 1995, 28, 2299–2324. [Google Scholar] [CrossRef]
- Dunning, T.H., Jr. Gaussian basis sets for use in correlated molecular calculations. I. The atoms boron through neon and hydrogen. J. Chem. Phys. 1989, 90, 1007–1023. [Google Scholar] [CrossRef]
- Christiansen, O.; Koch, H.; Jørgensen, P. The second-order approximate coupled cluster singles and doubles model CC2. Chem. Phys. Lett. 1995, 243, 409–418. [Google Scholar] [CrossRef]
- Hättig, C.; Weigend, F. CC2 excitation energy calculations on large molecules using the resolution of the identity approximation. J. Chem. Phys. 2000, 113, 5154–5161. [Google Scholar] [CrossRef]
- TURBOMOLE, Version 7.1, a Development of University of Karlsruhe and Forschungszentrum Karlsruhe GmbH, 1989–2007. Since 2007 TURBOMOLE GmbH. Available online: http://www.turbomole.com (accessed on 10 June 2016).


| Compound | Solvent | S0(TC) λabsmax | τS0, s | S1(TC) λabsmax | τS1, ps |
|---|---|---|---|---|---|
| TC-OCH3 | cyclohexane | 437 nm | 11.7 1 | 525 nm 3 | 0.47 2 |
| acetonitrile | 447 nm | 17.0 1 | 545 nm | 0.27 2 | |
| TC-H | cyclohexane | 427 nm | 9.3 1 | 520 nm 3 | 0.87 2 |
| acetonitrile | 430 nm | 8.6 1 | 513 nm | 0.31 2 |
| S0- or S1-State Form | R1 C3−O4 [Å] | θ1 C13−C14=C1−C2 [°] | θ2 C1−C2=C3−C15 [°] | σ [°] | τ [°] | R2 C13−O4 [Å] | RD C1−C14 [Å] | RS C1−C2 [Å] | RE C2−C3 [Å] | Ea [eV] |
|---|---|---|---|---|---|---|---|---|---|---|
| H-derivative | ||||||||||
| S0 TC | 4.165 | 2.5 | −9.5 | 173.5 | 160.3 | 1.239 | 1.386 | 1.437 | 1.384 | 0.59 |
| S1 TC | 3.921 | 22.5 | −18.7 | −174.8 | 174.2 | 1.399 | 1.478 | 1.371 | 1.440 | 2.14 |
| S1 TW | 4.433 | 84.7 | −14.9 | −170.0 | 180.0 | 1.266 | 1.474 | 1.366 | 1.445 | 1.95 |
| S1 BP | 4.243 | 59.2 | −68.5 | −176.5 | 176.6 | 1.266 | 1.482 | 1.344 | 1.492 | 2.00 |
| OCH3-derivative | ||||||||||
| S0 TC | 4.086 | 1.8 | −11.7 | 173.6 | 153.3 | 1.239 | 1.389 | 1.439 | 1.383 | 0.58 |
| S1 TC | 3.818 | 25.5 | −27.0 | −174.9 | 172.8 | 1.390 | 1.483 | 1.364 | 1.450 | 2.15 |
| S1 BP | 4.170 | 58.3 | −69.1 | −177.8 | 178.7 | 1.263 | 1.483 | 1.342 | 1.492 | 1.93 |
| S1 TW | 4.308 | 82.6 | −13.7 | −177.2 | 177.3 | 1.260 | 1.476 | 1.366 | 1.439 | 1.94 |
Publisher’s Note: MDPI stays neutral with regard to jurisdictional claims in published maps and institutional affiliations. |
© 2020 by the authors. Licensee MDPI, Basel, Switzerland. This article is an open access article distributed under the terms and conditions of the Creative Commons Attribution (CC BY) license (http://creativecommons.org/licenses/by/4.0/).
Share and Cite
Brazevic, S.; Nizinski, S.; Sliwa, M.; Abe, J.; Rode, M.F.; Burdzinski, G. Control of the Photo-Isomerization Mechanism in 3H-Naphthopyrans to Prevent Formation of Unwanted Long-Lived Photoproducts. Int. J. Mol. Sci. 2020, 21, 7825. https://doi.org/10.3390/ijms21217825
Brazevic S, Nizinski S, Sliwa M, Abe J, Rode MF, Burdzinski G. Control of the Photo-Isomerization Mechanism in 3H-Naphthopyrans to Prevent Formation of Unwanted Long-Lived Photoproducts. International Journal of Molecular Sciences. 2020; 21(21):7825. https://doi.org/10.3390/ijms21217825
Chicago/Turabian StyleBrazevic, Sabina, Stanisław Nizinski, Michel Sliwa, Jiro Abe, Michał F. Rode, and Gotard Burdzinski. 2020. "Control of the Photo-Isomerization Mechanism in 3H-Naphthopyrans to Prevent Formation of Unwanted Long-Lived Photoproducts" International Journal of Molecular Sciences 21, no. 21: 7825. https://doi.org/10.3390/ijms21217825
APA StyleBrazevic, S., Nizinski, S., Sliwa, M., Abe, J., Rode, M. F., & Burdzinski, G. (2020). Control of the Photo-Isomerization Mechanism in 3H-Naphthopyrans to Prevent Formation of Unwanted Long-Lived Photoproducts. International Journal of Molecular Sciences, 21(21), 7825. https://doi.org/10.3390/ijms21217825