1. Introduction
In immunotherapies, adoptive or engineered T cell therapies are a personalized approach to successful remediation of various diseases. Identifying a robust process that can efficiently induce proliferation of naïve T cells is essential in T cell manufacturing process development. In an article published in 2019 by
Cancer Discovery, the authors touch on the importance of naïve CD4
+ T cells in pediatric cancer patients receiving immunotherapies. The effects of repetitive chemotherapy cycles deplete naïve T cells in many pediatric cancer patients, which minimizes the potential to induce proliferation successfully after adoptive cellular therapies [
1]. Furthermore, the complete impacts of cytokines–and especially the combinations of cytokines–is poorly understood in the context of the rapid expansion of ex-vivo T-cell cultures and in how specific T-cell subsets differentially respond. As part of the CAR-T cancer therapy, transfected T-cells are grown ex-vivo until therapeutically relevant concentrations are reached. This process can be challenging to do efficiently, as the in-vivo environment normally provides the T-cells with growth-regulating signals that are absent in conventional medium formulations. The addition of the interleukin-2, 7, and 15 cytokines has been shown to induce human T-cell activation proliferation
in-vitro, although the cytokine concentrations and growth rates are not linearly correlated [
2,
3]. There is extensive qualitative and less quantitative information on the merits of the cytokines’ impact on T cell proliferation individually per phenotype. There is also lacking evidence in an experimentally design study to reveal the optimal combination and overall impact the cytokines have on the proliferation of the CD4
+ T cell phenotype [
3]. It is useful, therefore, to study the impact of the concentration of the aforementioned cytokines on the proliferation and signal transduction of the naïve CD4
+ T cells.
Another aim of the study is to generate more data and information for naïve CD4
+ T cells due to the inherent challenges this phenotype presents. Natural killer (NK) cells and cytolytic CD8
+ T cells are often more easily influenced with cytokines into proliferation, but the CD4
+ T cells are less responsive to one cytokine alone [
3,
4,
5,
6,
7]. According to the literature, there is more to be done to unlock a useful cocktail of cytokines to balance the slow growth of the naïve CD4
+ T cells and the tendency for this phenotype to undergo differentiation to a different phenotype [
8]. CD4
+ naïve T cells play critical roles in aiding the expansion of adoptive immunotherapies in vivo, and therefore this study can positively impact manufacturing productivity and efficacy while reducing uncertainty of cytokine concentration [
9,
10].
To develop the conditions for the experiment, the team studied historical reference points that may lead to the appropriate boundary conditions. As naïve CD4
+ T cells are less responsive than naïve CD8
+ T cells and NK cells [
5], we would need to carefully examine the ranges of application for each of the cytokines. Alves, et al. describes IL-15 being used to stimulate growth of naïve CD4
+ and naive CD8
+ T cells, as well as NK cells [
5]. In that experiment, naïve CD4
+ T cells were required at least 40 ng/mL to divide at approximately 20% rate. This led roughly 40 ng/mL to become the median in the condition data set for IL-15.
Geginat et al. note that in particular, naïve CD4
+ T cells respond quickly to antigen-presenting molecules (APM), having only a 40-h lag prior to first division, when compared with cytokine stimulation alone having a lag of 72 h [
3]. The division times are characteristically different in the naive CD4
+ T cells when exposed to APMs versus cytokines, where the division times averaged 10 h when responding to APMs versus 30 h when responding to cytokines [
3]. IL-7 and IL-15 cytokines were used in the study to induce proliferation, whereby the concentration was approximately 25 ng/mL for both cytokines in the study [
3]. Another study was able to provide some background for concentrations of IL-2 needed for the study; Litvinova, et al. describes the concentration of IL-2 used to stimulate significant growth in CD4
+ T cells as 1 ng/mL [
11]. When compared to IL-7 and IL-15, IL-2 alone was the only cytokine to drive significant growth. Silva et al., describes the proliferation of naïve CD4
+ T cell maintenance in patients with thymectomy, using IL-2 and IL-7 to stimulate the growth [
12]. The concentration of IL-2 was 2 ng/mL and the IL-7 concentration was 10 ng/mL which successfully drove improved proliferation of the cells. Jaleco, et al, ran an experiment of naïve and memory CD4
+ T cell subsets, attempting to walk the tight rope of proliferation and apoptosis [
4]. The findings show that IL-2 and IL-7 act together for proliferative cell divisions, which is significantly more effective than using IL-2 or IL-7 alone. The concentration of IL-7 was again 10 ng/mL and the concentration of IL-2 was 6 ng/mL. Finally, Dooms and Abbas, as well as Kinter, et al., tested up to 100 ng/mL for IL-2, IL-7 and IL-15, but there were cell death implications of the highest concentration [
13,
14]. We thus deduce that the optimal concentration lies likely between 1–100 ng/mL for each of the cytokines.
On the basis of the review on the cytokine concentrations used to promote T cell growth, sixteen conditions were designed in this study to investigate the expansion of the CD4
+ T-cell activated with anti-CD3/CD28 dynabeads under the influence of various combinations of IL-2, IL-7 and IL-15 in a 96-well plate format. Three levels of concentrations, which represent low, moderate and high concentrations of each cytokine, were applied in four experiments. The growth data were thoroughly analyzed with ANOVA tests [
15] to identify the cytokine cocktails that were able to significantly enhance the growth of activated CD4
+ T cells when compared to the control condition. A Fuzzy model, which is known for its good prediction capability [
16], was then developed to predict the growth of activated CD4
+ T cells and study the interaction of cytokines in promoting activated CD4
+ T cell growth. Finally, transcriptomic data was obtained for each cytokine stimulation and analyzed with principal component analysis [
17], GeneMania [
18], and MetaCore [
19] to identify the genes/reactions regulated by each cytokines in activated CD4
+ T cell. The genes whose profiles are correlated with the growth rates were also identified. The relevance of this work stems from its innate foundational-level exploration for the advancement of understanding the quantifiable impact of each of the three cytokines on the growth of activated CD4
+ T cells. Additionally, we sought to study the synergistic impact of different combinations of cytokines on the growth rate of the T cells. To our knowledge, this is the first trial to systematically investigate the combination of the aforementioned cytokines to accelerate the growth of activated CD4
+ T cells.
2. Results
2.1. Identify Optimal Cytokine Combinations from the Statistical Analysis of Cell Growth Rates
Cells were thawed from cryopreservation in DMSO and activated with anti-CD3/CD28 dynabeads on day 0 of the experiment, and cytokine supplementation at the experimental conditions was performed on day three after media acclimation and post-activation anergy had completed. Pairwise
t-tests were then conducted on the growth rates obtained from four datasets for 16 conditions each (
Table 1).
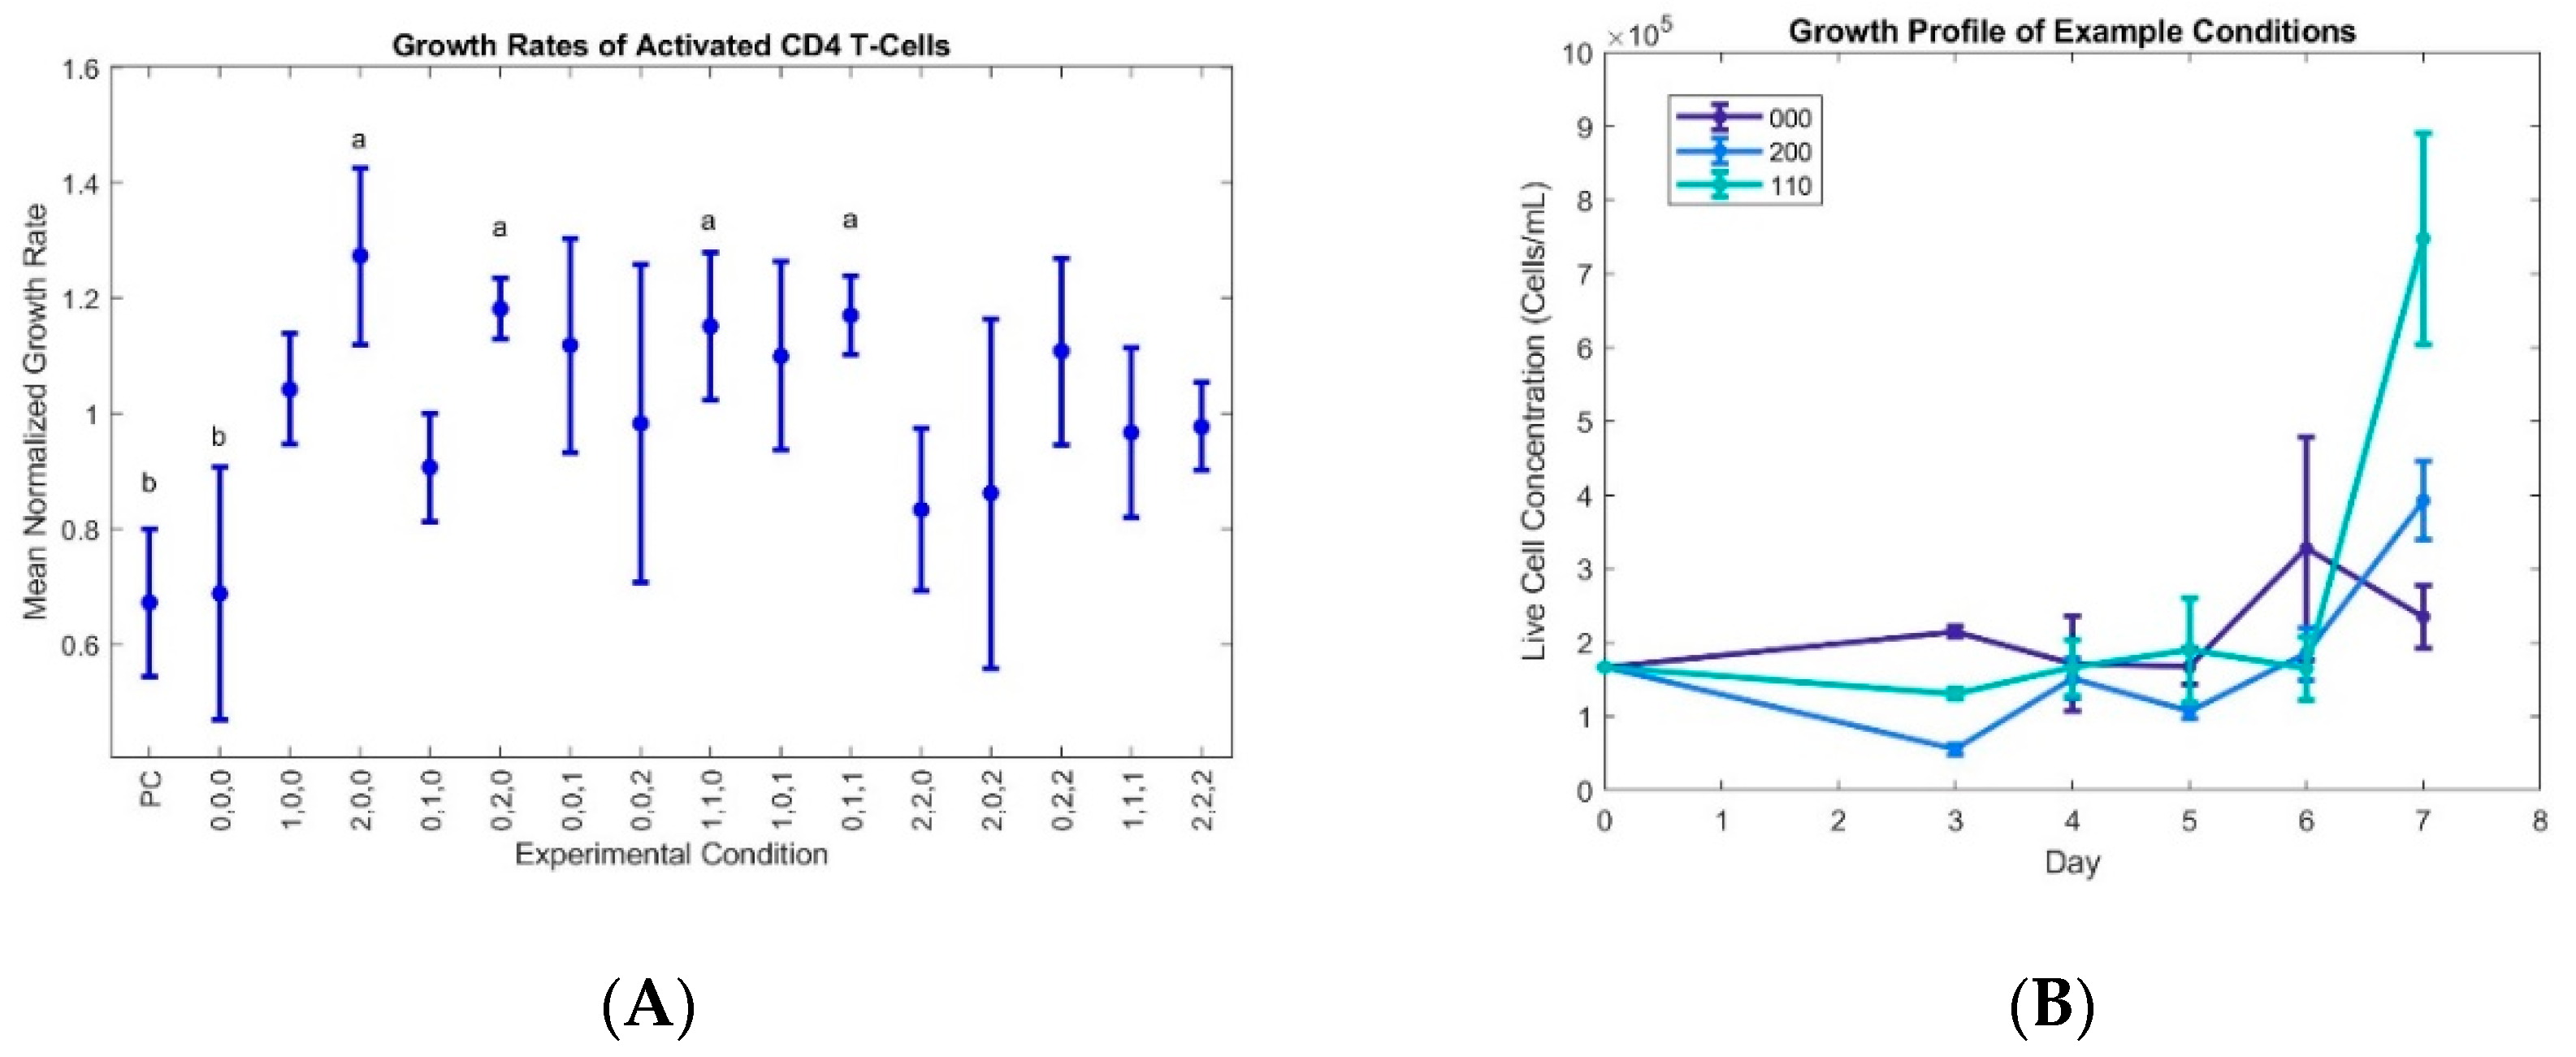
The growth rates were normalized to the average growth rate for each data set for easy comparison of improved and inhibited growth, and the data show that the growth rates for conditions 200, 020, 110, and 011 are statistically high when compared to the negative control (no cytokine supplementation) and baseline 000 condition (
Figure 1).
Since the initially naïve cells will produce endogenous cytokines, the no cytokine control was used as a baseline for the effects of interleukin supplementation. The similarity of the 000 condition to the no cytokine control suggests a critical level of supplementation for initial proliferation that was not met by the low levels of the 000 condition. The condition keys represent the concentrations of each cytokine (IL-2, IL-7, IL-15) at the three different experimental levels, with 0, 1, and 2 in each position indicating the low, medium, and high concentrations, respectively (
Table 2).
2.2. Investigate the Interaction of the Three Cytokines in Promoting the Growth of CD4 + Naïve T Cells
Factorial analysis of variance on the combined data showed a significant interaction between all three cytokines and stronger interaction of IL-2 and IL-7 specifically (
Table 3). All three of these cytokines signal through the common γ chain and have been shown independently to differentially regulate the proliferation of T cell subsets. The interaction of IL-2 and IL-7 is also present and significant in three of the four data sets alone, supporting previous findings of the importance and synergy of these cytokines for the proliferation and survival of naïve CD4
+ lymphocytes. Co-stimulation with IL-2 and IL-7 has been implicated in modulating the proliferative, apoptotic, and necrotic susceptibilities of naïve T cells [
4]. IL-7 alone can promote the survival of naïve CD4
+ T cells ex vivo, while the combination also increases their sensitivity to Fas-mediated cell death. We hypothesize that higher concentrations of these cytokines may allow the cell death mechanism to begin to dominate, while moderate concentrations allow for faster proliferation after Ag activation without triggering extensive cell death.
IL-15 has also been implicated in the proliferation and survival of T-cell populations, notably through its interaction with the IL-2 receptor [
18]. Our growth study suggests that moderate IL-15 concentrations can improve the seven-day growth rate from thaw over similar conditions with high IL-15 concentrations; this may be due to competitive binding of IL-15 with IL-2 through their common IL-2 receptor, with high IL-15 concentration reducing the proliferative impact of IL-2. These three cytokines are regulators of the relative amounts of T-cell subsets in a mixed T-cell population [
4], and therefore are capable of sensitizing cells to death-inducing pathways, or to proliferative pathways. In our study of Ag-activated CD4
+ cells, over-stimulation by IL-15 tended to reduce growth rates, while the cells were more tolerant to any level of IL-2 and IL-7 investigated in this study. High IL-2 and low IL-7 and IL-15 (condition 200) gave the most rapid expansion at the cost of overall viability, while the 011 and 110 conditions nearly as rapidly and had higher viabilities (viability data not shown).
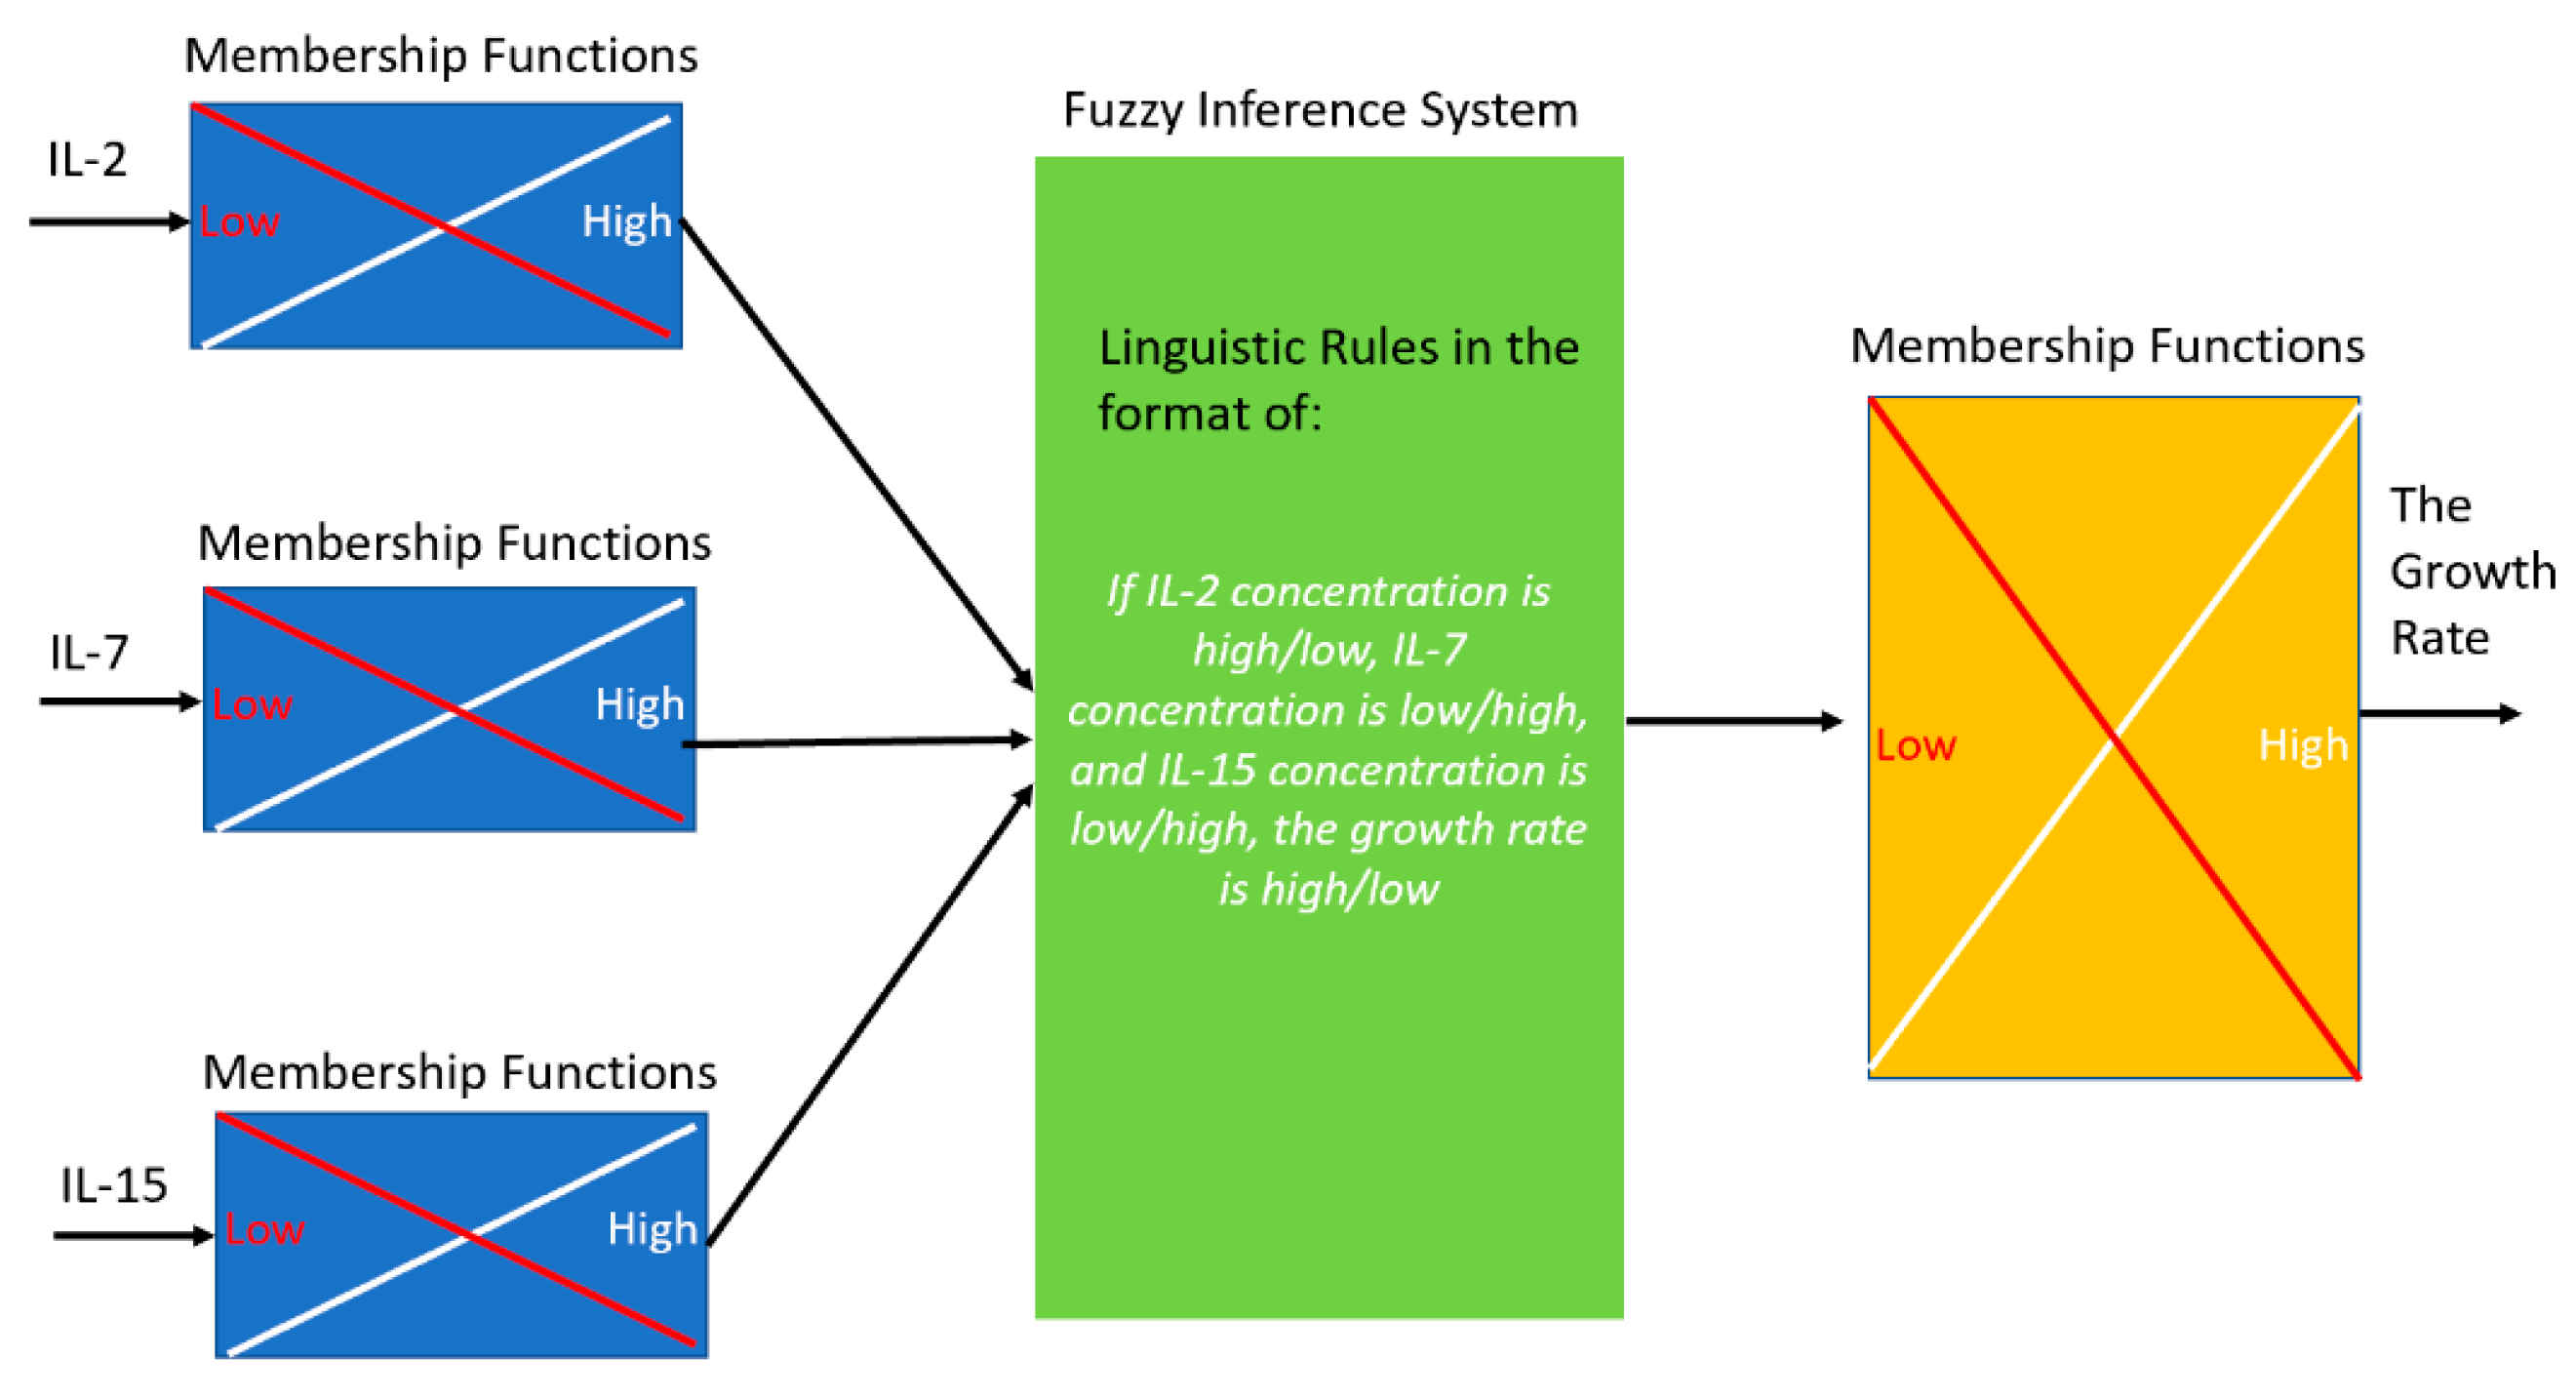
2.3. Develop a Fuzzy Model to Predict the Growth Rates of Activated CD4+ T Cells for Various Cytokine Combinations
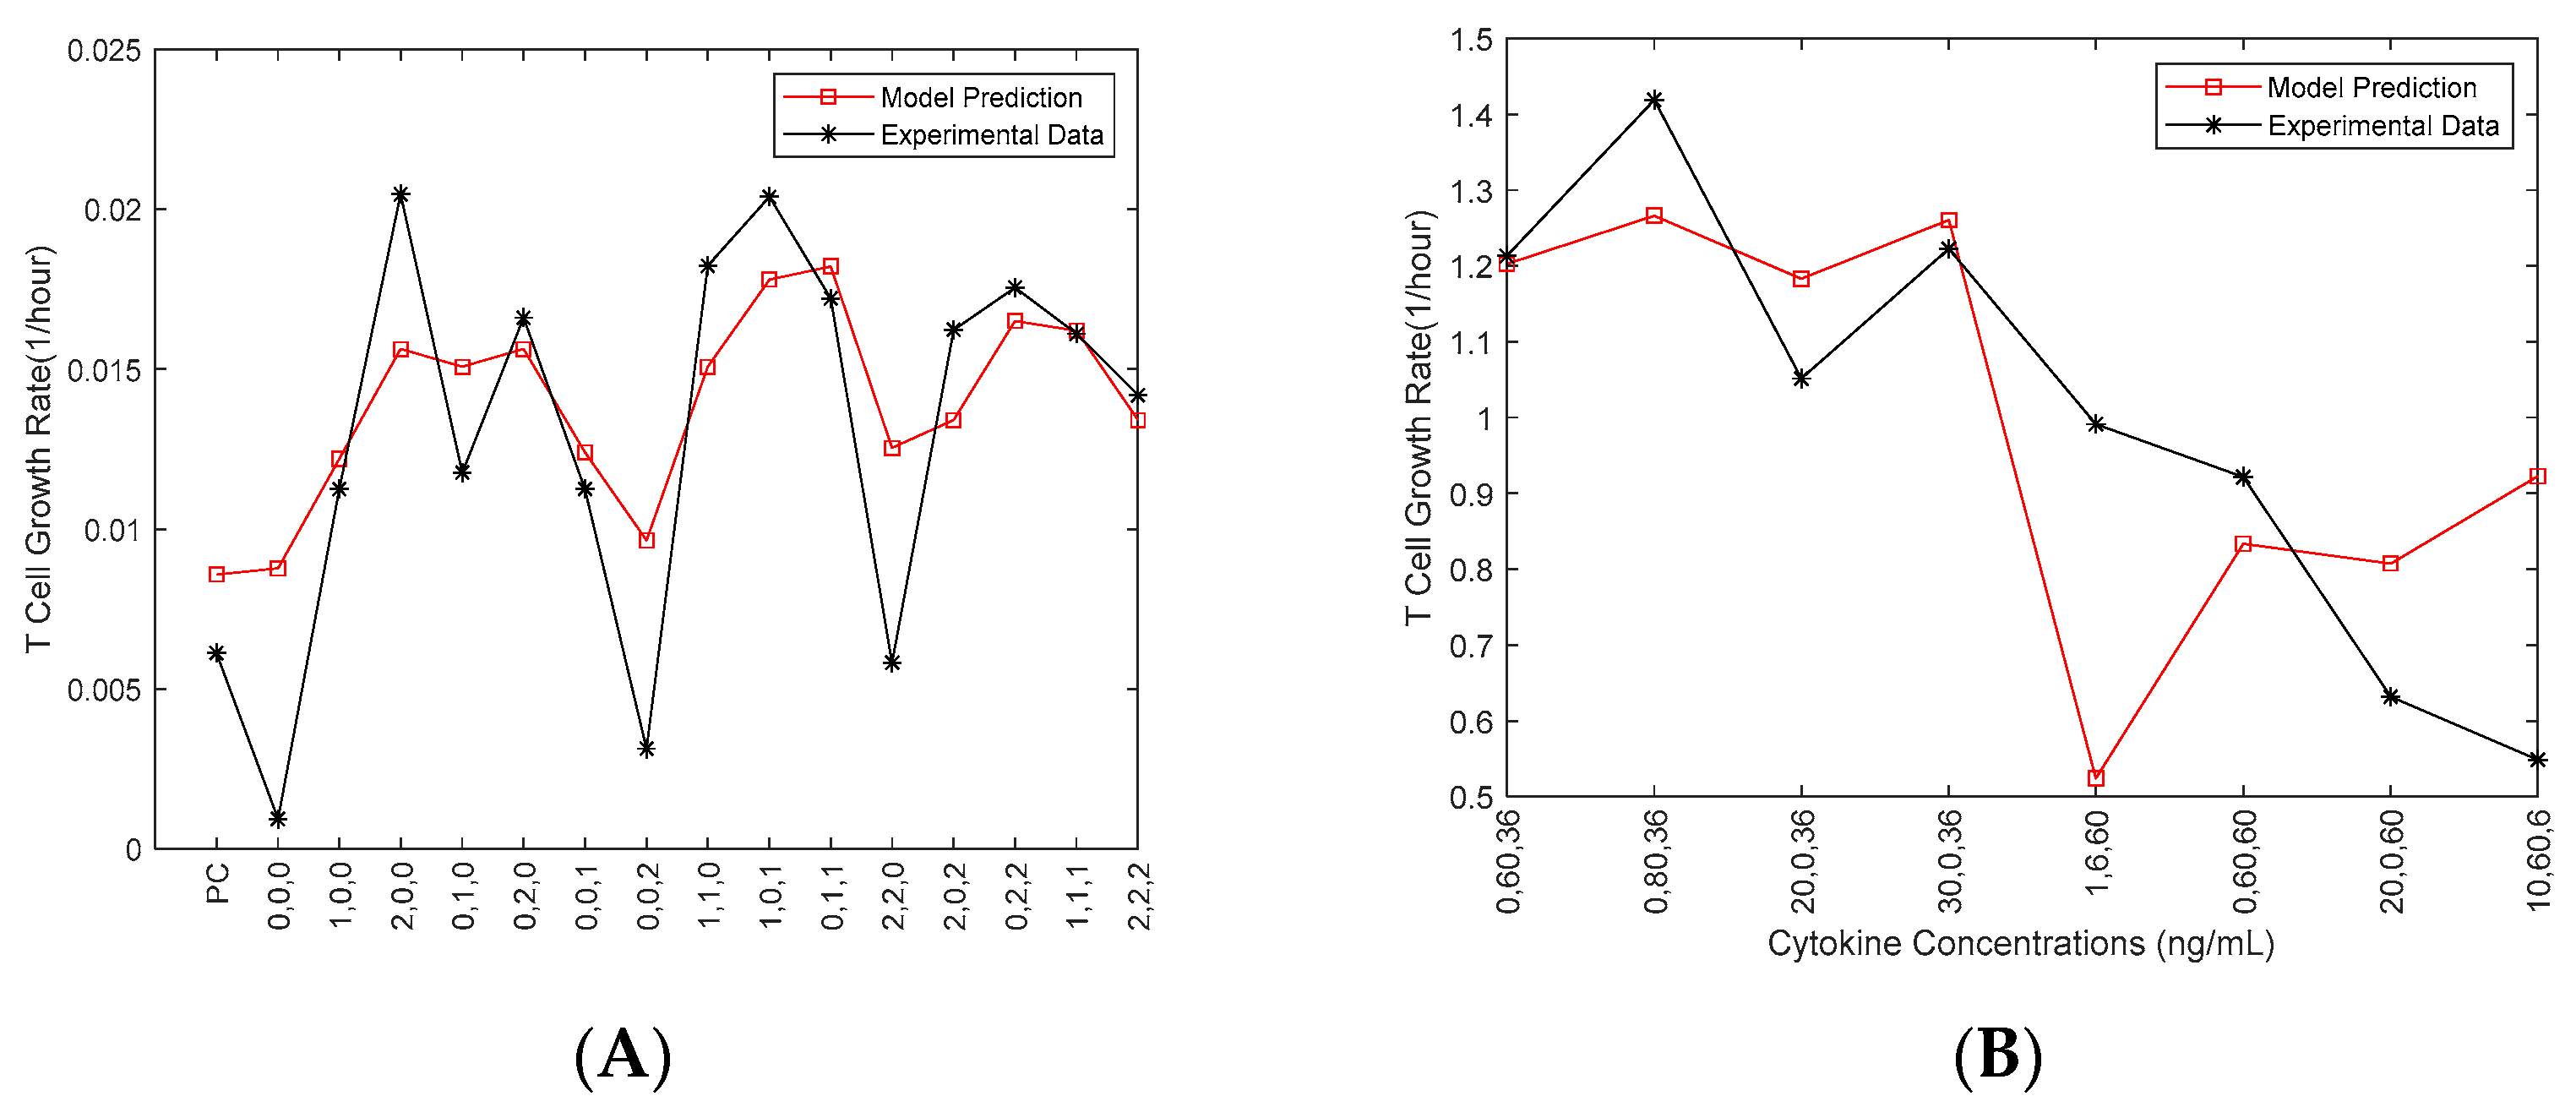
One experimental dataset (obtained in September 2019) was used to estimate the parameters in the Fuzzy model (
Figure 2A). The cytokine concentrations from another experimental dataset (obtained in October 2019) for eight new conditions were fed as the inputs of the developed Fuzzy model to predict the growth rate (
Figure 2B).
Those eight new conditions, which were not included in the 16 designed conditions, were selected from the fuzzy model to evaluate the model for the conditions returning high, moderate and low growth rates, respectively. Amid the inconsistencies in the above figure can be seen, the model was tested against a different set of conditions that had different levels of cytokines compared to the original data sets. The objective was to validate the spectrum of levels that could be seen in a singular test of the integrity of the 3-D scatter heat map. The model does show some consistency with the data in this case. There is truly only one data point that is inconsistent from the experimental data. The point of cytokine levels 1, 6, 60 ng/mL for IL-2, IL-7 and IL-15, respectively, most closely resembles the original condition 0,0,2, which in data set I was one of the lowest performing conditions (as seen in
Figure 2A). The data shown in
Figure 2B (i.e., the October 2019 data) was not included in
Figure 1. Only one of the other three datasets (i.e., September 2019 data) was used in Fuzzy modeling (
Figure 2A), as we aimed to develop the model to validate our choice of the cytokine concentrations and investigate the interaction of the three cytokines before more experiments were conducted.
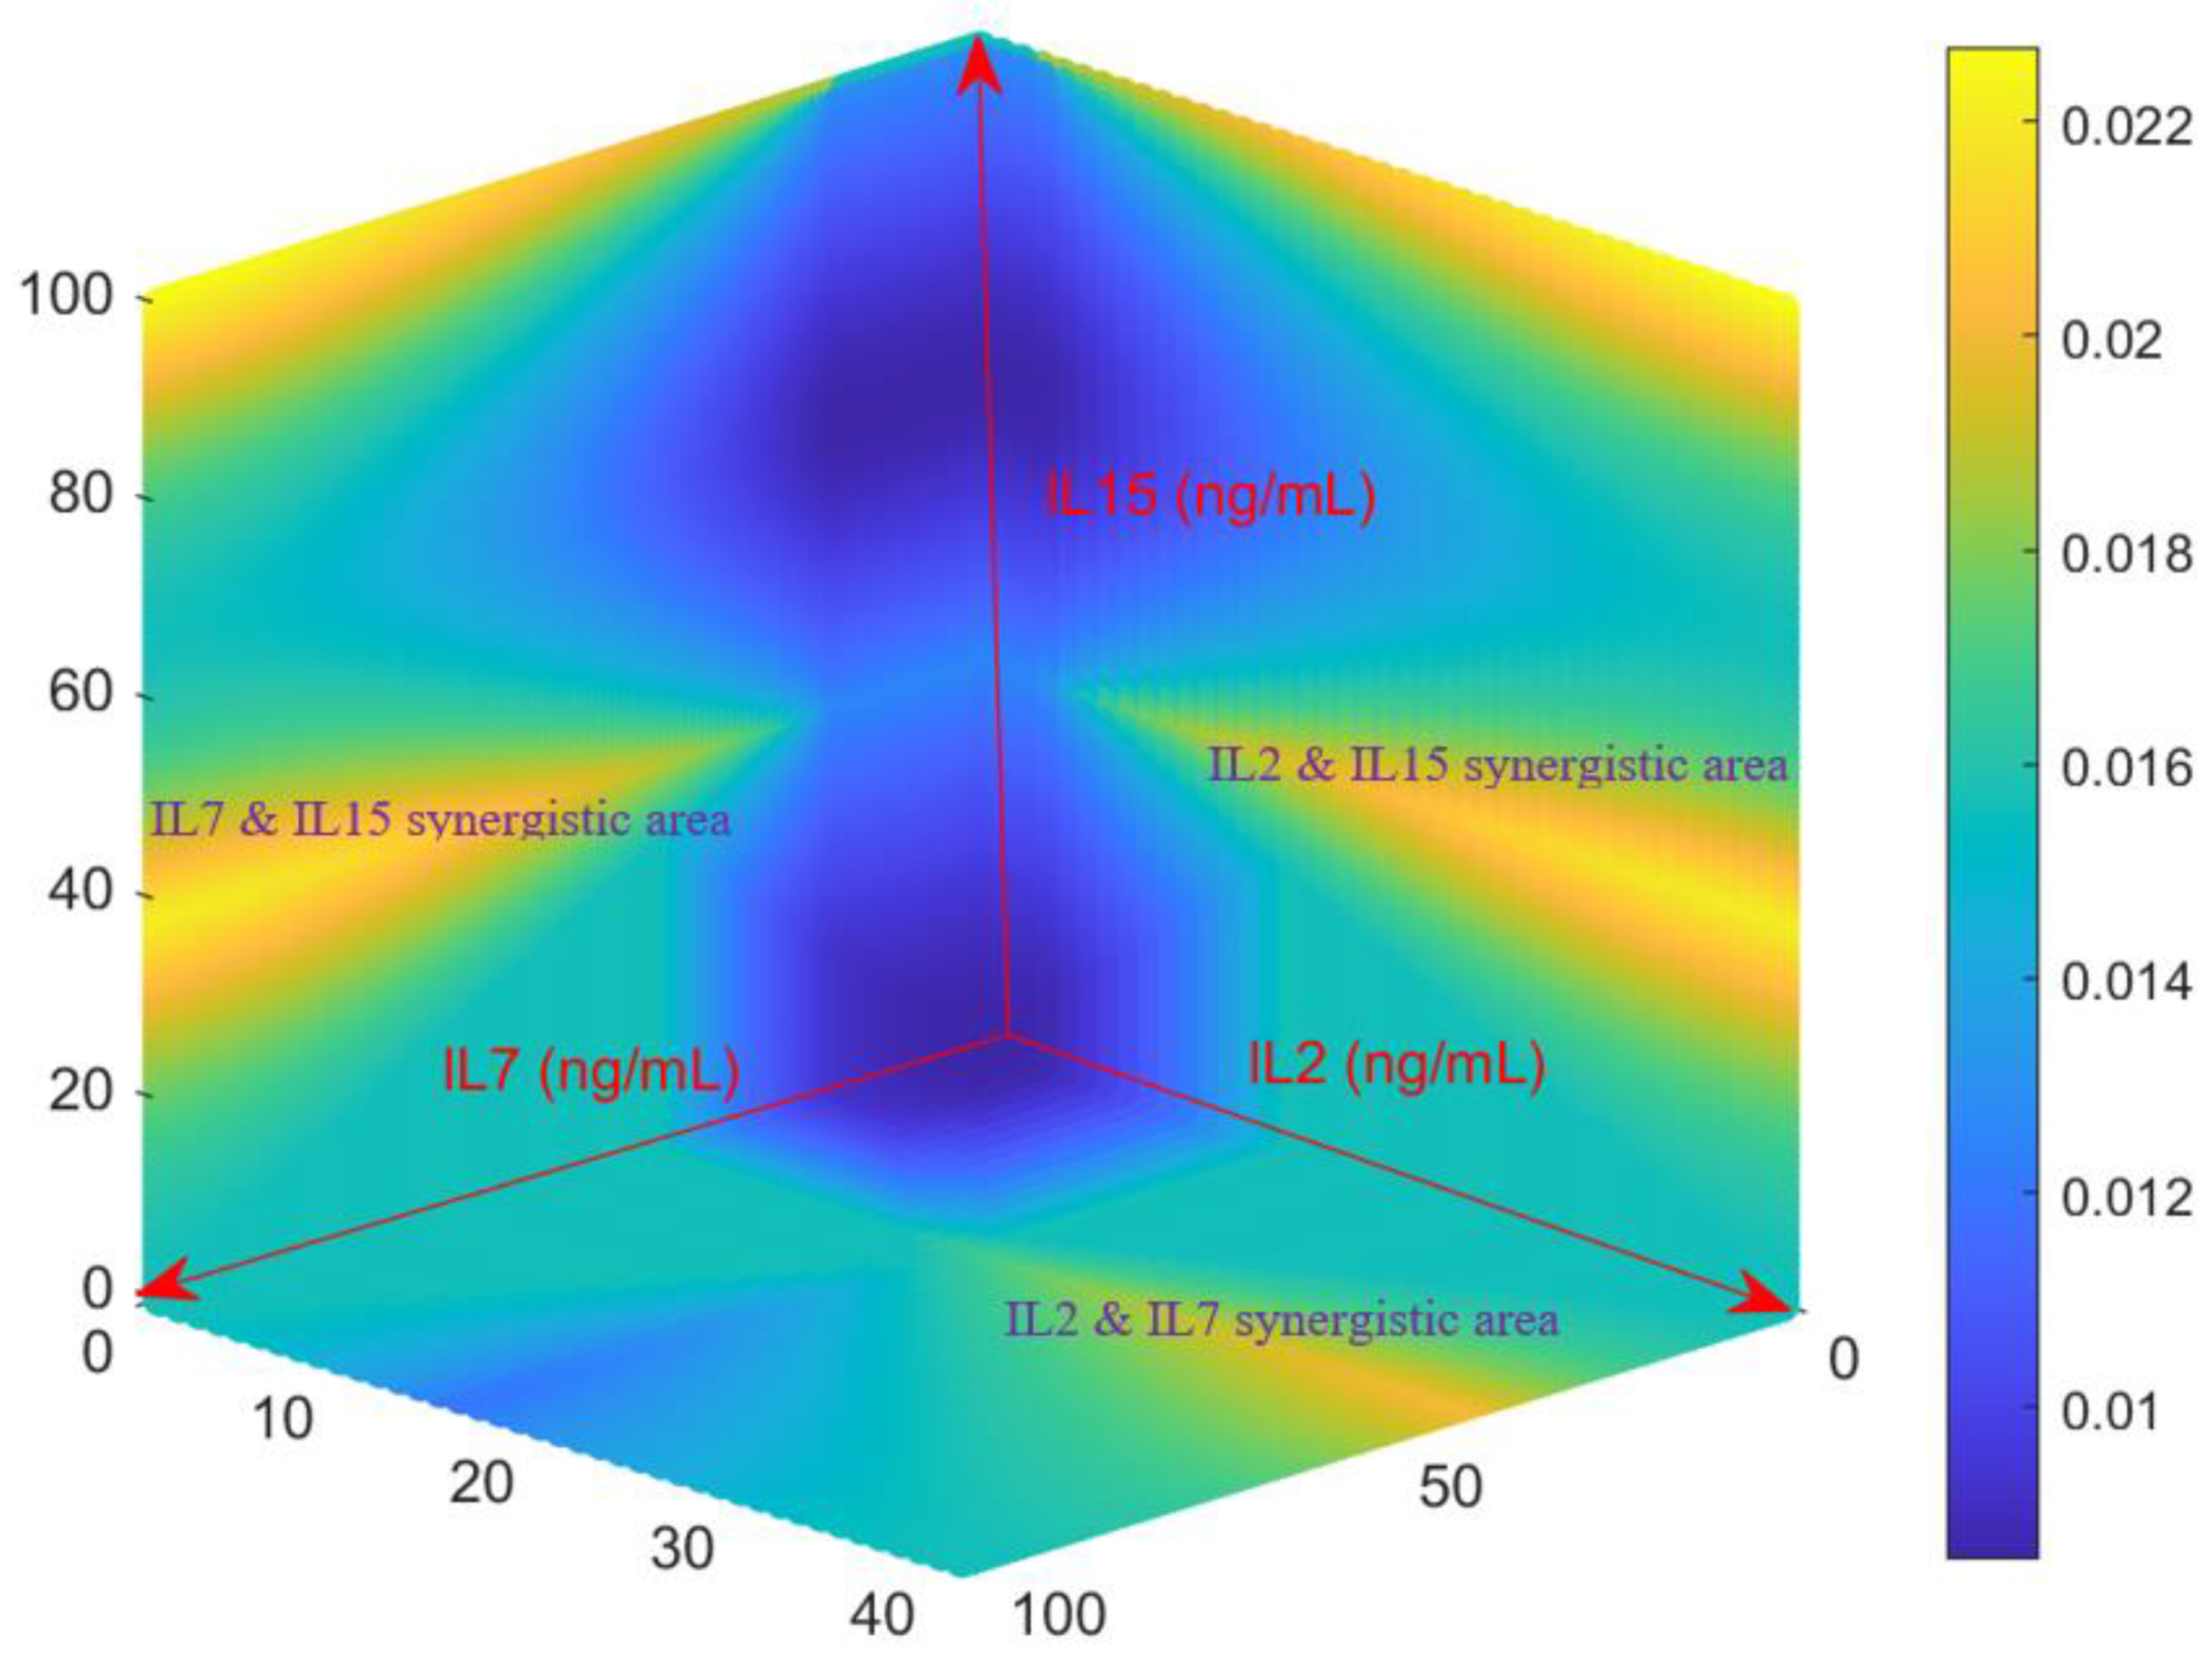
Since the developed Fuzzy model has been validated by experimental data, it is thus of value to predict the growth rates of activated CD4
+ T cell growth rates for various combination of IL-2, IL-7 and IL-15. A 3-D surface heat map was generated in
Figure 3 from the Fuzzy model by evaluating all possible combinations of IL-2 (0–40 ng/mL), IL-7 (0–100 ng/mL), and IL-15 (0–100 ng/mL). Consistent with what was observed in
Section 2.1 and
Section 2.2, the Fuzzy model predicts that moderate concentrations of the three cytokines can return acceptable growth rates of activated CD4
+ T cells (as shown in the middle left and right of the heat map). As implied by the data shown in
Figure 2A, the Fuzzy model returns high growth rate for high concentrations of the cocktails IL-7~IL-15 (the left top of
Figure 3) and IL-2~IL-15 (the right top of
Figure 3).
Figure 3 also indicates strong synergistic effect between IL-7 and IL-15 and between IL-2 and IL-15. Additional synergistic effect was also observed for IL-2 and IL-7 in
Figure 3. This is also consistent with the result shown in the previous section.
2.4. Investigate Genes Indicating the Purtabation in the Metabolism of Activated CD4+ T Cells Stimulated by Individual Cytokines
The expression variation of genes that are involved in positive proliferation and negative proliferation were identified in
Table 4 using the program Metacore, along with overlapping the up/down-regulated genes with several databases (such as Biological Magnetic Resonance Data Bank and Mammalian Metabolic Enzyme Database). One of the more important aspects we monitored was determining what metabolic pathways were persistently upregulated with high-magnitude fold-increase from baseline genes represented. Using genes from the glycolysis, inositol phosphate, glutamine metabolism, PI3K-AKT, mTOR, Myc, TCA cycle, protein synthesis and glycerophospholipid pathways that are well-known for their important roles in regulating cell metabolism, we analyzed the genes which have ties to these pathways, specifically which are up and down-regulated by each of IL-2, IL-7 and IL-15.
Genes associated with IL-2 stimulation resulting in gene upregulation from the aforementioned metabolic gene pathways include genes associated with the metabolism of lipids, carbohydrates and proteins, including
APOE,
PFKFB1,
IGFBP2,
RPS9 and
PGAM4. Consequently, one gene downregulated via IL-2 stimulation was
CHST1, involved in amino acid metabolism. Genes upregulated via IL-7 stimulation include genes involved in carbohydrate, lipid, protein and amino acid metabolism as well:
APOE,
PFKFB1,
CES3,
IGFBP2,
DMGDH and
KLK2. Genes associated with IL-7 stimulation resulting in downregulation include
CHST13,
CHST1,
MGIL, and
ACSM1. Finally genes associated with IL-15 upregulation are focused in mostly in lipid metabolism:
ACHE,
APOE,
RDH5,
PRKAA2,
CDS1, and
DMGDH. Those genes downregulated by IL-15 include
MRM1,
ENPP and
MT5C1A. Key genes from these lists are compiled in
Table 4.
In order to elucidate the functional differences between cytokines and their response to cell growth, we next analyzed significantly changed transcripts associated with proliferation related ontology vs. the control condition (
Supplementary Figure S1). All cytokines shared commonalities via induction of HILPDA, a gene which enhances cell growth via lipid metabolism and potent downregulation of SFRP1, a gene involved in delay of S phase. Detailed analysis identified a common set of factors closely shared between IL-2 and IL-7. These shared genes revealed upregulation to PGDFB, JAK/STAT (EPOR), and Beta-catenin (PTPRU) related signaling as well as dramatic negative changes to angiogenic factors (VEGFC, FGF18, FGF2). Conversely, IL-17 resulted in a dramatic increase of TGFB2, downregulation of ERK signaling (GAREM2), and resulted in a decrease in expression of transcriptional programmer, CHD5.
2.5. Study Genes Indicating the Purtabation in the Signal Transduction of Activated CD4+ T Cells Stimulated by Individual Cytokines
The genes with ± 50% change in their expression levels when compared to the control condition were identified via the approaches shown in the Methods section. Since hundreds of genes were up/down-regulated by each of IL-2, IL-7 and IL-15, principal component analysis was implemented to project those genes according to their expression time-profiles onto a two-dimensional space. The outlier genes were analyzed to identify the reactions unique to each cytokine, while the bulk genes were further analyzed by the program Metacore to identify the gene-regulatory networks induced by each of the three cytokines.
2.5.1. Outlier Gene Analysis
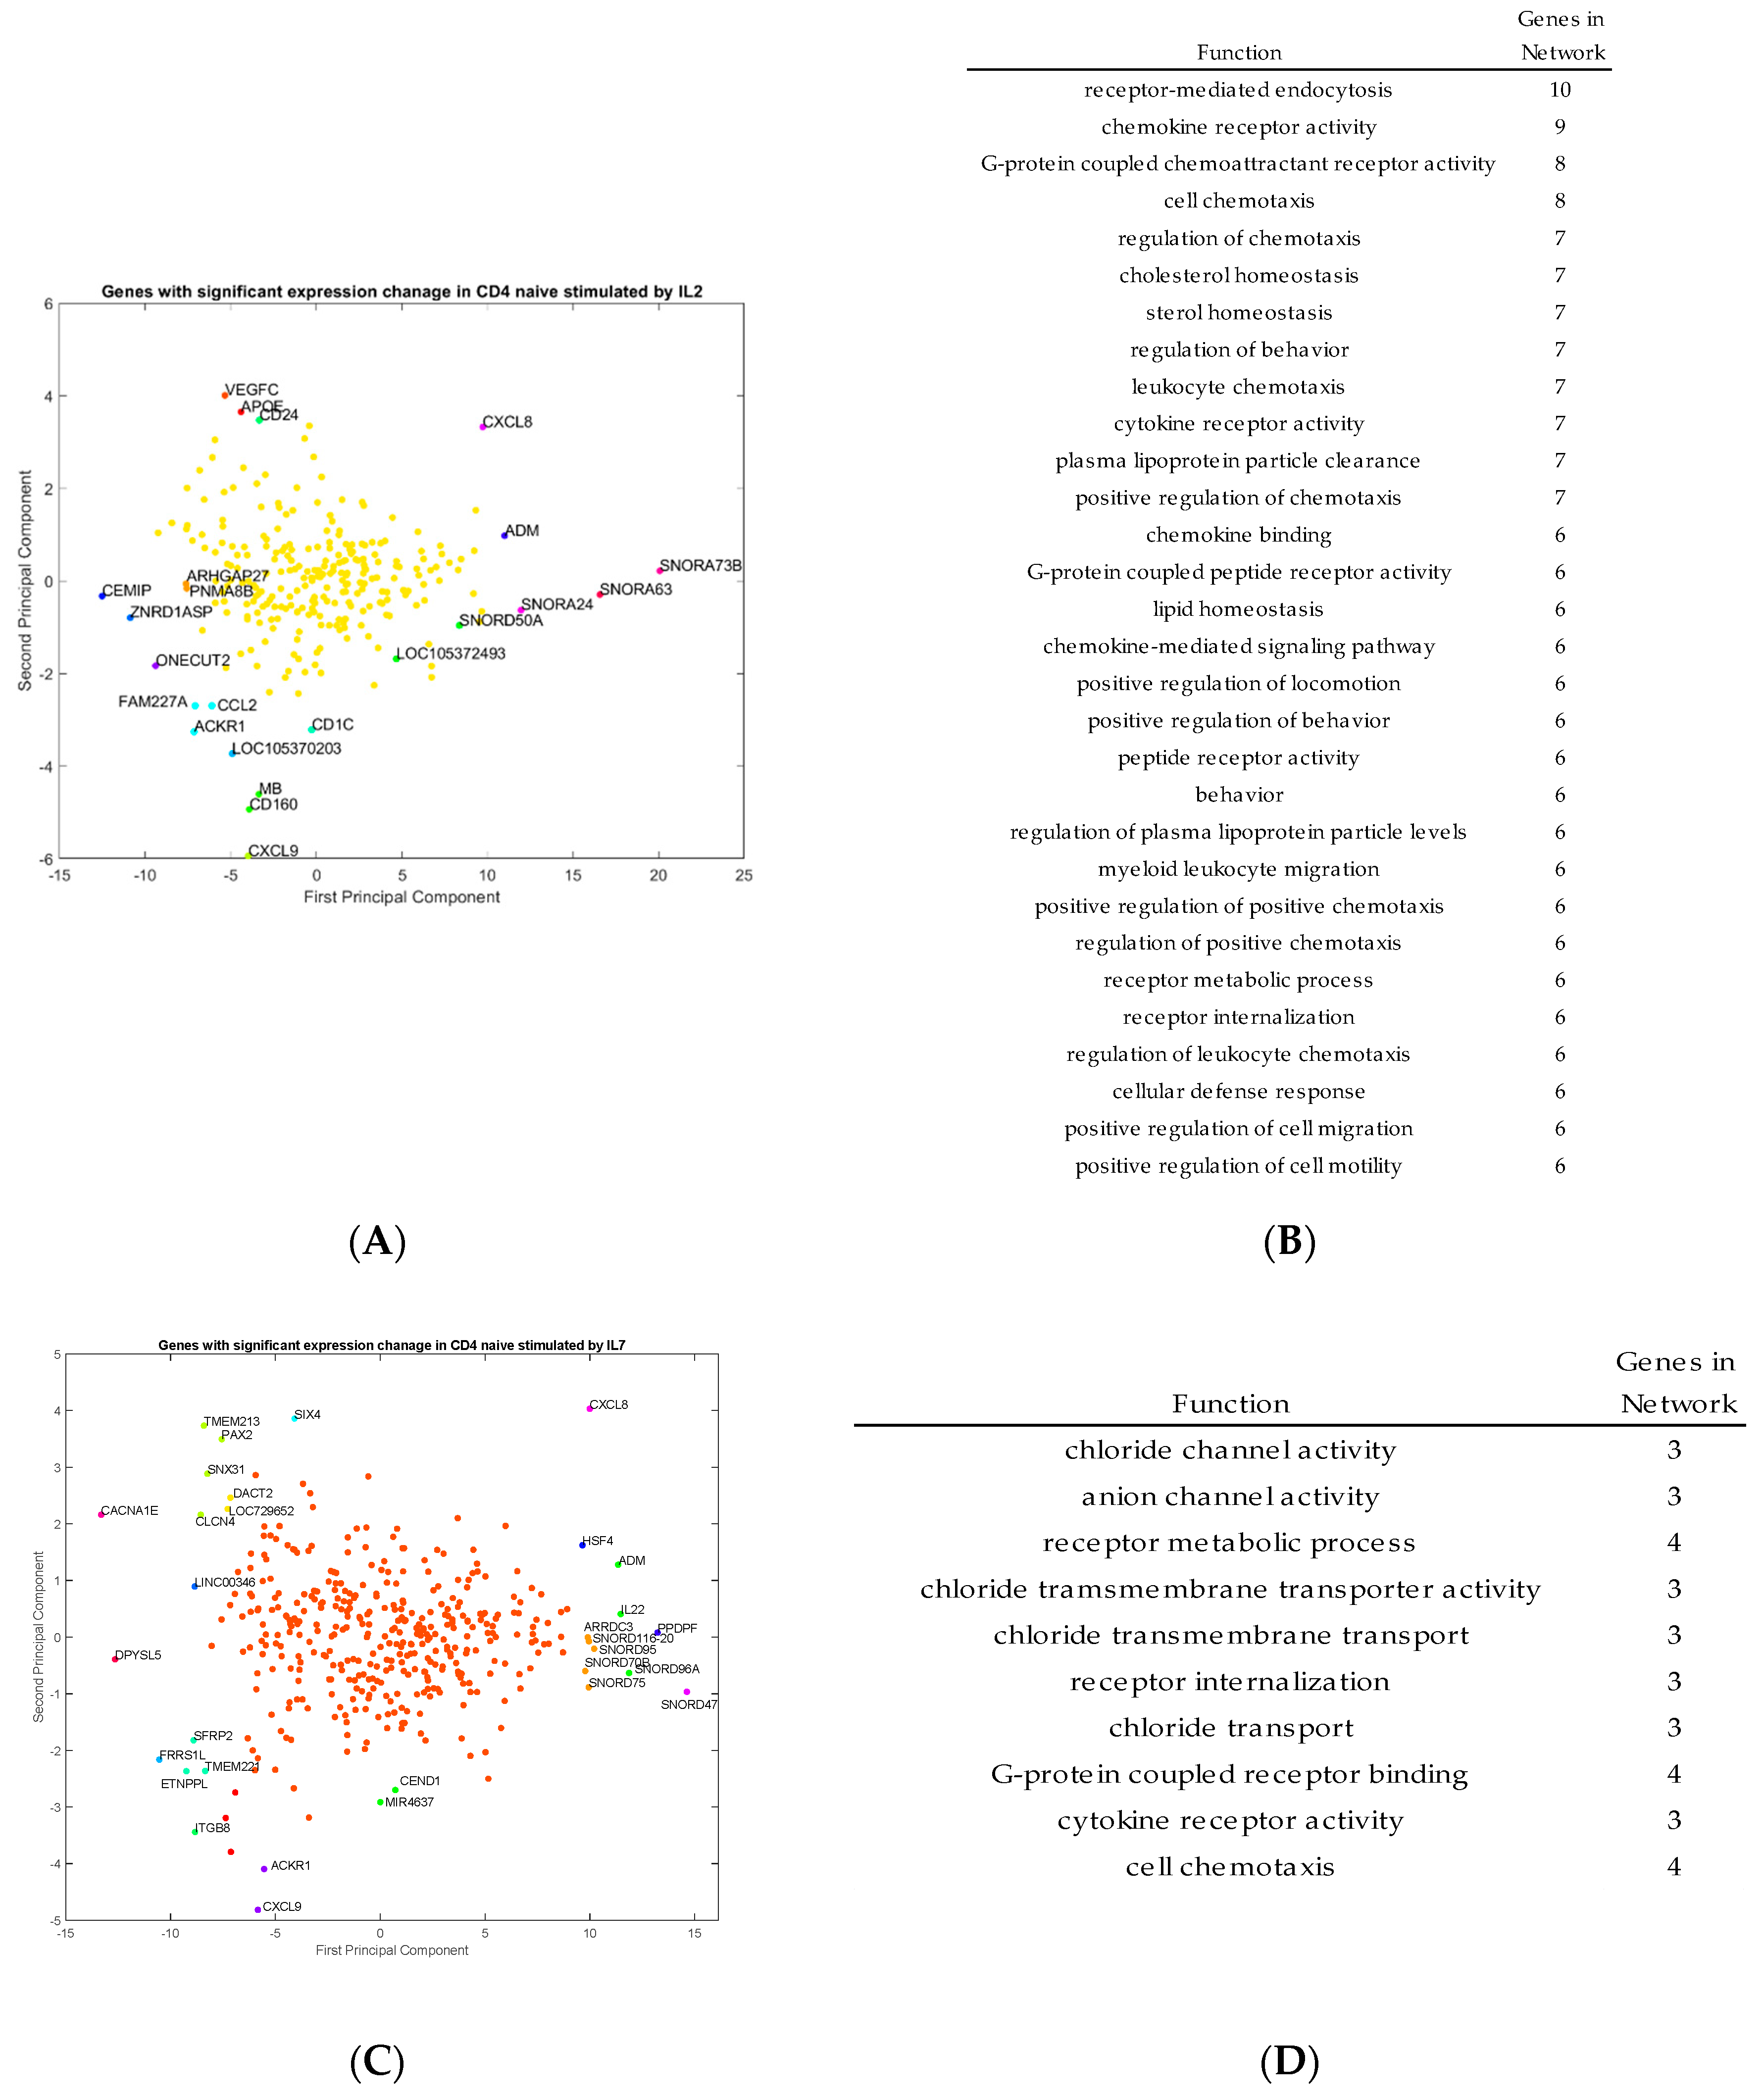
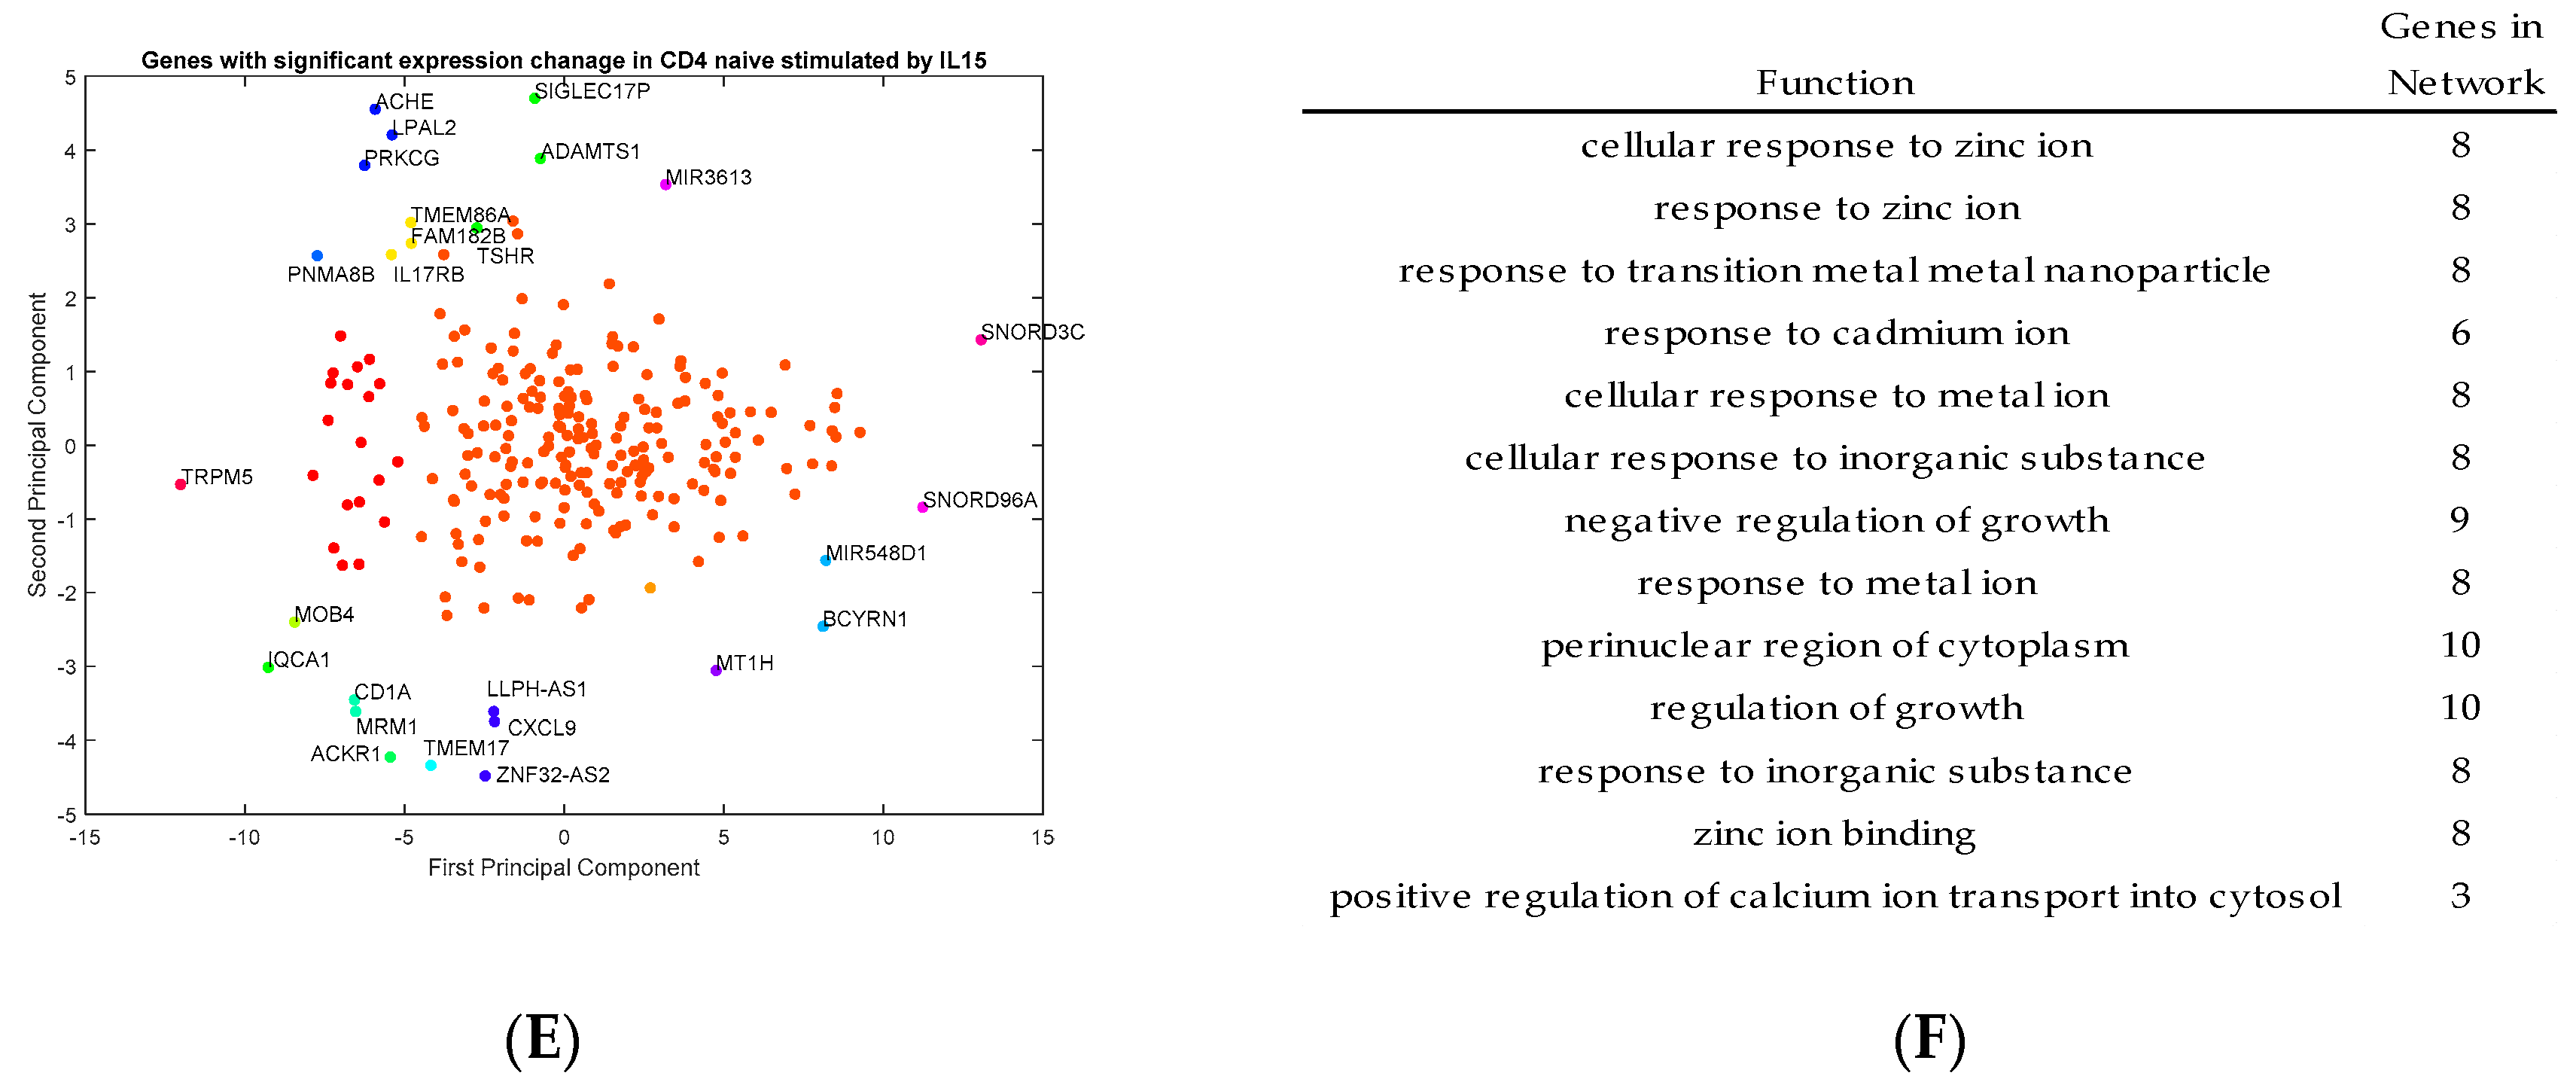
Outlier genes were identified by principal component analysis and clustering from the transcriptomic data for activated CD4
+ T cells stimulated by IL-2, IL-7, and IL-15, respectively (
Figure 4A,C,E). The functions of those outlier genes were identified from the program GeneMANIA and listed in
Figure 4B,D,F. In
Figure 4B, the gene functions listed represent unique outlier genes from the PCA study of genes with significant expression change via stimulation by IL-2. The gene functions of the genes stimulated by IL-2 seem to be related to cell and leukocyte chemotaxis, chemokine receptor activity, cellular defense response and cell motility. In
Figure 4D, the gene functions listed based on the outlier genes from IL-7 stimulation, which include genes involved in chloride transport, cell chemotaxis, chloride transmembrane activity, and cytokine receptor activity. Finally, in
Figure 4F, the gene functions listed based on the outlier genes from IL-15 stimulation include genes with functions, including cell growth, zinc ion responses, cellular response to metal ions, and regulation of calcium ion transport into the cell. These gene functions are consistent with the types of genes which are outliers in the PCA study.
As shown in
Figure 4A,B, the genes with respect to IL-2 stimulation include:
CCL2,
APOE,
MB,
CXCL9,
IL8, and
ACKR1. In particular,
CCL2,
CXCL9 and
CXCL8/IL8 are all markers of proliferating cells. Some of the standout genes include
MB (myoglobin), as well as
ACKR1, which is a chemokine receptor. It seems that most genes stimulated by IL-2 appear to be associated with inflammation processes, but also growth pathways and triggers for proliferation. Outlier genes associated with IL-7 include:
CXCL8,
CXCL9,
IL-22,
CACNA1E,
ADM,
SFRP2 and
ITGB8. Although there are some genes in this list which are involved in inflammation and are directing agents, there are also genes associated heavily with ion transport from the cell with some trans-membrane proteins and channel proteins. Outlier genes associated with IL-15 include many metal-ion associated proteins like
MT1H, and also signaling for other cytokines like
IL17RB.
While
Figure 4 shows the genes regulated by individual cytokines, these outlier genes are commonly involved in T-cell receptor (TCR), a complex of integral membrane proteins on the surface of T cells that takes part in the activation of T-cells in response to an antigen. Genes from pathway analysis through NCI illustrate the complexity of TCR signaling, which leads to proliferation and differentiation of activated CD4
+ T cells [
20]. In particular, the outlier genes shown in
Figure 4, especially those regulated by IL-2 and IL-7, were found to be related to related to TCR signaling, as shown in
Table 5. It is known that TCR signaling is an important step in activation of activated T cells in order to induce the proliferation and differentiation pathways [
20]. The genes being produced in
Table 5 as identified in the PCA are relevant as they are connected to the genes associated with direct TCR signaling. For example, CXCL8 is an important chemokine as a directing agent, involved in chemotaxis [
21]. VEGFC is a growth factor connected to the MAPK and PI3K-AKT signaling pathways, which can lead to proliferation of T cells [
22]. Unfortunately, it is also associated with tumor immune escape in certain cancers [
22]. In another article involving VEGFC signaling, blocking VEGFC inhibits infiltration of CD4
+ T cells, but does not affect T cell cytokine responses in the epithelium of rats burdened with obliterative airway disease (OAD), which could suggest the ability of VEGFC to act as a marker or directing agent for CD4
+ T cells [
23].
In addition to the outlier genes, the bulk genes not specific in
Figure 4 are further investigated to derive the gene regulatory networks stimulated by each of the three cytokines.
2.5.2. Bulk Gene Analysis
Next, in order to further illustrate the effects of these cytokines on alternative pathways, we utilized the Metacore program to the bulk genes shown in
Figure 4 to calculate the most statistically affected genetic networks either shared (
Supplementary Figure S2A) or uniquely changed (
Supplementary Figure S2B) between conditions. Common amongst all was a strong angiogenic response, in addition to changes to cell morphology, adhesive properties, as well as EMT remodeling. Alternatively, the differentially expressed networks revealed a clustering of common components to IL-2 and IL-7 stimulation but not IL-15. This included the anti-apoptotic response, JAK/STAT induction, and alteration to chromatin. Conversely, these changes were largely absent from IL-15 signaling.
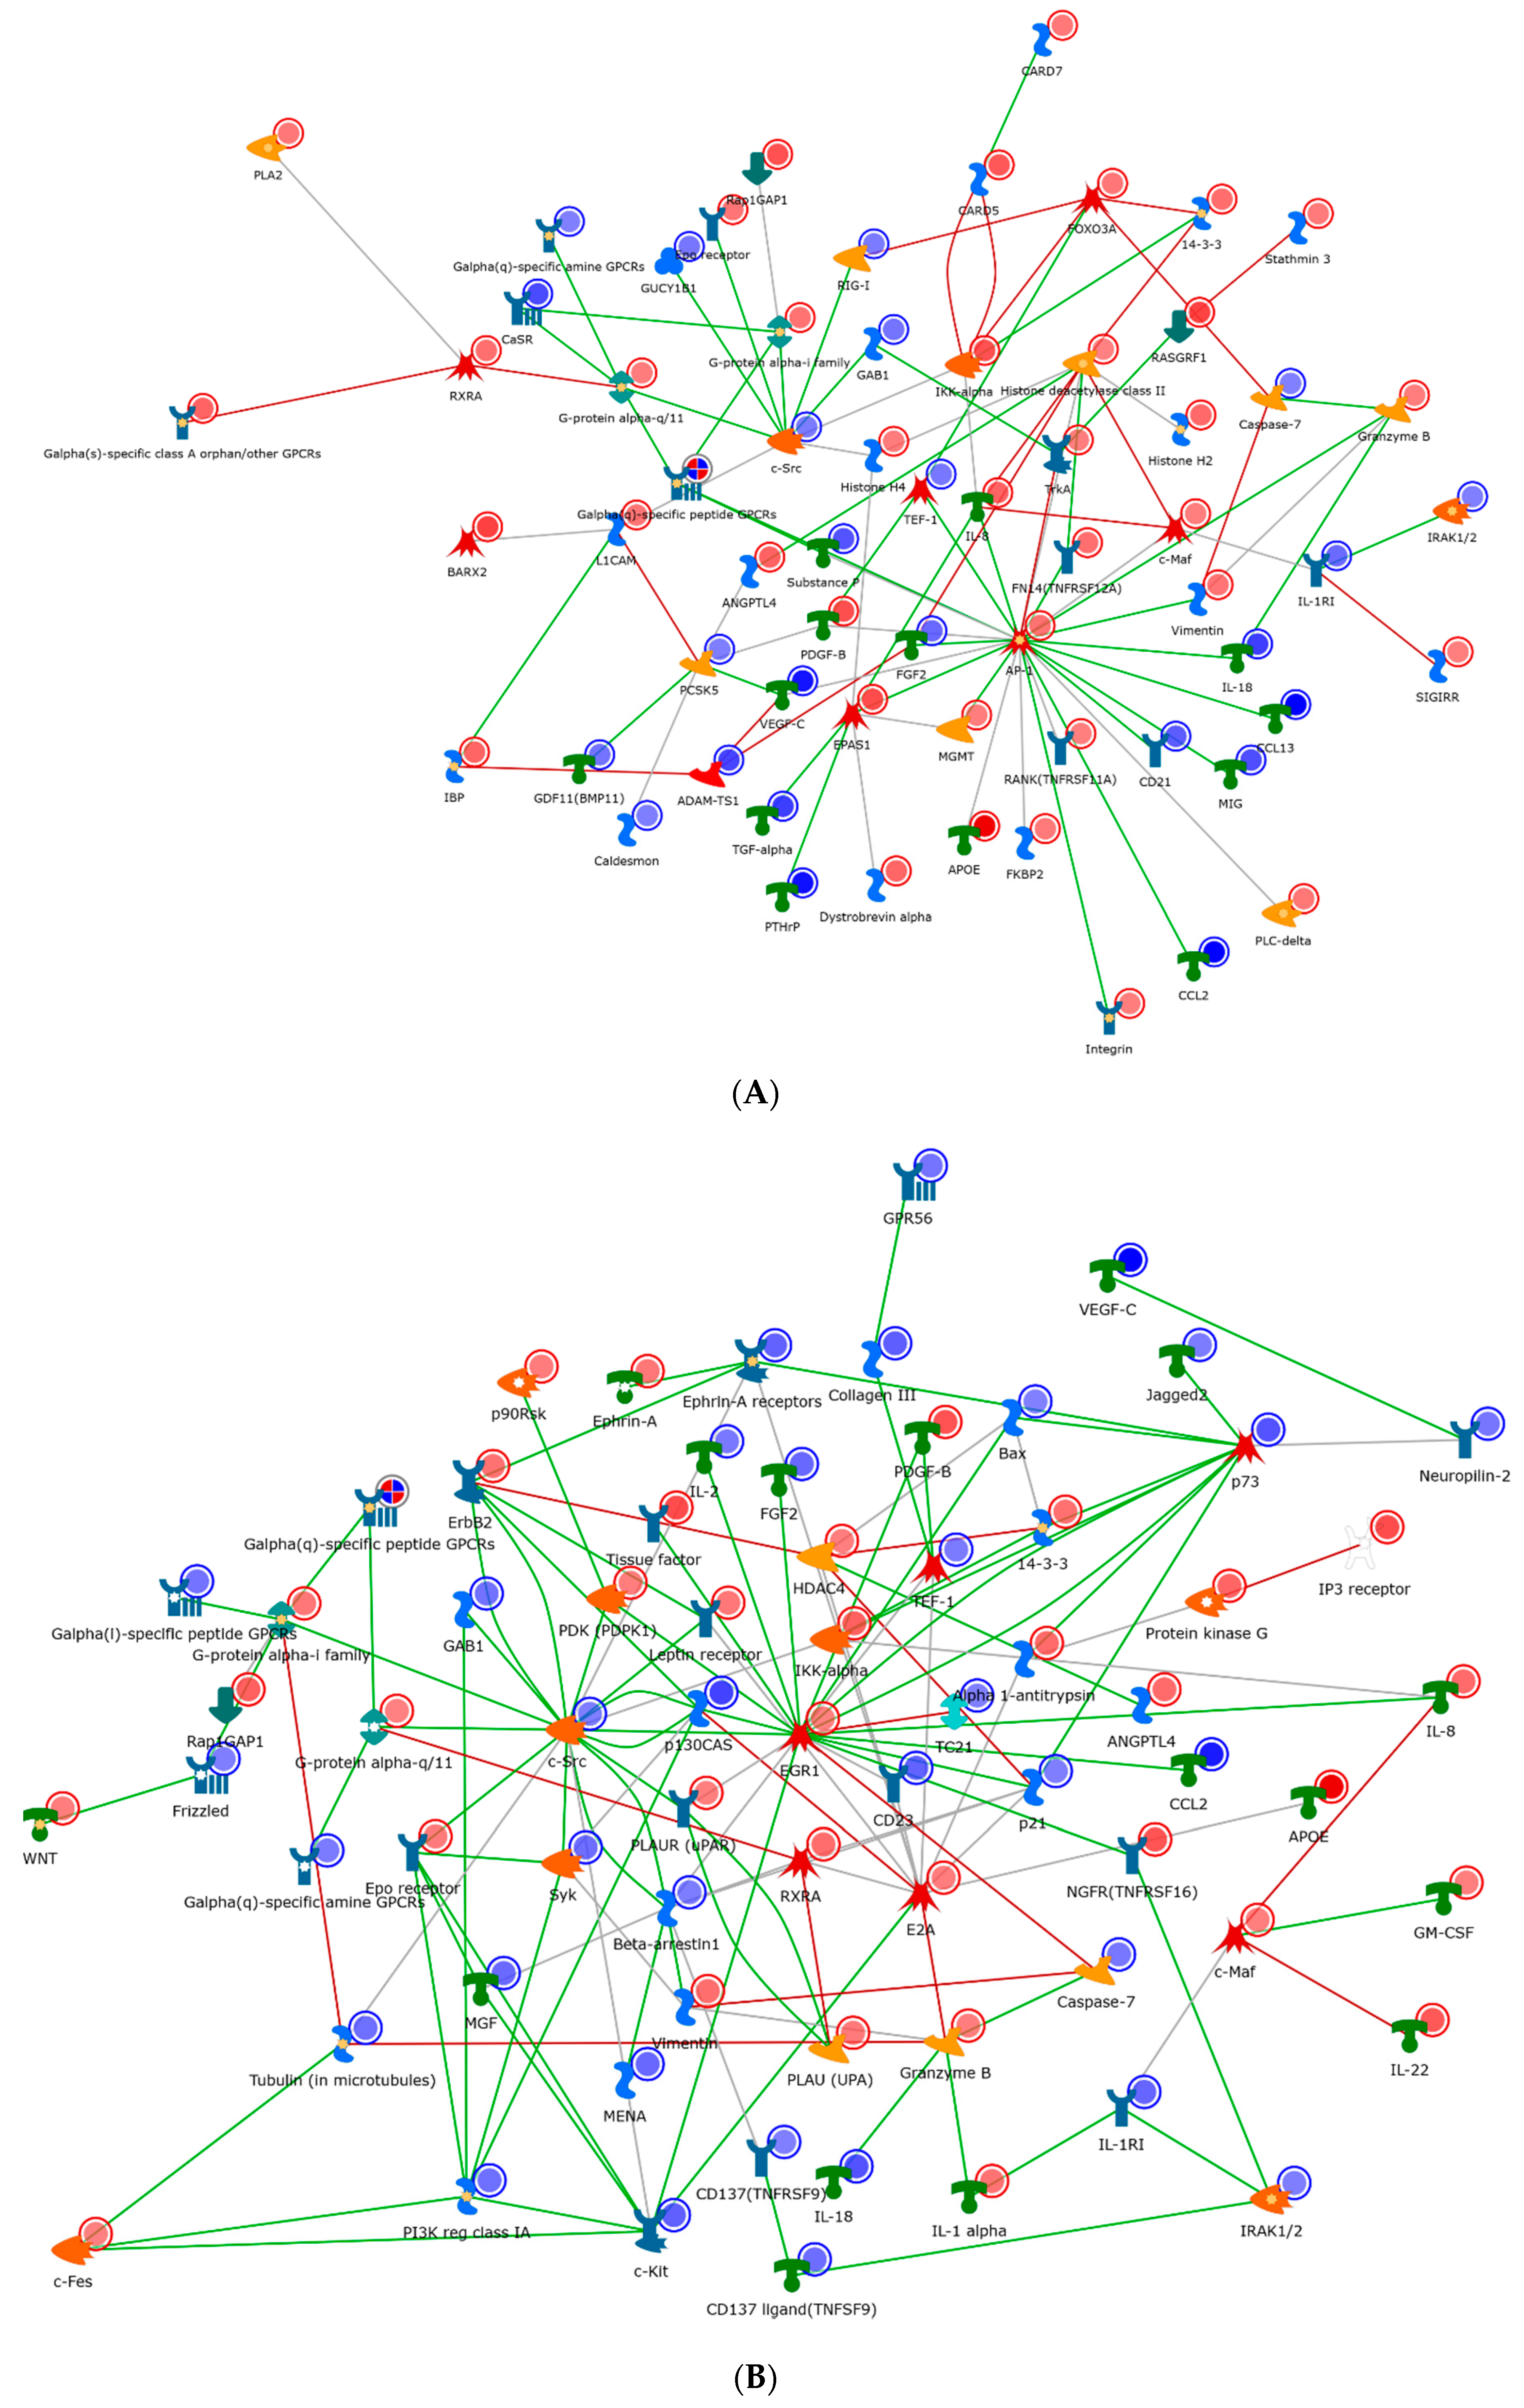
In order to further describe these networks, we then generated process networks from the differentially expressed genes and visualized only the nodes demonstrating interconnection (
Figure 5). The IL-2 network (
Figure 5A) demonstrated a network clustered through the oncogene Src, general GPCR signaling, and the transcription factor AP-1. Change in chromatin modelling was noted via a variety of histone deacetylases. Several other transcription factors and molecules which are involved in IL-2 metabolism are also shown in
Figure 6A. For example, c-Jun is an example of a transcription factor subunit, marked by the AP-1 transcription factor, which is known to be involved in proliferation, differentiation, apoptosis and survival. HDAC4 and HDAC5 are histone deacetylases, which act as transcriptional repressors. Finally, c-SRC is a tyrosine protein kinase involved in cell-growth.
As compared to IL-2, the IL-7 network (
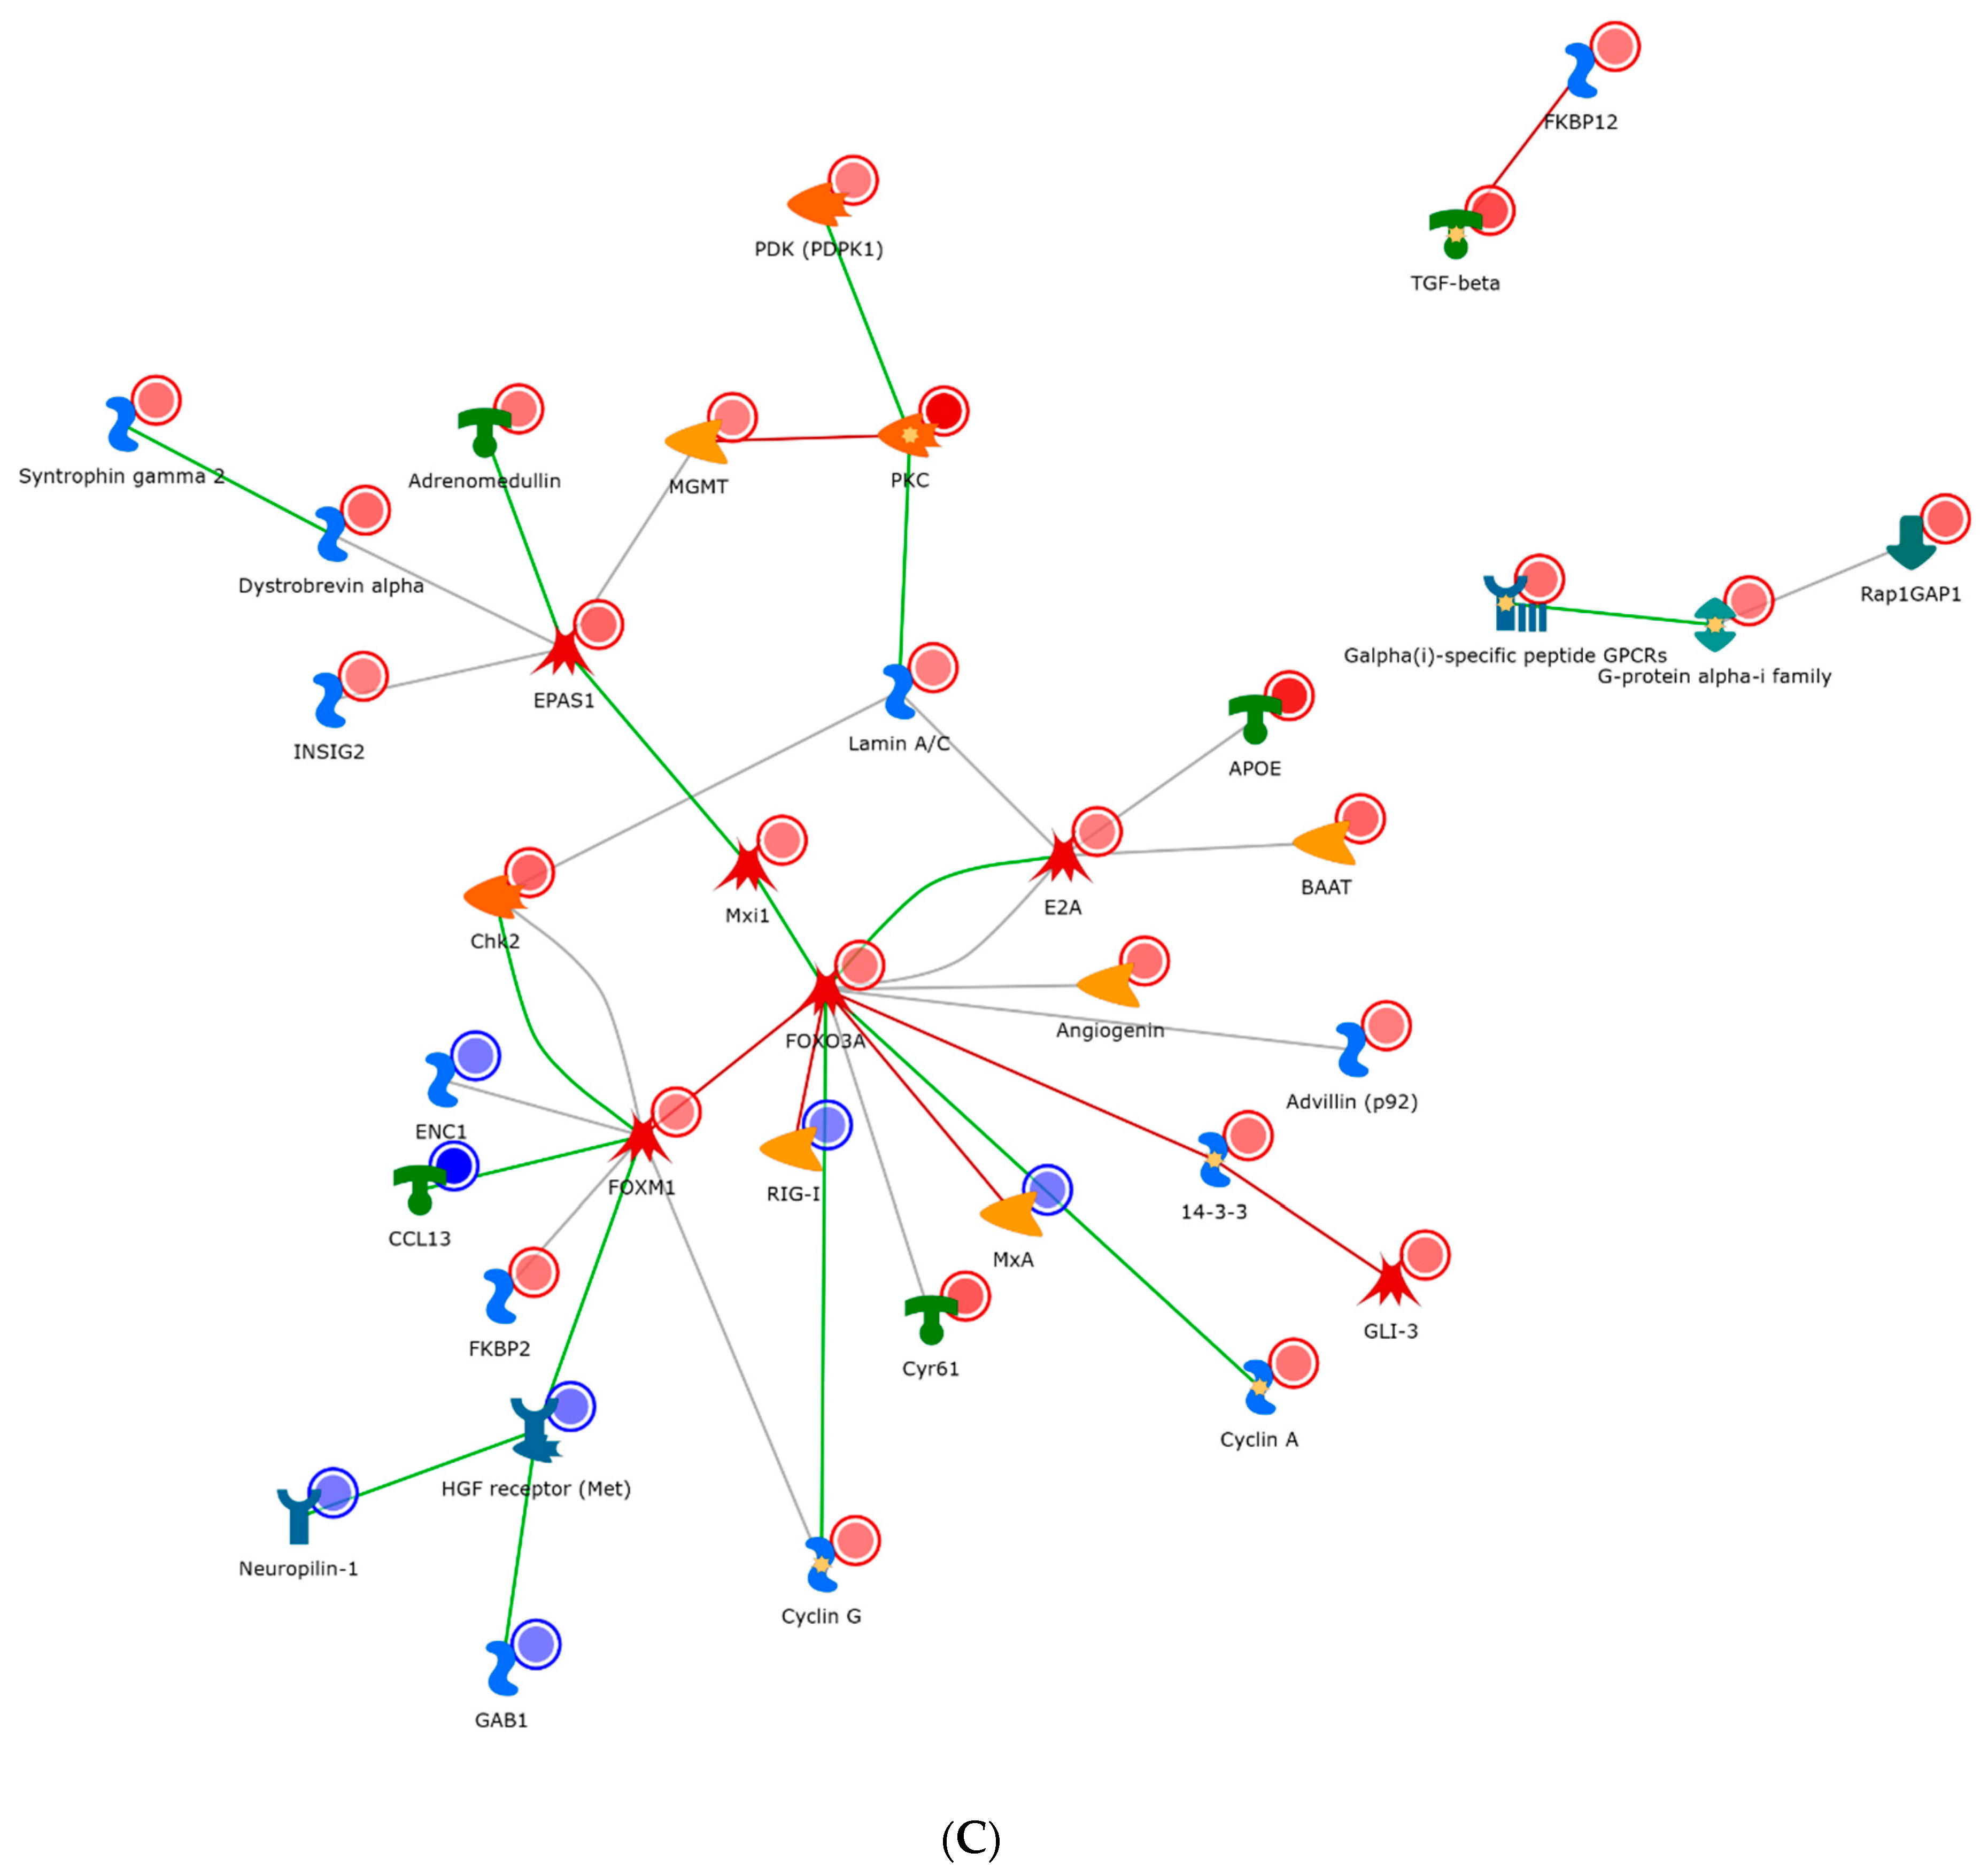
Figure 5B) shared many similar factors, but included and expanded repertoire of nodes, specifically around the transcriptional regulators (EGR1, P73, and E2A). These regulators appeared to have obvious effects within the cell cycle (P21). In particular, EGR1 is a zinc finger protein involved in transcriptional regulation and P73 is a tumor suppressor protein associated with P53. Conversely, the IL-15 network appeared the most dissimilar to IL-2/7 and radiated through a hub of the transcription factors FOXM1 and EPAS1 and cellular morphogenesis (
Figure 5C). Specifically, FOXM1 is a transcription factor associated with cell proliferation, and EPAS1 is involved in the induction of genes regulated by oxygen. In addition to FOXM1 and EPAS1, other transcription factors are also found important in
Figure 5, such as FOXO3A (a transcription factor associated with apoptosis) and PKC (a transcription factor involved in cell adhesion).
2.6. Identify Genes Whose Expression Profiles Were Closely Correlated with the Growth Profiles of Activated CD4+ T Cells
The correlation between genes whose growth time profile matched the growth rate delivered for the respective experiment condition were conducted to identify the genes that may be of clinical value for genetic engineering of T cells. The T cell growth data and transcriptomic time profile data were taken for days 4, 5 and 7 to determine whether there were changes to the transcriptome over the course of the experiment and to compare to the growth profiles of activated CD4+ T cells. The genes showing the most similar time dynamics as the growth rate are found for each of the three cytokines. Up-regulating these genes may be helpful to promote the growth of activated CD4+ T cells. Genes with the most similar dynamics as compared to the growth rate of the cell during IL-2 stimulation were analyzed. The same approach was taken for genes upregulated and matching the profile of growth with IL-7 stimulation, and subsequently the same completed with genes upregulated by IL-15.
Genes whose growth profiles most similarly match the T cell growth when stimulated by IL-2 include genes such as: TMEM74B and TTC36, a transmembrane protein and a tumor suppressor. IL-2 is known to be involved in many of the signaling pathways involved in growth and proliferation. Parallel to growth pathways, apoptosis is closely tied. It is not shocking, therefore that there would be genes involved in tumor suppression. Moving on to IL-7, genes whose growth profiles most similarly match the T cell growth when stimulated by IL-7 included ZNF665 and CA9, which are zinc finger proteins and zinc metalloenzymes, respectively. Zinc finger proteins have numerous functions in the human body, including participating in signal transduction, transcriptional regulation and other key metabolic processes. Additionally, another gene upregulated by IL-7 stimulation include ICAM4, which in involve intercellular adhesion. T cells normally form clusters with cells sticking together upon proliferation. Genes whose growth profiles most nearly matched the T cell growth when stimulated by IL-15 included genes such as PFKFB1, which is involved in glycolysis activation, and TPTE2, which is involved in inositol phospholipid metabolism, which would be used to form cell walls.
The aforementioned genes which are similar to the growth rate of T cell stimulated solely with IL-2, IL-7 or IL-15, represent the polarizing conditions of the T cell, which would be the highest concentrations of IL-2, IL-7 and IL-15, respectively, which were compared to the control condition. This was done to see the numerical fold-increase from baseline for the time profile. Results from this study were also able to help delineate whether the genes were persistently upregulated compared to control, or changed the magnitude of the concentration as compared to control.
3. Discussion
3.1. The Impact of Each Cytokine on T Cell Growths
IL-2 and IL-7 had the largest impact on growth rates, however high levels of both did not result in the highest growth rates for this study. 15 ng/mL IL-2 with 6 ng/mL IL-7 (condition 200), 1 ng/mL IL-2 with 80 ng/mL IL-7 (condition 020), and 10 ng/mL IL-2 with 36 ng/mL IL-7 (condition 110) provided the best growth rates, and were statistically indistinguishable from each other. IL-15 was constant at 6 ng/mL for each of these top performers. Condition 011, corresponding to 1 ng/mL IL-2 and 36 ng/mL IL-7 and IL-15, was also among this statistical group of highly proliferative conditions.
Much of the literature stipulated that there was a positive correlation between growth rate of CD4
+ T cells and the presence of IL-2 and IL-7. The condition that would correlate with higher concentrations of these two cytokines is 110, which produces the third highest growth rate given the experimental data in
Figure 2A, and the highest growth rate in
Figure 1 after normalization. The conditions that produced the highest growth rate were 200 (highest IL-2) and 020 (high IL-7 and low IL-2 and -15) which was surprising. All conditions with IL-2, IL-7, and IL-15 present out-performed the control with none of these present; however moderate levels of each cytokine performed better than the extremes. The 000 condition (lowest non-zero concentrations of each cytokine) did not statistically perform any better than the control, and the 222 condition was very close to the average growth rate. This suggests that an optimal range for each cytokine exists, and over-stimulation by any cytokines may reduce proliferation of
in-vitro activated CD4
+ cultures with respect to the initial (seven-day), post-thaw cultures important for the CAR-T process.
3.2. The Factors that May Contribute to the Uncertainties in the Growth Rate Data
After a third dataset was collected, we pooled the data for each of the conditions to demonstrate average findings over time between the data sets, presented in
Figure 1. The pooled data set does illustrate some uncertainties between the first two data sets and the average of all four data sets. There are a few possible reasons that this could be so, including: differentiation, donor specificity, T cell quantitation method, and nutrient exhaustion. Additionally, the cells were not co-activated with IL-2 until day 3 of the experiment, after a period of acclimation resulting from cryopreservation. The cells, although all from the same donor, may not have responded the same to cryopreservation, lending some uncertainty between data sets. Normalizing the data to the average growth rate of that set improved reliability of condition-to-condition comparisons.
The first potential reason for the growth rate uncertainties is the possibility of cell differentiation. Activated T cells are undifferentiated to a certain extent, not yet at their final functional stage. It is known that cellular signaling pathways which are involved in proliferation are also intertwined with those involved in differentiation [
2,
8,
24]. Another factor for the uncertainties shown in growth data is donor specificity. Donor specificity is always of interest in this type of experiment, because the consistency of T cells from an individual is a controlling factor in the consistency of the results. Patient to patient, there can be unexplained differences in how T cells react depending on gene expression in those specific patients. The data presented here represents two distinct donors, and initial viability from thaw was variable among experimental runs. It is a possibility that the cells could have been less responsive to the stimuli than in the previous run since the data points fall within a narrow standard deviation of each other.
Another reason for the possible discrepancy between the data sets is the possibility of limitations of the method of quantitation, being that it was generated using hand-count techniques in hemocytometer. Using a hand-counting method would introduce potential variance and inconsistency in the measurement system via reproducibility, but also in repeatability when up against an analytical instrument. We did not conduct a gage R&R on the measurement system to confirm the assumption, but moving forward, verifying the accuracy and precision using a gage R&R would likely help remove human error as a factor in considering data uncertainty. Though, the TC20 Automated Cell Counter from Bio-Rad was unable to distinguish CD3/CD28 stimulation beads from activated CD4 T-cells, and gave unreliable results in the absence of stimulation beads due to the small diameter of recovering activated cells. This is why a hand-counting method was implemented in this work.
3.3. Discuss Major Findings in Transcriptomic Analysis (What Genes May Be of Clinical Value)
There are some major findings in the transcriptomic data analysis. The first major finding was that many of the genes with persistent genes expressing changes in magnitude above control were associated with major pathways involved in cell growth and proliferation. This finding alone is helpful because the genes are markers that indicate how the cytokines impact the signaling within the cells. Metabolic pathways including: glycolysis and carbohydrate metabolism, lipid metabolism, mTOR, TCA cycle and PI3K-AKT are all pathways with which the up-and down-regulated genes were found to be associated, those of which are important for cell growth [
22].
Genes specifically having to do with glycolysis would be a target of clinicians because glycolysis is necessary to fuel the cell during proliferation. Anabolism and cell division are costly processes to the cell, requiring a great deal of energy. With fuel for growth from glycolysis, PFKFB1 is an enzyme regulating the synthesis and degradation of fructose-2,6-bisphosphate. This gene was persistently upregulated in response to IL-15. Another gene of interest with clinical merit would be
CXCL8, or interleukin-8 (IL-8). IL-8 is an inflammatory chemokine with neutrophil specificity, which can be seen as a chemo-attractant molecule [
25]. From the outlier genes found from IL-2, IL-7 and IL-15, this outlier gene is common to both IL-2 and IL-7 stimulation in the transcriptomic data, and has association with many genes involved in TCR signaling. Another closely-related chemokine, CXCL9 was found to be upregulated by IL-2, IL-7 and IL-15. This molecule is of particular interest due to its involvement in immune cell migration, differentiation and activation [
25]. Literature suggests that CXCL9 may be a target for cancer therapy as it is a tumor suppressor, and, coupled with other chemokines, can act as a potent differentiator to T helper cells in naïve T cells [
26]. VEGFC, or vascular endothelial growth factor-C is another target gene of importance. It was upregulated upon IL-2 stimulation. The literature suggests that this compound has the ability to upregulate MAPK and AKT signaling pathways, both of which are direct links to cellular proliferation. Additionally, the VEGFC pathway is a pathway in itself, which is involved in directing growth of the lymphatic endothelial cells for transport throughout the body [
27].
CCL2 was an outlier gene of the stimulation by IL-2. This gene is involved in T cell differentiation and is a monocyte chemo-attracting protein [
28]. It could be a target of clinical value to preclude in the future for preventing differentiation.
3.4. The Complexity and Uncertainty of Naïve T Cell Growth, Activation and Pre-Differentiation Phenotyping
This study focuses exclusively on the naïve CD4
+ T cell phenotype. The cells were thawed and permitted to acclimate to the new post-thaw environment prior to activation and cytokine supplementation. Activation, however, does not consign differentiation, so although the naïve T cells were activated, they do not have to be referred to a specific T-cell subset. In a review published in
Frontiers, the authors clearly state that, “after development in the thymus, conventional T cells exist as naïve, or undifferentiated cells, and upon activation can undergo clonal expansion and wield different effector functions,” [
29]. Effector functions can serve to be a multitude of directions from a cellular cascade perspective. There are T-reg cells, Helper T Cells, Follicular Helper cells and an effector function can be a capability of cytotoxicity. Further, the authors state, “a trivial quantity of activated cells become memory cells,” which again implies that differentiation is downstream of activation [
29]. Additionally, activation by cytokines and other chemokines differs drastically as compared to a specific antigen or pathogenic material. The most drastic difference noted by the authors in
Frontiers is in the modulation of the survival programming, surrounding pathways such as apoptosis and necrosis [
29]. Naïve T cells and their activated counterparts differ in this arena but it does not consign a different phenotype than the naïve phenotype initially. This is the main justification for using “activated” T cells, instead of “naïve” T cells throughout the paper.
3.5. Design of Experiments
The design of the experiments included, with the exception of the negative control, conditions including at least a low level of each cytokine in the mix, without single cytokine conditions. The four key reasons why single-cytokine groups were not implemented in this experiment include: first, IL-2, IL-7 and IL-15 all share the γ-chain in CD4
+ lymphocytes, but the threshold for stimulation clearly is above the 000 level for all cytokines presented by the data and supported by literature. Additionally, it is also clear that a tertiary cocktail of all three γ-chain cytokines does not work in a synergistic way to raise the growth rate, as is evidenced by the “222” condition. Second, singular cytokines tend to have significant impacts by themselves with particular subsets of CD4
+ T cells, i.e., IL-7 is pertinent for survival of memory T cell subsets, but not exclusively key for CD4
+ naïve T cell phenotype expansion. The saturation of IL-7 in memory T cell survival is evidenced in the literature. Third, certain cytokines, such as IL-2 are known at higher concentrations to induce apoptosis, yet when coupled with other cytokines, there tends to be a synergistic effect [
4]. Fourth and finally, the last reason we use combinations of cytokines is to reduce the concentrations of certain cytokines relative to one another. The impact of single cytokines can place cells down specific signaling pathways, which in reality is both unlikely to take place in vivo during lymphocyte expansion, and also is not likely to happen under normal cell conditions in humans. Many cytokines are present at once, all with their own individual concentrations; some are naturally occurring below 1ng/mL and others are present above 1ng/mL depending on the impact the cytokine has on a particular cell type. The cytokines we discuss here are pleiotropic in nature, so their impact specifically on CD4
+ T cells is different than on other cell types.
3.6. Cytokine Storm, Cytokine Release Syndrome (CRS), and Relation to Immunotherapies, SARS-CoV-2
During the discovery phase of the testing of chimeric antigen receptor (CAR) T cells, one of the major findings was the consistent violent reaction of a patient’s own immune system to the engineered T cells [
30]. History has shown that a patient’s own immune system can turn against the host when activated incorrectly by a pathogen or antigen-presenting cell (APC), such as during the 1918 Spanish Pandemic Flu. The severity of this pandemic was a result of the immune system’s unregulated cytokine release, which is termed a “cytokine storm.” Scientists later observed this phenomenon again during a disastrous failed Phase I clinical trial of CD-28 monocloncal antibody (mAb) superagonist TGN1412, where all six volunteers were plagued with cytokine storm shortly (minutes) after administration of the novel mAb [
31]. Scientists have a better understanding of CRS and cytokine storm associated with especially the T cell immunotherapies now that there is a diverse set of data relating to different types of cancers as well as different demographics [
32]. CD-19 blood-borne cancers like leukemia variants seem to be the best responders to CAR-T immunotherapies, especially in pediatric patients, who’s adaptive immune systems are underdeveloped and less coordinated [
30]. Also, cancer load seems to play a large part in the severity of CRS for T cell immunotherapy patients’ immune systems to react proportionately [
30]. Those with lower disease load or “burden” are less susceptible to CRS [
31]. Although therapeutic drugs like Tocilizumab (IL-6 inhibitor) and Daclizumab (IL-2 inhibitor) have been shown to reduce CRS grade [
31,
32], new studies have shown, specifically that anti-inflammatory cytokines like IL-37 and IL-38 have inhibitive effects on IL-1, which in the recent SARS CoV-2 (COVID-19) pandemic outbreak has played a part in our understanding of cytokine release and cytokine-related inflammation [
33]. CAR-T therapies also have an inductive effect on IL-1, the pro-inflammatory cytokine, which as previously mentioned, can potentially be neutralized using the anti-inflammatory effect of IL-37 [
34]. Finally, one of the root sources of the IL-1 induction by SARS-CoV-2 seems to be mast cell activation by the virus itself [
35]. The mast cell is a histamine-producing part of the innate immune system, rather than the adaptive immune system with T cells, however, recognition of pathogens by these mast cells ultimately impacts the adaptive immune system through cytokine signaling. Using anti-inflammatory cytokine signaling, there is a possibility to reduce the high levels of inflammation seen in CAR-T immunotherapies.
3.7. Limitation of This Work
There are a few limiting factors of this work. Given there was a shortage of cells for the experiments, triplicates of each of the 16 experimental conditions were not available. The shortage of cells created uncertainty in the data sets both from a replicability, and also reproducibility perspective. Additionally, and perhaps of equal relevance, the RNA sequencing data that was able to be gathered was not complete due to the limited time and available resources, in the sense that only the effects of individual cytokines were able to be analyzed. There were no coupling or interactive effects that could be studied. This has particular relevance in that the conditions identified as most proliferative in the study were not able to be evaluated because cytokine coupling was not part of the testing completed.
Suggestions for future work would be several recommendations. The first recommendation would be to take measures to minimize the uncertainty in the data sets. The uncertainty was explained, however maintaining the same donor throughout the experiment sets would be one suggestion to reduce variance. In addition, verifying the measurement system from the perspective of replicability versus reproducibility is especially important in developing consistent results. Other T-cell phenotypes will also be investigated, and preliminary data has been collected for CD8 subsets, as they tend to be favored for CAR-T processes currently. Finally, RNA Sequencing should be conducted for more experimental conditions, especially those conditions with various cytokine combinations.
5. Conclusions
To conclude, we have investigated the growth of activated CD4+ T cells via the influence of three key cytokines: IL-2, IL-7 and IL-15. Through a design of experiments with different cytokine concentrations, we identified several key conditions to optimize the growth of the activated CD4+ T cells. The most favorable conditions for T cell growth study, and from the predictive model align to include 10 ng/mL for IL-2 and 36 ng/mL for IL-15, followed by 36 ng/mL for IL-7 and 36 ng/mL for IL-15, followed by 10 ng/mL of IL-2 and 36 ng/mL for IL-15. These conditions led to the highest growth rate of activated CD4+ T cells in our study with statistical significance. The Fuzzy Inference System successfully analyzed the growth of the cells under the influence of the cytokines, and to predicts moderate concentrations of synergetic cytokine cocktails to optimize the growth of the cells. To explore and support the result, we also utilized RNA Sequencing analysis to take several gene expression snapshots to understand the impact of each cytokine on the genes up- and down-regulated from the cells during the experiment. We found genes relating to different signaling pathways associated with T cell growth, as well as specific signaling pathways that each cytokine influenced in the T cells using principal component analysis, GeneMANIA and MetaCore. These signaling pathway include TCR, JAK/STAT, MAPK, AKT and PI3K-AKT signaling. In particular, IL-2 regulated genes involved in cell and leukocyte chemotaxis, chemokine receptor activity, cellular defense response and cell motility. IL-7 regulated the genes associated with chloride transport, cell chemotaxis, chloride transmembrane activity, and cytokine receptor activity, and IL-15 regulated genes for cell growth, zinc ion responses, cellular response to metal ions, and regulation of calcium ion transport into the cell. Lastly, growth data analysis indicated a statistically significant interaction between IL-2 and IL-7, reproduced in all data sets and lays the groundwork for expositing the combination of these two cytokines and how they act synergistically together for the CD4+ T cell phenotype. We recommend a system for clinicians to utilize to accelerate the growth of initially naïve CD4+ T cells and lay the groundwork for an approach to identifying optimized growth potential in other types of human leukocytes.

 ,
, 


