Article

Transcription Factor CaSBP12 Negatively Regulates Salt Stress Tolerance in Pepper (Capsicum annuum L.)

1
College of Horticulture, Northwest A&F University, Yangling 712100, China
2
Guizhou Institute of Pepper, Guizhou Academy of Agricultural Sciences, Guiyang 550009, China
3
Tianjin Vegetable Research Center, Tianjin Academy of Agricultural Sciences, Tianjin 300192, China
*
Author to whom correspondence should be addressed.
Int. J. Mol. Sci. 2020, 21(2), 444; https://doi.org/10.3390/ijms21020444
Submission received: 17 December 2019 / Revised: 7 January 2020 / Accepted: 8 January 2020 / Published: 10 January 2020
(This article belongs to the Section Molecular Plant Sciences)

Abstract

:
SBP-box (Squamosa-promoter binding protein) genes are a type of plant-specific transcription factor and play important roles in plant growth, signal transduction, and stress response. However, little is known about the role of pepper SBP-box transcription factor genes in response to abiotic stress. Here, one of the pepper SBP-box gene, CaSBP12, was selected and isolated from pepper genome database in our previous study. The CaSBP12 gene was induced under salt stress. Silencing the CaSBP12 gene enhanced pepper plant tolerance to salt stress. The accumulation of reactive oxygen species (ROS) of the detached leaves of CaSBP12-silenced plants was significantly lower than that of control plants. Besides, the Na+, malondialdehyde content, and conductivity were significantly increased in control plants than that in the CaSBP12-silenced plants. In addition, the CaSBP12 over-expressed Nicotiana benthamiana plants were more susceptible to salt stress with higher damage severity index percentage and accumulation of ROS as compared to the wild-type. These results indicated that CaSBP12 negatively regulates salt stress tolerance in pepper may relate to ROS signaling cascades.

1. Introduction

Plants frequently encounter stressful environmental conditions, such as high salinity, extreme temperatures, drought, pests, and fungus infection [1]. These leading to detrimental effects on plant growth and seed germination and fruit productivity [2]. Salinity is the principal cause of crop yield loss worldwide and adversely affects plant growth and productivity [3]. To prevent the potentially harmful effects of such stresses, plants have evolved complex mechanisms to recognize external signaling networks and to be evidence of adaptive responses at the physiological, biochemical, and molecular levels [3,4]. In these responses, a series of stress-responsive genes are induced in plants, largely regulated by a range of transcription factors [5]. To date, a lot of transcription factors from various plant species have been reported to be involved in stress responses [6]. For instance, the basic leucine zipper transcription factor AtbZIP24 [7], the WRKY18, WRKY25, WRKY33, WRKY60, and WRKY63 [8,9,10], the MYC2 and MYB15 [11,12] have been reported to be involved in abiotic stress in Arabidopsis. The NbWRKY79 has been reported to be involved in salt stress in Nicotiana benthamiana (N. benthamiana) [3]. The SlGRAS40 and SlAREB have been reported to be involved in abiotic stress in tomato [2,13].
SBP-box (Squamosa-promoter binding protein) genes are specific to plants, which contain a highly conserved SBP domain [14]. This SBP domain comprises approximately 76 amino acid residues, including two zinc fingers (C3H and C2HC) and a nuclear localization signal [15,16]. Many studies show that SBP-box genes are involved in the network of the flower formation pathway, plant growth and development. For example, AmSBP1 and AmSBP2 can interact with the promoter sequence of the floral meristem identity gene SQUAMOSA and control of early flower development in Antirrhinum majus [14]. The SOC1-SPL module integrates photoperiod and gibberellic acid signals to control flowering time in Arabidopsis [17]. OsSPL9 can directly bind to the CuRE element in the promoter region of miR528 gene and activate the transcription of miR528, which regulates rice development at heading stage [18]. However, some studies show that SBP-box genes play a role in responses to abiotic and biotic stresses. For example, AtSPL14 is induced by the fungal toxin fumonisin B1, which induces programmed cell death in Arabidopsis [19]. CaSBP12 involved in plant defense response to Phytophthora capsici infection in pepper plants [20]. OsSPL9 can activate the transcription of miR528 gene, promote its accumulation in rice, then inhibit the expression of target mRNA AO, and finally eliminate the inhibition of ascorbic acid oxidase (AO) on RSV [21]. Knockout of OsSPL10 in rice enhanced plants’ salt tolerance and overexpression of OsSPL10 in rice reduced plants’ salt tolerance [22]. Overexpression of BpSPL9 in Betula platyphylla Suk. improved the ability to scavenging of ROS to salt stress [23]. slSBP2-L1 (Solyc05g015840) was highly induced by salt stress in tomato [24]. Arabidopsis miR156 regulates tolerance to heat stress through the transcription factors of SPL2, SPL9, and SPL11 [25]. Overexpression of OsmiR156k in rice reduced the tolerance to cold stress by down-regulating SPL3, SPL14, and SPL17 [26]. Knocking down a microRNA156 target gene, SPL13, improves drought tolerance in alfalfa (Medicago sativa) [27].
However, to our knowledge, there is no report on the research of CaSBP genes in abiotic stress in pepper. In our previous study, we identified a CaSBP12 gene (Accession no. Capana10g000886), which encodes 299 amino acids, contains a SBP domain, and is located in the nucleus [16,20]. Besides, our previous work indicates that CaSBP12 gene negatively regulates plants defense response to Phytophthora capsici infection in pepper [20]. However, the role of CaSBP12 in abiotic stress is not clear. In this study, we found that CaSBP12 gene responses to salt stress, and plays a negative role in the tolerance to salt stress in pepper.

2. Results

2.1. Expression of the CaSBP12 Gene in Pepper under Salt Stress

To identify whether CaSBP12 gene is involved in the response to salt stress, the expression pattern of CaSBP12 in pepper were investigated. As shown in the Supplementary Figure S1, the expression of CaSBP12 was induced at 2 h after salt stress. However, the expression level of CaSBP12 was significantly decreased at 8 h and 12 h. These results indicated that CaSBP12 gene is related to salt stress.

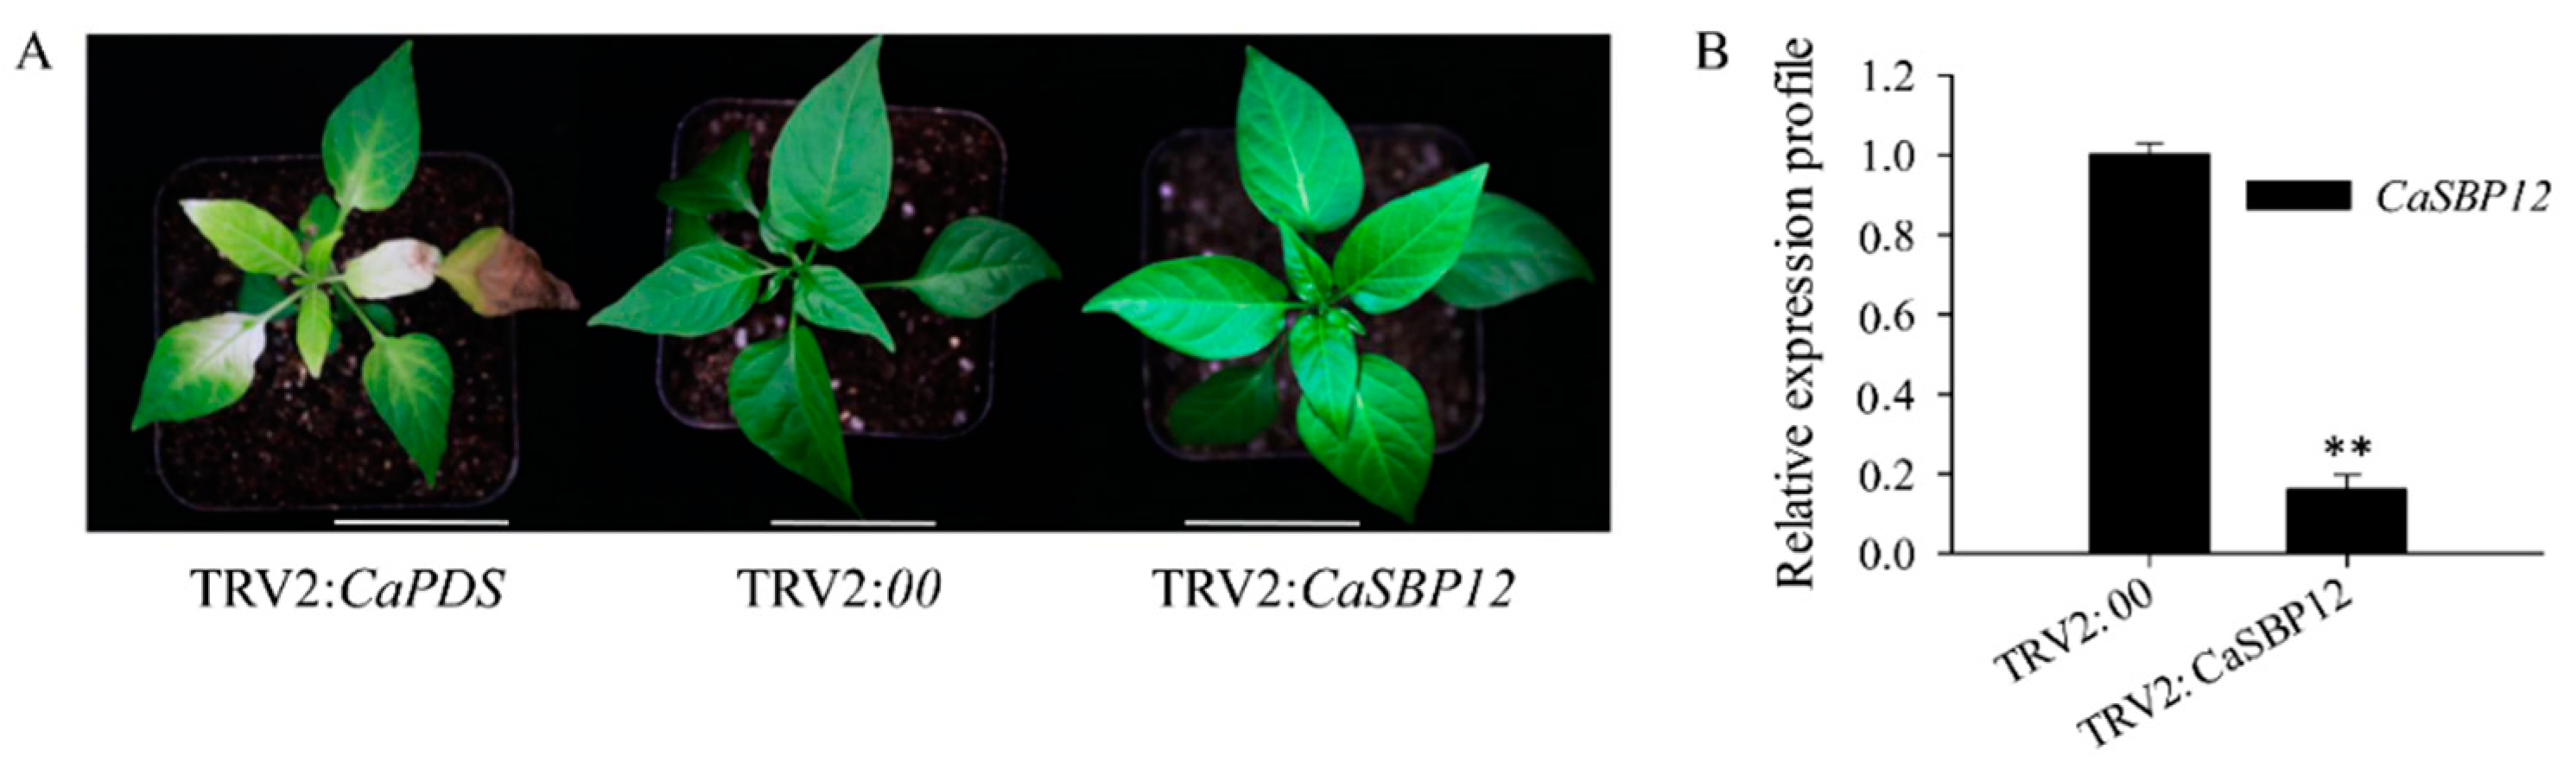
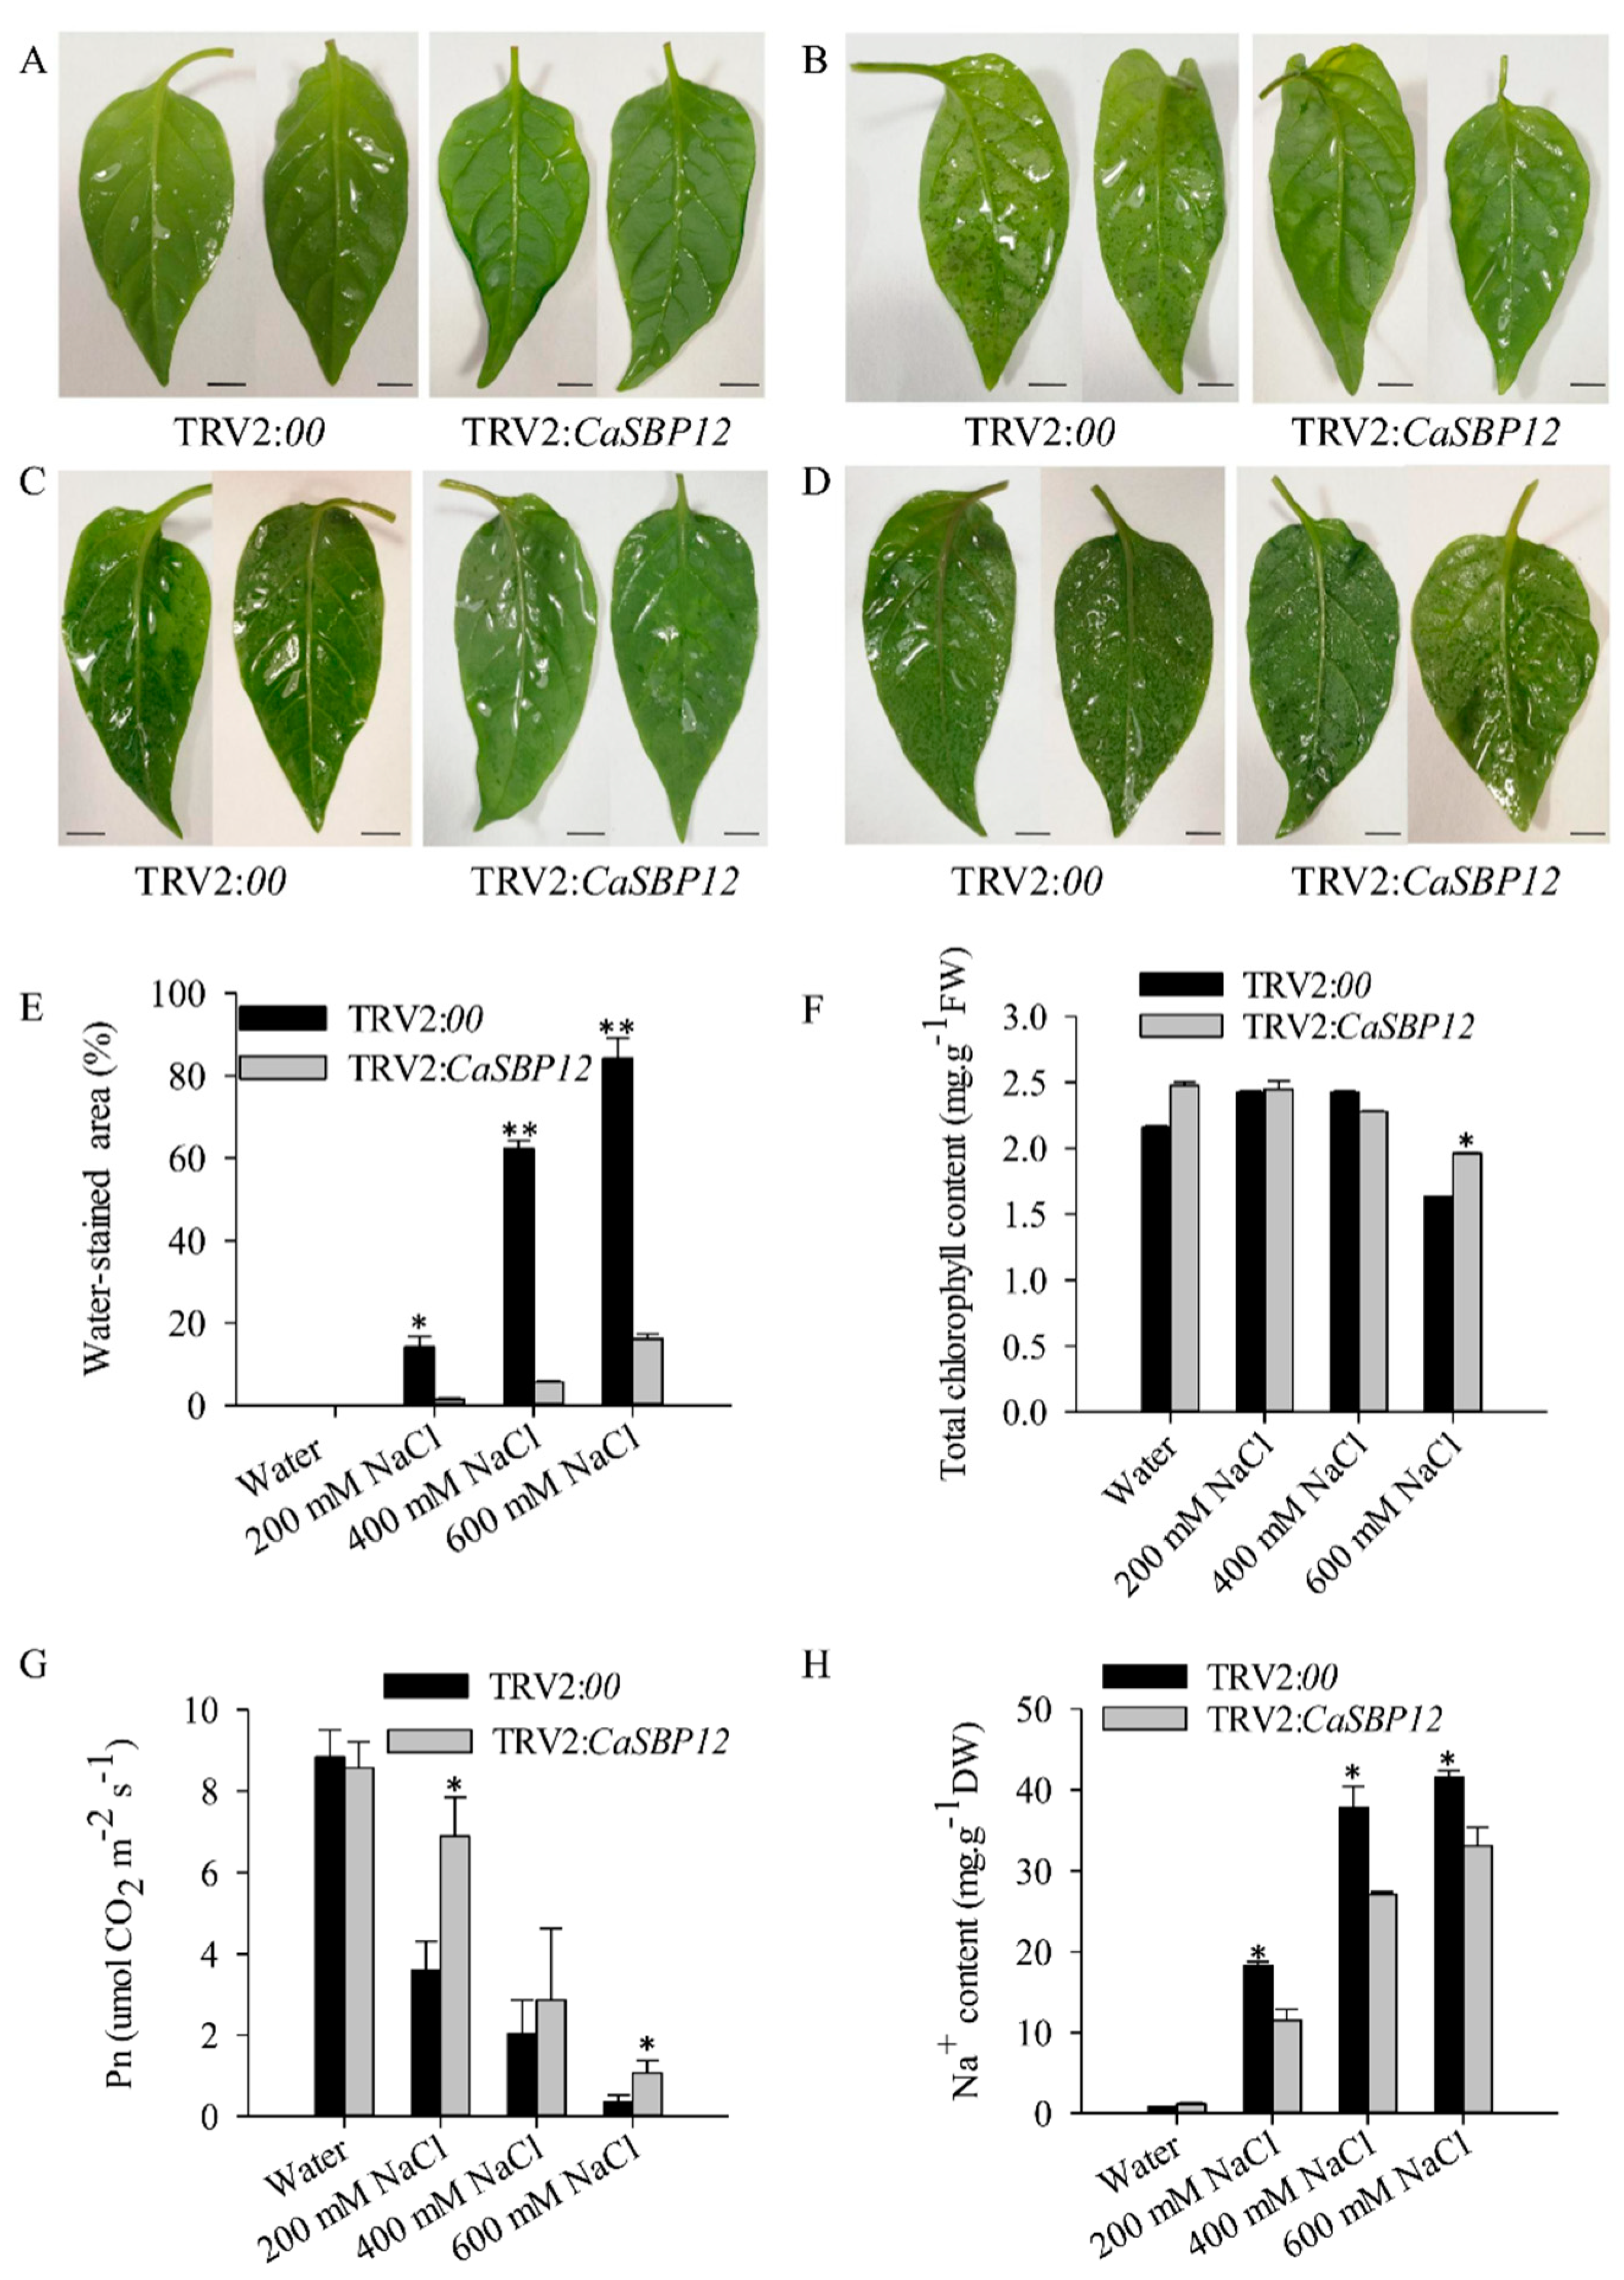
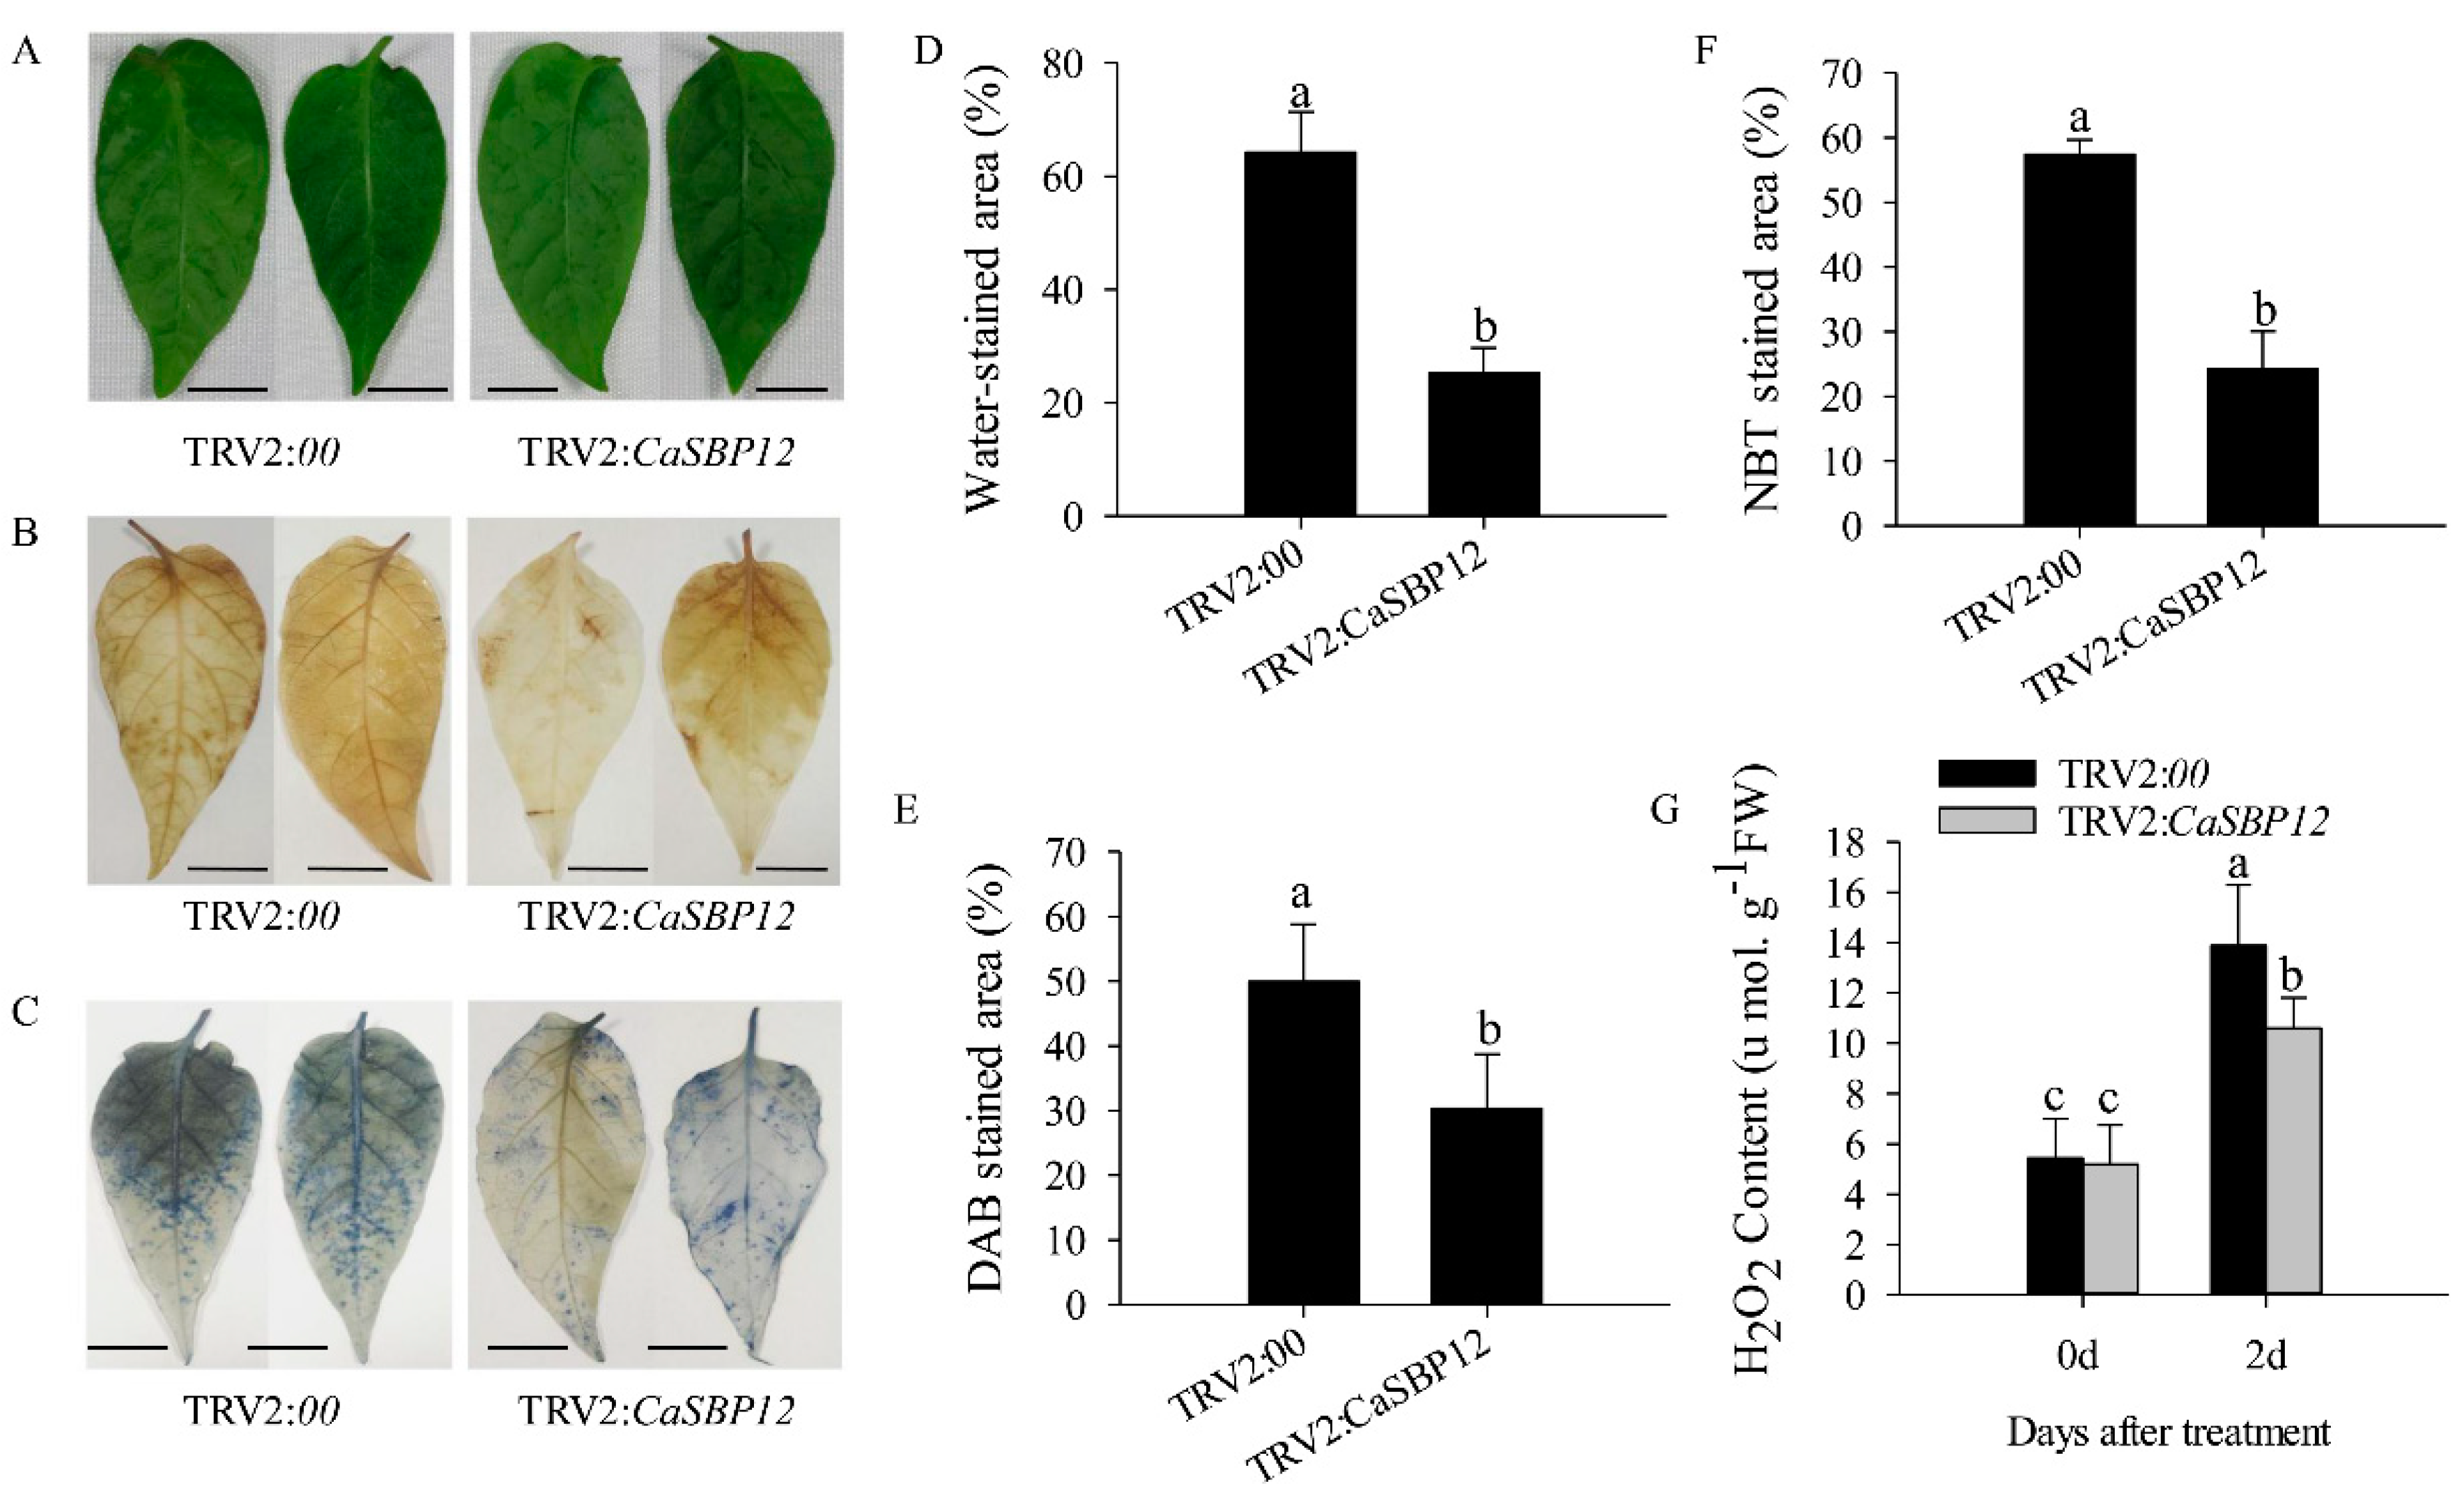
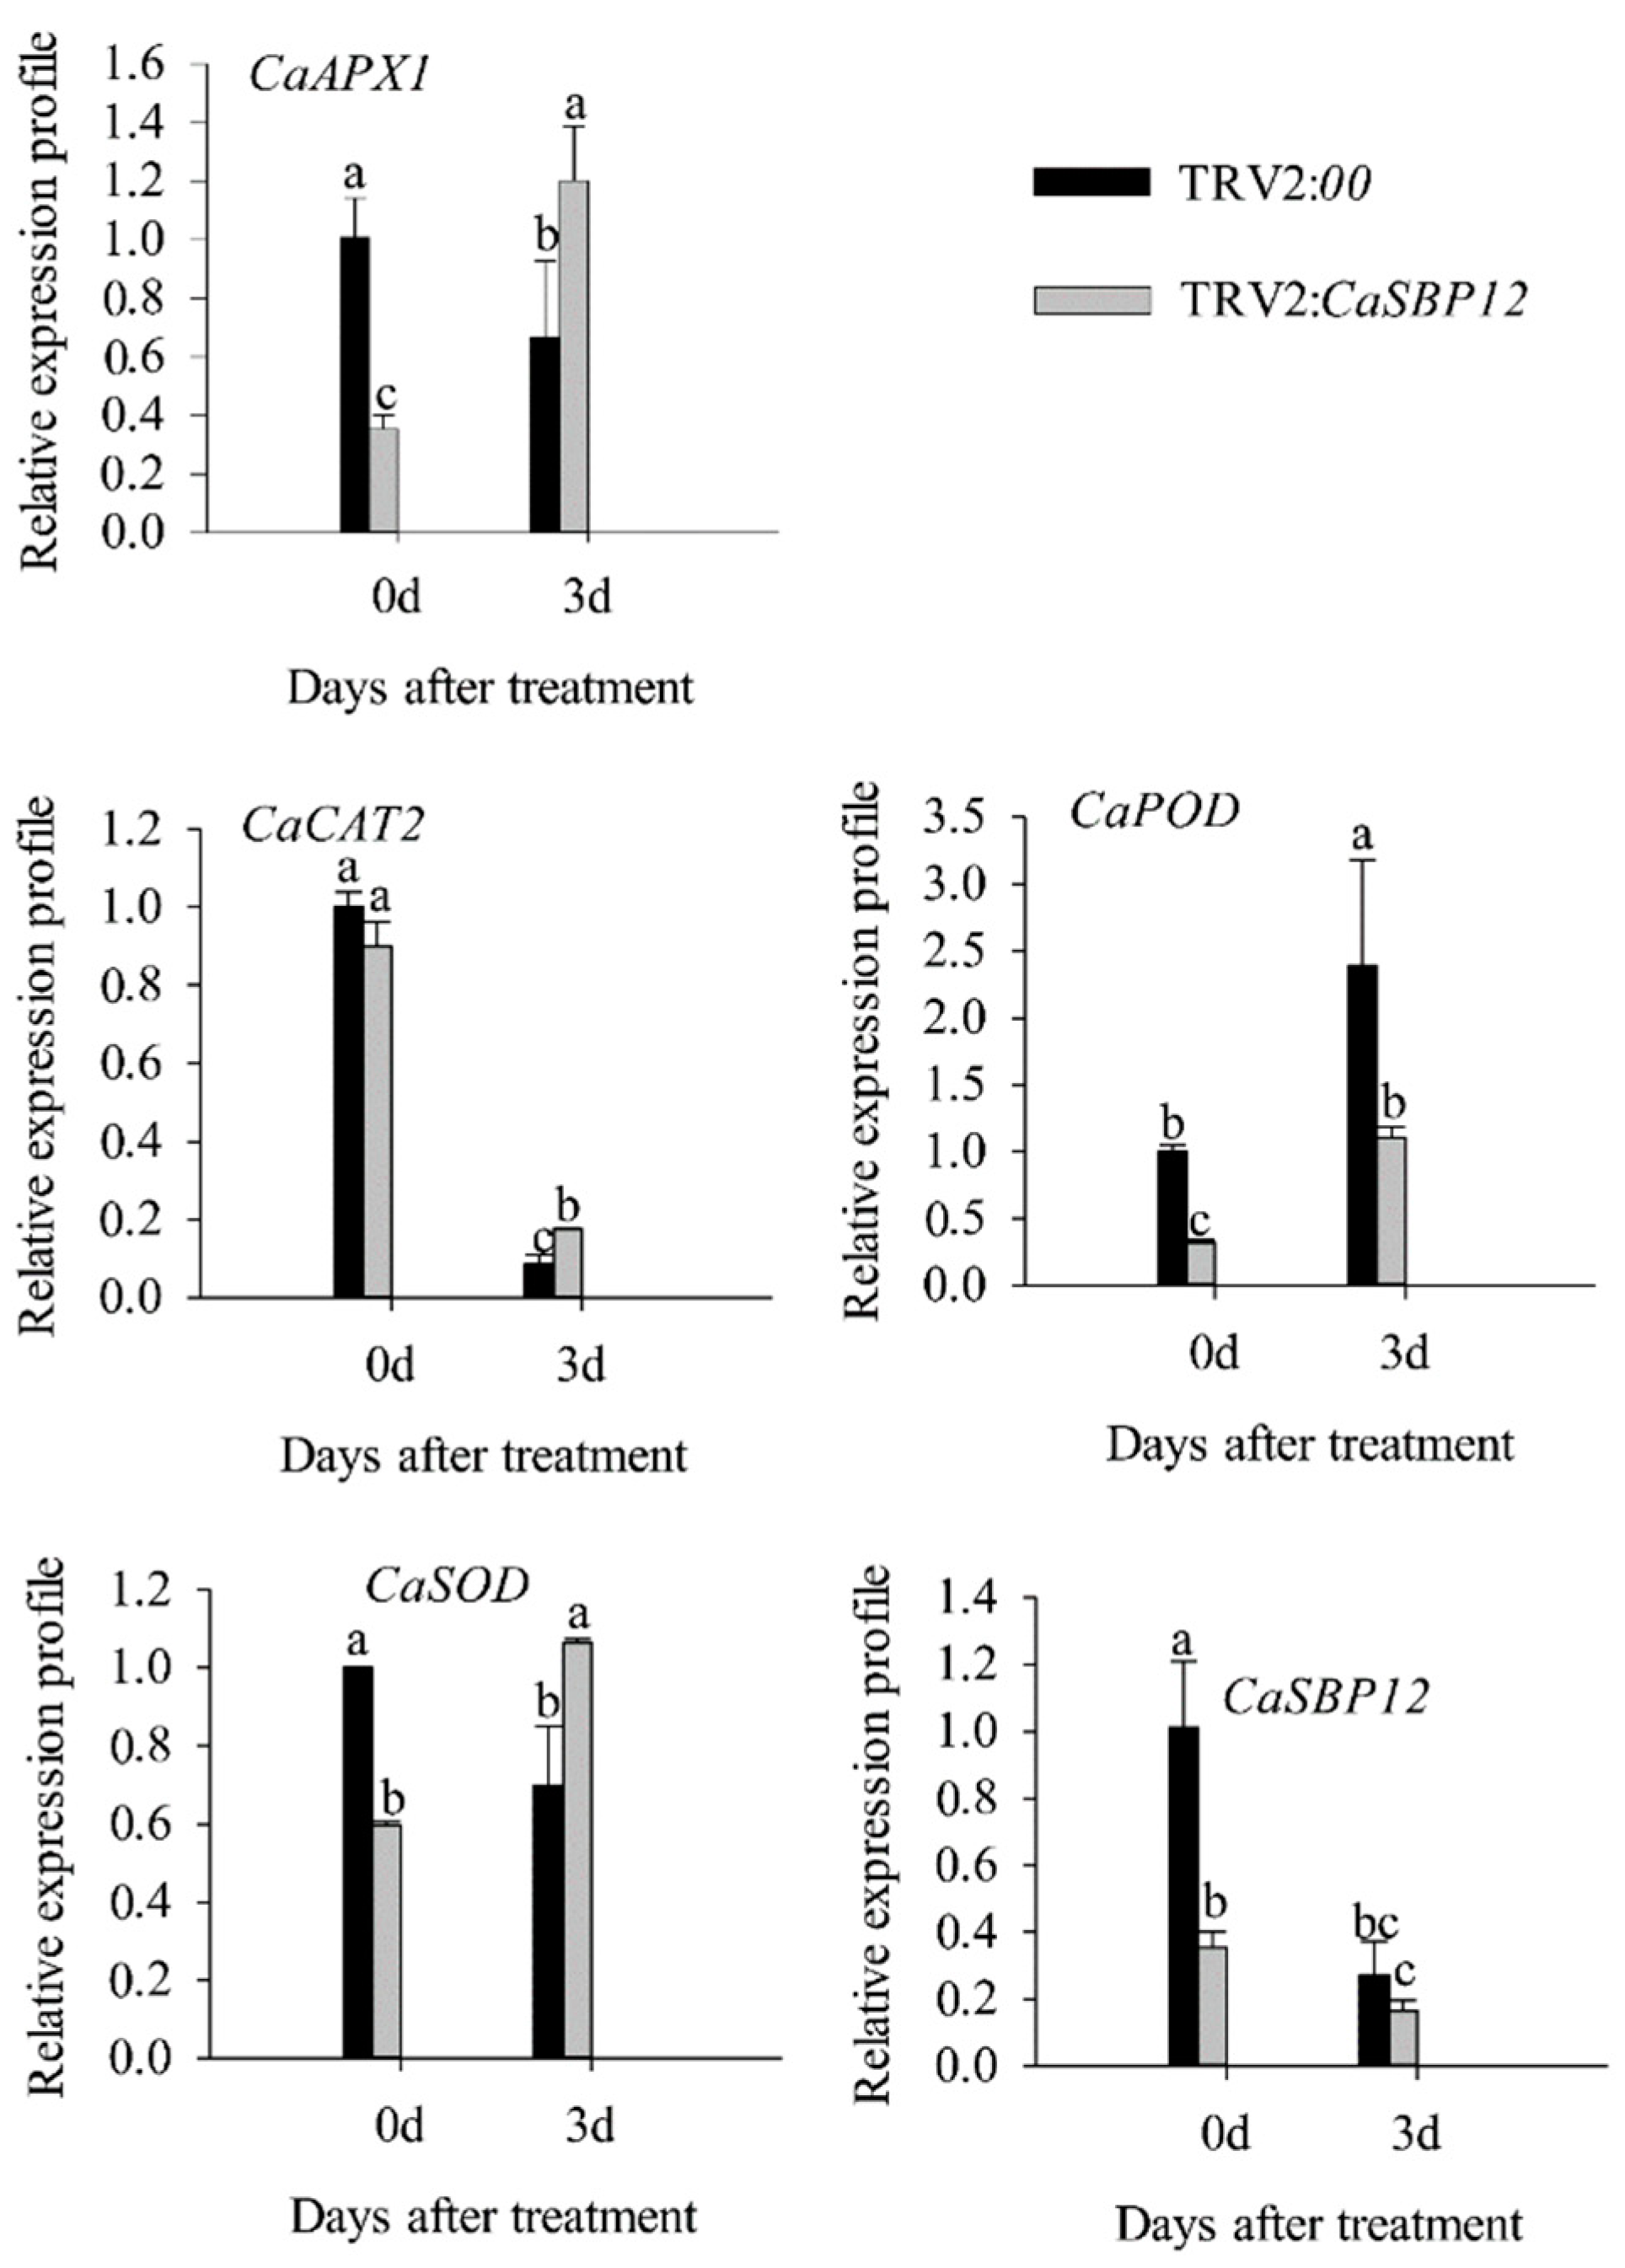
2.2. Silencing the CaSBP12 Gene Enhanced Pepper Plant Tolerance to Salt Stress

To identify whether the CaSBP12 gene involved in salt stress, CaSBP12 gene was silenced in pepper using the virus-induced gene silencing method [28]. In this study, a positive control vector (TRV2:CaPDS) was used for the silencing of the CaPDS gene (GenBank accession number: X68058), which exhibited photo-bleaching phenotype in the leaves after it was silenced, while the negative control was TRV2:00. When the leaves of TRV2:CaPDS plants exhibited the photo-bleaching phenotype (Figure 1A), the silencing efficiency of TRV2:CaSBP12 and TRV2:00 were detected. As shown in Figure 1A and Supplementary Figure S2, there were no visual phenotype and total chlorophyll content differences between CaSBP12-silenced (TRV2:CaSBP12) and control (TRV2:00) plants under normal conditions, and the silencing efficiency was over 80% (Figure 1B). Subsequently, CaSBP12-silenced and control plants were used for further study.
The detached leaves of CaSBP12-silenced and control plants were soaked in different concentrations of salt solution (200 mM NaCl, 400 mM NaCl, and 600 mM NaCl). As shown in Figure 2A, there was no phenotypic difference between the detached leaves of CaSBP12-silenced and control plants treated in water for 2 days. However, there was an obvious phenotypic difference between the detached leaves of CaSBP12-silenced and control plants treated in 200 mM NaCl, 400 mM NaCl, and 600 mM NaCl solution for 2 days (Figure 2B–D). With the increase of salt treatment concentration, water-stained spots on the detached leaves increased and the area became larger. The detached leaves of control plants appeared water-stained spots, which accounted for about 14.19% of the leaf area after 2 days of treatment with 200 mM NaCl, while the water-stained spots on the detached leaves of CaSBP12-silenced plants only accounted for about 1.44% of the leaf area (Figure 2B,E). Besides, about 62.23% of the leaf area of the detached leaves of control plant was water-stained, while only about a 5.66% of the leaf area of the detached leaves of CaSBP12-silenced plant showed water-stained spots after 2 days of treatment with 400 mM NaCl (Figure 2C,E). In addition, about 84.15% of the leaf area of detached leaves of control plants were water-stained, while about 16.15% of leaf area of the detached leaves of CaSBP12-silenced plants were water-stained after 2 days of treatment with 600 mM NaCl (Figure 2D,E). After treated with 200mM NaCl and 400 mM NaCl for two days, there was no significant change in total chlorophyll content in the detached leaves of the CaSBP12-silenced plants compared with the control (Figure 2F). However, after 2 days of treatment with 600 mM NaCl, the total chlorophyll content of the detached leaves of the CaSBP12-silenced plant and the control plant was decreased, and the total chlorophyll content of the detached leaves of the CaSBP12-silenced plant was significantly higher than that of the control plant (Figure 2F). Besides, with the increase of salt treatment concentration, the net photosynthetic rate of the detached leaves of CaSBP12-silenced and control plants decreased (Figure 2G). However, the net photosynthetic rate of the detached leaves of CaSBP12-silenced plants was significantly higher than that of the control plants (Figure 2G). In addition, with the increase of salt treatment concentration, the Na+ content in the detached leaves of CaSBP12-silenced and control plants increased (Figure 2H). However, the Na+ content in the detached leaves of CaSBP12-silenced plants was significantly lower than that of control plants (Figure 2H). In addition, the expression of ion transport genes (CaSOS1, CaHKT2-1, CaHKT2-2) were suppressed in the CaSBP12-silenced plants without any treatment (Supplementary Figure S3). These results indicated that silencing the CaSBP12 gene enhanced pepper plant tolerance to salt stress.
Additionally, in order to analyze the accumulation of ROS in the CaSBP12-silenced and control plants after salt stress, DAB and NBT staining were used to detect peppers hydrogen (H2O2) and O2 levels (Figure 3). As shown in Figure 3A–E, after 2 days of salt stress, about 64.28% of leaf area of water-stained lesions appeared in the detached leaves of the control plants, while about 25.24% of leaf area of detached leaves of the CaSBP12-silenced plants was water-stained. The DAB stained area was significantly increased in the detached leaves of control plants than that in the detached leaves of CaSBP12-silenced plants. Besides, as shown in Figure 3C,F, the NBT stained area was significantly increased in the detached leaves of control plants than that in the detached leaves of CaSBP12-silenced plants. In addition, the H2O2 content in the detached leaves of control plants was significantly higher than that in the detached leaves of CaSBP12-silenced plants (Figure 3G). These results indicated that lower accumulation of H2O2 and O2 was detected in the detached leaves of CaSBP12-silenced plants compared with control plants.
In order to further verify the role of CaSBP12 gene under salt stress, the CaSBP12-silenced and control plants were treated with 400 mM NaCl. After 3 days of treatment, wilted and yellowish symptoms were observed in the control plants, while the CaSBP12-silenced plants were only yellowish (Figure 4A). The total chlorophyll content of the CaSBP12-silenced and control plants were decreased (Figure 4B). However, there was no significant difference in total chlorophyll content between control and CaSBP12-silenced plants after 3 days of treatment (Figure 4B). Besides, the Na+, MDA content and conductivity were significantly increased in control plants than that in the CaSBP12-silenced plants (Figure 4C). These results indicated that silencing the CaSBP12 gene enhanced pepper plant’s tolerance to salt stress.
In addition, the expression of CaAPX1 (GenBank accession number: DQ002888.1), CaCAT2 (GenBank accession number: AY128694.1), CaSOD (GenBank accession number: NM_001324998.1), and CaPOD (GenBank accession number: NM_001324997.1), which related to ROS-scavenging enzymes were detected. After 3 days of salt stress, the expression of these genes was induced in CaSBP12-silenced plants except for CaCAT2 (Figure 5). The expression of CaCAT2 was decreased in CaSBP12-silenced and control plants on day 3 (Figure 5). Besides, these genes, expression in CaSBP12-silenced plants was higher than that in control plants except the expression of CaPOD (Figure 5). In addition, the expression of CaSBP12 was decreased in CaSBP12-silenced and control plants (Figure 5).

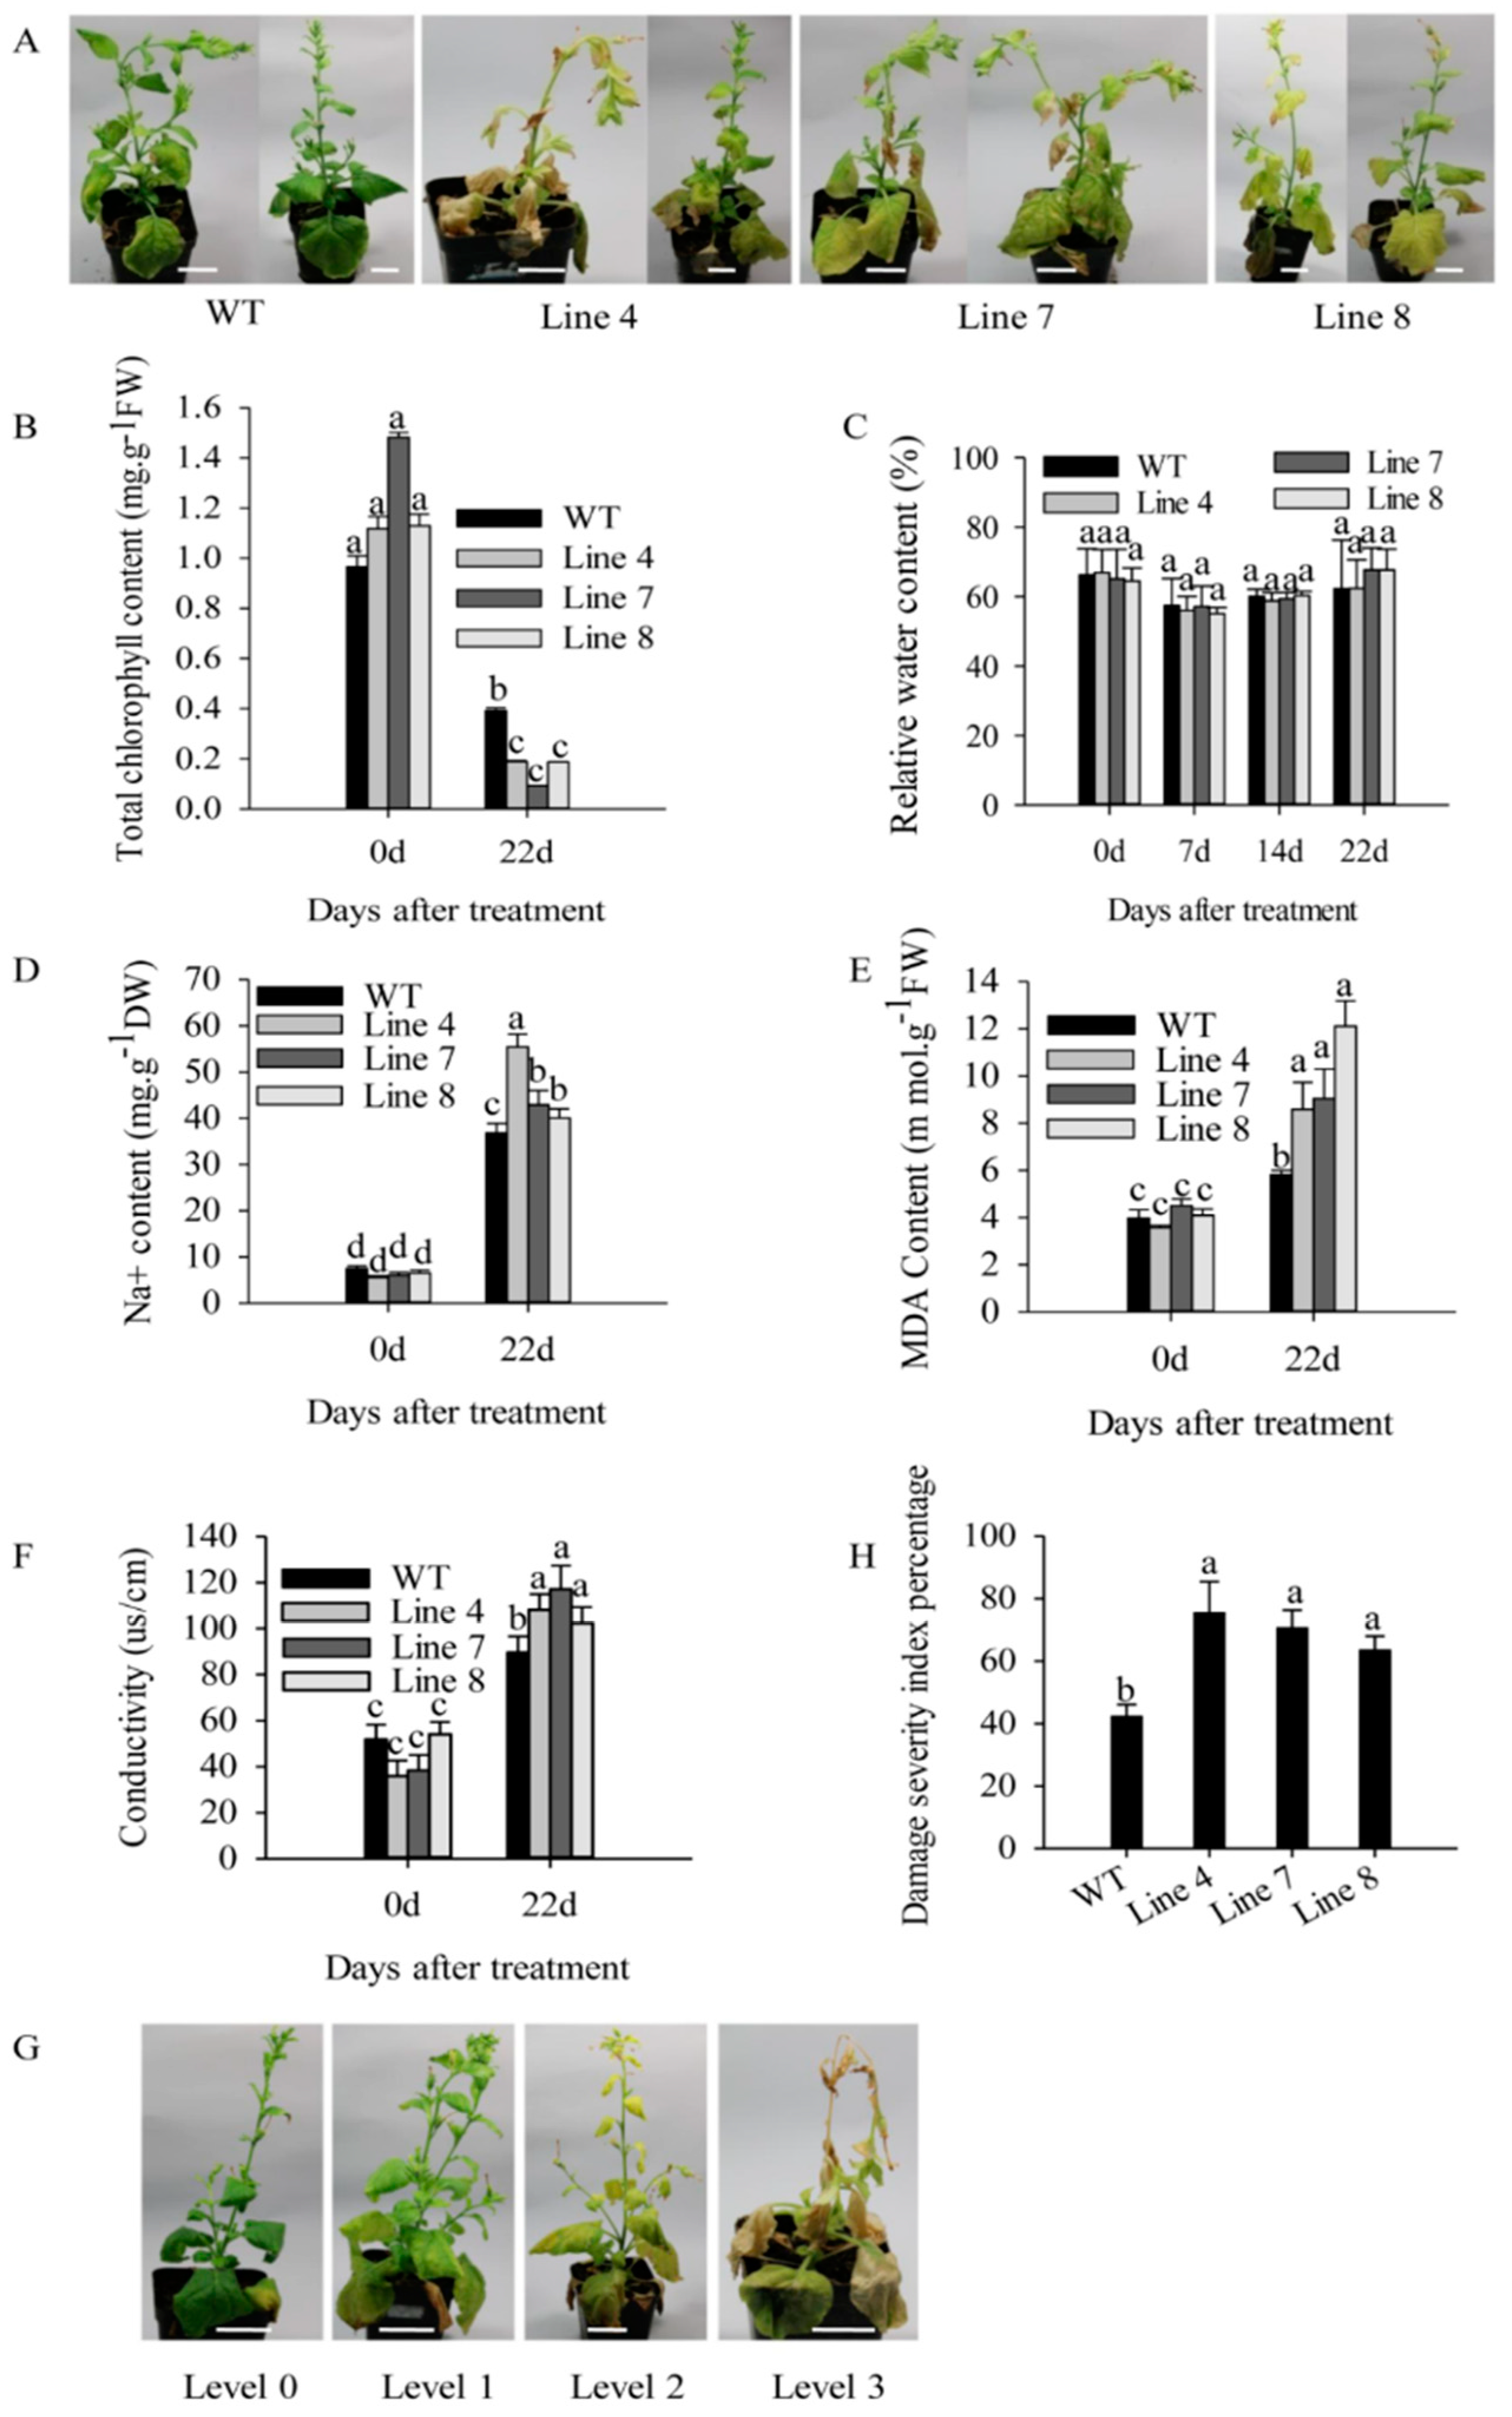
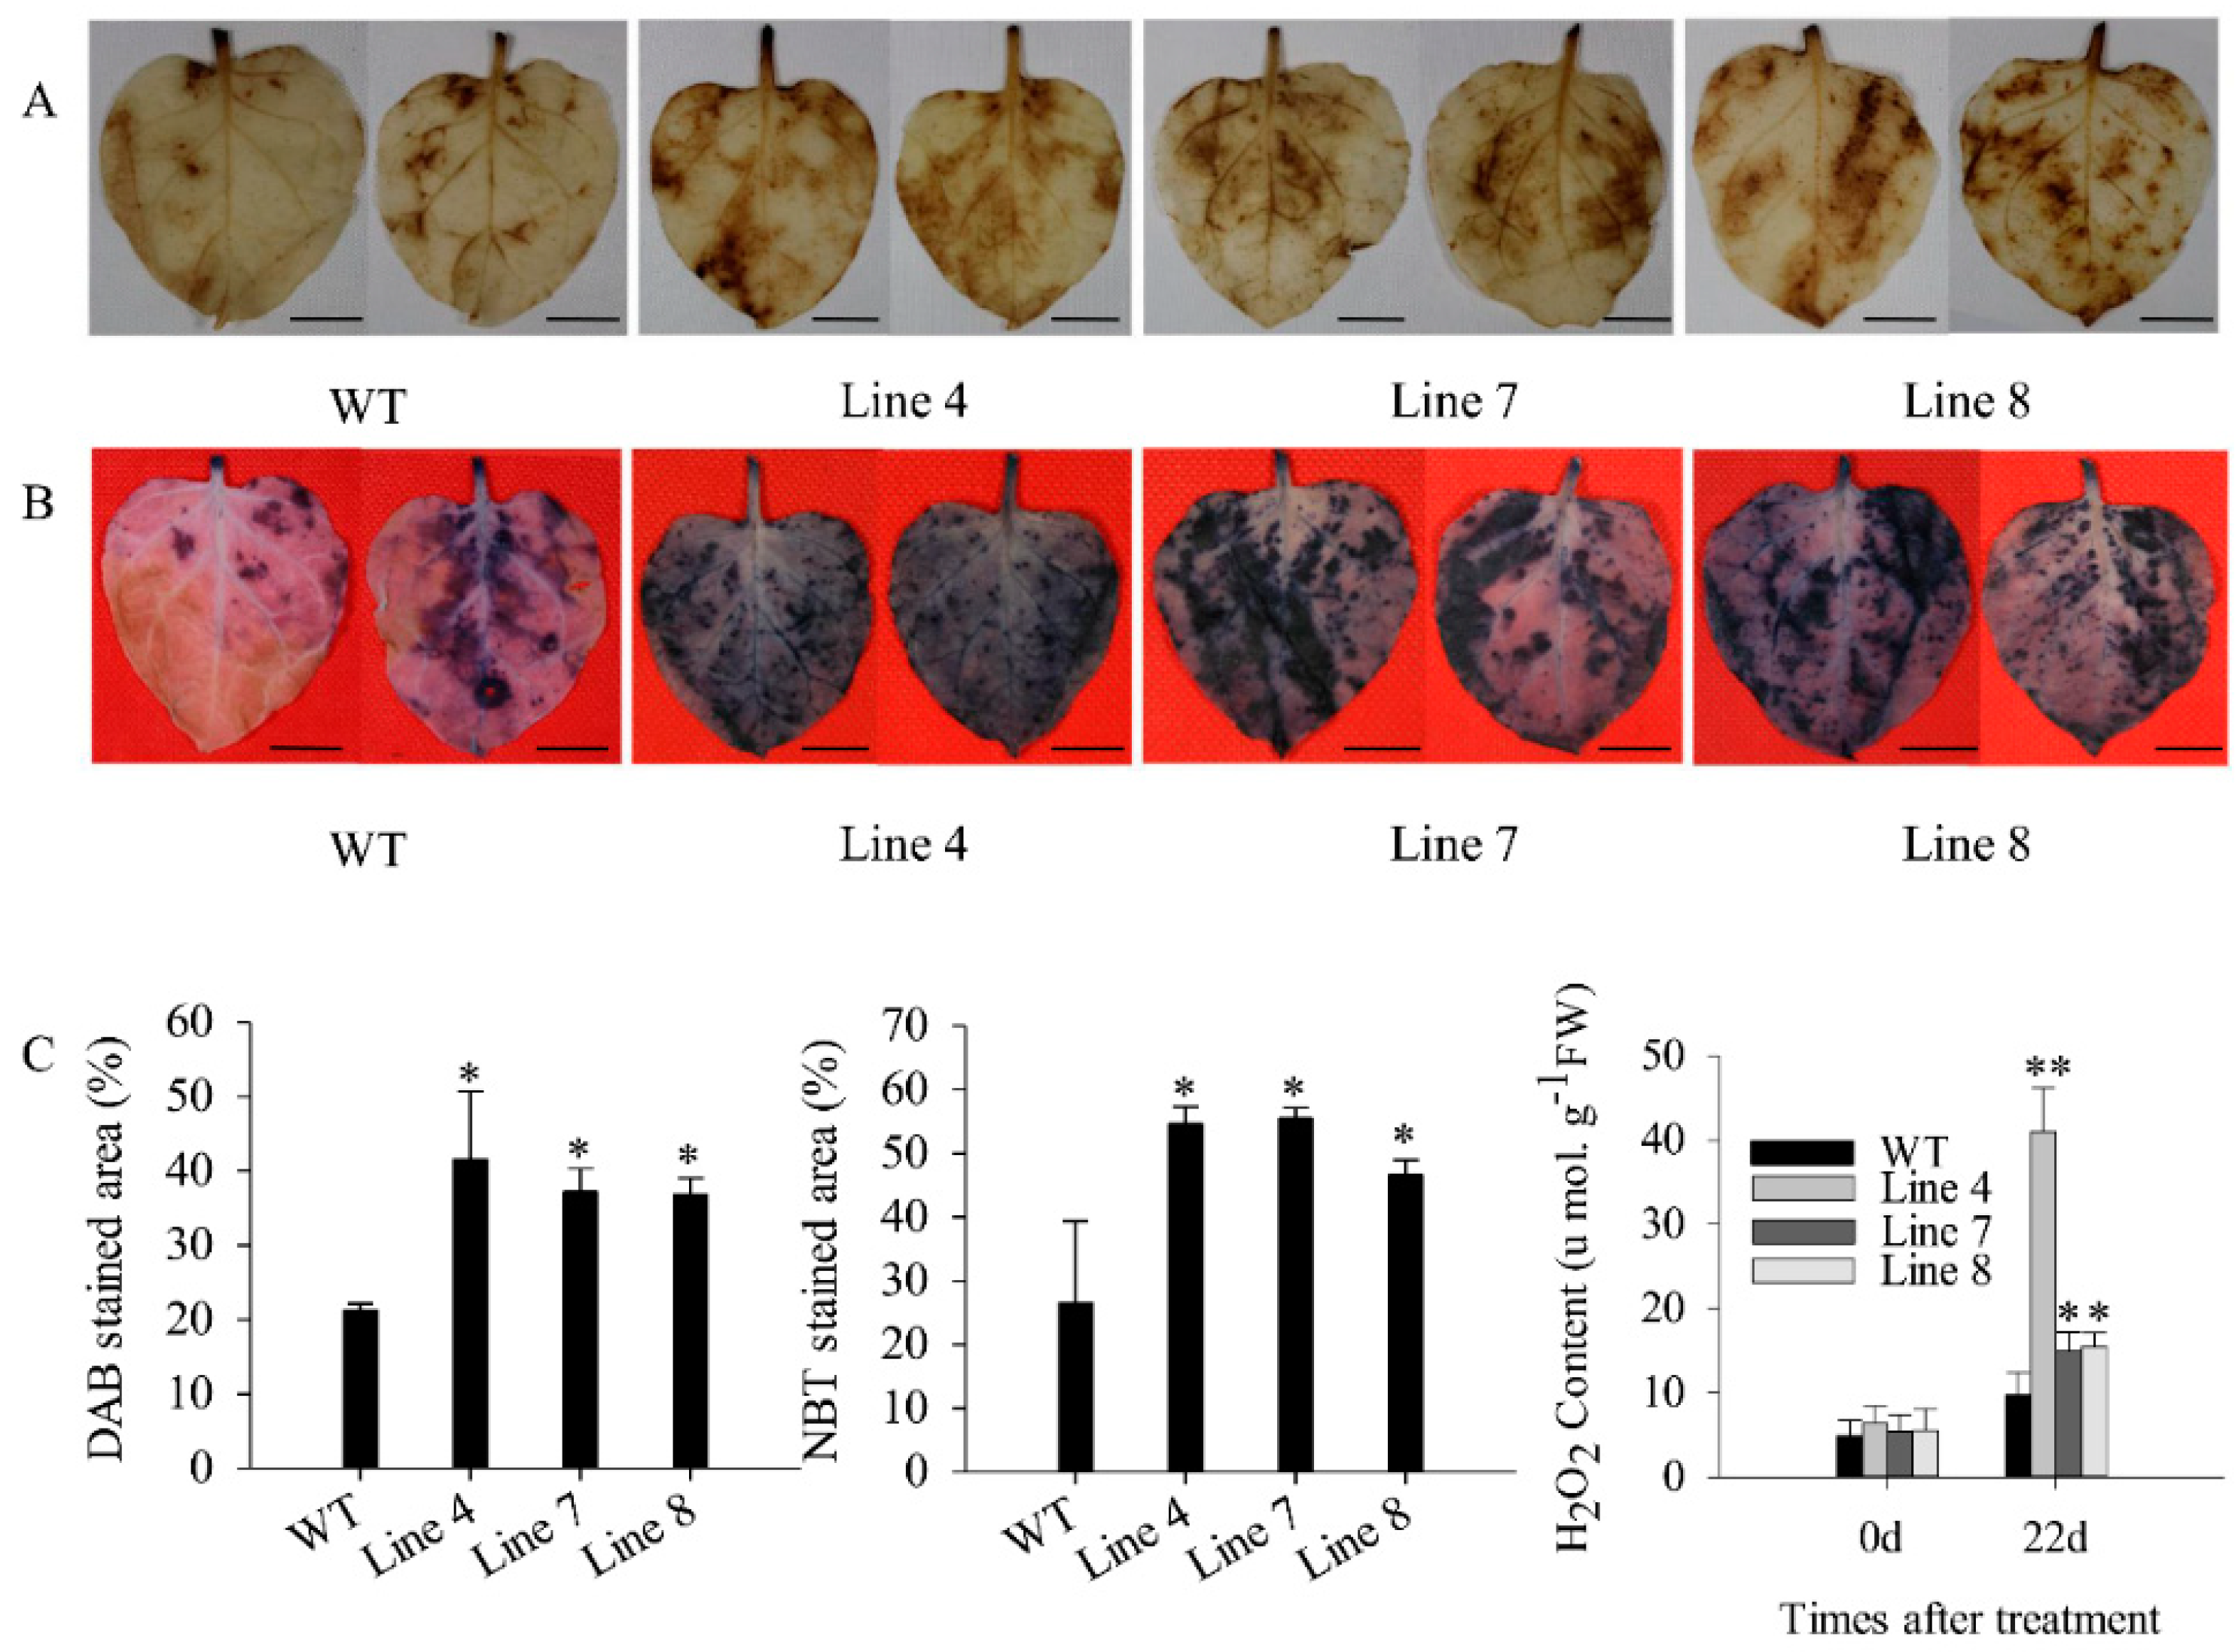
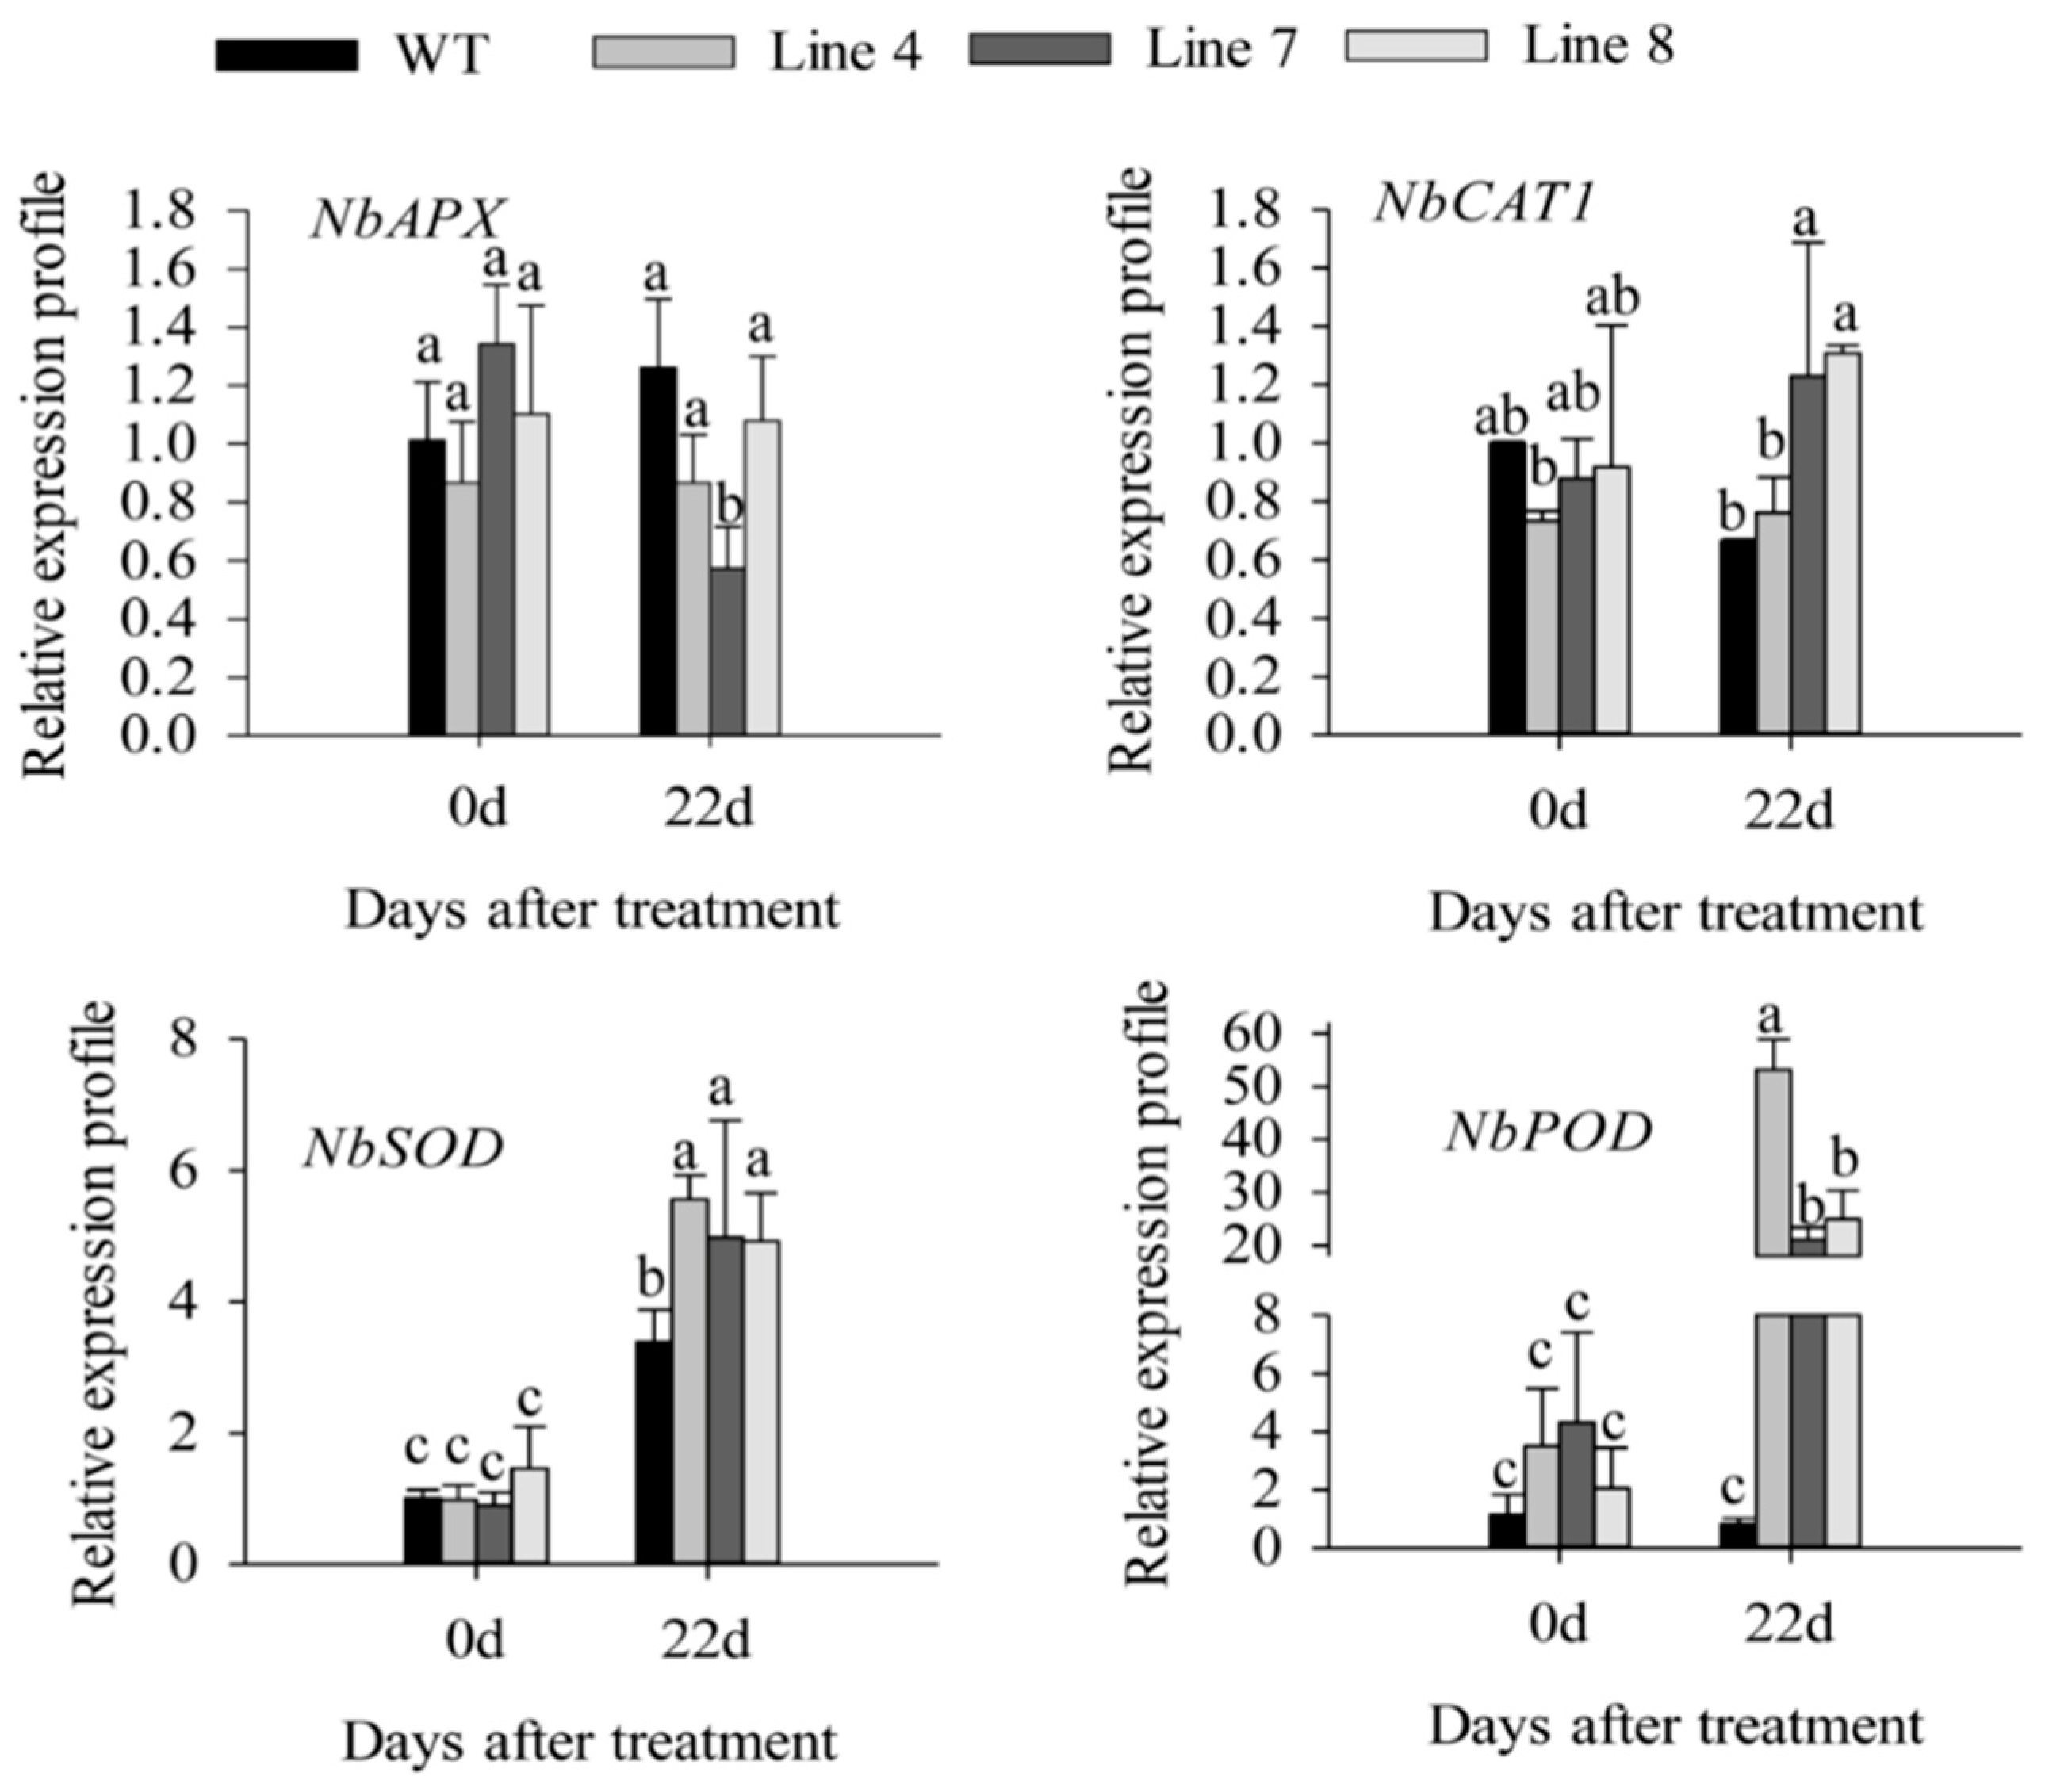
2.3. Overexpression of CaSBP12 in Nicotiana Benthamiana Enhanced Susceptibility to Salt Stress

In order to further confirm the role of CaSBP12 in plant defense response to salt stress, we generated transformed Nicotiana benthamiana plants overexpressing CaSBP12, as the stable transformation of pepper plants remains challenging. Three transgenic lines were randomly selected for this study. The CaSBP12 gene was significantly expressed in transgenic lines as compared with wild-type (WT) (Supplementary Figure S4). After 22 days of salt treatment, yellowing appeared in the leaves of both transgenic and wild-type lines (Figure 6A). However, almost the whole leaves of transgenic lines was severe yellowed or some of them appeared albinism, while the yellowing of wild-type lines was not obvious, or only the lower leaves were yellowing (Figure 6A). Besides, the total chlorophyll content of transgenic lines was significantly lower than that of wild-type lines (Figure 6B). During salt stress, there was no difference in relative water content between transgenic and wild-type lines, as compared with those without salt stress (Figure 6C). The Na+, MDA content, and conductivity were significantly increased in transgenic and wild-type lines, and they were higher in the transgenic lines than that in the wild-type lines (Figure 6D–F). However, there was no significant difference in the expression of NbSOS1 (ion transport gene) between transgenic and wild-type lines without any treatment (Supplementary Figure S5). After 22 days of salt stress, the damage symptoms in the transgenic (line 4, line 7, and line 8) and wild-type plants were divided into four levels. Level 0: no symptoms; Level 1: yellowing of lower leaves of plants; Level 2: the whole plant is yellowing and the edge of leaves is decolorized seriously; Level 3: whole plant yellowing and growth point death (Figure 6G). Then, the damage severity index percentage was calculated. As shown in Figure 6H, the damage severity index percentage of transgenic lines was significantly higher than that of wild-type lines. The detail data of damage severity index percentage was supplied in Supplementary Table S1.
Besides, the DAB and NBT stained area of transgenic lines was significantly larger than that of wild-type lines (Figure 7A–C). In addition, the H2O2 content in the transgenic lines was significantly higher than that of wild-type lines (Figure 7C). After 22 days of salt stress, the expression of NbSOD (SGN locus: Niben101Scf09401g00007.1) and NbPOD (SGN locus: Niben101Scf01124g05002.1) was induced in the transgenic lines, and was higher than that in wild-type lines (Figure 8). However, the expression of NbAPX (GenBank accession number: AB610799.1) and NbCAT1 (GenBank accession number: EU998969.1) showed no significant change compared with day 0 (Figure 8). These results indicated that overexpression of CaSBP12 in Nicotiana Benthamiana enhanced susceptibility to salt stress.

3. Discussion

The SBP-box gene family is composed of plant-specific transcription factors encoding proteins that contain a highly conserved SBP domain [14]. They play significant roles in plant growth and development, biosynthesis of gibberellic acid (GA), endoplasmic reticulum (ER) stress signaling, and response to biotic and abiotic stress [19,23,29,30,31]. Although these functions of the SBP-box gene have been investigated to some extent in other plants, the function of SBP-box genes in pepper, especially in abiotic stress has not been studied so far.
Previous studies have shown that CaSBP12 gene is located in the nucleus and plays a negative role in the defense response of pepper to Phytophthora capsici infection [20]. Here we found that it can be induced at the early stage of salt stress and inhibited in the later stage (Supplementary Figure S1). In order to identify whether the CaSBP12 gene is involved in salt stress, we silenced it in pepper plants. There is no phenotypic difference between CaSBP12-silenced and control plants under normal conditions (Figure 1A). It has been reported that most of the SBP-box genes play an important role in plant morphogenesis, growth, and development. For example, knockout AtSPL8 affects megasporogenesis, trichome formation on sepals, and stamen filament elongation in Arabidopsis [32]. The petiole and leaf margin serration of Arabidopsis was elongated and enhanced respectively, as the mutation of AtSPL14 [19]. However, there was no phenotypic difference between CaSBP12-silenced and control plants. This may be due to the fact that gene silencing does not completely disable the function of the gene as gene mutation does, or that CaSBP12 does not play a role in pepper growth and development. However, this requires further experimental verification. The detached leaves of CaSBP12-silenced plants were more tolerant to salt stress than those of control plants (Figure 2). Besides, with the increase of salt concentration, the accumulation of Na+ also increased, while the net photosynthetic rate was decreased (Figure 2). Salt stress has three-fold effects, viz., it reduces water potential and causes ion imbalance or disturbances in ion homeostasis and toxicity [33]. Salt toxicity is one of the reasons for the decrease of photosynthetic rate [33]. In addition, we found that the expression of ion transport genes (CaSOS1, CaHKT2-1, and CaHKT2-2) in CaSBP12-silenced plants was suppressed without any treatment (Supplementary Figure S3). However, there was no significant difference in the expression of NbSOS1 between transgenic and wild-type lines without any treatment (Supplementary Figure S5). Therefore, CaSBP12 may suppress Na+ uptake in CaSBP12-silenced plants by inhibiting the expression of sodium transport gene, but this needs further experimental verification. The accumulation of H2O2 and O2 in the detached leaves of CaSBP12-silenced plants was less than that in the detached leaves of control plants (Figure 3). It has been reported that abiotic stress is related to ROS signaling pathway. For example, overexpression of VpSBP16 in Arabidopsis enhances tolerance of salt stress during seed germination, as well in seedlings and mature plants, by regulating ROS signaling cascades [4]. Overexpression of BpSPL9 improved scavenging of ROS by activation of peroxidase (POD) and superoxide dismutase (SOD) enzymes, and enhanced the plant’s tolerance to salt and drought stress [23]. CaHsp25.9 may play a positive role in reducing the accumulation of ROS, and positively regulate the tolerance to heat, salt, and drought stress in pepper plants [1]. Besides, it has been reported that superoxide dismutase (SOD), catalase (CAT), ascorbate peroxidase (APX), glutathione peroxidase (GPX), and perox-iredoxin (PrxR) is the major ROS-scavenging enzymes of plants [34]. In addition, the “classical” plant peroxidases (class III) regulates the scavenging of H2O2 [34,35,36]. Therefore, we detected the expression of CaAPX1, CaCAT2, CaSOD, and CaPOD, which are related to ROS-scavenging enzymes after 3 days of salt stress. The expression of these genes was induced in CaSBP12-silenced plants except for CaCAT2 (Figure 5). The expression of CaCAT2 was decreased in CaSBP12-silenced and control plants on day 3 (Figure 5). Moreover, these genes, expression in CaSBP12-silenced plants was higher than that in control plants, except for the expression of CaPOD (Figure 5). In addition, the expression of CaSBP12 was decreased in CaSBP12-silenced and control plants (Figure 5). It has been reported that there is a strong link between ROS signaling, the redox network of cells, and the different antioxidant pools in different cells [37]. The double mutant deficient in APX1 and CAT2 in Arabidopsis, and APX1 and CAT1 in tobacco (Nicotiana tabacum) is more tolerant to different environmental conditions compared with wild type, and the single apx or cat mutants [38,39]. In order to further confirm the role of CaSBP12 in plant defense response to salt stress, we generated transformed N. benthamiana plants overexpressing CaSBP12. The overexpression of CaSBP12 transgenic lines was more sensitive to salt stress compared to wild-type lines with a higher damage severity index percentage (Figure 6). Besides, after 22 days of salt stress, the transgenic lines showed serious yellowing, and some leaves even showed albinism and death (Figure 6A). In addition, the accumulation of Na+ in the transgenic lines was more than that in the wild-type lines (Figure 6D). It has been reported that the mechanisms of salt stress damage include osmotic stress and ion toxicity [40]. The high concentration of salt in the soil reduces the water potential of the soil, makes it difficult for plants to absorb water, and even causes the water in plants to seep out, thus causing water deficit and osmotic stress in plants [40]. However, in this study, with the increase of salt treatment time, the relative water content of transgenic lines did not change significantly (Figure 6C). Besides, severe salt stress usually inhibits plant growth and even causes plant death [33]. Therefore, after 22 days of salt stress, it is mainly ion toxicity. The accumulation of ROS in the transgenic lines was more than that in the wild-type lines (Figure 7). The expression of NbPOD and NbSOD was highly induced, especially in transgenic lines (Figure 8). It is worth noting that the expression of CaSOD in the CaSBP12-silenced plants is higher than that in the control plants after 3 days of salt treatment (Figure 5), which is not consistent with the trend of the expression of NbSOD in transgenic lines. This may be due to the complex defense system evolved by plants themselves against biotic and abiotic stresses. In addition, after abiotic stress, plants produce active oxygen that activates some active oxygen scavenging enzymes. The APX, CAT, POD, and SOD are major active oxygen scavenging enzymes. SOD converts superoxide radicals into hydrogen peroxide, CAT and POD decompose hydrogen peroxide into water, these three enzymes form a complete anti-oxidation chain [41]. It has been reported that overexpression of BpSPL9 in Betula platyphylla Suk. improved the ROS scavenging ability under salt stress though the activation of POD and SOD [23]. Silencing the PEROXIDASE2, CaPO2, in pepper compromised H2O2 accumulation, both locally and systemically, during avirulent Xcv infection [42]. Besides, CaPO2 peroxidase is involved in ROS generation, both locally and systemically, to activate cell death and PR gene induction during the defense response to pathogen invasion [42]. Therefore, we speculate that CaSBP12 regulating plant tolerance to salt stress may be related to ROS, and this needs further experimental verification.

4. Materials and Methods

4.1. Plant Materials and Growth Conditions

Pepper cultivar AA3 provided by the Capsicum Research Group, College of Horticulture, Northwest A&F University, P. R. China and N. benthamiana were used in this study. Pepper plants were grown in a growth chamber at 22 °C (day for 16 h)/18 °C (night for 8 h) and a relative humidity of 80%. N. benthamiana plants were grown in a growth chamber at 25 °C (day for 16 h)/18 °C (night for 8 h) and a relative humidity of 60%.

4.2. Virus-Induced Gene Silencing (VIGS) of CaSBP12 Gene in Pepper

The tobacco rattle virus (TRV)-based VIGS system was used for silencing the CaSBP12 gene in pepper, following the method described by Wang (2013) [28]. To generate the VIGS plasmid construction of CaSBP12 gene, a 250-bp fragment of CaSBP12 was amplified using their specific primer (Supplementary Table S2). The obtained product was cloned into the TRV2 vectors using the double digested method with BamHI and KpnI enzymes. Then, it was sequenced through Sangon Biotech Company (Shanghai, China). The recombined vector (TRV2:CaSBP12), TRV2:00 (negative control), TRV2:CaPDS (phytoenedesaturase, positive control), and TRV1 were transformed into Agrobacterium tumefaciens strain GV3101 using the freeze-thaw method. Pepper seedlings at two true leaves stage were used for the silencing of CaSBP12 gene using the method described by Zhang et al. (2013) [43]. The injected plants were first grown in a growth chamber at 18 °C in dark for 2 days, and then grown in a growth chamber at 22 °C (day for 16 h)/18 °C (night for 8 h) with 60% relative humidity. Forty days post-infiltration, leaves from the control and silenced plants were collected to measure the silencing efficiency.

4.3. Nicotiana Benthamiana Transformation

The full encoding regions (900-bp) of CaSBP12 was cloned into the PBI121:GUS vector with XbaI and BamHI restriction enzyme sites to yield the final plasmid PBI121:CaSBP12:GUS for genetic transformation (Supplementary Table S2). Over expression lines of CaSBP12 were obtained by Agrobacterium-mediated tobacco leaf disc transformation method [44]. Three kanamycin-resistant lines of transgenic N. benthamiana plants harboring the PBI121:CaSBP12:GUS construct were selected. Besides, they were confirmed using quantitative real-time PCR during T1 generation (Supplementary Table S3). Seeds of T1 plants were obtained from regenerated T0 plants, and seedlings of T2 lines were further selected on MS agar plates containing 50µg/mL kanamycin. T3 plants were used for further analyses.

4.4. Stress Treatments and Samples Collection

For detecting the expression of CaSBP12 gene in pepper under salt stress, pepper plants at the stage of 6–8 true leaves were removed from the substrate (matrix, vermiculite, and perlite mixed at 3:1:1 ratio) and cultured in 1/2 Hoagland’s solution. After culturing for 5 days, the plants were treated with 400 mM NaCl with 1/2 Hoagland’s solution. The control plant was cultured in 1/2 Hoagland’s solution only [45]. Leaves were harvested at 0 h, 2 h, 4 h, 8 h, 12 h, 24 h and store at −80 °C.
For salt stress, the detached leaves of TRV2:CaSBP12 and control plants were treated with 200 mM NaCl, 400 mM NaCl, and 600 mM NaCl solution for 2 days. The detached leaves of TRV2:CaSBP12 and TRV2:00 plants were treated with 400 mM NaCl solution for 2 days. The plants of TRV2:CaSBP12 and control were soaked in 400 mM NaCl for three days [1,46]. Besides, the total chlorophyll content was measured, and the samples were collected at day 0 and day 3 and stored at −80 °C.
Salt stress on transgenic lines was done according to the modified method described by Liu et al. (2017) [2]. Each plant was planted in an independent basin (same basins were used), 11 or 10 plants of wild-type and CaSBP12 transgenic lines were placed in a big pot and watered once a week to make sure the soil water in every basin was uniform and all the plants were grown in the same conditions. After three weeks, the wild-type and transgenic lines were watered with 200 mM NaCl every week (1000 mL per pot) for up to 22 days. The relative water content (RWC) and the total chlorophyll content was measured during treatment [47]. Samples were collected at day 0 and day 22, and stored at −80 °C.

4.5. RNA Extraction and Quantitative Real-Time PCR (qPCR)

Total RNA was isolated using the method described by Guo et al. (2012) [48]. The first chain was synthesized using Prime Script Kit (Takara, Dalian, China) following the manufacturer’s instructions. The cDNA concentration was diluted to 50 ng/µL and used for qPCR. Here, we provide the qPCR experiments as described by Bustin et al. (2009) [49]. The iQ5.0 Bio-Rad iCycler thermocycler (Bio-Rad, Hercules, CA, USA) machine was used for qPCR using the procedure described by Zhang et al. (2018) [20]. Briefly, the qPCR cycling conditions are as follows: pre-denaturation at 95 °C for 1 min, followed by 40 cycles of denaturation at 95 °C for 10 s, annealing at 56 °C for 30 s, and extension at 72 °C for 30 s. The fluorescent signal was measured at the end of each cycle, and melting curve analysis was performed by heating the PCR product from 56 to 95 °C in order to verify the specificities of the primers. The pepper actin mRNA, CaActin2 (accession no. AY572427), was used as the reference in pepper [50]. The Nicotiana benthamiana actin gene, Nbactin-97 (accession No. LOC109206422), was used as reference in Nicotiana benthamiana [51]. All the primer specificities used for the qPCR were evaluated using NCBI Primer BLAST (Supplementary Table S3). The details of the length of per gene amplification, the location of the primer were supplied in Supplementary Table S3. Gene expression was quantified following the 2−△△CT method [52]. For example, the mean CT of the CaSBP12 gene in untreated and treated samples was 26.34 and 29.64, respectively. The mean CT of the reference gene (CaActin2) in the untreated and treated samples was 20.78 and 21.41, respectively. The relative expression profile of CaSBP12 can be calculated using the following formula:
The relative expression profile of CaSBP12 = 2^(−[(29.64 − 21.41) − (26.34 − 20.78)])

4.6. Measurement of Physiological Indicators

The H2O2 and O2 radical level was analyzed by DAB and NBT staining [53,54,55]. The quantification of the DAB, NBT stained area, and water-stained area was obtained using the method described by Sekulska-nalewajko et al. (2016) [56]. The H2O2 content was measured following the method described by Liu et al. (2010) [57]. The Na+ content was measured following the method described by Li (2015) [58]. The net photosynthetic rate (Pn) was measured using an American photosynthetic apparatus CIRAS-3. The malondialdehyde (MDA) and conductivity was measured using the method described by Ma et al. (2013) [20] and Kim et al. (2015) respectively [59]. The RWC were determined using the method described by Pan et al. (2012) [47]. The total chlorophyll content was measured using the method described by Arkus et al. (2005) [60].

4.7. Damage Severity Index Percentage Statistics

After 22 days of salt stress, the damage severity index percentage of plants was calculated. According to the damage severity of plants, the damage symptoms in the transgenic and wild-type plants were divided into four levels. They are as follows: Level 0: no symptoms; Level 1: yellowing of lower leaves of plants; Level 2: the whole plant is yellowing and the edge of leaves is decolorized seriously; Level 3: whole plant yellowing and growth point death. The damage severity index percentage was calculated using the following formula:
Damage severity index percentage = [(∑the numerical grade of damage × number of damage plants of this grade)/(the highest grade of damage × total number of surveys)] × 100

4.8. Statistical Analysis

Statistical analysis was performed using the data processing system (DPS7.05, China) for one-way analysis of variance (ANOVA) [20]. The value p ≤ 0.05 or p ≤ 0.01 was considered to be significantly different. All experiments were performed and analyzed separately with at least three biological replicates.

5. Conclusions

In a conclusion, the CaSBP12 gene was induced by salt stress in pepper. Silencing the CaSBP12 gene enhanced the tolerance to salt stress, and reduced the accumulation of ROS compared with the control plants in pepper. Overexpression CaSBP12 gene in N. benthamiana enhanced plants’ sensitive to salt stress and the accumulation of ROS compared to wild-type plants. Besides, the expression of NbPOD and NbSOD was highly induced in transgenic plants than that in wild-type plants. These results indicated that CaSBP12 plays a negatively role in plant tolerance to salt stress. Besides, CaSBP12 regulating plant tolerance to salt stress may be related to ROS, and this needs further experimental verification.

Supplementary Materials

Supplementary materials can be found at https://www.mdpi.com/1422-0067/21/2/444/s1.

Author Contributions

H.-X.Z. and Z.-H.G. conceived and designed the research. H.-X.Z., X.-H.F., and J.-H.J. conducted experiments. H.-X.Z. analyzed data. H.-X.Z. wrote the manuscript. Z.-H.G., W.-C.Z., A.-M.W. contributed reagents/materials/analysis tools. All authors have read and agreed to the published version of the manuscript.

Funding

This work was supported through funding from National Key R& D Program of China (No. 2016YFD0101900) and the National Natural Science Foundation of China (No. U1603102).

Conflicts of Interest

The authors declare that they have no conflict of interest.

References

  1. Feng, X.H.; Zhang, H.X.; Ali, M.; Gai, W.X.; Cheng, G.X.; Yu, Q.H.; Yang, S.B.; Li, X.X.; Gong, Z.H. A small heat shock protein CaHsp25.9 positively regulates heat, salt, and drought stress tolerance in pepper (Capsicum annuum L.). Plant Physiol. Biochem. 2019, 142, 151–162. [Google Scholar] [CrossRef] [PubMed]
  2. Liu, Y.; Huang, W.; Xian, Z.; Hu, N.; Lin, D.; Ren, H.; Chen, J.; Su, D.; Li, Z. Overexpression of SlGRAS40 in tomato enhances tolerance to abiotic stresses and influences auxin and gibberellin signaling. Front. Plant Sci. 2017, 8, 1–17. [Google Scholar] [CrossRef] [PubMed]
  3. Ngoc, T.; Le, N.; Thia, H.; Sao, D.; Nguyen, M.; Tuan, V. Overexpression of NbWRKY79 enhances salt stress tolerance in Nicotiana benthamiana. Acta Physiol. Plant 2017, 39, 121. [Google Scholar]
  4. Hou, H.; Jia, H.; Yan, Q.; Wang, X. Overexpression of a SBP-box gene (VpSBP16) from chinese wild vitis species in Arabidopsis improves salinity and drought stress tolerance. Int. J. Mol. Sci. 2018, 19, 940. [Google Scholar] [CrossRef] [PubMed] [Green Version]
  5. Hirayama, T.; Shinozaki, K. Research on plant abiotic stress responses in the post-genome era: Past, present and future. Plant J. 2010, 61, 1041–1052. [Google Scholar] [CrossRef]
  6. Singh, K.B.; Foley, R.C.; Oñate-Sánchez, L. Transcription factors in plant defense and stress responses. Curr. Opin. Plant Biol. 2002, 5, 430–436. [Google Scholar] [CrossRef]
  7. Yang, O.; Popova, O.V.; Süthoff, U.; Lüking, I.; Dietz, K.J.; Golldack, D. The Arabidopsis basic leucine zipper transcription factor AtbZIP24 regulates complex transcriptional networks involved in abiotic stress resistance. Gene 2009, 436, 45–55. [Google Scholar] [CrossRef]
  8. Ren, X.; Chen, Z.; Liu, Y.; Zhang, H.; Zhang, M.; Liu, Q.; Hong, X.; Zhu, J.K.; Gong, Z. ABO3, a WRKY transcription factor, mediates plant responses to abscisic acid and drought tolerance in Arabidopsis. Plant J. 2010, 63, 417–429. [Google Scholar] [CrossRef] [Green Version]
  9. Jiang, Y.; Deyholos, M.K. Functional characterization of Arabidopsis NaCl-inducible WRKY25 and WRKY33 transcription factors in abiotic stresses. Plant Mol. Biol. 2009, 69, 91–105. [Google Scholar] [CrossRef]
  10. Chen, H.; Lai, Z.; Shi, J.; Xiao, Y.; Chen, Z.; Xu, X. Roles of Arabidopsis WRKY18, WRKY40 and WRKY60 transcription factors in plant responses to abscisic acid and abiotic stress. BMC Plant Biol. 2010, 10, 281. [Google Scholar] [CrossRef] [Green Version]
  11. Ding, Z.; Li, S.; An, X.; Liu, X.; Qin, H.; Wang, D. Transgenic expression of MYB15 confers enhanced sensitivity to abscisic acid and improved drought tolerance in Arabidopsis thaliana. J. Genet. Genom. 2009, 36, 17–29. [Google Scholar] [CrossRef]
  12. Abe, H.; Urao, T.; Ito, T.; Seki, M.; Shinozaki, K. Transcriptional activators in abscisic acid signaling. Society 2003, 15, 63–78. [Google Scholar]
  13. Hsieh, T.H.; Li, C.W.; Su, R.C.; Cheng, C.P.; Tsai, Y.C.; Chan, M.T. A tomato bZIP transcription factor, SlAREB, is involved in water deficit and salt stress response. Planta 2010, 231, 1459–1473. [Google Scholar] [CrossRef]
  14. Klein, J.; Saedler, H.; Huijser, P. A new family of DNA binding proteins includes putative transcriptional regulators of the Antirrhinum majus floral meristem identity gene SQUAMOSA. Mol. Gen. Genet. 1996, 250, 7–16. [Google Scholar] [PubMed]
  15. Yamasaki, K.; Kigawa, T.; Inoue, M.; Tateno, M.; Yamasaki, T.; Yabuki, T.; Aoki, M.; Seki, E.; Matsuda, T.; Nunokawa, E.; et al. A Novel Zinc-binding motif revealed by solution structures of DNA-binding domains of Arabidopsis SBP-family transcription factors. J. Mol. Biol. 2004, 337, 49–63. [Google Scholar] [CrossRef]
  16. Zhang, H.-X.; Jin, J.-H.; He, Y.-M.; Lu, B.-Y.; Li, D.-W.; Chai, W.-G.; Khan, A.; Gong, Z.-H. Genome-wide identification and analysis of the SBP-Box family genes under Phytophthora capsici stress in pepper (Capsicum annuum L.). Front. Plant Sci. 2016, 7, 1–14. [Google Scholar] [CrossRef] [Green Version]
  17. Jung, J.H.; Ju, Y.; Seo, P.J.; Lee, J.H.; Park, C.M. The SOC1-SPL module integrates photoperiod and gibberellic acid signals to control flowering time in Arabidopsis. Plant J. 2012, 69, 577–588. [Google Scholar] [CrossRef]
  18. Yang, R.; Li, P.; Mei, H.; Wang, D.; Sun, J.; Yang, C.; Hao, L.; Cao, S.; Chu, C.; Hu, S.; et al. Fine-tuning of MiR528 accumulation modulates flowering time in rice. Mol. Plant 2019, 12, 1103–1113. [Google Scholar] [CrossRef] [Green Version]
  19. Stone, J.M.; Liang, X.; Nekl, E.R.; Stiers, J.J. Arabidopsis AtSPL14, a plant-specific SBP-domain transcription factor, participates in plant development and sensitivity to fumonisin B1. Plant J. 2005, 41, 744–754. [Google Scholar] [CrossRef] [Green Version]
  20. Zhang, H.; Ali, M.; Feng, X.; Jin, J.; Huang, L.; Khan, A.; Lv, J.; Gao, S.; Luo, D.; Gong, Z. A novel transcription factor CaSBP12 gene negatively regulates the defense response against Phytophthora capsici in pepper (Capsicum annuum L.). Int. J. Mol. Sci. 2018, 20, 48. [Google Scholar] [CrossRef] [Green Version]
  21. Yao, S.; Yang, Z.; Yang, R.; Huang, Y.; Guo, G.; Kong, X.; Lan, Y.; Zhou, T.; Wang, H.; Wang, W.; et al. Transcriptional regulation of miR528 by OsSPL9 orchestrates antiviral response in rice. Mol. Plant 2019, 12, 1114–1122. [Google Scholar] [CrossRef] [PubMed]
  22. Lan, T.; Zheng, Y.; Su, Z.; Yu, S.; Song, H.; Zheng, X.; Lin, G.; Wu, W. OsSPL10, a SBP-Box gene, plays a dual role in salt tolerance and trichome formation in rice (Oryza sativa L.). Genes Genomes Genet. 2019, 9, 4107–4114. [Google Scholar] [CrossRef] [PubMed] [Green Version]
  23. Ning, K.; Chen, S.; Huang, H.; Jiang, J.; Yuan, H.; Li, H. Molecular characterization and expression analysis of the SPL gene family with BpSPL9 transgenic lines found to confer tolerance to abiotic stress in Betula platyphylla Suk. Plant Cell. Tissue Organ. Cult. 2017, 130, 469–481. [Google Scholar] [CrossRef]
  24. Filichkin, S.A.; Ansariola, M.; Fraser, V.N.; Megraw, M. Identification of transcription factors from NF-Y, NAC, and SPL families responding to osmotic stress in multiple tomato varieties. Plant Sci. 2018, 274, 441–450. [Google Scholar] [CrossRef]
  25. Stief, A.; Altmann, S.; Hoffmann, K.; Pant, B.D.; Scheible, W.R.; Bäurle, I. Arabidopsis miR156 regulates tolerance to recurring environmental stress through SPL transcription factors. Plant Cell 2014, 26, 1792–1807. [Google Scholar] [CrossRef] [Green Version]
  26. Cui, N.; Sun, X.; Sun, M.; Jia, B.; Duanmu, H.; Lv, D.; Duan, X.; Zhu, Y. Overexpression of OsmiR156k leads to reduced tolerance to cold stress in rice (Oryza Sativa). Mol. Breed. 2015, 35, 1–11. [Google Scholar] [CrossRef]
  27. Arshad, M.; Feyissa, B.A.; Amyot, L.; Aung, B.; Hannoufa, A. MicroRNA156 improves drought stress tolerance in alfalfa (Medicago sativa) by silencing SPL13. Plant Sci. 2017, 258, 122–136. [Google Scholar] [CrossRef]
  28. Wang, J.E. Expression Analysis and Functional Identification of CaRGA1 and CaPOD Genes Induced by Phytophthora Capsici in Pepper; Institute of Horticulture, Northwest A&F University: Yangling, China, 2013. [Google Scholar]
  29. Wang, Q.; Sun, A.-Z.; Chen, S.-T.; Chen, L.-S.; Guo, F.-Q. SPL6 represses signalling outputs of ER stress in control of panicle cell death in rice. Nat. Plants 2018, 4, 280. [Google Scholar] [CrossRef]
  30. Shikata, M.; Yamaguchi, H.; Microrna, Á.; Molecular, Á. Overexpression of Arabidopsis miR157b induces bushy architecture and delayed phase transition in Torenia fournieri. Planta 2012, 236, 1027–1035. [Google Scholar] [CrossRef]
  31. Zhang, Y.; Schwarz, S.; Saedler, H.; Huijser, P. SPL8, a local regulator in a subset of gibberellin-mediated developmental processes in Arabidopsis. Plant Mol. Biol. 2007, 63, 429–439. [Google Scholar] [CrossRef] [Green Version]
  32. Unte, U.S.; Sorensen, A.; Pesaresi, P.; Gandikota, M.; Leister, D.; Saedler, H.; Huijser, P. SPL8, an SBP-Box gene that affects pollen sac development in Arabidopsis. Plant Cell. 2003, 15, 1009–1019. [Google Scholar] [CrossRef] [PubMed] [Green Version]
  33. Parida, A.K.; Das, A.B. Salt tolerance and salinity effects on plants: A review. Ecotoxicol. Environ. Saf. 2005, 60, 324–349. [Google Scholar] [CrossRef] [PubMed]
  34. Mittler, R.; Vanderauwera, S.; Gollery, M.; Breusegem, F. Van Reactive oxygen gene network of plants. Trends Plant Sci. 2004, 9, 490–498. [Google Scholar] [CrossRef] [PubMed]
  35. Hiraga, S.; Sasaki, K.; Ito, H.; Ohashi, Y.; Matsui, H. Large family of class III plant peroxidases. Plant Cell Physiol. 2001, 42, 462–468. [Google Scholar] [CrossRef] [PubMed] [Green Version]
  36. Tognolli, M.; Penel, C.; Greppin, H.; Simon, P. Analysis and expression of the class III peroxidase large gene family in Arabidopsis thaliana. Gene 2002, 288, 129–138. [Google Scholar] [CrossRef]
  37. Mittler, R.; Vanderauwera, S.; Suzuki, N.; Miller, G.; Tognetti, V.B.; Vandepoele, K.; Gollery, M.; Shulaev, V.; Breusegem, F. Van ROS signaling: The new wave? Trends Plant Sci. 2011, 16, 300–309. [Google Scholar] [CrossRef]
  38. Vanderauwera, S.; Suzuki, N.; Miller, G.; Van De Cotte, B.; Morsa, S.; Ravanat, J.L.; Hegie, A.; Triantaphylidès, C.; Shulaev, V.; Van Montagu, M.C.E.; et al. Extranuclear protection of chromosomal DNA from oxidative stress. Proc. Natl. Acad. Sci. USA 2011, 108, 1711–1716. [Google Scholar] [CrossRef] [Green Version]
  39. Rizhsky, L.; Hallak-herr, E.; Van Breusegem, F.; Rachmilevitch, S.; Barr, J.E.; Rodermel, S.; Mittler, R. Double antisense plants lacking ascorbate peroxidase and catalase are less sensitive to oxidative stress than single antisense plants lacking ascorbate peroxidase or catalase. Plant J. 2002, 32, 329–342. [Google Scholar] [CrossRef] [Green Version]
  40. Lv, B.S. Physiological and molecular mechanisms in response to saline-alkaline stress in rice (Oryza sativa L.). In Northeast Institute of Geography and Agroecology; Chinese Academy of Sciences: Changchun, China, 2014. [Google Scholar]
  41. Shang-kun, W. Effects of polyamines and their synthetic inhibitors on the activities of SOD, POD and CAT in leaves of Prunus L. seedlings under drought stress. J. Shandong Agric. Univ. 2019, 50, 388–392. [Google Scholar]
  42. Oa, P.W.; Choi, H.W.; Kim, Y.J.; Lee, S.C.; Hong, J.K.; Hwang, B.K. Hydrogen peroxide generation by the pepper extracellular peroxidase CaPO2 activates local and systemic cell death and defense response. Plant Physiol. 2007, 145, 890–904. [Google Scholar]
  43. Zhang, Y.L.; Jia, Q.L.; Li, D.W.; Wang, J.E.; Yin, Y.X.; Gong, Z.H. Characteristic of the pepper CaRGA2 gene in defense responses against Phytophthora capsici leonian. Int. J. Mol. Sci. 2013, 14, 8985–9004. [Google Scholar] [CrossRef] [PubMed] [Green Version]
  44. Oh, S.K.; Jeong, M.P.; Young, H.J.; Lee, S.; Chung, E.; Kim, S.Y.; Seung, H.Y.; Choi, D. A plant EPF-type zinc-finger protein, CaPIF1, involved in defence against pathogens. Mol. Plant Pathol. 2005, 6, 269–285. [Google Scholar] [CrossRef] [PubMed]
  45. Yin, Y.X.; Guo, W.L.; Zhang, Y.L.; Ji, J.J.; Xiao, H.J.; Yan, F.; Zhao, Y.Y.; Zhu, W.C.; Chen, R.G.; Chai, W.G.; et al. Cloning and characterisation of a pepper aquaporin, CaAQP, which reduces chilling stress in transgenic tobacco plants. Plant Cell. Tissue Organ. Cult. 2014, 118, 431–444. [Google Scholar] [CrossRef]
  46. Zhai, Y.; Wang, H.; Liang, M.; Lu, M. Both silencing-and over-expression of pepper CaATG8c gene compromise plant tolerance to heat and salt stress. Environ. Exp. Bot. 2017, 141, 10–18. [Google Scholar] [CrossRef]
  47. Pan, Y.; Seymour, G.B.; Lu, C.; Hu, Z.; Chen, X.; Chen, G. An ethylene response factor (ERF5) promoting adaptation to drought and salt tolerance in tomato. Plant Cell Rep. 2012, 31, 349–360. [Google Scholar] [CrossRef] [PubMed]
  48. Guo, W.L.; Chen, R.G.; Gong, Z.H.; Yin, Y.X.; Ahmed, S.S.; He, Y.M. Exogenous abscisic acid increases antioxidant enzymes and related gene expression in pepper (Capsicum annuum) leaves subjected to chilling stress. Genet. Mol. Res. 2012, 11, 4063–4080. [Google Scholar] [CrossRef]
  49. Bustin, S.A.; Benes, V.; Garson, J.A.; Hellemans, J.; Huggett, J.; Kubista, M.; Mueller, R.; Nolan, T.; Pfaffl, M.W.; Shipley, G.L.; et al. The MIQE guidelines: Minimum information for publication of quantitative real-time PCR experiments. Clin. Chem. 2009, 55, 611–622. [Google Scholar] [CrossRef] [Green Version]
  50. Yin, Y.X.; Wang, S.B.; Zhang, H.X.; Xiao, H.J.; Jin, J.H.; Ji, J.J.; Jing, H.; Chen, R.G.; Arisha, M.H.; Gong, Z.H. Cloning and expression analysis of CaPIP1-1 gene in pepper (Capsicum annuum L.). Gene 2015, 563, 87–93. [Google Scholar] [CrossRef]
  51. Du, Y.; Berg, J.; Govers, F.; Bouwmeester, K. Immune activation mediated by the late blight resistance protein R1 requires nuclear localization of R1 and the effector AVR1. New Phytol. 2015, 207, 735–747. [Google Scholar] [CrossRef]
  52. Schmittgen, T.D.; Livak, K.J. Analyzing real-time PCR data by the comparative CT method. Nat. Protoc. 2008, 3, 1101–1108. [Google Scholar] [CrossRef]
  53. Kim, J.M.; Woo, D.H.; Kim, S.H.; Lee, S.Y.; Park, H.Y.; Seok, H.Y.; Chung, W.S.; Moon, Y.H. Arabidopsis MKKK20 is involved in osmotic stress response via regulation of MPK6 activity. Plant Cell Rep. 2012, 31, 217–224. [Google Scholar] [CrossRef] [PubMed]
  54. Thordal-Christensen, H.; Zhang, Z.; Wei, Y.; Collinge, D.B. Collinge-Subcellular localization of H2O2 in plants: H2O2 accumulation in papillae and hypersensitive response during the barley-powdery mildew interaction. Plant J. 1997, 11, 1187–1194. [Google Scholar] [CrossRef]
  55. Choi, H.W.; Hwang, B.K. The pepper extracellular peroxidase CaPO2 is required for salt, drought and oxidative stress tolerance as well as resistance to fungal pathogens. Planta 2012, 235, 1369–1382. [Google Scholar] [CrossRef] [PubMed]
  56. Sekulska-nalewajko, J.; Gocławski, J.; Chojak-koz, J. Automated image analysis for quantification of reactive oxygen species in plant leaves. Methods 2016, 109, 114–122. [Google Scholar] [CrossRef]
  57. Liu, X.W.; Chen, Z.L.; Shen, J.M.; Ye, M.M.; Chen, W.H. Spectrophotometric determination of low concentration of hydrogen peroxide in O3/H2O2 system using titanium sulfate. China Water Wastewater 2010, 26, 126–129. [Google Scholar]
  58. Li, H.L. The effect and mechanism of exogenous silicon on salt resistance of tomato seedlings. In Institute of Horticulture; Northwest A&F University: Yangling, China, 2015. [Google Scholar]
  59. Kim, N.H.; Hwang, B.K. Pepper heat shock protein 70a interacts with the type III effector AvrBsT and triggers plant cell death and immunity. Plant Physiol 2015, 167, 307–322. [Google Scholar] [CrossRef] [PubMed] [Green Version]
  60. Arkus, K.A.J.; Cahoon, E.B.; Jez, J.M. Mechanistic analysis of wheat chlorophyllase. Arch. Biochem. Biophys. 2005, 438, 146–155. [Google Scholar] [CrossRef]
Figure 1. Phenotypes and silencing efficiency of CaSBP12 in silenced and control plants. (A) The phenotypes of CaSBP12-silenced plants. Photographs were taken 40 days post-infiltration. The white line is used as a scale bar (length 3.5 cm) (the diameter of the pot is 7 cm). (B) Silencing efficiency of CaSBP12 in CaSBP12-silenced plants. ** Represents significant differences at p ≤ 0.01. Mean values and SDs for three biological replicates are shown.
Ijms 21 00444 g001
Figure 2. Phenotypes of the detached leaves of CaSBP12-silenced and control plants after 2 days of salt stress. (A) Phenotypes of the detached leaves of silenced plants after 2 days of treatment with water. (B) Phenotypes of the detached leaves of silenced plants after 2 days of treatment with 200 mM NaCl. (C) Phenotypes of the detached leaves of silenced plants after 2 days of treatment with 400 mM NaCl. (D) Phenotypes of the detached leaves of silenced plants after 2 days of treatment with 600 mM NaCl. (E) Water-stained area (%) of the detached leaves of silenced plants after 2 days of treatment with salt stress. (F) The total chlorophyll content of the detached leaves of silenced plants after 2 days of treatment with salt stress. (G) The net photosynthetic rate (Pn) of the detached leaves of silenced plants after 2 days of treatment with salt stress. (H) The Na+ content of the detached leaves of silenced plants after 2 days of treatment with salt stress. The black line used as a scale bar (length 0.5 cm). * and ** represent significant differences at p ≤ 0.05 and p ≤ 0.01 respectively. Mean values and SDs at least for three biological replicates are shown.
Ijms 21 00444 g002
Figure 3. DAB and NBT staining of silenced plants and the phenotypes of the detached leaves of silenced plants. (A) Phenotypes of the detached leaves of CaSBP12-silenced and control plants after 2 days of treatment with 400 mM NaCl. (B) DAB staining in leaves of CaSBP12-silenced and control plants after 2 days of treatment with 400 mM NaCl. (C) NBT staining in leaves of CaSBP12-silenced and control plants after 2 days of treatment with 400 mM NaCl. (D) Water-stained area (%) of the detached leaves of silenced plants after 2 days of treatment with 400 mM NaCl. (E) The DAB stained area (%) of the detached leaves of silenced plants after 2 days of treatment with 400 mM NaCl. (F) The NBT stained area (%) of the detached leaves of silenced plants after 2 days of treatment with 400 mM NaCl. (G) The H2O2 content of the detached leaves of silenced plants after 2 days of treatment with 400 mM NaCl. d: days. The black line is used as a scale bar (length 0.75 cm). Bars with different letters indicate significant differences at p ≤ 0.05. Mean values and SDs at least for three biological replicates are shown.
Ijms 21 00444 g003
Figure 4. Phenotypes, total chlorophyll, Na+, malondialdehyde (MDA) content and conductivity of silenced plants after 3 days of salt stress. (A) Phenotypes of CaSBP12-silenced and control plants after 3 days of treatment with 400 mM NaCl. The red line is used as a scale bar (length 2 cm). (B) The total chlorophyll content of CaSBP12-silenced and control plants after 3 days of treatment with 400 mM NaCl. (C) The Na+, MDA content, and conductivity of CaSBP12-silenced and control plants after 3 days of treatment with 400 mM NaCl. d: days. Bars with different letters indicate significant differences at p ≤ 0.05. Mean values and SDs for three biological replicates are shown.
Ijms 21 00444 g004
Figure 5. The expression of reactive oxygen species (ROS)-scavenging enzymes related genes after 3 days of salt stress (400 mM NaCl) in silenced plants. Bars with different letters indicate significant differences at p ≤ 0.05. Mean values and SDs for three biological replicates are shown.
Ijms 21 00444 g005
Figure 6. Overexpression of CaSBP12 in Nicotiana Benthamiana enhanced susceptibility to salt stress. (A) Phenotypes of transgenic (Line 4, Line 7 and Line 8) and wild-type lines after 22 days of treatment with 200 mM NaCl. (B) The total chlorophyll content of transgenic and wild-type lines after 22 days of treatment with 200 mM NaCl. (C) The relative water content of transgenic and wild-type lines during treatment with 200 mM NaCl at day 0, day 7, day 14, and day 22. (D) The Na+ content of transgenic and wild-type lines after 22 days of treatment with 200 mM NaCl. (E) The MDA content of transgenic and wild-type lines after 22 days of treatment with 200 mM NaCl. (F) The conductivity of transgenic and wild-type lines after 22 days of treatment with 200 mM NaCl. (G) Classification of damage severity index percentage of transgenic and wild-type lines after 22 days of treatment with 200 mM NaCl. Level 0: no symptoms; Level 1: yellowing of lower leaves of plants; Level 2: the whole plant is yellowing and the edge of leaves is decolorized seriously; Level 3: whole plant yellowing and growth point death. (H) Damage severity index percentage of transgenic and wild-type lines after 22 days of treatment with 200 mM NaCl. The white line used as a scale bar (length 3.5 cm). Bars with different letters indicate significant differences at p ≤ 0.05. Mean values and SDs for three replicates are shown.
Ijms 21 00444 g006
Figure 7. DAB and NBT staining of transgenic and wild-type lines after 22 days of salt stress. (A) DAB staining of transgenic and wild-type lines after 22 days of treatment with 200 mM NaCl. (B) NBT staining of transgenic and wild-type lines after 22 days of treatment with 200 mM NaCl. (C) The DAB, NBT stained area (%) and H2O2 content of transgenic and wild-type lines after 22 days of treatment with 200 mM NaCl. The black line is used as a scale bar (length 0.75 cm). * and ** represent significant differences at p ≤ 0.05 and p ≤ 0.01 respectively. Mean values and SDs at least for three biological replicates are shown.
Ijms 21 00444 g007
Figure 8. The expression of ROS-scavenging enzymes related genes in transgenic and wild-type lines after 22 days of salt stress. Bars with different letters indicate significant differences at p ≤ 0.05. Mean values and SDs for three biological replicates are shown.
Ijms 21 00444 g008

