A Fluorescence Polarization-Based High-Throughput Screen to Identify the First Small-Molecule Modulators of the Human Adenylyltransferase HYPE/FICD

 ,
, 
Abstract
1. Introduction
2. Results and Discussion
2.1. Assay Design
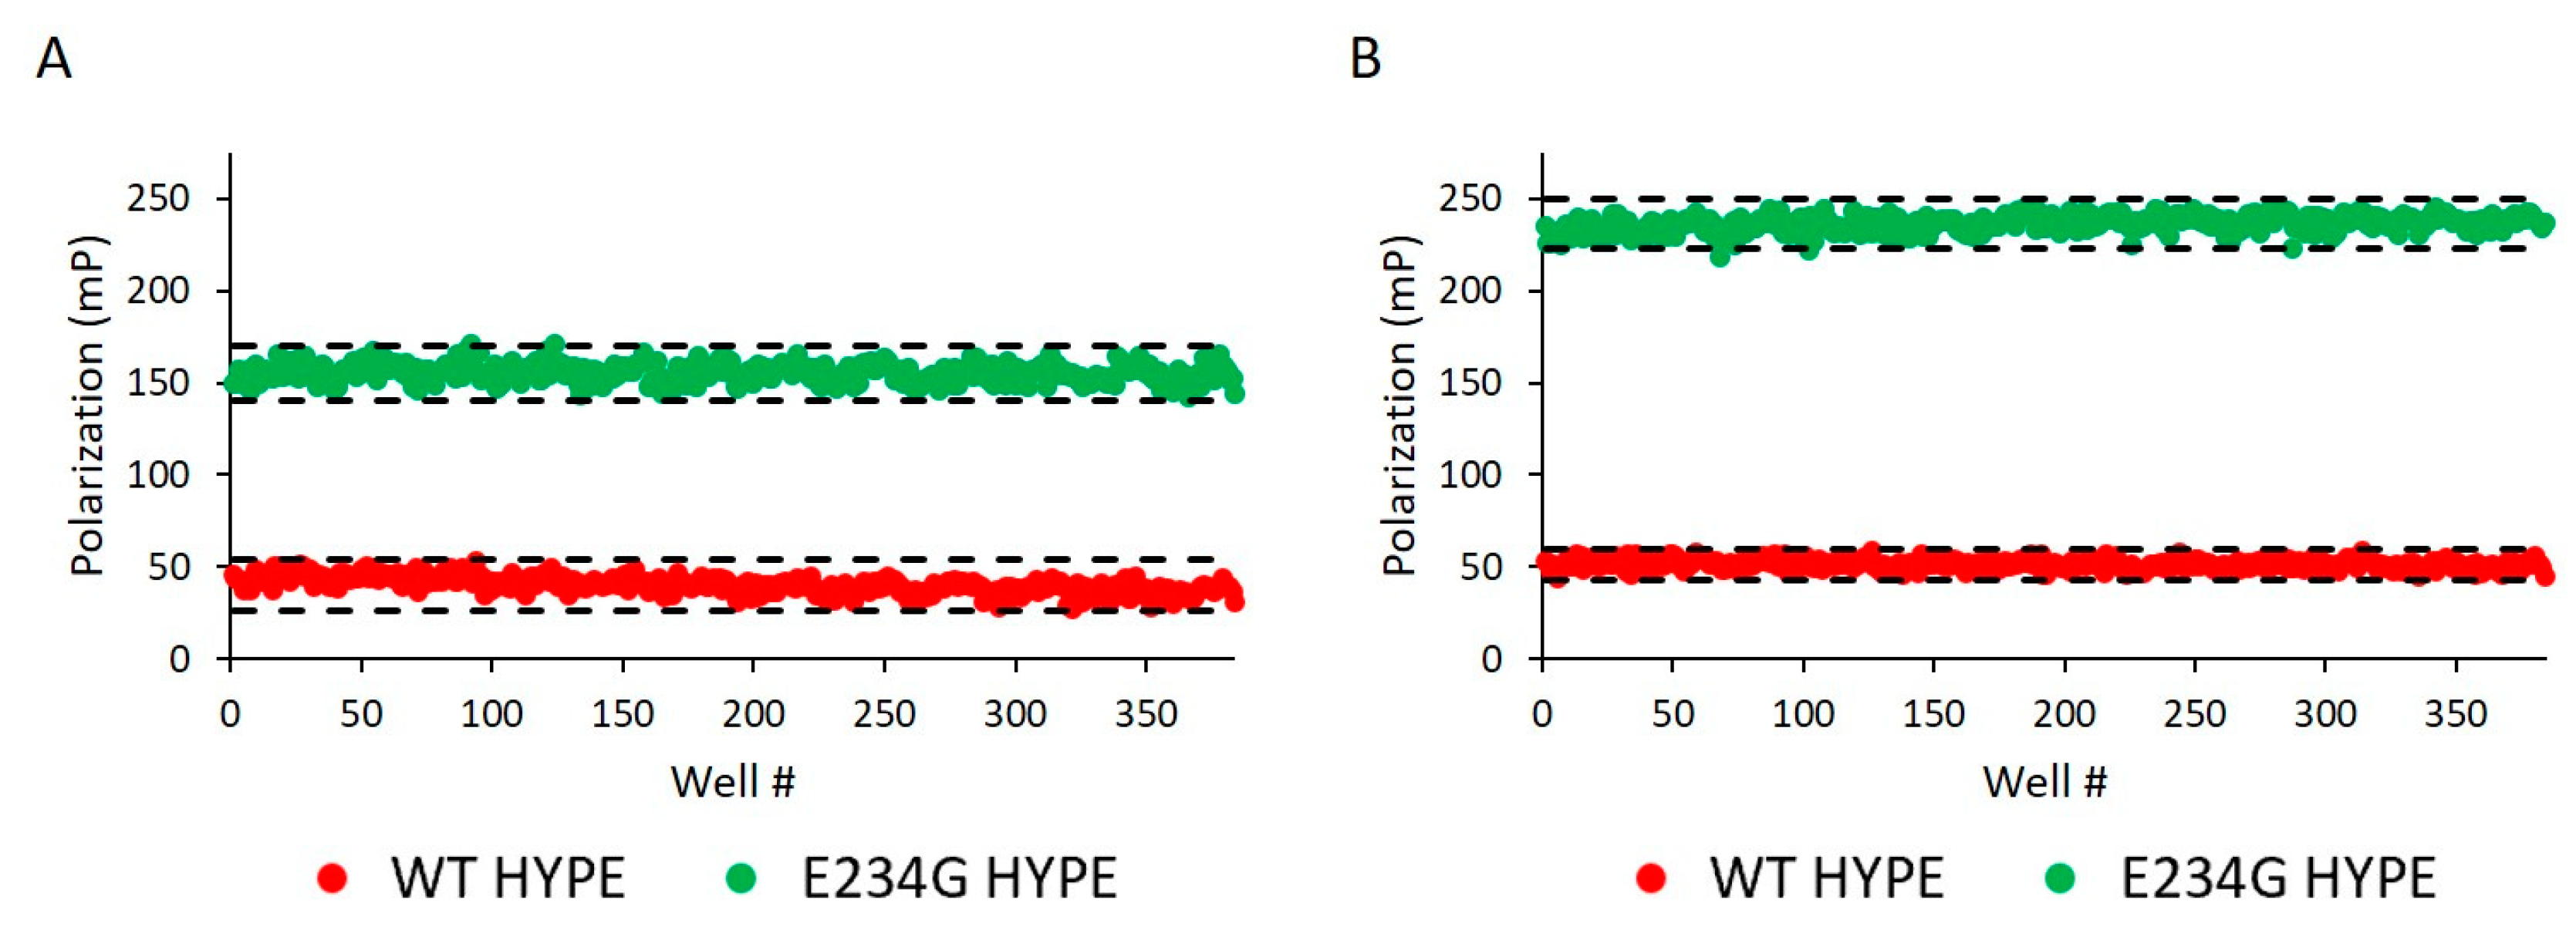
2.2. Assay Development and Optimization
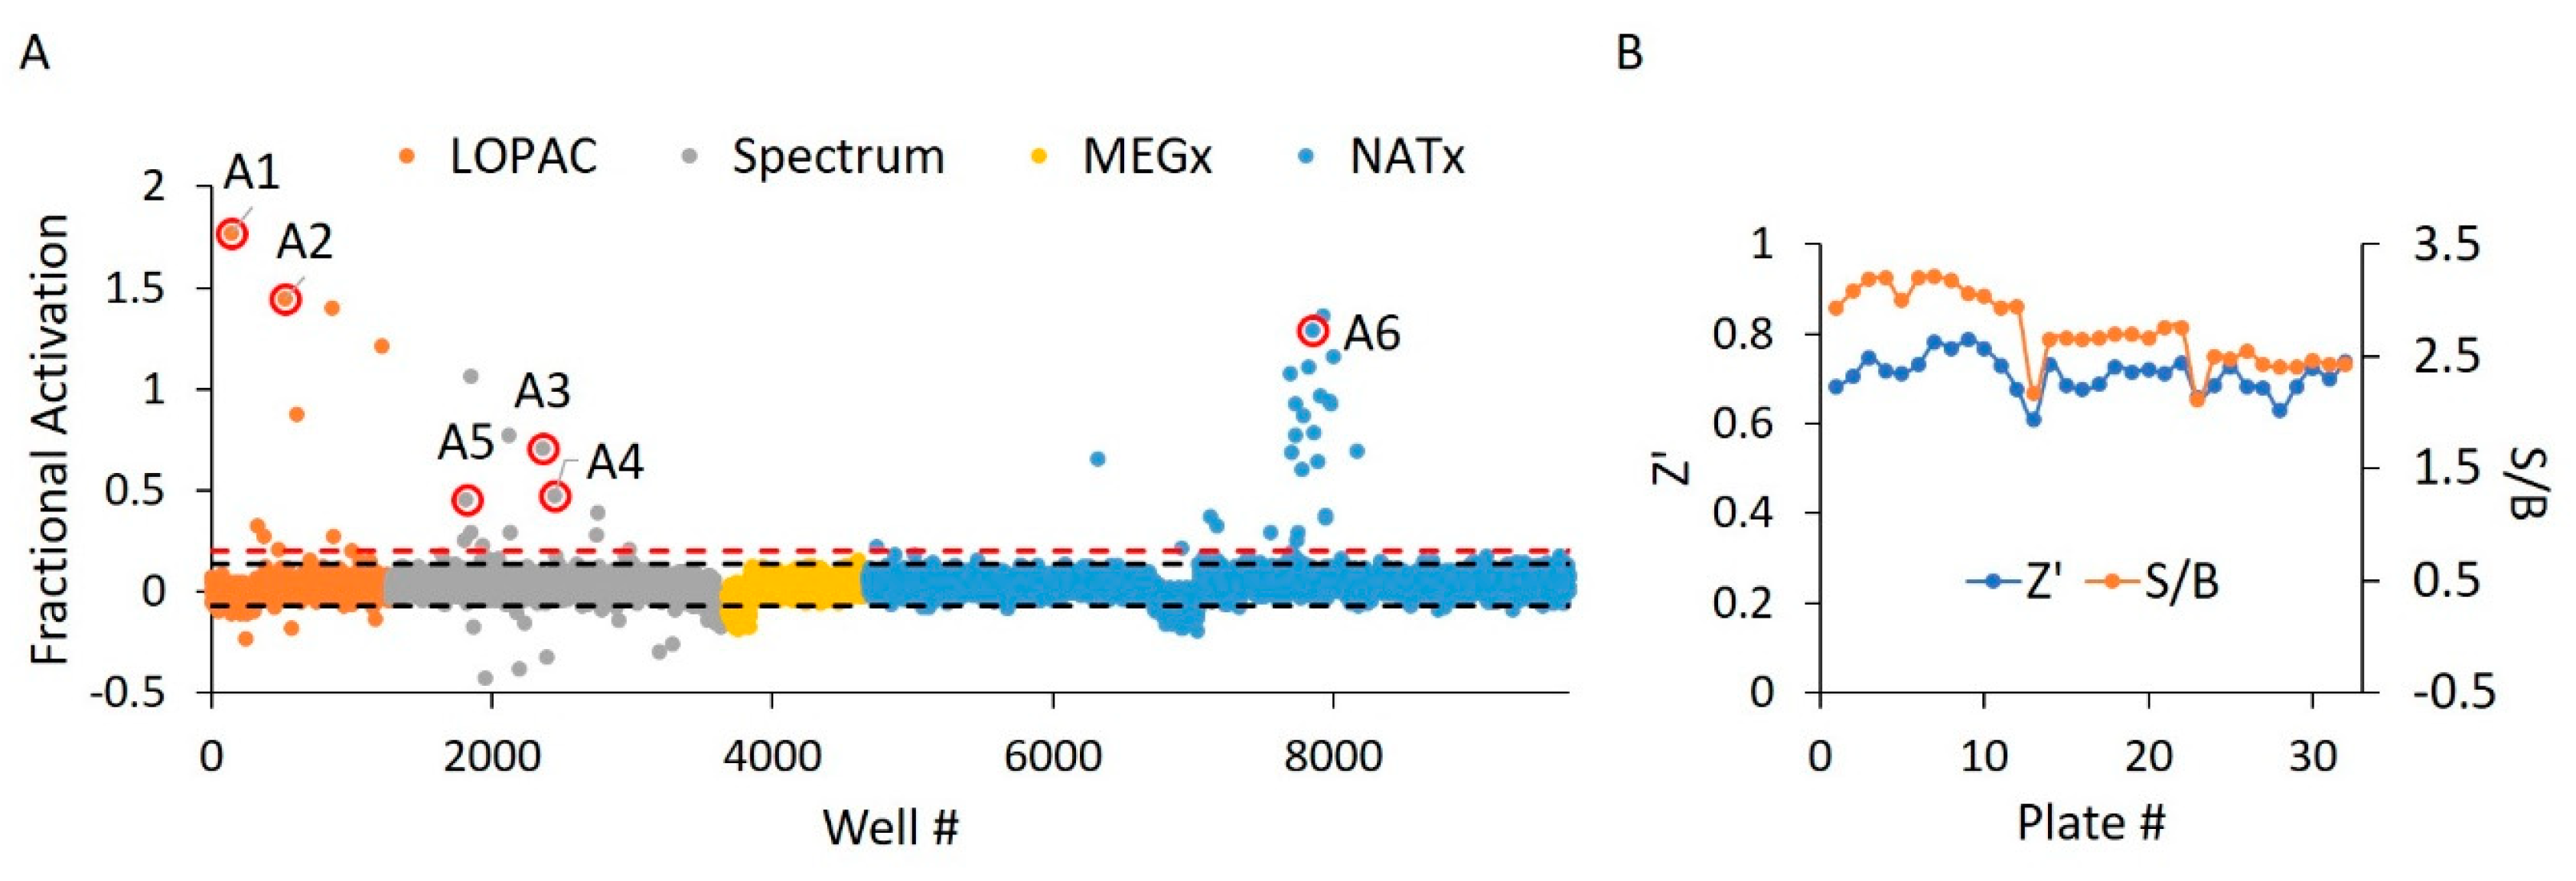
2.3. WT HYPE Activator High-Throughput Screen
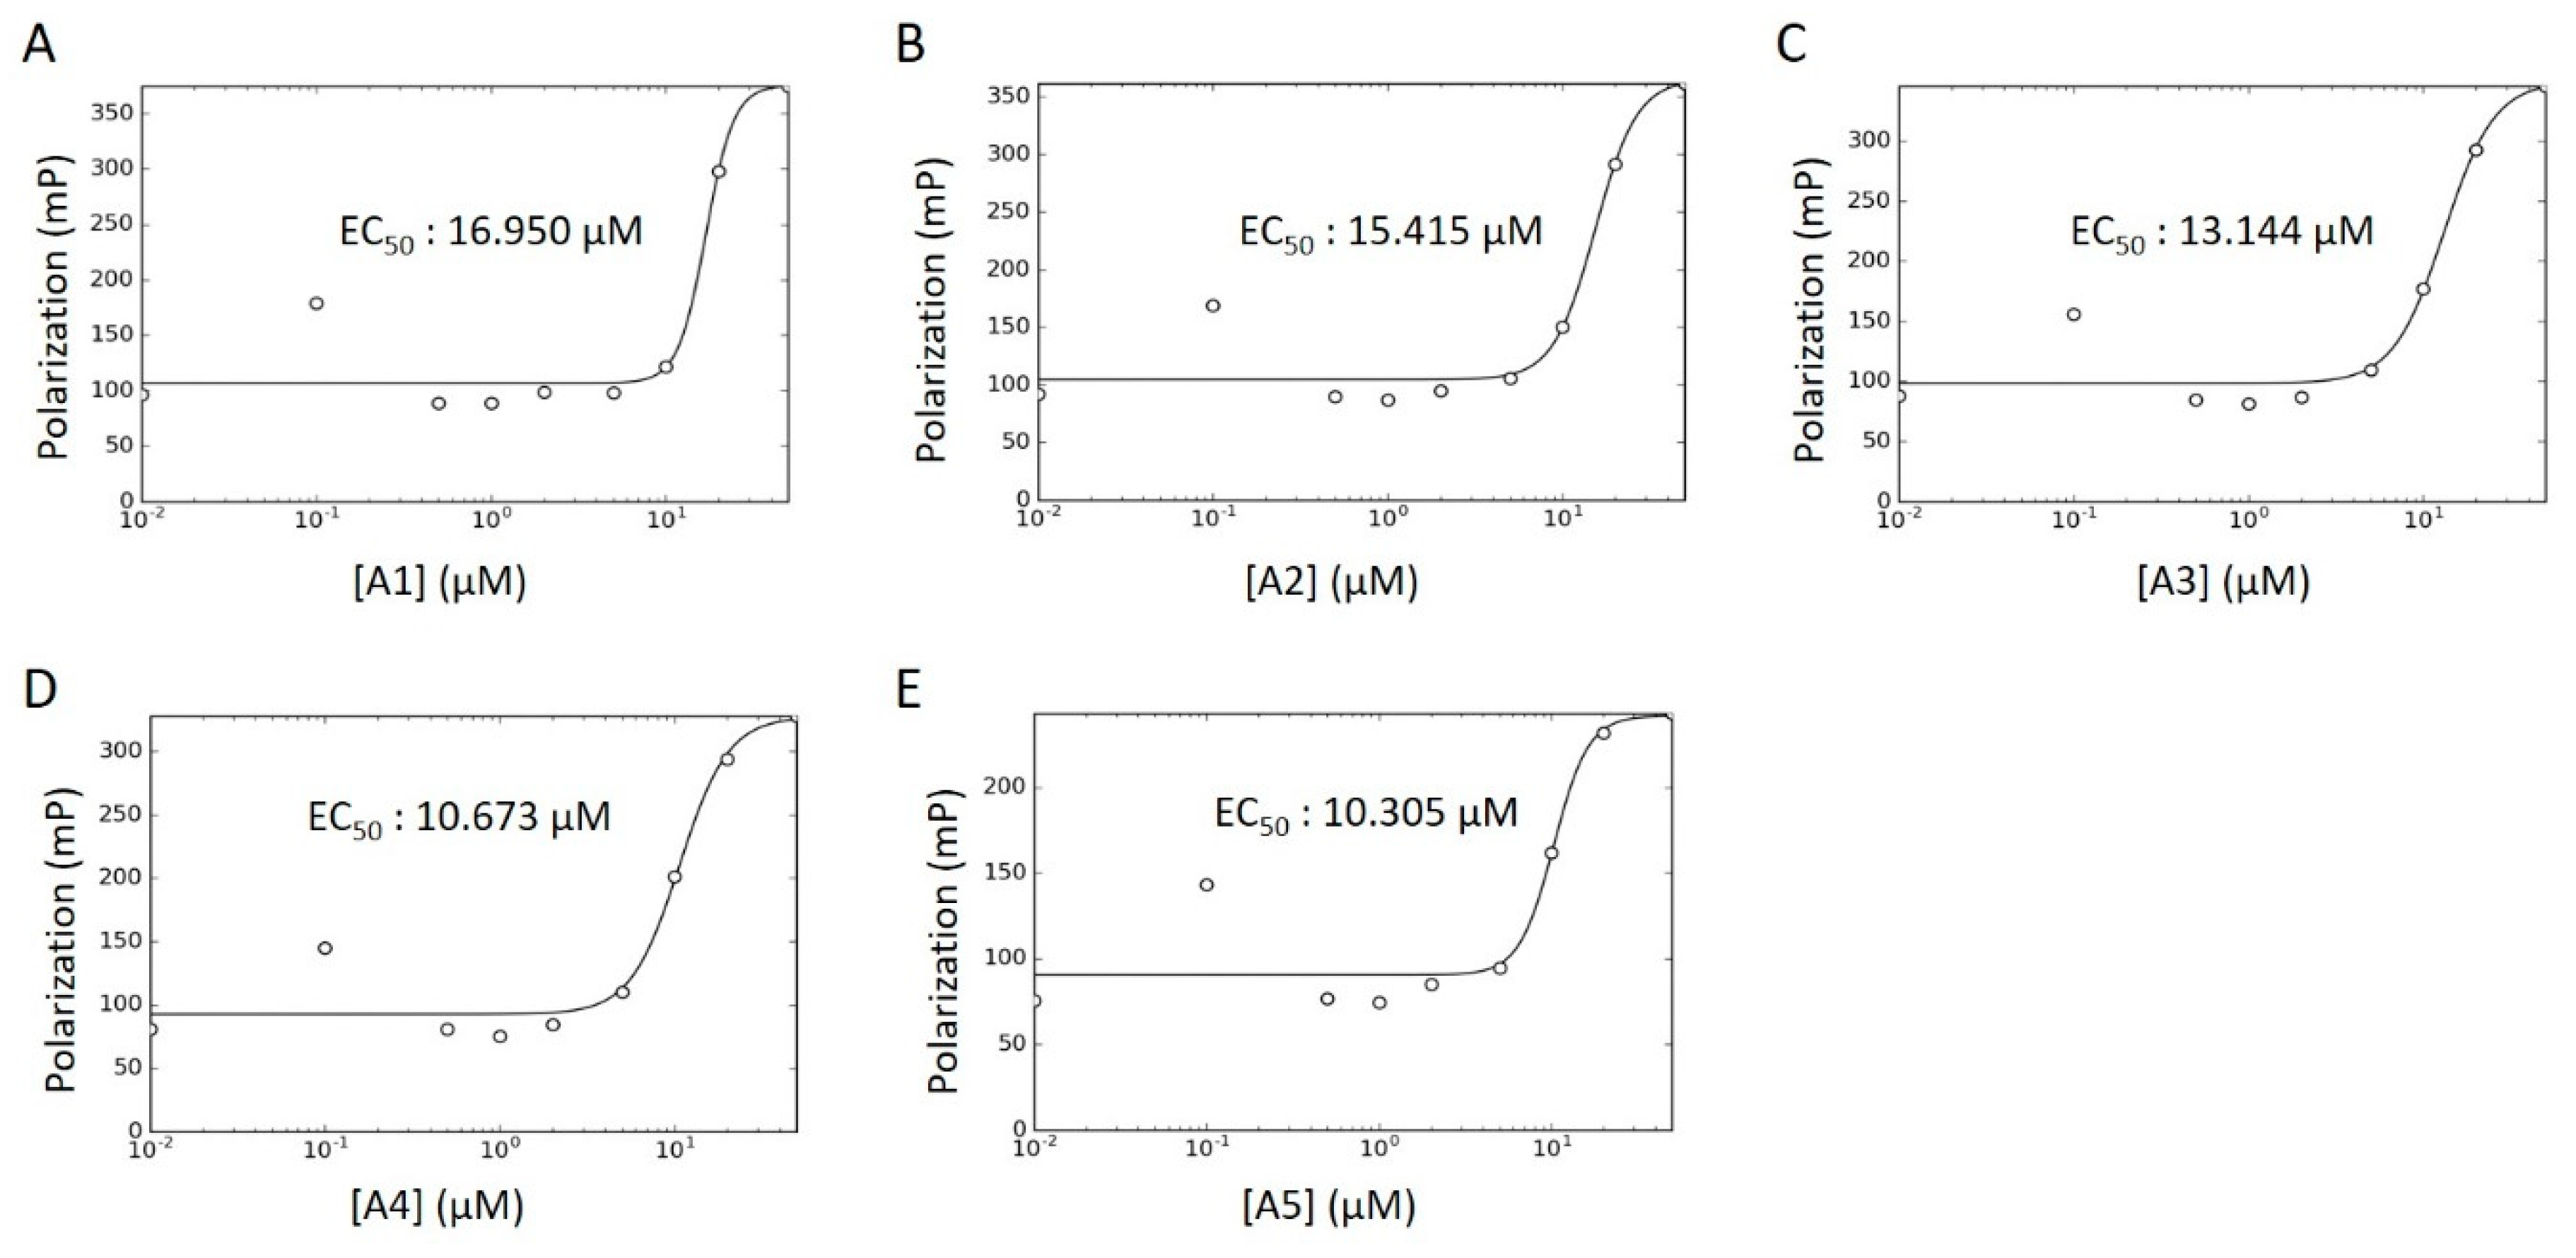
2.4. WT HYPE Activator Microplate Validation
2.5. WT HYPE Activator In-Gel Fluorescence Counterscreen
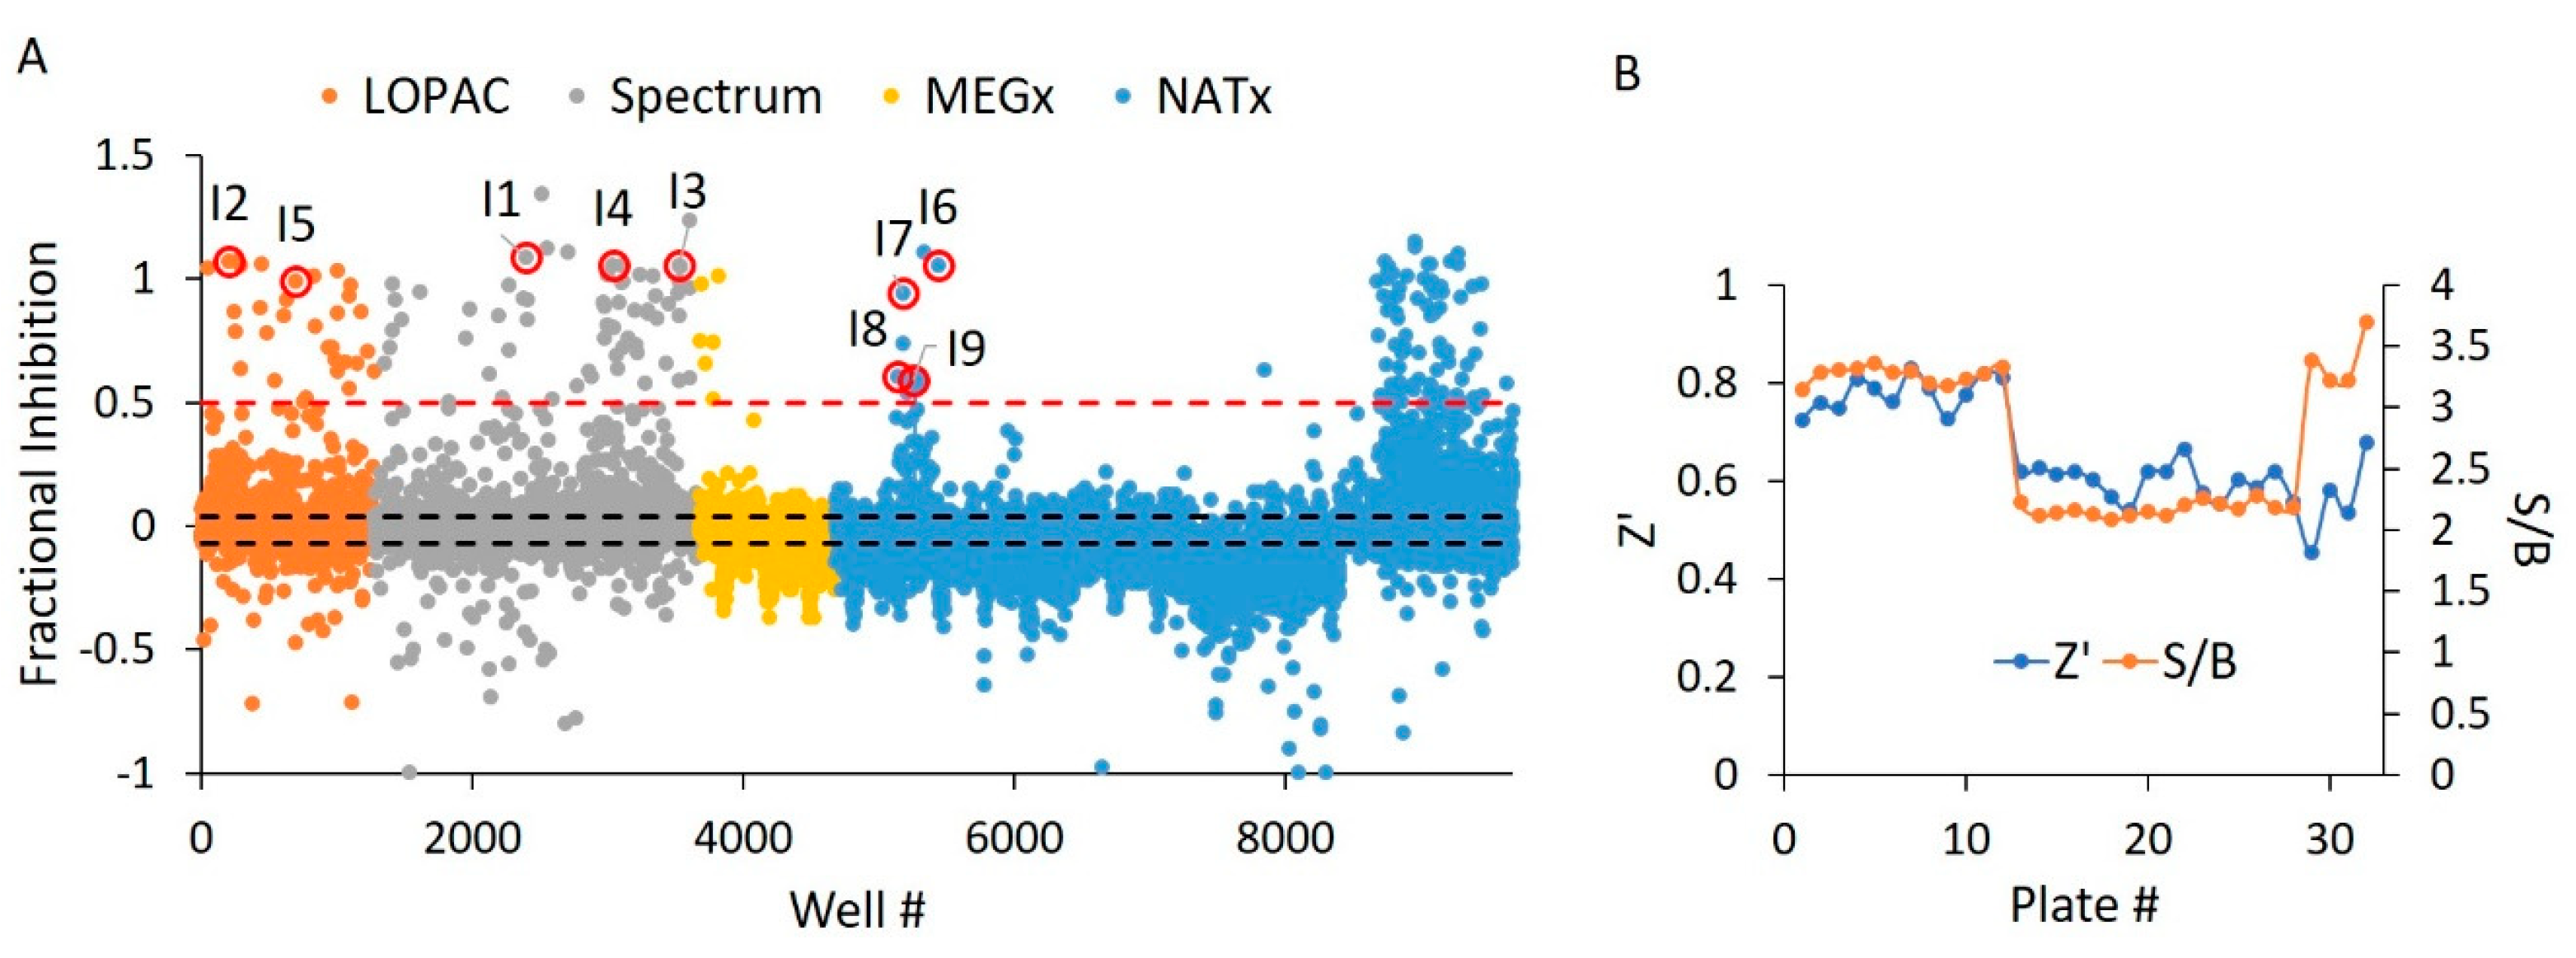
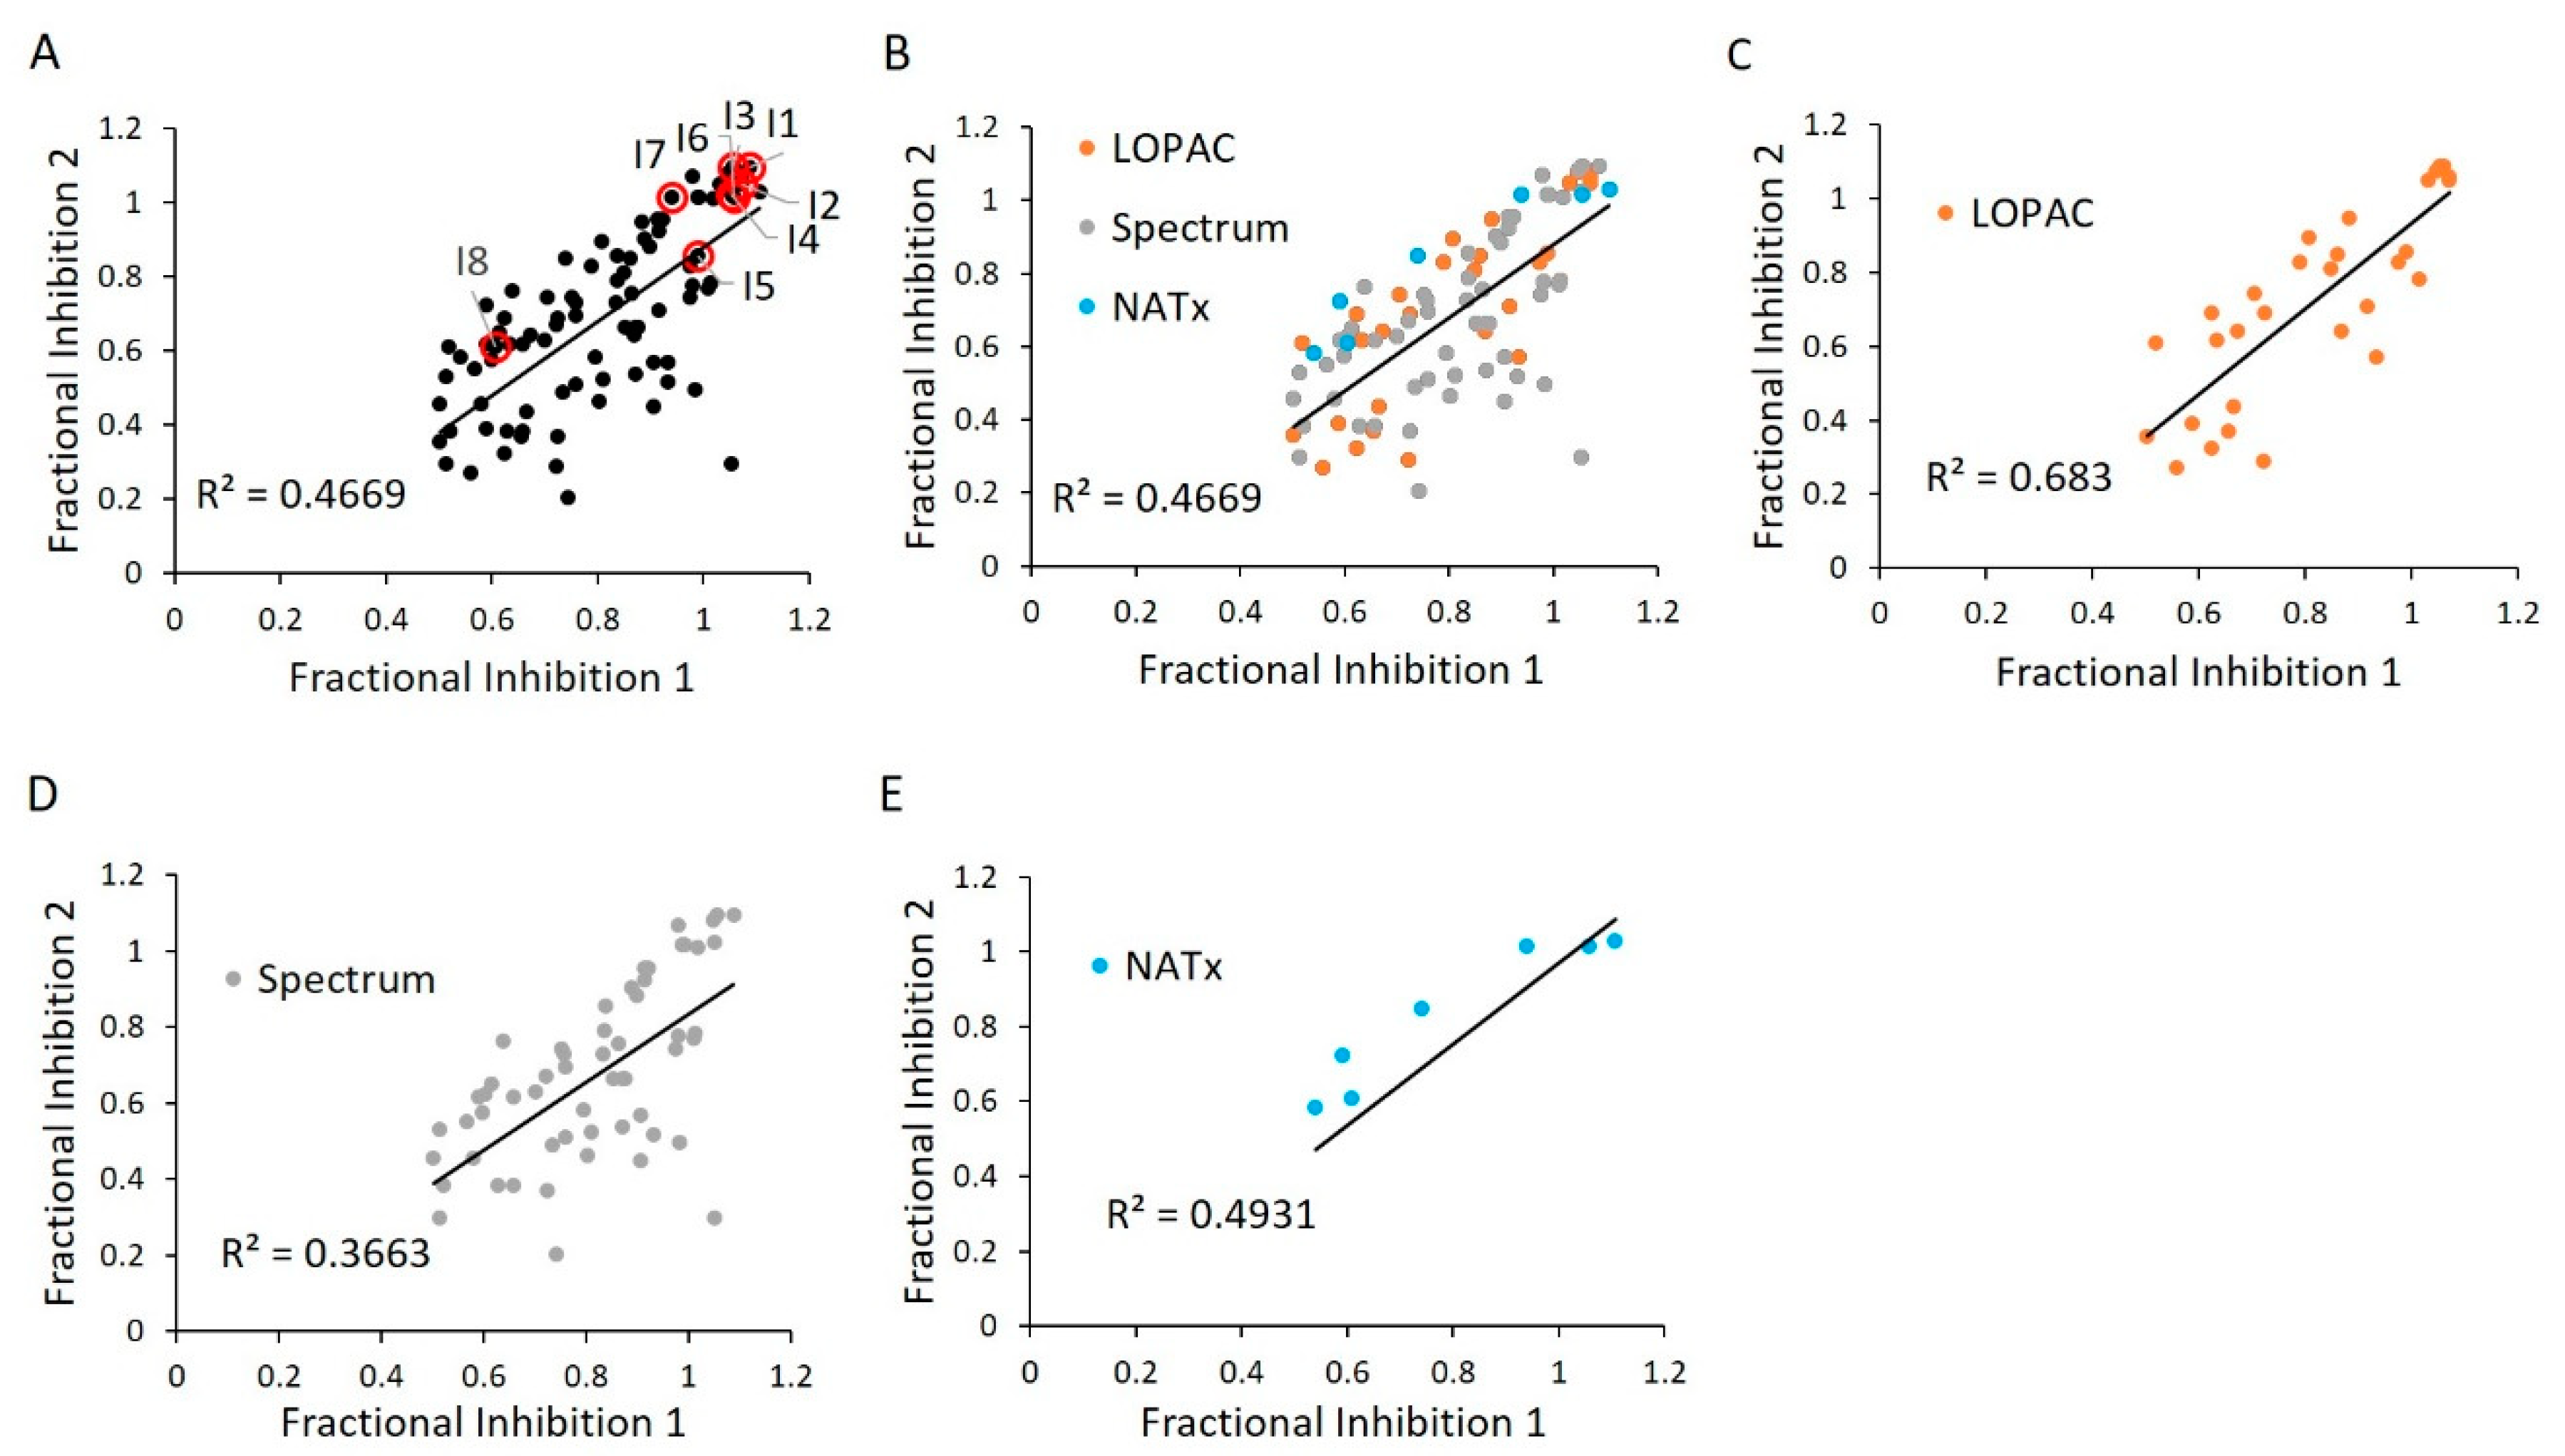
2.6. E234G HYPE Inhibitor High-Throughput Screen
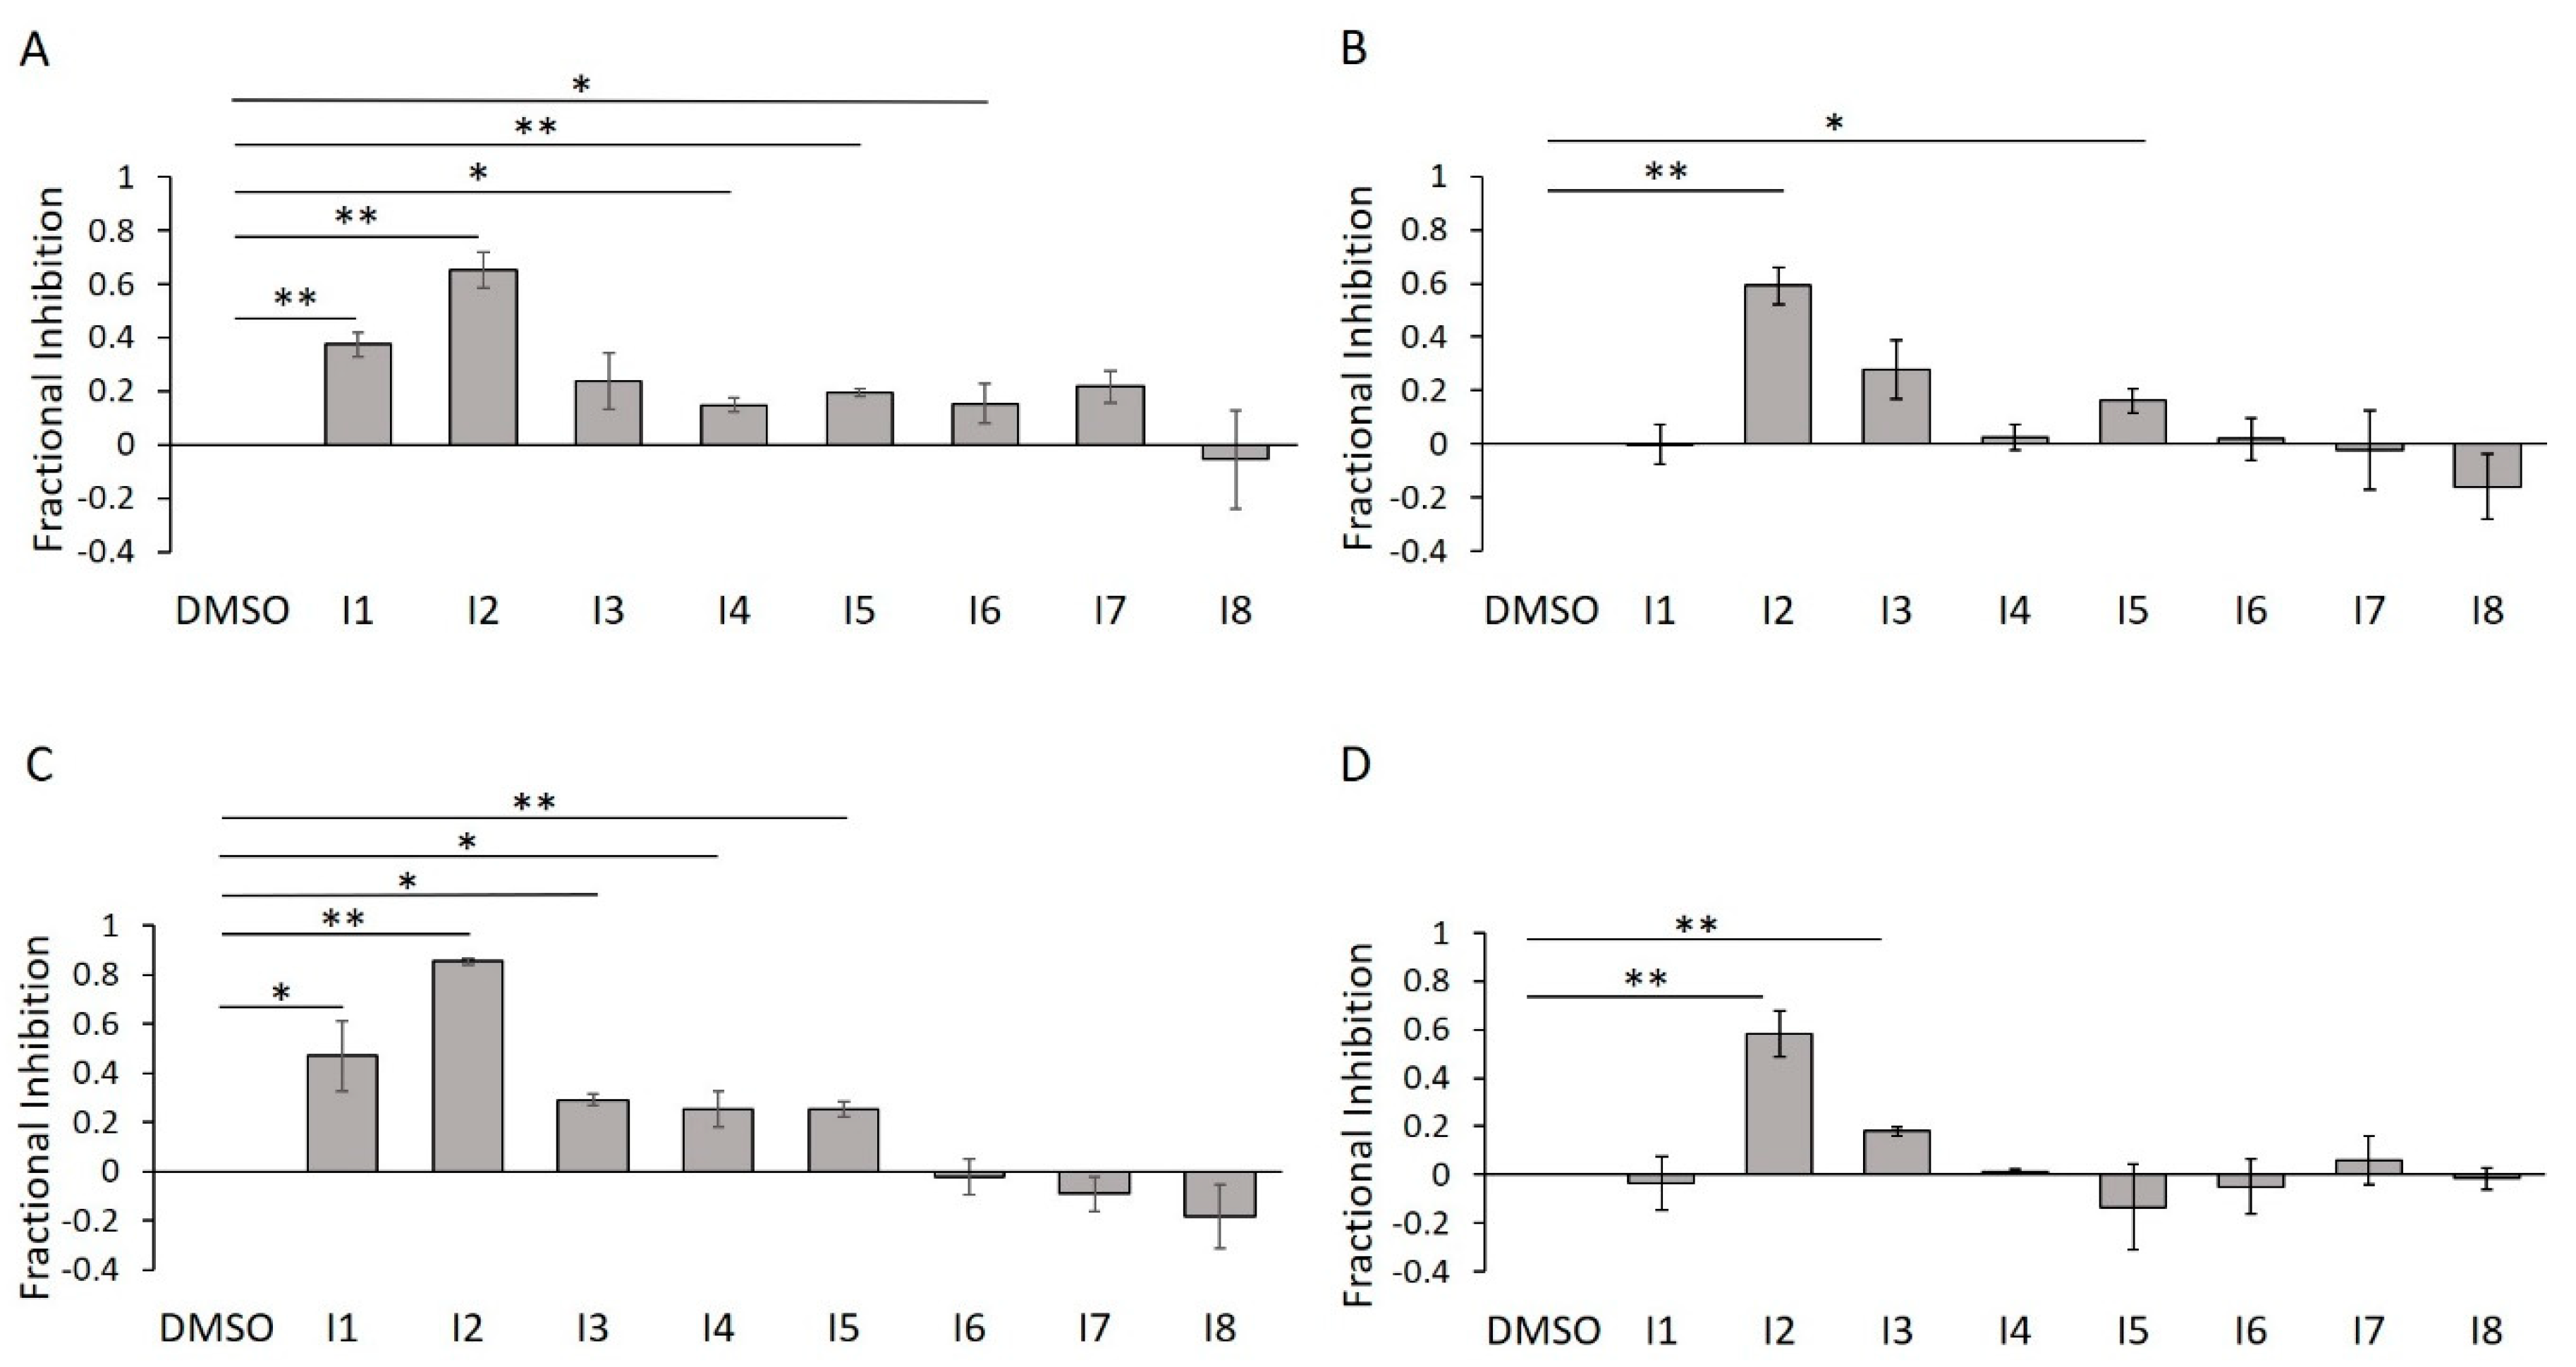
2.7. E234G HYPE Inhibitor Microplate Validation
2.8. E234G HYPE Inhibitor In-Gel Fluorescence Counterscreen
3. Materials and Methods
3.1. Protein Expression and Purification
3.2. Assay Development
3.2.1. In-Gel Kinetics
3.2.2. Microplate Optimization
3.3. High-Throughput Screen
3.4. Concentration–Response Curves
3.5. Fluorescence in-Gel Counterscreen
3.6. Molecular Docking
4. Conclusions
Supplementary Materials
Author Contributions
Funding
Acknowledgments
Conflicts of Interest
References
- Yarbrough, M.; Li, Y.; Kinch, L.N.; Grishin, N.V.; Ball, H.L.; Orth, K. AMPylation of Rho GTPases by Vibrio VopS Disrupts Effector Binding and Downstream Signaling. Science 2009, 323, 269–272. [Google Scholar] [CrossRef] [PubMed]
- Worby, C.A.; Mattoo, S.; Kruger, R.P.; Corbeil, L.B.; Koller, A.; Mendez, J.C.; Zekarias, B.; Lazar, C.; Jack, E. The Fic domain: A new paradigm for adenylylation. Mol. Cell 2009, 34, 1–23. [Google Scholar] [CrossRef]
- Finn, R.D.; Bateman, A.; Clements, J.; Coggill, P.; Eberhardt, R.Y.; Eddy, S.R.; Heger, A.; Hetherington, K.; Holm, L.; Mistry, J.; et al. Pfam: The protein families database. Nucleic Acids Res. 2014, 42, 222–230. [Google Scholar] [CrossRef] [PubMed]
- Garcia-Pino, A.; Christensen-Dalsgaard, M.; Wyns, L.; Yarmolinsky, M.; Magnuson, R.D.; Gerdes, K.; Loris, R. Doc of prophage P1 is inhibited by its antitoxin partner Phd through fold complementation. J. Biol. Chem. 2008, 283, 30821–30827. [Google Scholar] [CrossRef]
- Mattoo, S.; Durrant, E.; Chen, M.J.; Xiao, J.; Lazar, C.S.; Manning, G.; Dixon, J.E.; Worby, C.A. Comparative analysis of Histophilus somni immunoglobulin-binding protein A (IbpA) with other Fic domain-containing enzymes reveals differences in substrate and nucleotide specificities. J. Biol. Chem. 2011, 286, 32834–32842. [Google Scholar] [CrossRef]
- Zekarias, B.; Mattoo, S.; Worby, C.; Lehmann, J.; Rosenbusch, R.F.; Corbeil, L.B. Histophilus somni IbpA DR2/Fic in virulence and immunoprotection at the natural host alveolar epithelial barrier. Infect. Immun. 2010, 78, 1850–1858. [Google Scholar] [CrossRef]
- Lewallen, D.M.; Sreelatha, A.; Dharmarajan, V.; Chase, P.; Griffin, P.R.; Orth, K.; Hodder, P.; Paul, R. Inhibiting AMPylation: A novel screen to identify the first small molecule inhibitors of protein AMpylation. ACS Chem. Biol. 2015, 9, 433–442. [Google Scholar] [CrossRef]
- Faber, P.W.; Barnes, G.T.; Srinidhi, J.; Chen, J.; Gusella, J.F.; MacDonald, M.E. Huntingtin interacts with a family of WW domain proteins. Hum. Mol. Genet. 1998, 7, 1463–1474. [Google Scholar] [CrossRef]
- Sanyal, A.; Chen, A.J.; Nakayasu, E.S.; Lazar, C.S.; Zbornik, E.A.; Worby, C.A.; Koller, A.; Mattoo, S. A novel link between fic (filamentation induced by cAMP)-mediated adenylylation/AMPylation and the unfolded protein response. J. Biol. Chem. 2015, 290, 8482–8499. [Google Scholar] [CrossRef]
- Sanyal, A.; Zbornik, E.; Watson, B.G.; Christoffer, C.; Ma, J.; Kihara, D.; Mattoo, S. Kinetic And Structural Parameters Governing Fic-Mediated Adenylylation/AMPylation of the Hsp70 chaperone, BiP/GRP78. bioRxiv 2018. [Google Scholar] [CrossRef]
- Sengupta, R.; Poderycki, M.J.; Mattoo, S. CryoAPEX—An electron tomography tool for subcellular localization of membrane proteins. J. Cell Sci. 2019, 132, jcs222315. [Google Scholar] [CrossRef] [PubMed]
- Engel, P.; Goepfert, A.; Dehio, C. Adenylylation control by intra- or intermolecular active—Site obstruction in Fic proteins’. Nature 2012, 482, 107–112. [Google Scholar] [CrossRef] [PubMed]
- Ham, H.; Woolery, A.R.; Tracy, C.; Stenesen, D.; Krämer, H.; Orth, K. Unfolded protein response-regulated Drosophila Fic (dFic) protein reversibly AMPylates BiP chaperone during endoplasmic reticulum homeostasis. J. Biol. Chem. 2014, 289, 36059–36069. [Google Scholar] [CrossRef] [PubMed]
- Preissler, S.; Rato, C.; Chen, R.; Antrobus, R.; Ding, S.; Fearnley, I.M.; Ron, D. AMPylation matches BiP activity to client protein load in the endoplasmic reticulum. Elife 2015, 4, 1–63. [Google Scholar] [CrossRef]
- Preissler, S.; Rato, C.; Perera, L.; Saudek, V.; Ron, D. FICD acts bi-functionally to AMPylate and de-AMPylate the endoplasmic reticulum chaperone BiP. Nat. Struct. Mol. Biol. 2017, 24, 23–29. [Google Scholar] [CrossRef]
- Lee, A.S. The ER chaperone and signaling regulator GRP78/BiP as a monitor of endoplasmic reticulum stress. Methods 2005, 35, 373–381. [Google Scholar] [CrossRef]
- Gidalevitz, T.; Stevens, F.; Argon, Y. Orchestration of secretory protein folding by ER chaperones. Biochim. Biophys. Acta Mol. Cell Res. 2013, 1833, 2410–2424. [Google Scholar] [CrossRef]
- Ibrahim, I.M.; Abdelmalek, D.H.; Elshahat, M.E.; Elfiky, A.A. COVID-19 spike-host cell receptor GRP78 binding site prediction. J. Infect. 2020, 80, 554–562. [Google Scholar] [CrossRef]
- Banerjee, A.K.; Begum, F.; Srivastava, A.K.; Tripathi, P.P.; Ray, U. Overexpression of GRP78 receptor and its Chemical Biology in Cancer and Autoimmune Diseases: High Risk for COVID 19? OSF Preprints 2020. [Google Scholar] [CrossRef]
- Truttmann, M.C.; Pincus, D.; Ploegh, H.L. Chaperone AMPylation modulates aggregation and toxicity of neurodegenerative disease-associated polypeptides. Proc. Natl. Acad. Sci. USA 2018, 115, E5008–E5017. [Google Scholar] [CrossRef]
- Sanyal, A.; Dutta, S.; Camara, A.; Chandran, A.; Koller, A.; Watson, B.G.; Sengupta, R.; Ysselstein, D.; Montenegro, P.; Cannon, J.; et al. Alpha-Synuclein Is a Target of Fic-Mediated Adenylylation/AMPylation: Possible Implications for Parkinson’s Disease. J. Mol. Biol. 2019, 431. [Google Scholar] [CrossRef] [PubMed]
- Rahman, M. Visual neurotransmission in Drosophila requires expression of Fic in glia capitate projections. Nat. Neurosci. 2013, 71, 233–236. [Google Scholar] [CrossRef]
- Moehlman, A.T.; Casey, A.K.; Servage, K.; Orth, K.; Krämer, H. Adaptation to constant light requires Fic-mediated AMPylation of BiP to protect against reversible photoreceptor degeneration. Elife 2018, 7, 1–20. [Google Scholar] [CrossRef] [PubMed]
- Broncel, M.; Serwa, R.A.; Bunney, T.D.; Katan, M.; Tate, E.W. Global Profiling of Huntingtin-associated protein E (HYPE)-Mediated AMPylation through a Chemical Proteomic Approach. Mol. Cell. Proteom. 2016, 15, 715–725. [Google Scholar] [CrossRef]
- Hall, E.; Jönsson, J.; Ofori, J.K.; Volkov, P.; Perfilyev, A.; Dekker Nitert, M.; Eliasson, L.; Ling, C.; Bacos, K. Glucolipotoxicity Alters Insulin Secretion via Epigenetic Changes in Human Islets. Diabetes 2019, 68, 1965–1974. [Google Scholar] [CrossRef] [PubMed]
- Kielkowski, P.; Buchsbaum, I.Y.; Kirsch, V.C.; Bach, N.C.; Drukker, M.; Cappello, S.; Sieber, S.A. FICD activity and AMPylation remodelling modulate human neurogenesis. Nat. Commun. 2020, 11, 1–13. [Google Scholar] [CrossRef]
- Truttmann, M.C.; Wu, Q.; Stiegeler, S.; Duarte, J.N.; Ingram, J.; Ploegh, H.L. HypE-specific nanobodies as tools to modulate HypE-mediated target AMPylation. J. Biol. Chem. 2015, 290, 9087–9100. [Google Scholar] [CrossRef]
- Lewallen, D.M.; Steckler, C.J.; Knuckley, B.; Chalmers, M.J.; Thompson, P.R. Probing adenylation: Using a fluorescently labelled ATP probe to directly label and immunoprecipitate VopS substrates. Mol. Biosyst. 2012, 8, 1701–1706. [Google Scholar] [CrossRef]
- Bunney, T.D.; Cole, A.R.; Broncel, M.; Esposito, D.; Tate, E.W.; Katan, M. Crystal structure of the human, FIC-domain containing protein HYPE and implications for its functions. Structure 2014, 22, 1831–1843. [Google Scholar] [CrossRef]
- Perera, L.A.; Rato, C.; Yan, Y.; Neidhardt, L.; McLaughlin, S.H.; Read, R.J.; Preissler, S.; Ron, D. An oligomeric state-dependent switch in the ER enzyme FICD regulates AMP ylation and de AMP ylation of BiP. EMBO J. 2019, 38, 1–24. [Google Scholar] [CrossRef]
- Flint, A.J.; Tiganis, T.; Barford, D.; Tonks, N.K. Development of “substrate-trapping” mutants to identify physiological substrates of protein tyrosine phosphatases. Proc. Natl. Acad. Sci. USA 1997, 94, 1680–1685. [Google Scholar] [CrossRef] [PubMed]
- Camara, A.; Sanyal, A.; Dutta, S.; Rochet, J.; Mattoo, S. In vitro AMPylation/Adenylylation of Alpha-synuclein by HYPE/FICD. Bio-Protocol 2020. [Google Scholar] [CrossRef]
- Tjernberg, A.; Markova, N.; Griffiths, W.J.; Hallén, D. DMSO-related effects in protein characterization. J. Biomol. Screen. 2006, 11, 131–137. [Google Scholar] [CrossRef] [PubMed]
- Zhang, J.; Chung, T.; Oldenburg, K.R. A Simple Statistical Parameter for Use in Evaluation and validation of High Throughput Screening Assays. J. Biomol. Screen. 1999, 4, 67–73. [Google Scholar] [CrossRef]
- Bisson, J.; McAlpine, J.B.; Friesen, J.B.; Chen, S.N.; Graham, J.; Pauli, G.F. Can Invalid Bioactives Undermine Natural Product-Based Drug Discovery? J. Med. Chem. 2016, 59, 1671–1690. [Google Scholar] [CrossRef]
- Laplante, S.R.; Carson, R.; Gillard, J.; Aubry, N.; Coulombe, R.; Bordeleau, S.; Bonneau, P.; Little, M.; O’Meara, J.; Beaulieu, P.L. Compound aggregation in drug discovery: Implementing a practical NMR assay for medicinal chemists. J. Med. Chem. 2013, 56, 5142–5150. [Google Scholar] [CrossRef]
- Prinz, H. Hill coefficients, dose-response curves and allosteric mechanisms. J. Chem. Biol. 2010, 3, 37–44. [Google Scholar] [CrossRef]
- Sunagawa, M.; Kosugi, T.; Nakamura, M.; Sperelakis, N. Pharmacological actions of calmidazolium, a calmodulin antagonist, in cardiovascular system. Cardiovasc. Drug Rev. 2000, 18, 211–221. [Google Scholar] [CrossRef]
- James, L.R.; Griffiths, C.H.; Garthwaite, J.; Bellamy, T.C. Inhibition of nitric oxide-activated guanylyl cyclase by calmodulin antagonists. Br. J. Pharmacol. 2009, 158, 1454–1464. [Google Scholar] [CrossRef]
- Gietzen, K.; Wurthrich, A.; Bader, H. R 24571: A New Powerful Inhibitor of Red Blood Cell Ca2++-Transport ATPase and of Calmodulin-Regulated Functioons. Biochem. Biophys. Res. Commun. 1981, 101, 418–425. [Google Scholar] [CrossRef]
- Saboury, A.A. Enzyme inhibition and activation: A general theory. J. Iran. Chem. Soc. 2009, 6, 219–229. [Google Scholar] [CrossRef]
- Coan, K.E.D.; Maltby, D.A.; Burlingame, A.L.; Shoichet, B.K. Promiscuous aggregate-based inhibitors promote enzyme unfolding. J. Med. Chem. 2009, 52, 2067–2075. [Google Scholar] [CrossRef] [PubMed]
- Obrecht, A.S.; Urban, N.; Schaefer, M.; Röse, A.; Kless, A.; Meents, J.E.; Lampert, A.; Abdelrahman, A.; Müller, C.E.; Schmalzing, G.; et al. Identification of aurintricarboxylic acid as a potent allosteric antagonist of P2X1 and P2X3 receptors. Neuropharmacology 2019, 158. [Google Scholar] [CrossRef] [PubMed]
- McCune, S.A.; Foe, L.G.; Kemp, R.G.; Jurin, R.R. Aurintricarboxylic acid is a potent inhibitor of phosphofructokinase. Biochem. J. 1989, 259, 925–927. [Google Scholar] [CrossRef] [PubMed]
- Hashem, A.M.; Flaman, A.S.; Farnsworth, A.; Brown, E.G.; van Domselaar, G.; He, R.; Li, X. Aurintricarboxylic acid is a potent inhibitor of influenza A and B virus neuraminidases. PLoS ONE 2009, 4, e0008350. [Google Scholar] [CrossRef] [PubMed]
- Morse, J.S.; Lalonde, T.; Xu, S.; Liu, W.R. Learning from the Past: Possible Urgent Prevention and Treatment Options for Severe Acute Respiratory Infections Caused by 2019-nCoV. Chem. Biol. Chem. 2020, 21, 730–738. [Google Scholar] [CrossRef]
- Grosdidier, A.; Zoete, V.; Michielin, O. SwissDock, a protein-small molecule docking web service based on EADock DSS. Nucleic Acids Res. 2011, 39, 270–277. [Google Scholar] [CrossRef]
- Pettersen, E.F.; Goddard, T.D.; Huang, C.C.; Couch, G.S.; Greenblatt, D.M.; Meng, E.C.; Ferrin, T.E. UCSF Chimera—A visualization system for exploratory research and analysis. J. Comput. Chem. 2004, 25, 1605–1612. [Google Scholar] [CrossRef]


| Library Name | Company | Number of Compounds | Chemical Properties |
|---|---|---|---|
| LOPAC | Sigma-Aldrich | 1280 | Bioactive, FDA-approved |
| Spectrum | Microsource | 2400 | Bioactive and natural compounds |
| NATx | AnalytiCon Discovery | 5000 | Synthetics derived from natural products |
| MEGx | AnalytiCon Discovery | 1000 | Natural products |
| Total | - | 9680 | - |
| Compound ID | Chemical Formula | MW (Da.) | Chemical Name | Library | % Act. 1 | % Act. 2 | % Mean Act. |
|---|---|---|---|---|---|---|---|
| A1 | C31H23Cl7N2O | 688 | Calmidazolium | LOPAC | 177 | 114 | 146 |
| A2 | C18H39NO2 | 302 | DL-erythro-dihydrosphingosine | LOPAC | 144 | 77 | 111 |
| A3 | C21H45N3 | 340 | Hexetidine | Spectrum | 71 | 50 | 61 |
| A4 | C19H42BrN | 364 | Cetyltrimethylammonium Bromide | Spectrum | 47 | 38 | 43 |
| A5 | C32H55BrN4O | 592 | Thonzonium Bromide | Spectrum | 45 | 24 | 35 |
| A6 | C31H39FN4O2 | 519 | NAT14–350426 | NATx | 129 | 18 | 74 |
| Compound ID | Chemical Formula | MW (Da.) | Chemical Name | Library | % Inh. 1 | % Inh. 2 | % Mean Inh. |
|---|---|---|---|---|---|---|---|
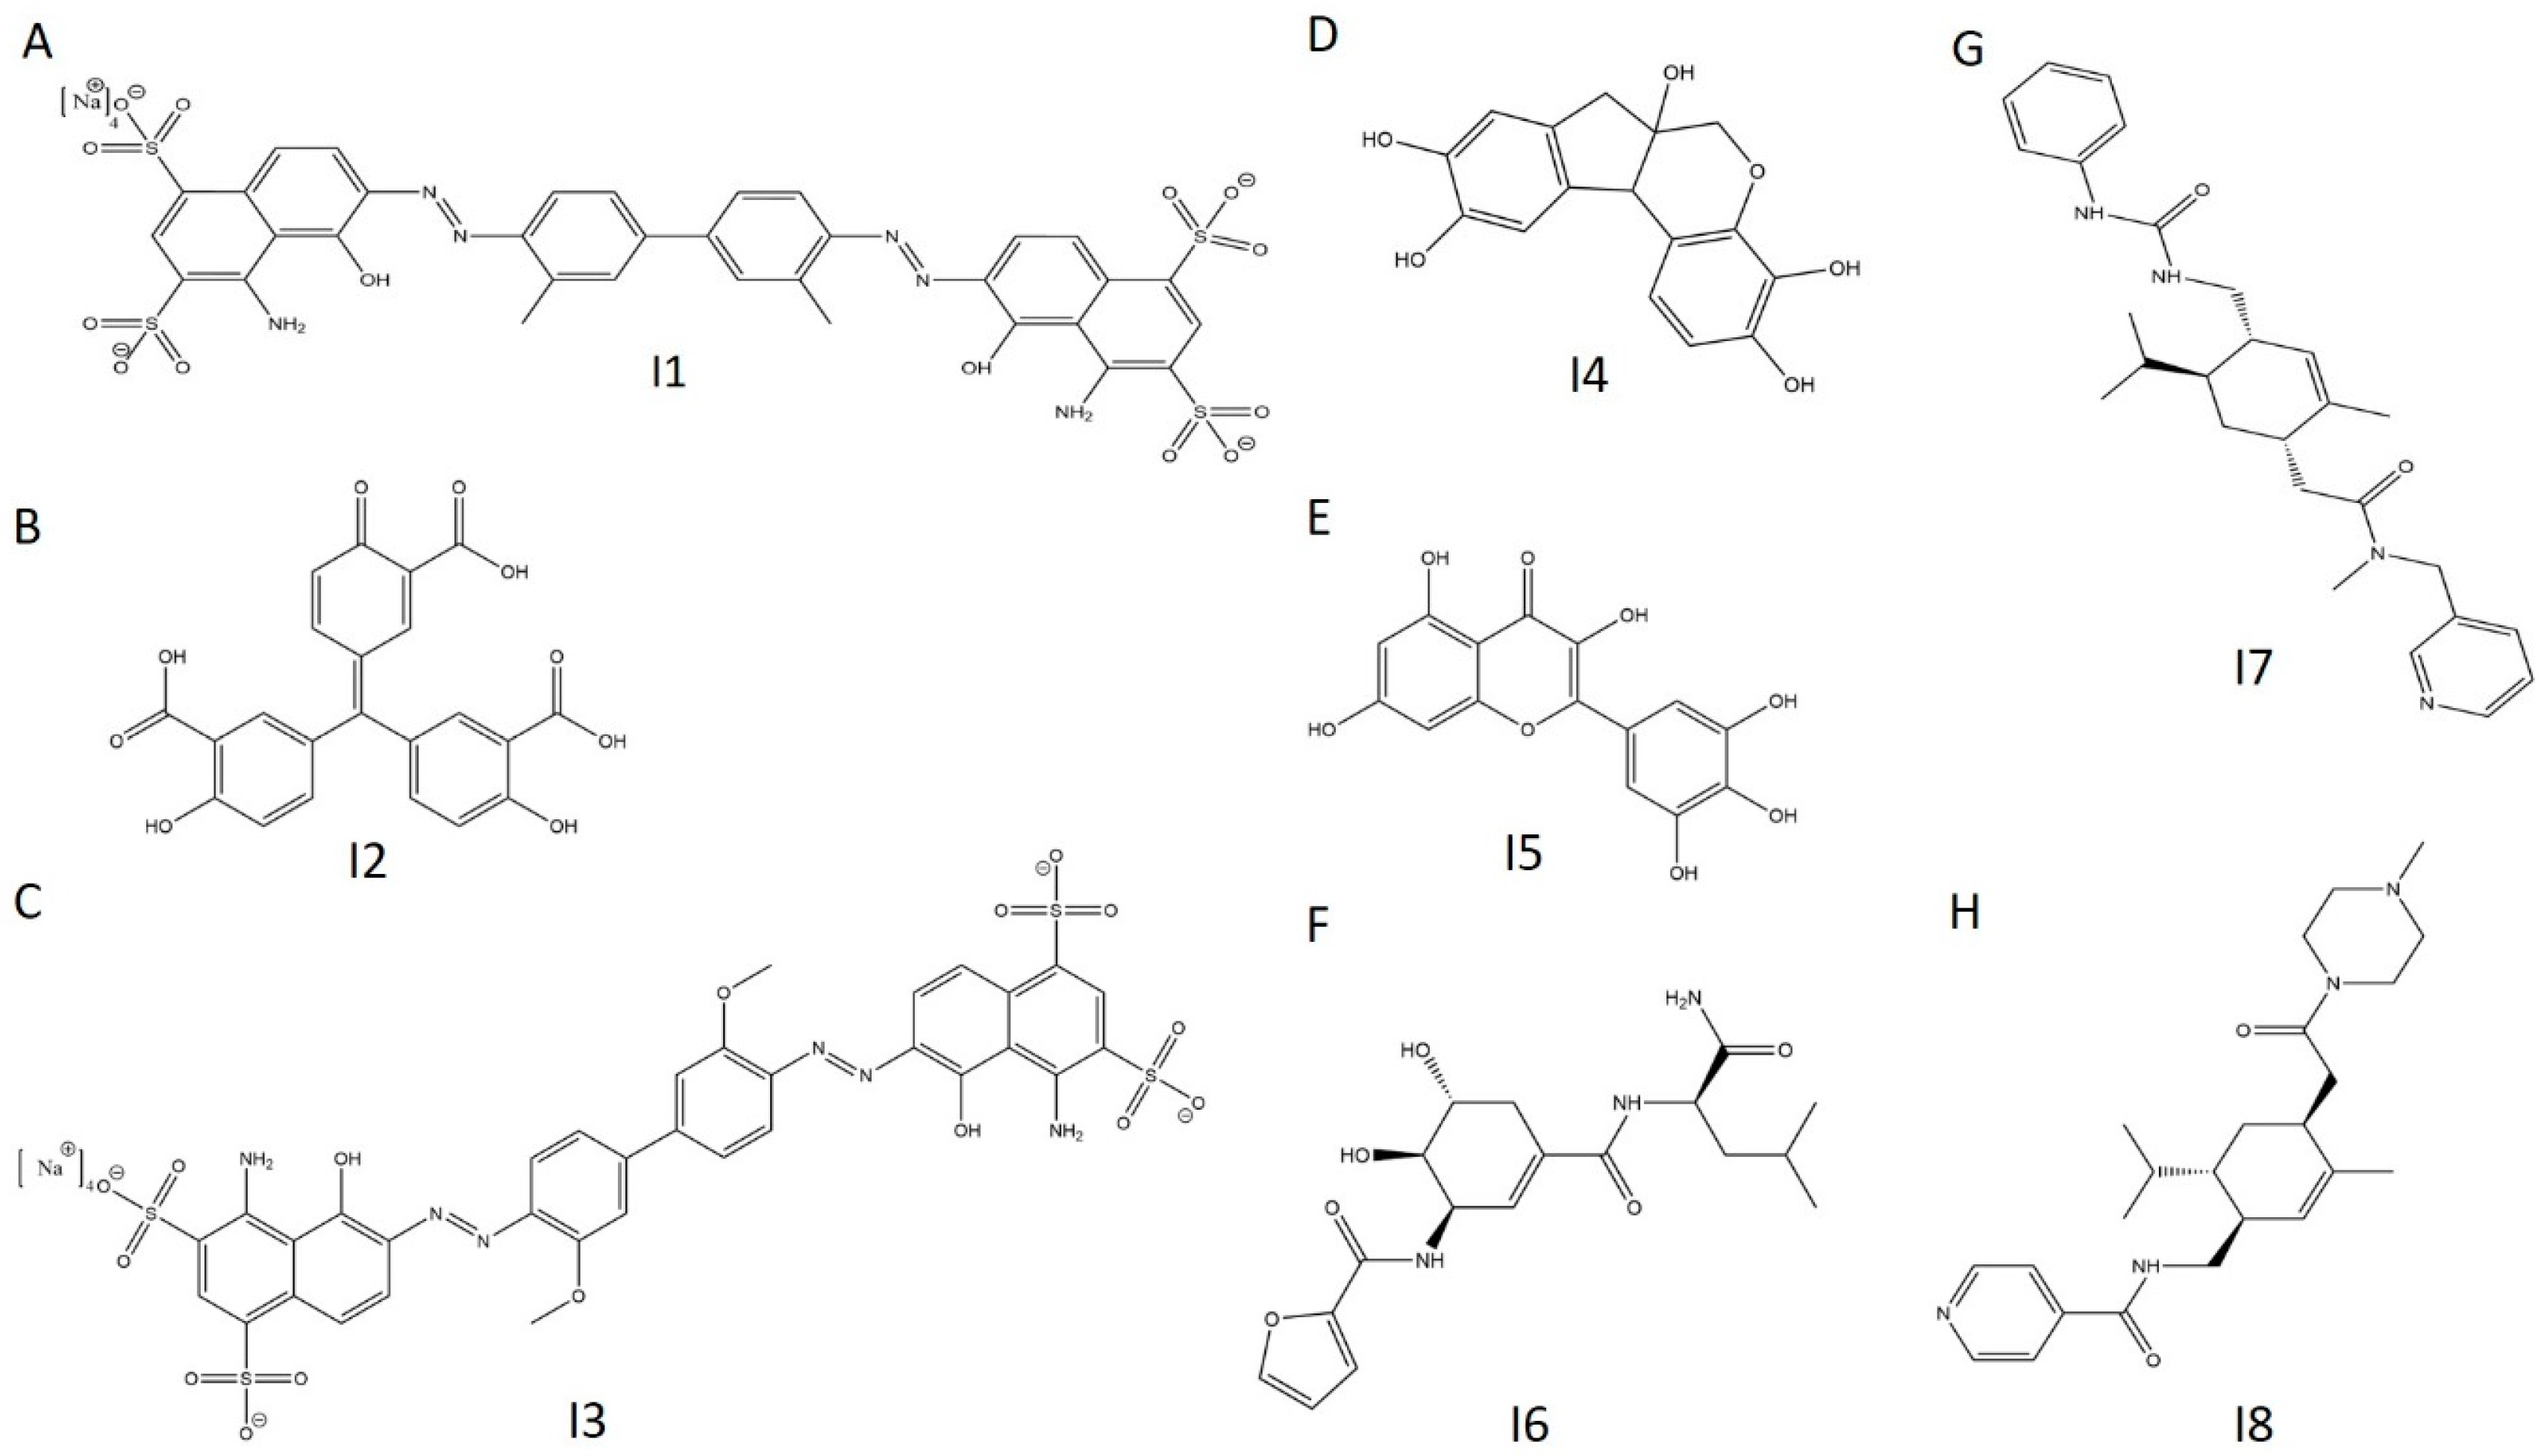
| I1 | C34H24N6Na4O14S4 | 961 | Evan’s Blue | Spectrum | 109 | 109 | 109 |
| I2 | C22H14O9 | 422 | Aurintricarboxylic Acid | LOPAC | 107 | 106 | 107 |
| I3 | C34H24N6Na4O16S4 | 993 | Chicago Sky Blue | Spectrum | 106 | 109 | 108 |
| I4 | C16H14O6 | 302 | Hematoxylin | Spectrum | 105 | 30 | 68 |
| I5 | C15H10O8 | 318 | Myricetin | LOPAC | 99 | 86 | 93 |
| I6 | C18H25N3O6 | 379 | NAT2–252122 | NATx | 106 | 102 | 104 |
| I7 | C27H36N4O2 | 449 | NAT28–408090 | NATx | 94 | 102 | 98 |
| I8 | C24H36N4O2 | 413 | NAT28–405040 | NATx | 61 | 61 | 61 |
© 2020 by the authors. Licensee MDPI, Basel, Switzerland. This article is an open access article distributed under the terms and conditions of the Creative Commons Attribution (CC BY) license (http://creativecommons.org/licenses/by/4.0/).
Share and Cite
Camara, A.; George, A.; Hebner, E.; Mahmood, A.; Paluru, J.; Mattoo, S. A Fluorescence Polarization-Based High-Throughput Screen to Identify the First Small-Molecule Modulators of the Human Adenylyltransferase HYPE/FICD. Int. J. Mol. Sci. 2020, 21, 7128. https://doi.org/10.3390/ijms21197128
Camara A, George A, Hebner E, Mahmood A, Paluru J, Mattoo S. A Fluorescence Polarization-Based High-Throughput Screen to Identify the First Small-Molecule Modulators of the Human Adenylyltransferase HYPE/FICD. International Journal of Molecular Sciences. 2020; 21(19):7128. https://doi.org/10.3390/ijms21197128
Chicago/Turabian StyleCamara, Ali, Alyssa George, Evan Hebner, Anika Mahmood, Jashun Paluru, and Seema Mattoo. 2020. "A Fluorescence Polarization-Based High-Throughput Screen to Identify the First Small-Molecule Modulators of the Human Adenylyltransferase HYPE/FICD" International Journal of Molecular Sciences 21, no. 19: 7128. https://doi.org/10.3390/ijms21197128
APA StyleCamara, A., George, A., Hebner, E., Mahmood, A., Paluru, J., & Mattoo, S. (2020). A Fluorescence Polarization-Based High-Throughput Screen to Identify the First Small-Molecule Modulators of the Human Adenylyltransferase HYPE/FICD. International Journal of Molecular Sciences, 21(19), 7128. https://doi.org/10.3390/ijms21197128