Abstract
Epidemiological studies on workers employed at the Mayak plutonium enrichment plant have demonstrated an association between external gamma ray exposure and an elevated risk of ischemic heart disease (IHD). In a previous study using fresh-frozen post mortem samples of the cardiac left ventricle of Mayak workers and non-irradiated controls, we observed radiation-induced alterations in the heart proteome, mainly downregulation of mitochondrial and structural proteins. As the control group available at that time was younger than the irradiated group, we could not exclude age as a confounding factor. To address this issue, we have now expanded our study to investigate additional samples using archival formalin-fixed paraffin-embedded (FFPE) tissue. Importantly, the control group studied here is older than the occupationally exposed (>500 mGy) group. Label-free quantitative proteomics analysis showed that proteins involved in the lipid metabolism, sirtuin signaling, mitochondrial function, cytoskeletal organization, and antioxidant defense were the most affected. A histopathological analysis elucidated large foci of fibrotic tissue, myocardial lipomatosis and lymphocytic infiltrations in the irradiated samples. These data highlight the suitability of FFPE material for proteomics analysis. The study confirms the previous results emphasizing the role of adverse metabolic changes in the radiation-associated IHD. Most importantly, it excludes age at the time of death as a confounding factor.
1. Introduction
Epidemiological studies in the Mayak Production Association occupationally exposed to chronic low-dose-rate radiation have shown a significant increase in the incidence of ischemic heart disease (IHD) causally associated with the total external gamma-ray dose. The association remains after correction for multiple competing factors such as smoking and alcohol consumption [1,2,3,4].
Our previous proteomics study using fresh-frozen tissue obtained at autopsy from the cardiac left ventricle from Mayak workers showed a dose-dependent downregulation of proteins involved in mitochondrial energy metabolism, cardiac cytoskeleton, and oxidative stress response when compared to the samples from non-irradiated controls [5,6]. However, in this study, the individuals in the occupationally exposed group (>500 mGy) were on average 10 years older than the control subjects [5]. We applied a statistical method to distinguish the dose-only dependent protein expression changes from those of the age-only dependent changes. The analysis indicated that the majority of the proteins were deregulated by the radiation dose and not the age [6]. However, the confounding role of age could not be totally excluded. To address this issue, we initiated a new study where the control group was older than the irradiated group. Due to the difficulty of obtaining additional fresh-frozen material, we decided to use formalin-fixed, paraffin-embedded (FFPE) left ventricle tissue in the new study.
FFPE tissue is an ideal source of analytical material for clinical investigations due to its stability in long-term storage [7,8,9,10,11,12,13]. The technical improvement of proteome analysis using FFPE material is a prerequisite for the successful elucidation of biological pathways. However, in spite of several technical improvements, proteomic analysis using FFPE material as an alternative to fresh-frozen tissue remains a challenge [14,15,16,17,18,19,20,21]. The harsh conditions typically used for fixation have previously prohibited successful protein identification and reproducible protein quantification [18,19,22,23]. During the formalin fixation proteins undergo degradation and cross-linking. The fixation results in a 30 Da Hydroxymethyl modification, tagged mainly on lysine residues contributing to the inter- and intramolecular cross-linking reactions [19,22,24,25]. Lysine modification affects the efficiency of protein extraction and digestion [19,26,27]. The Mass Spectrometry analysis often showed a general preferential detection of tryptic peptides with the C-terminal arginine over lysine indicating that modified lysine residues are inaccessible to protease during digestion [19,26,27].
A variety of methods that have been developed allowing the extraction of proteins from FFPE samples [9,28,29,30] have proven to be quite successful in performing proteomics analysis [9,31]. However, only a few proteomics studies using human FFPE cardiac tissue exist, probably due to the lack of this type of biomaterial [32,33].
The data presented here show the compatibility of FFPE tissue for a proteomic approach. The study suggests that chronic radiation exposure induces alterations in the heart metabolism, structure and oxidative stress response that may contribute to the radiation-induced IHD. Furthermore, it shows that these alterations are not caused by normal ageing.
2. Results
2.1. The Proteomics Analysis of FFPE Human Heart Tissue Provided a Comprehensive Cardiac Proteome Coverage
To investigate the effect of chronic radiation exposure on the cardiac left ventricle we compared the proteomes of FFPE samples collected from 5 control individuals not exposed to radiation with those from 15 individuals exposed to cumulative external gamma radiation doses of more than 500 mGy (Table S1).
The changes in the cardiac proteome were analyzed with label-free quantitative proteomics. A principal component analysis (PCA) using all proteomics features revealed that the irradiated samples were to some extent but not dose-dependently separated from the controls (Figure 1A). To examine whether the age of the individuals or the time of exposure may affect the distribution of proteome features, these two factors were merged on the PCA (Figure 1B and Table S1). The analysis confirmed that neither the age nor the years of exposure affected the distribution between the two groups (Figure 1B).
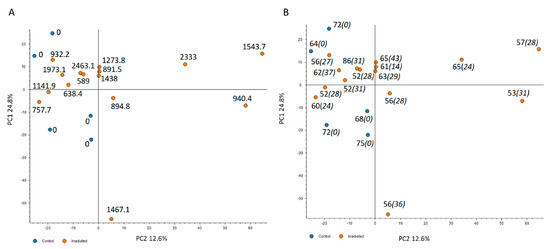
Figure 1.
The principal component analysis (PCA) based on all proteomics features. The PCA used all features resulting in PC1 and PC2 as follows: PC1 24.8% and PC2 12.6%. The distribution of proteomics features is illustrated based on the dose (mGy) (A), the age (regular font) and the years of exposure (italics) (B). The control samples are presented as blue spots and the irradiated samples with the corresponding individual dose in orange. The analysis was performed using the Proteome Discoverer 2.3 software (Thermo Scientific, Waltham, MA, USA). Detailed information of the sample donors and the exact doses are given in Table S1.
A total number of 2663 proteins were identified and quantified, of which 1855 proteins were quantified with at least two unique peptides across multiple samples (Table S2). The majority of proteins were identified with 2–10 unique peptides (Figure 2A and Table S2). Surprisingly, this indicated markedly more identifications than in our previous study using fresh-frozen material with 1281 identified proteins [5].
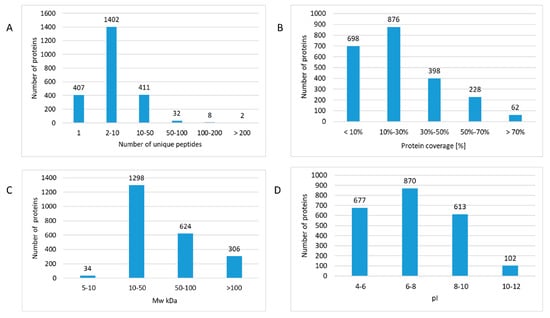
Figure 2.
The features of protein identifications in formalin-fixed paraffin-embedded (FFPE) proteomics. The number of identified proteins was assigned based on the number of unique peptides (A), protein coverage (B), molecular weight (MW kDa) (C), and isoelectric point (pI) (D). The analysis was performed using the Proteome Discoverer 2.3 software (Thermo Scientific, Waltham, MA, USA). Detailed information of the proteomics features is given in Table S2.
Furthermore, a broad dynamic range of cardiac proteome was covered since almost 70% of all proteins were identified with sequence coverages up to 30% (Figure 2B and Table S2). The theoretical molecular weight of the identified proteins ranged from 5 kDa (thymosin beta-10) up to 3814 kDa (titin). The molecular weight of the majority (57%) of the identified proteins was between 10–50 kDa but also several high molecular weight (>100 kDa) proteins were identified (Figure 2C and Table S2). The analysis covered a broad range of cardiac proteins with different isoelectric points (pIs) (Figure 2D and Table S2). The pI values ranged from 3.78 (prothymosin alpha) to 12.56 (60S ribosomal protein L39) (Table S2). Strongly basic proteins including different mitochondrial subunits and ribosomal proteins were identified (Table S2).
In order to investigate the efficiency of protein extraction to revert the cross-linking modifications, a 30 Da hydroxymethyl modification was set for the lysine and arginine during searching against the database [19]. The reanalysis of the generated 28,798 peptides revealed that only 2.7% of all identified peptides contained modified lysine or arginine residues (Table S3) suggesting an efficient removal of modifications induced by cross-linking during protein extraction.
To investigate the effect of the heterogeneity of the individuals on the variance of the proteome profiles between samples, the abundance of the non-normalized intensity values for each individual was compared (Figure 3 and Table S2). Despite the expected heterogeneity, the analysis showed a uniform distribution for the intensity of identified proteins between individuals. This finding was in a good agreement with the coefficient of variation (CV) of the protein intensity detected in different individuals. The mean values of CV% were 13.10 and 13.83 for protein abundances in irradiated and control groups, respectively (Table S4).
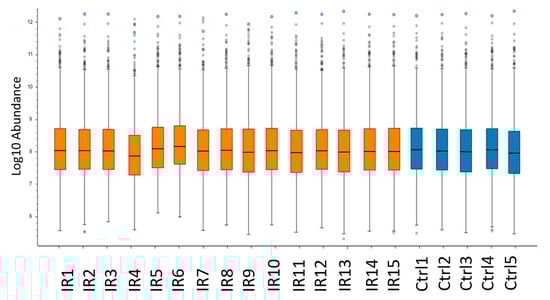
Figure 3.
Comparison of protein abundance between heart samples. The box-and-whisker plot shows the abundance of the not-normalized intensity values for each individual of irradiated (IR) and control (Ctrl) groups. The analysis was performed using the Proteome Discoverer 2.3 software (Thermo Scientific, Waltham, MA, USA). Detailed information of the sample donors and the exact doses are given in Table S4.
2.2. Proteomic Analysis of FFPE Cardiac Tissue Showed Alteration of the Heart Proteome after Chronic Irradiation
Among the quantified proteins with two or more unique peptides, the expression level of 196 proteins was significantly different between irradiated samples and controls (2 unique peptides; ±1.3-fold; p < 0.05). Of these, 105 proteins were downregulated and 91 upregulated in the irradiated samples (Table 1).

Table 1.
Significantly deregulated proteins in irradiated cardiac left ventricle proteome. The proteins listed in the table were identified and quantified by two or more unique peptides; fold changes and p-values are shown.
A volcano plot of all quantified and significantly deregulated proteins is shown in Figure 4A. The heat map based on the intensity of differentially regulated proteins in all individual samples showed a clear difference between the control and irradiated groups (Figure 4B).
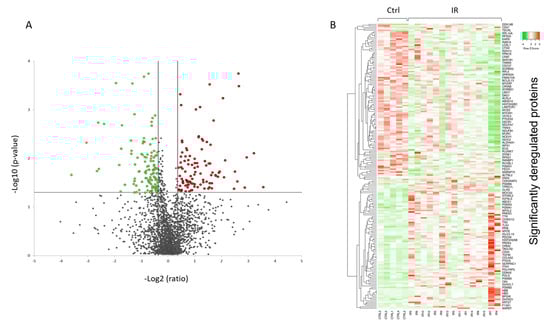
Figure 4.
Graphical representation of quantitative proteomics data of human FFPE cardiac tissue after chronic irradiation. Proteins are ranked in a volcano plot according to the −log10 of their statistical p-value (y-axis) and log2 fold change (x-axis). The green and red points represent the significantly downregulated and upregulated proteins, respectively (A). The heat map shows hierarchical clustering (average linkage, Spearman ranked correlation) of significantly deregulated proteins in 5 controls (Ctrl) and 15 irradiated (IR) samples (B). The green bars indicate downregulation and the red bars upregulation. The analysis was performed using Heatmapper web server [34]. Detailed information of the proteomics features and individuals is given in Tables S1 and S2.
Among the differentially regulated proteins were several lipid metabolism enzymes (Table 1). Long-chain-fatty-acid—CoA ligase 4 (ACSL4), hydroxyacyl-coenzyme A dehydrogenase (HADH), 2,4-dienoyl-CoA reductase (DECR1), enoyl-CoA hydratase (ECHS1), isovaleryl-CoA dehydrogenase (IVD), and enoyl-CoA delta isomerase 2 (ECI2) were all downregulated.
A number of proteins belonging to the sirtuin pathway and mitochondrial respiratory chain were also significantly downregulated in the irradiated samples (Table 1). The level of mitochondrial import inner membrane translocase (TIMM9), mitochondrial import receptor (TOMM22), and that of several proteins in the mitochondrial complexes I and V was reduced in the irradiated samples (Table 1).
Similarly, the data also showed downregulation in the expression of actin cytoskeleton components such as troponin I (TNNI3), troponin T (TNNT2), and different myosin isoforms including myosin heavy chain 14 (MYH14), myosin regulatory light chain 2 (MYL2), myosin light chain 4 (MYL4), and myomesin-1 (MYOM1) (Table 1). In contrast, several collagen isoforms were upregulated in the proteomics data, including collagen type XII alpha 1 chain (COL12A1), collagen type XV alpha 1 chain (COL15A), collagen type VI alpha 1 chain (COL6A) and collagen type VI alpha 2 chain (COL6A2) (Table 1).
The levels of several proteins of the oxidative stress response, namely catalase (CAT), peroxiredoxin 2 (PRDX2), peroxiredoxin 4 (PRDX4), extracellular superoxide dismutase [Cu-Zn] (SOD3), glutathione hydrolase 5 (GGT5), and glutaredoxin-1 (GLRX), were altered, most showing upregulation (Table 1).
A detailed analysis of the functional interactions and biological pathways of the deregulated proteins was performed using Ingenuity Pathway Analysis (IPA) software. Fatty acid metabolism, sirtuin signaling, mitochondrial dysfunction, protein ubiquitination, tissue fibrosis, cytoskeleton organization, and oxidative stress were the most affected pathways in the irradiated samples compared to the control (Figure 5A and Table S5). Especially two biological networks showed enrichment of deregulated proteins. The predicted regulators of these networks were the peroxisome proliferator-activated receptor (PPAR) alpha and transforming growth factor beta-1 (TGFB1) (Figure 5B,C, Table S5). PPAR alpha was predicted to be inactivated in irradiated samples, whilst TGF beta was predicted to be activated. Differentially expressed proteins were associated with cardiotoxicity-related pathways including cardiac dilation, cardiac enlargement, cardiac dysfunction, heart failure, and cardiac fibrosis (Table S5).
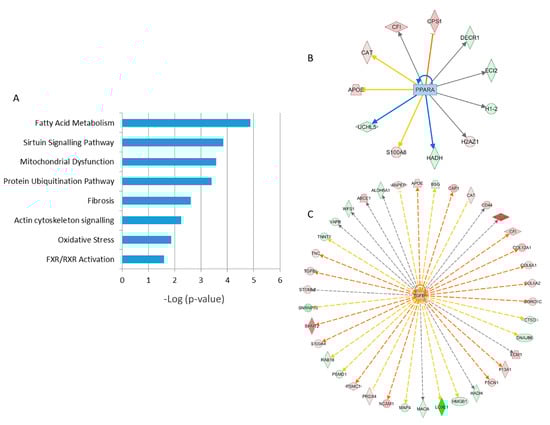
Figure 5.
Pathway analysis of differentially regulated proteins from human FFPE heart tissues. The most significant canonical pathways altered by irradiation are shown. The analyses were generated using Ingenuity Pathway Analysis (IPA) (QIAGEN Inc., Hilden, Germany, https://www.qiagenbio-informatics.com/products/ingenuity-pathway-analysis) (Table S5). The bars indicate canonical pathways and the y-axis displays the −(log p) enrichment significance. The tall bars are more significant than the short ones (A). Graphical representation of the deregulated protein networks with their upstream transcriptional regulators peroxisome proliferator-activated receptor (PPAR) alpha (B) and transforming growth factor beta (TGFB) (C) are shown. The upregulated proteins are marked in red and the downregulated in green. The nodes in blue (inhibition) and orange (activation) represent transcription factors. The full protein names are given in Table 1.
2.3. Chronic Irradiation Alters Myocardial Histomorphology
The proteomics data showed that the expression of several proteins belonging to the TGF beta signaling pathway was significantly changed in the irradiated hearts. These proteins included collagen isoforms that were all upregulated in irradiated samples. Therefore, we analyzed the deposition of collagen in FFPE cardiac tissue samples using a histomorphological approach (Figure S1A–C).
The analysis displayed moderate to marked variation in the tissue composition regarding the proportions of the myocardium, epicardium, endocardium, coronary vasculature, and epicardial adipose tissue present on the respective sections, and presumable tissue locations of origin (ventricular or interventricular septal myocardium) between different individual samples of both groups. Similarly, the degrees and severities of histopathological alterations (fibrosis, inflammatory infiltrates, lipomatosis) varied between individuals.
Interestingly, the histopathological evaluation of tissue sections taken from the irradiated group revealed multifocal, moderate to severe interstitial myocardial fibrosis (Figure 6A,B). This was evident as large areas of coalescing foci of fibrotic or scar tissue extending into the myocardium. These foci replaced and surrounded individual cardiomyocytes and clusters of heart muscle cells. Additionally, moderate myocardial lipomatosis and multifocal interstitial lymphocytic and plasmacytic infiltrations were occasionally present in the irradiated samples. Cardiac vessels, particularly larger arteries displayed thickened vascular walls with expanded intimal and medial layers. The individual sections assigned to the control group also displayed variable histopathological lesions, including mild to moderate interstitial myocardial fibrosis and subacute severe myocardial degeneration and necrosis with vascular congestion and oedema, whereas two sections showed no relevant histopathological lesions (Figure 6A,B, and Table S6). On the average, the relative area of fibrotic tissue within the myocardium was 16 ± 11% in the control sections and 22 ± 13% in radiation-exposed heart tissue sections (Figure 6C and Figure S1C, and Table S6). Although the fibrotic area was bigger in most irradiated samples compared to the controls, this difference did not reach statistical significance.
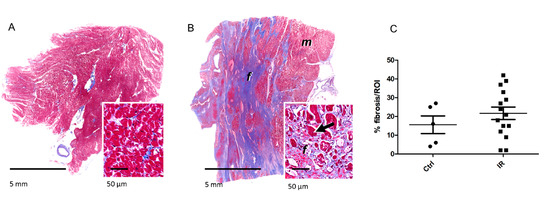
Figure 6.
The detection of fibrosis in the heart samples. The sections were stained with Mason’s Trichrome for visualization of connective tissue. The fibrotic area was shown in representative sections of the myocardium in control (A) and irradiated samples (B). Myocytes (m) are stained in red, fibrous connective tissue (f) in blue. The arrows indicate degenerating cardiomyocytes entrapped by fibrosis. The areas of fibrotic tissue within the myocardium were quantified and presented as percentage of region of interest (ROI) (C). The icons represent individual samples in control (Ctrl) and irradiated (IR) groups. The details are given in Table S6.
2.4. Radiation-Induced Changes Identified by FFPE Proteome Profiling are Comparable to Those Observed in Irradiated Fresh Frozen Hearts
Using a protein–protein interaction and pathway analysis, we compared the proteomics data from the FFPE and previously analyzed fresh-frozen tissue [5]. Proteome profiling of both studies indicated similar cardiac response to chronic radiation exposure (Figure 7). A comparison between the studies indicated that chronic irradiation strongly affected cardiac metabolism, structure, and stress response (Figure 7A). Moreover, both analyses showed alterations in several proteins associated with heart pathologies including heart failure, fibrosis, inflammation, and hypertrophy (Figure 7B).
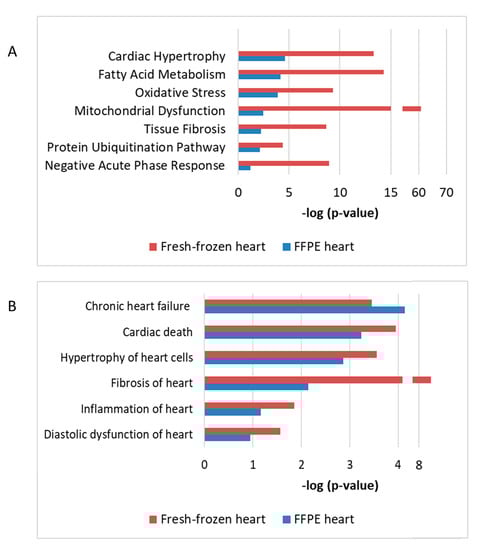
Figure 7.
The comparison of proteomics data using FFPE or fresh-frozen cardiac material The enriched protein clusters of different affected pathways (A) and cardiac pathologies (B) were compared using data from the FFPE and fresh frozen cardiac tissue. The analyses were performed using IPA (QIAGEN Inc., Hilden, Germany, https://www.qiagenbio-informatics.com/products/ingenuity-pathway-analysis). The bars indicate affected pathways (A) or predicted diseases (B) and the y-axis displays the −(log p) enrichment significance. The tall bars are more significant than the short ones.
3. Discussion
This is, to the best of our knowledge, the first study performed on human FFPE heart tissue to analyze the late effects of chronic radiation exposure. The data presented here emphasize the suitability of FFPE material for proteomic investigation. The sequential urea/SDS extraction and filter-aided sample preparation (FASP) digestion have markedly improved the number of identified and quantified proteins in this kind of material [16]. Proteome profile of the FFPE material showed even more protein identifications than the one using fresh-frozen cardiac tissue [5]. However, a direct comparison of the two studies is difficult due to the differences in the experimental design, sample size, analytical performances in mass spectrometry, and applications used for quantification and data analysis. Furthermore, the controls and the workers included in the two studies were different individuals with a differing age distribution. Nevertheless, the main results of the two studies were similar both showing considerable radiation-induced changes in proteins involved in the heart metabolism and structure. Since the control group in this study was on the average older than the irradiated group, these changes were not resulting from ageing.
The downregulation of mitochondrial proteins in respiratory chain complexes was observed in both studies. This is also in agreement with our previous data from mice where local heart irradiation was shown to induce persistent functional and proteome alterations in cardiac mitochondria [16,35,36,37]. This was associated with reduced activity of the complex I [38].
In consonance with the previous human study [5], the proteomics data here indicated a cluster of oxidative stress response proteins. Mitochondrial dysfunction is accompanied by enhanced reactive oxygen species (ROS) production [39]. Persistently increased mitochondrial ROS level has been shown to result from local heart irradiation in mice [36,38].
The sirtuin signaling was one of the most affected pathways in the present study. Deficiencies in mitochondrial oxidative phosphorylation, in particular in complex I, lead to a decrease in NAD+/NADH ratio and disruption of sirtuin signaling in the heart [39]. We have recently shown decreased SIRT1 and SIRT3 activity associated with hyperacetylation of cardiac mitochondrial proteins following chronic irradiation in ApoE-/- mice [40].
The proteomic analysis showed alterations in several lipid metabolism enzymes in irradiated hearts. The functional analysis of deregulated proteins analysis predicted inactivation of PPAR alpha, a key transcriptional regulator of fatty acid metabolism, in irradiated samples. The impairment of the PPAR alpha pathway and inhibition of lipid metabolism enzymes have been repeatedly reported in radiation-induced cardiac damage [5,37,41,42]. We have shown previously the upregulation of the inactive (phosphorylated) form of PPAR alpha in cardiac samples of Mayak workers [5].
Cardiac fibrosis is a well-known side consequence of radiotherapy [43,44]. In this study, we investigated the effects of chronic low-dose-rate radiation with cumulative doses much lower than used in therapeutic applications. Yet, the proteomics data indicated upregulation of collagen isoforms and predicted activation of TGF beta signaling in irradiated hearts. The morphology analysis also indicated large foci of fibrotic tissue in the irradiated samples although in comparison with the controls this did not reach statistical significance. Increased expression of proteins involved in the fibroblast to myofibroblast differentiation was shown in mice after high doses of local heart irradiation, with the activation of TGF beta playing a central role [41]. Increased concentration of TGF beta has been reported in the serum of Mayak workers exposed to external gamma rays suggesting a systemic elevation in the level of this cytokine in this cohort [45].
Increased collagen deposition and fibrosis may induce changes in actin cytoskeleton [46]. Myofibrillar remodeling is typically found in cardiac conditions affected by IHD [47,48] and seems to be present in the radiation-induced form of the disease as well as indicated even previously [5,42].
Taken together, this study gives support to the earlier findings suggesting that cardiac metabolic and structural impairment observed in radiation-induced IHD are two sides of the same coin [49]. The deregulation of structural proteins may well be coupled to mitochondrial damage, resulting in impairment in the energy supply and increased mitochondrial ROS production. Since the inactivation of PPAR alpha seems to play an important role in this vicious circle one possible way forward would be to test the impact of PPAR alpha agonists in preventing radiation-associated heart disease.
4. Material and Methods
4.1. Human FFPE Heart Samples
Biological samples were collected post mortem from donors who had previously given informed consent to participate in the study and who had consented to the processing of their data following the Russian Federal Laws № 323-FL of 27.09.2013 and № 261-FL of 25.07.2011. The study was approved by the Southern Urals Biophysics Institute’s Institutional Review Board and the formal approval No. 01/2011 as of 15.02.2011 was issued. The probands were male Mayak plutonium enrichment plant workers who were exposed only to external gamma rays. The control subjects were non-Mayak workers living in the same local area. All participants were diagnosed multiple times with IHD during their lifetime, and this was also listed as the primary cause of death. Workers exposed to internal plutonium (Pu alpha-activity in urine >0.5 kBq) or diagnosed with cancer or other major somatic diseases were excluded from the study.
The histology slides were prepared according to the conventional method used in hospital dissecting rooms and departments of morbid anatomy at research institutions of the Soviet Union and later the Russian Federation. Tissue resections were taken by an autopsist immediately during the autopsy procedure. A piece of the cardiac left ventricle (size 1 cm × 1.5 cm, 5 mm thick) was dissected from each organ and placed in a labelled cassette. Cassettes were put in containers with 10% buffered formalin fixative (pH between 7.2 and 7.4) for 24 h to 48 h. The volume of fixative was at least 20 times of the volume of the tissue specimen to ensure its complete infiltration with the fixative. After fixation, sample pieces were washed in the running tap water for 24 h to 36 h to remove redundant fixative. The older samples (before the year 2000) were serially dehydrated in an ethanol series from 50% to 100% and cleared in a mixture of absolute ethanol and chloroform to a final concentration of pure chloroform. Following dehydration and clearing of specimens, the samples were infiltrated and embedded using chloroform-paraffin mix and paraffin with beeswax. After the year 2000, xylene was used instead of chloroform for clearing. Then, the samples were infiltrated gradually in 2 containers of xylene and embedded in homogenized paraffin containing plasticizing agents with a melting temperature of 55 °C. Once the paraffin casing had solidified, blocks were taken out of the casts, sectioned with a microtome and stored in a repository.
For the current study, we used the FFPE heart tissues from 20 individuals, allocated between two dose groups as follows: 5 non-irradiated individuals to the control group (0 Gy), 15 Mayak workers to the dose group >500 mGy (Table S1). The smoking status and index, alcohol consumption and body mass index of each individual are indicated in Table S1. The individuals in the irradiated group were exposed to the radiation dose in range of 580 mGy to 2463 mGy (Table S1). The average age of the controls and irradiated group was 70 and 59.7 years, respectively (Table S1). Only one of the individuals from the irradiated group was older than 70 years (Table S1).
4.2. Proteomic Sample Preparation and LC-MSMS Measurement
FFPE tissue sections were deparaffinized by incubating twice with xylene for 10 min at room temperature before rehydration in a graded series of ethanol (100%, 95%, and 70%). De-crosslinking of FFPE tissue samples was performed in TBS for 60 min at 99 °C. After dilution with equal volumes of urea buffer (8 M urea in 0.1 M Tris/HCl pH 8.5), the tissue was lysed by homogenization in a Precellys homogenizer (Bertin, Montigny-le-Bretonneux, France). SDS was added to a final concentration of 0.2% before further incubation for 30 min at room temperature. Protein concentration was determined by Bradford assay. The lysed tissue was subjected to tryptic protein digest using a modified filter-aided sample preparation (FASP) protocol [21].
Equal peptide amounts per samples were measured on a Q-Exactive HF-X mass spectrometer (Thermo Scientific, Waltham, MA, USA) online coupled to an Ultimate 3000 nano-RSLC (Thermo Scientific, Dionex, Waltham, MA, USA). Tryptic peptides were automatically loaded on a C18 trap column (300 µm inner diameter × 5 mm, Acclaim PepMap100 C18, 5 µm, 100 Å, Thermo Scientific, Waltham, MA, USA) prior to C18 reversed-phase chromatography on the analytical column (nanoEase MZ HSS T3 Column, 100Å, 1.8 µm, 75 µm × 250 mm, Waters, Rydalmere, NSW, Australia) at 250 nL/min flow rate in a 95 min non-linear acetonitrile gradient from 3 to 40% in 0.1% formic acid. Profile precursor spectra from 300 to 1500 m/z were recorded at 60,000 resolution with automatic gain control target of 3e6 and maximum injection time of 30 ms. Subsequently, TOP15 fragment spectra of charges 2 to 7 were recorded at 15,000 resolution with an AGC target of 1e5, a maximum injection time of 50 ms, an isolation window of 1.6 m/z, normalized collision energy of 28 and a dynamic exclusion of 30 s.
The individual raw-files were loaded to the Proteome Discoverer 2.3 software (Thermo Scientific, Waltham, MA, USA) allowing for peptide identification and label-free quantification using the Minora node. Searches were performed using Sequest HT as a search engine in the Swiss-Prot human database with the following search settings: 10 ppm precursor tolerance, 0.02 Da fragment tolerance, two missed cleavages allowed, carbamidomethyl on cysteine as a fixed modification, deamidation of glutamine and asparagine and hydroxymethyl modification of lysine and arginine were allowed as variable modifications, as well as oxidation of methionine and Met-loss combined with acetylation at the N-terminus of the protein. After filtering for a 5% peptide and protein false discovery rate, proteins were quantified by summing up abundances of allocated unique and razor peptides. Resulting normalized protein abundances were used for calculation of fold-change and p-values of the individual proteins. Principal components analysis was exported from the Proteome Discoverer 2.3 software. For final quantifications, proteins identified with at least 2 unique peptides and with fold change ratios greater than 1.30-fold or less than 0.77-fold (p < 0.05) were defined as being significantly differentially expressed. Hierarchical clustering was made by Heatmapper online web server [34].
4.3. Protein–Protein Interaction and Signaling Network
The analyses of protein-protein interaction and signaling networks were performed by the software tool INGENUITY Pathway Analysis (IPA) (QIAGEInc., Hilden, Germany https://www.qiagenbioinformatics.com/products/ingenuity-pathway-analysis) [50].
4.4. Histopathology and Morphometric Analyses of Tissue Composition and Cardiac Fibrosis
Histopathological analyses were performed on 3 µm hematoxylin and eosin (HE)-stained paraffin sections. Masson’s Trichrome staining for connective tissue was used to demonstrate fibrosis. Histological sections were examined in a blinded fashion. The section areas of fibrotic tissue within the myocardium were quantified by digital image analysis using automated digital image analysis (Definiens Developer XD 2, Definiens® AG, Munich, Germany). Epicardial tissue and heart valve section profiles were excluded from the analysis.
4.5. Statistical Analysis
Comparative analysis of the data was carried out using the Student’s t-test (unpaired). The significance levels were p* < 0.05.
4.6. Data Availability
The raw MS data have been deposited in the RBstore database, Study ID: 1158: (https://www.storedb.org/store_v3/study.jsp?studyId=1158).
5. Conclusions
The data presented here show the applicability of the FFPE cardiac tissue in retrospective proteomic analysis with good identification of proteins of different molecular weight and pI. This is of advantage since attaining human biomaterial, especially cardiac material, for scientific purposes is in general complicated. Thus, using archival FFPE material now enables the investigation of molecular alterations associated with severe heart pathologies. This study demonstrates a series of radiation-induced changes in signaling pathways mainly involved in metabolic aspects probably contributing to this particular form of IHD. These data also exclude the confounding effect of the age in the radiation response of the heart.
Supplementary Materials
The following are available online at https://www.mdpi.com/1422-0067/21/18/6832/s1, Figure S1: Myocardial histology in FFPE heart samples. Table S1: Detailed information of the donors for FFPE tissue samples. Table S2: All identified and quantified human FFPE heart proteins using label-free proteomics, Table S3: All peptides identified and quantified by label free quantification approach. Table S4: Coefficient of variation (CV) of the intensity of all identified proteins in each sample. Table S5: IPA Analysis of significantly affected pathways and networks in FFPE heart proteome. Table S6. Masson’s Trichrome-stained paraffin sections and corresponding fibrotic section areas per ROI (%), as determined by digital image analysis.
Author Contributions
Conceptualization, O.A., S.T. and T.A.; methodology, O.A., J.M.-P. and A.B.; software, O.A., J.M.-P. and A.B.; validation, O.A., J.M.-P., A.B. and T.A.; formal analysis, O.A., J.M.-P., A.B., M.M. and O.Z.; investigation, O.A., S.T. and T.A.; resources, T.A., A.F., S.M.H., M.J.A. and S.T.; data curation, O.A., J.M.-P., A.B., M.M. and O.Z.; writing—original draft preparation, O.A., J.M.-P., A.B. and S.T.; writing—review and editing, O.A., M.J.A. and S.T.; visualization, O.A., J.M.-P., and A.B.; supervision, O.A., T.A., A.F., S.M.H., M.J.A. and S.T.; project administration, T.A., N.A., A.F., S.M.H., M.J.A., and S.T.; funding acquisition, T.A., N.A., and S.T. All authors have read and agreed to the published version of the manuscript.
Funding
This work was supported by grants from Federal Office for Radiation Protection (BfS) (# 3611S30022), Federal Medical Biological Agency (FMBA Russia) and the European Community’s Seventh Framework Program (EURATOM), # 295823 PROCARDIO.
Acknowledgments
We thank Christine von Törne for critical feedback and Fabian Gruhn for technical assistance.
Conflicts of Interest
The authors declare no conflict of interest.
Abbreviations
| MDPI | Multidisciplinary Digital Publishing Institute |
| DOAJ | Directory of open access journals |
| FFPE | Formalin-Fixed Paraffin-Embedded |
| IHD | ischemic heart disease |
| PCA | principal component analysis |
| pI | Isoelectric points |
| CV | coefficient of variation |
| IR | Irradiated |
| Ctrl | control |
| IPA | Ingenuity Pathway Analysis |
| PPAR alpha | peroxisome proliferator-activated receptor alpha |
| TGFB | transforming growth factor beta-1 |
| ROI | region of interest |
| FASP | filter-aided sample preparation |
| HE | Hematoxylin and eosin-stained paraffin sections |
References
- Azizova, T.V.; Grigorieva, E.S.; Hunter, N.; Pikulina, M.V.; Moseeva, M.B. Risk of mortality from circulatory diseases in Mayak workers cohort following occupational radiation exposure. J. Radiol. Prot. 2015, 35, 517–538. [Google Scholar] [CrossRef]
- Azizova, T.V.; Muirhead, C.R.; Druzhinina, M.B.; Grigoryeva, E.S.; Vlasenko, E.V.; Sumina, M.V.; O’Hagan, J.A.; Zhang, W.; Haylock, R.G.; Hunter, N. Cardiovascular diseases in the cohort of workers first employed at Mayak PA in 1948–1958. Radiat. Res. 2010, 174, 155–168. [Google Scholar] [CrossRef] [PubMed]
- Azizova, T.V.; Muirhead, C.R.; Moseeva, M.B.; Grigoryeva, E.S.; Vlasenko, E.V.; Hunter, N.; Haylock, R.G.; O’Hagan, J.A. Ischemic heart disease in nuclear workers first employed at the Mayak PA in 1948–1972. Health Phys. 2012, 103, 3–14. [Google Scholar] [CrossRef] [PubMed]
- Azizova, T.V.; Grigoryeva, E.S.; Haylock, R.G.; Pikulina, M.V.; Moseeva, M.B. Ischaemic heart disease incidence and mortality in an extended cohort of Mayak workers first employed in 1948–1982. Br. J. Radiol. 2015, 88, 20150169. [Google Scholar] [CrossRef] [PubMed]
- Azimzadeh, O.; Azizova, T.; Merl-Pham, J.; Subramanian, V.; Bakshi, M.V.; Moseeva, M.; Zubkova, O.; Hauck, S.M.; Anastasov, N.; Atkinson, M.J.; et al. A dose-dependent perturbation in cardiac energy metabolism is linked to radiation-induced ischemic heart disease in Mayak nuclear workers. Oncotarget 2017, 8, 9067–9078. [Google Scholar] [CrossRef] [PubMed]
- Papiez, A.; Azimzadeh, O.; Azizova, T.; Moseeva, M.; Anastasov, N.; Smida, J.; Tapio, S.; Polanska, J. Integrative multiomics study for validation of mechanisms in radiation-induced ischemic heart disease in Mayak workers. PLoS ONE 2018, 13, e0209626. [Google Scholar] [CrossRef] [PubMed]
- Bayer, M.; Angenendt, L.; Schliemann, C.; Hartmann, W.; Konig, S. Are formalin-fixed and paraffin-embedded tissues fit for proteomic analysis? J. Mass Spectrom. 2019, 55, e4347. [Google Scholar] [CrossRef] [PubMed]
- Zhu, Y.; Weiss, T.; Zhang, Q.; Sun, R.; Wang, B.; Yi, X.; Wu, Z.; Gao, H.; Cai, X.; Ruan, G.; et al. High-throughput proteomic analysis of FFPE tissue samples facilitates tumor stratification. Mol. Oncol. 2019, 13, 2305–2328. [Google Scholar] [CrossRef]
- Giusti, L.; Angeloni, C.; Lucacchini, A. Update on proteomic studies of formalin-fixed paraffin-embedded tissues. Expert Rev. Proteom. 2019, 16, 513–520. [Google Scholar] [CrossRef]
- Tapio, S.; Hornhardt, S.; Gomolka, M.; Leszczynski, D.; Posch, A.; Thalhammer, S.; Atkinson, M.J. Use of proteomics in radiobiological research: Current state of the art. Radiat. Environ. Biophys. 2010, 49, 1–4. [Google Scholar]
- Tapio, S.; Atkinson, M.J. Molecular information obtained from radiobiological tissue archives: Achievements of the past and visions of the future. Radiat. Environ. Biophys. 2008, 47, 183–187. [Google Scholar] [CrossRef] [PubMed]
- Tapio, S.; Schofield, P.N.; Adelmann, C.; Atkinson, M.J.; Bard, J.L.; Bijwaard, H.; Birschwilks, M.; Dubus, P.; Fiette, L.; Gerber, G.; et al. Progress in updating the European Radiobiology Archives. Int. J. Radiat. Biol. 2008, 84, 930–936. [Google Scholar] [CrossRef] [PubMed]
- Gustafsson, O.J.; Arentz, G.; Hoffmann, P. Proteomic developments in the analysis of formalin-fixed tissue. Biochim. Biophys. Acta 2015, 1854, 559–580. [Google Scholar] [CrossRef] [PubMed]
- Nirmalan, N.J.; Harnden, P.; Selby, P.J.; Banks, R.E. Development and validation of a novel protein extraction methodology for quantitation of protein expression in formalin-fixed paraffin-embedded tissues using western blotting. J. Pathol. 2009, 217, 497–506. [Google Scholar] [CrossRef] [PubMed]
- Tanca, A.; Addis, M.F.; Pagnozzi, D.; Cossu-Rocca, P.; Tonelli, R.; Falchi, G.; Eccher, A.; Roggio, T.; Fanciulli, G.; Uzzau, S. Proteomic analysis of formalin-fixed, paraffin-embedded lung neuroendocrine tumor samples from hospital archives. J. Proteom. 2011, 74, 359–370. [Google Scholar] [CrossRef]
- Azimzadeh, O.; Scherthan, H.; Yentrapalli, R.; Barjaktarovic, Z.; Ueffing, M.; Conrad, M.; Neff, F.; Calzada-Wack, J.; Aubele, M.; Buske, C.; et al. Label-free protein profiling of formalin-fixed paraffin-embedded (FFPE) heart tissue reveals immediate mitochondrial impairment after ionising radiation. J. Proteom. 2012, 75, 2384–2395. [Google Scholar] [CrossRef]
- Tanca, A.; Pagnozzi, D.; Burrai, G.P.; Polinas, M.; Uzzau, S.; Antuofermo, E.; Addis, M.F. Comparability of differential proteomics data generated from paired archival fresh-frozen and formalin-fixed samples by GeLC-MS/MS and spectral counting. J. Proteom. 2012, 77, 561–576. [Google Scholar] [CrossRef]
- Giusti, L.; Lucacchini, A. Proteomic studies of formalin-fixed paraffin-embedded tissues. Expert Rev. Proteom. 2013, 10, 165–177. [Google Scholar] [CrossRef]
- Azimzadeh, O.; Barjaktarovic, Z.; Aubele, M.; Calzada-Wack, J.; Sarioglu, H.; Atkinson, M.J.; Tapio, S. Formalin-fixed paraffin-embedded (FFPE) proteome analysis using gel-free and gel-based proteomics. J. Proteome Res. 2010, 9, 4710–4720. [Google Scholar] [CrossRef]
- Wisniewski, J.R.; Dus, K.; Mann, M. Proteomic workflow for analysis of archival formalin-fixed and paraffin-embedded clinical samples to a depth of 10000 proteins. Proteom. Clin. Appl. 2013, 7, 225–233. [Google Scholar] [CrossRef]
- Wisniewski, J.R.; Zougman, A.; Nagaraj, N.; Mann, M. Universal sample preparation method for proteome analysis. Nat. Methods 2009, 6, 359–362. [Google Scholar] [CrossRef]
- Metz, B.; Kersten, G.F.; Hoogerhout, P.; Brugghe, H.F.; Timmermans, H.A.; de Jong, A.; Meiring, H.; ten Hove, J.; Hennink, W.E.; Crommelin, D.J.; et al. Identification of formaldehyde-induced modifications in proteins: Reactions with model peptides. J. Biol. Chem. 2004, 279, 6235–6243. [Google Scholar] [CrossRef] [PubMed]
- Steiner, C.; Ducret, A.; Tille, J.C.; Thomas, M.; McKee, T.A.; Rubbia-Brandt, L.; Scherl, A.; Lescuyer, P.; Cutler, P. Applications of mass spectrometry for quantitative protein analysis in formalin-fixed paraffin-embedded tissues. Proteomics 2014, 14, 441–451. [Google Scholar] [CrossRef] [PubMed]
- Fowler, C.B.; Cunningham, R.E.; O’Leary, T.J.; Mason, J.T. ‘Tissue surrogates’ as a model for archival formalin-fixed paraffin-embedded tissues. Lab. Investig. 2007, 87, 836–846. [Google Scholar] [CrossRef] [PubMed]
- Nirmalan, N.J.; Harnden, P.; Selby, P.J.; Banks, R.E. Mining the archival formalin-fixed paraffin-embedded tissue proteome: Opportunities and challenges. Mol. Biosyst. 2008, 4, 712–720. [Google Scholar] [CrossRef] [PubMed]
- Jiang, X.; Jiang, X.; Feng, S.; Tian, R.; Ye, M.; Zou, H. Development of efficient protein extraction methods for shotgun proteome analysis of formalin-fixed tissues. J. Proteome Res. 2007, 6, 1038–1047. [Google Scholar] [CrossRef]
- Sprung, R.W., Jr.; Brock, J.W.; Tanksley, J.P.; Li, M.; Washington, M.K.; Slebos, R.J.; Liebler, D.C. Equivalence of protein inventories obtained from formalin-fixed paraffin-embedded and frozen tissue in multidimensional liquid chromatography-tandem mass spectrometry shotgun proteomic analysis. Mol. Cell. Proteom. 2009, 8, 1988–1998. [Google Scholar] [CrossRef]
- Azimzadeh, O.; Atkinson, M.J.; Tapio, S. Qualitative and quantitative proteomic analysis of formalin-fixed paraffin-embedded (FFPE) tissue. Methods Mol. Biol. 2015, 1295, 109–115. [Google Scholar]
- Foll, M.C.; Fahrner, M.; Oria, V.O.; Kuhs, M.; Biniossek, M.L.; Werner, M.; Bronsert, P.; Schilling, O. Reproducible proteomics sample preparation for single FFPE tissue slices using acid-labile surfactant and direct trypsinization. Clin. Proteom. 2018, 15, 11. [Google Scholar] [CrossRef]
- Quesada-Calvo, F.; Bertrand, V.; Longuespee, R.; Delga, A.; Mazzucchelli, G.; Smargiasso, N.; Baiwir, D.; Delvenne, P.; Malaise, M.; De Pauw-Gillet, M.C.; et al. Comparison of two FFPE preparation methods using label-free shotgun proteomics: Application to tissues of diverticulitis patients. J. Proteom. 2015, 112, 250–261. [Google Scholar] [CrossRef]
- Gaffney, E.F.; Riegman, P.H.; Grizzle, W.E.; Watson, P.H. Factors that drive the increasing use of FFPE tissue in basic and translational cancer research. Biotech. Histochem. 2018, 93, 373–386. [Google Scholar] [CrossRef] [PubMed]
- Kakimoto, Y.; Ito, S.; Abiru, H.; Kotani, H.; Ozeki, M.; Tamaki, K.; Tsuruyama, T. Sorbin and SH3 domain-containing protein 2 is released from infarcted heart in the very early phase: Proteomic analysis of cardiac tissues from patients. J. Am. Heart Assoc. 2013, 2, e000565. [Google Scholar] [CrossRef] [PubMed]
- Holub, D.; Flodrova, P.; Pika, T.; Flodr, P.; Hajduch, M.; Dzubak, P. Mass Spectrometry Amyloid Typing Is Reproducible across Multiple Organ Sites. BioMed Res. Int. 2019, 2019, 3689091. [Google Scholar] [CrossRef] [PubMed]
- Babicki, S.; Arndt, D.; Marcu, A.; Liang, Y.; Grant, J.R.; Maciejewski, A.; Wishart, D.S. Heatmapper: Web-enabled heat mapping for all. Nucleic Acids Res. 2016, 44, W147–W153. [Google Scholar] [CrossRef]
- Azimzadeh, O.; Scherthan, H.; Sarioglu, H.; Barjaktarovic, Z.; Conrad, M.; Vogt, A.; Calzada-Wack, J.; Neff, F.; Aubele, M.; Buske, C.; et al. Rapid proteomic remodeling of cardiac tissue caused by total body ionizing radiation. Proteomics 2011, 11, 3299–3311. [Google Scholar] [CrossRef]
- Barjaktarovic, Z.; Schmaltz, D.; Shyla, A.; Azimzadeh, O.; Schulz, S.; Haagen, J.; Dorr, W.; Sarioglu, H.; Schafer, A.; Atkinson, M.J.; et al. Radiation-induced signaling results in mitochondrial impairment in mouse heart at 4 weeks after exposure to X-rays. PLoS ONE 2011, 6, e27811. [Google Scholar] [CrossRef]
- Azimzadeh, O.; Sievert, W.; Sarioglu, H.; Yentrapalli, R.; Barjaktarovic, Z.; Sriharshan, A.; Ueffing, M.; Janik, D.; Aichler, M.; Atkinson, M.J.; et al. PPAR Alpha: A Novel Radiation Target in Locally Exposed Mus musculus Heart Revealed by Quantitative Proteomics. J. Proteome Res. 2013, 12, 2700–2714. [Google Scholar] [CrossRef]
- Barjaktarovic, Z.; Shyla, A.; Azimzadeh, O.; Schulz, S.; Haagen, J.; Dorr, W.; Sarioglu, H.; Atkinson, M.J.; Zischka, H.; Tapio, S. Ionising radiation induces persistent alterations in the cardiac mitochondrial function of C57BL/6 mice 40 weeks after local heart exposure. Radiother. Oncol. 2013, 106, 404–410. [Google Scholar] [CrossRef]
- Heather, L.C.; Carr, C.A.; Stuckey, D.J.; Pope, S.; Morten, K.J.; Carter, E.E.; Edwards, L.M.; Clarke, K. Critical role of complex III in the early metabolic changes following myocardial infarction. Cardiovasc. Res. 2010, 85, 127–136. [Google Scholar] [CrossRef]
- Barjaktarovic, Z.; Merl-Pham, J.; Braga-Tanaka, I.; Tanaka, S.; Hauck, S.M.; Saran, A.; Mancuso, M.; Atkinson, M.J.; Tapio, S.; Azimzadeh, O. Hyperacetylation of Cardiac Mitochondrial Proteins Is Associated with Metabolic Impairment and Sirtuin Downregulation after Chronic Total Body Irradiation of ApoE (−/−) Mice. Int. J. Mol. Sci. 2019, 20, 5239. [Google Scholar] [CrossRef]
- Subramanian, V.; Borchard, S.; Azimzadeh, O.; Sievert, W.; Merl-Pham, J.; Mancuso, M.; Pasquali, E.; Multhoff, G.; Popper, B.; Zischka, H.; et al. PPARalpha Is Necessary for Radiation-Induced Activation of Noncanonical TGFbeta Signaling in the Heart. J. Proteome Res. 2018, 17, 1677–1689. [Google Scholar] [CrossRef] [PubMed]
- Subramanian, V.; Seemann, I.; Merl-Pham, J.; Hauck, S.M.; Stewart, F.A.; Atkinson, M.J.; Tapio, S.; Azimzadeh, O. The Role of TGF Beta and PPAR Alpha Signalling Pathways in Radiation Response of Locally Exposed Heart: Integrated Global Transcriptomics and Proteomics Analysis. J. Proteome Res. 2016, 16, 307–318. [Google Scholar]
- Tapio, S. Pathology and biology of radiation-induced cardiac disease. J. Radiat. Res. 2016, 57, 439–448. [Google Scholar] [CrossRef] [PubMed]
- Menezes, K.M.; Wang, H.; Hada, M.; Saganti, P.B. Radiation Matters of the Heart: A Mini Review. Front. Cardiovasc. Med. 2018, 5, 83. [Google Scholar] [CrossRef] [PubMed]
- Rybkina, V.L.; Azizova, T.V.; Scherthan, H.; Meineke, V.; Doerr, H.; Adamova, G.V.; Teplyakova, O.V.; Osovets, S.V.; Bannikova, M.V.; Zurochka, A.V. Expression of blood serum proteins and lymphocyte differentiation clusters after chronic occupational exposure to ionizing radiation. Radiat. Environ. Biophys. 2014, 53, 659–670. [Google Scholar] [CrossRef] [PubMed]
- Sandbo, N.; Dulin, N. Actin cytoskeleton in myofibroblast differentiation: Ultrastructure defining form and driving function. Transl. Res. 2011, 158, 181–196. [Google Scholar] [CrossRef]
- Machackova, J.; Barta, J.; Dhalla, N.S. Myofibrillar remodeling in cardiac hypertrophy, heart failure and cardiomyopathies. Can. J. Cardiol. 2006, 22, 953–968. [Google Scholar] [CrossRef]
- Rao, V.S.; La Bonte, L.R.; Xu, Y.; Yang, Z.; French, B.A.; Guilford, W.H. Alterations to myofibrillar protein function in nonischemic regions of the heart early after myocardial infarction. Am. J. Physiol. Heart Circ. Physiol. 2007, 293, H654–H659. [Google Scholar] [CrossRef]
- Azimzadeh, O.; Tapio, S. Proteomics landscape of radiation-induced cardiovascular disease: Somewhere over the paradigm. Expert Rev. Proteom. 2017, 14, 987–996. [Google Scholar] [CrossRef]
- Kramer, A.; Green, J.; Pollard, J., Jr.; Tugendreich, S. Causal analysis approaches in Ingenuity Pathway Analysis. Bioinformatics 2014, 30, 523–530. [Google Scholar] [CrossRef]
© 2020 by the authors. Licensee MDPI, Basel, Switzerland. This article is an open access article distributed under the terms and conditions of the Creative Commons Attribution (CC BY) license (http://creativecommons.org/licenses/by/4.0/).