Article

Mouse Ataxin-2 Expansion Downregulates CamKII and Other Calcium Signaling Factors, Impairing Granule—Purkinje Neuron Synaptic Strength

1
Experimental Neurology, Medical Faculty, Goethe University, Theodor Stern Kai 7, 60590 Frankfurt am Main, Germany
2
Department of Psychiatry, Psychosomatic Medicine and Psychotherapy, Medical Faculty, Goethe University, Heinrich-Hoffmann-Str. 10, 60528 Frankfurt am Main, Germany
3
Faculty of Biosciences, Goethe-University, Max von Laue Strasse 9, 60438 Frankfurt am Main, Germany
4
Dr. Senckenberg Institute of Pathology, Goethe University Frankfurt, Theodor Stern Kai 7, 60590 Frankfurt am Main, Germany
5
Institute of Anatomy, Anatomy and Cell Biology, University of Bonn, Nussallee 10, 53115 Bonn, Germany
*
Authors to whom correspondence should be addressed.
Int. J. Mol. Sci. 2020, 21(18), 6673; https://doi.org/10.3390/ijms21186673
Submission received: 20 August 2020 / Revised: 7 September 2020 / Accepted: 10 September 2020 / Published: 12 September 2020
(This article belongs to the Section Molecular Pathology, Diagnostics, and Therapeutics)

Abstract

:
Spinocerebellar ataxia type 2 (SCA2) is caused by polyglutamine expansion in Ataxin-2 (ATXN2). This factor binds RNA/proteins to modify metabolism after stress, and to control calcium (Ca2+) homeostasis after stimuli. Cerebellar ataxias and corticospinal motor neuron degeneration are determined by gain/loss in ATXN2 function, so we aimed to identify key molecules in this atrophic process, as potential disease progression markers. Our Atxn2-CAG100-Knock-In mouse faithfully models features observed in patients at pre-onset, early and terminal stages. Here, its cerebellar global RNA profiling revealed downregulation of signaling cascades to precede motor deficits. Validation work at mRNA/protein level defined alterations that were independent of constant physiological ATXN2 functions, but specific for RNA/aggregation toxicity, and progressive across the short lifespan. The earliest changes were detected at three months among Ca2+ channels/transporters (Itpr1, Ryr3, Atp2a2, Atp2a3, Trpc3), IP3 metabolism (Plcg1, Inpp5a, Itpka), and Ca2+-Calmodulin dependent kinases (Camk2a, Camk4). CaMKIV–Sam68 control over alternative splicing of Nrxn1, an adhesion component of glutamatergic synapses between granule and Purkinje neurons, was found to be affected. Systematic screening of pre/post-synapse components, with dendrite morphology assessment, suggested early impairment of CamKIIα abundance together with the weakening of parallel fiber connectivity. These data reveal molecular changes due to ATXN2 pathology, primarily impacting excitability and communication.

1. Introduction

Spinocerebellar ataxia type 2 (SCA2) is an autosomal-dominantly inherited neurodegenerative disorder, caused by repeat expansion mutations in the ataxin-2 (ATXN2) poly-glutamine domain (polyQ, encoded by CAG repeats at the DNA level) [1,2,3]. Healthy individuals most commonly have 22 repeats, while the expansion of this domain beyond 33 repeats leads to the manifestation of SCA2. At presymptomatic and initial disease stages, muscle cramps (usually due to the dysregulation of cellular calcium homeostasis, treated with magnesium), hyporeflexia, progressive cerebellar ataxia, dysarthria and oculomotor deficits appear, in particular in abnormally slow saccades [4,5,6,7]. SCA2 usually manifests in the fourth decade of life, although the age of disease onset depends on the repeat size, genetic background and environmental factors. Longer expansion sizes lead to earlier manifestation and faster progression of the disease [8]. Intermediate size expansions between 27–33 repeats, often with the preservation of one CAA interruption within the otherwise pure CAG repeat, were reported to increase the risk of developing other neurodegenerative disorders, such as amyotrophic lateral sclerosis (ALS), Parkinson’s disease (PD) and Parkinsonism-plus syndromes [9,10,11,12].
ATXN2 mutations affect many central nervous system regions, with pronounced atrophy of the spinal cord and cerebellum [13,14,15,16,17,18,19,20]. The basis of disease progression is the cumulative aggregation of mutant ATXN2 protein in the cytosol, with sequestration of its interaction partners into insolubility [21,22]. This phenomenon was documented to start very early in affected regions preceding the first appearance of disease signs [23]. The motor neurons degenerate at particularly early stages, with cortico-spinal projections progressively failing to excite the peripheral motor neurons via the neurotransmitter glutamate. This can be detected by electrophysiological analysis years before SCA2 patients will notice their first deficits of balance [24]. Within the cerebellum, the large Purkinje neurons are most conspicuous in their degeneration, and are the main site of pathology in various other ataxia disorders, as well. They receive excitatory glutamatergic input from cerebellar granule neurons via billions of parallel fibers with weak synaptic strength into the periphery of their dendrites, which can be potentiated or counterweighed by the glutamatergic input from brainstem inferior olivary neurons via climbing fibers, exerting strong synaptic input onto each Purkinje soma and their proximal dendrites. Throughout the postsynaptic spines, dendritic branches and cell body until the axon hillock, Purkinje neurons depend on Ca2+ fluxes to integrate stimuli and to trigger neural conductance, so these cells are characterized by their high abundance of various Ca2+ binding proteins [25]. The glutamatergic synapse between granule and Purkinje neurons was shown to play a central role in the pathogenesis of many spinocerebellar ataxia subtypes [26,27,28]. Accompanying the progressive morphological alterations of Purkinje neurons, granule cells are also affected in SCA2 cerebella upon detailed post-mortem histological analyses [29,30].
The ATXN2 protein has a large size of around 150 kDa in mouse, but is evolutionarily conserved in all eukaryotes, including yeast and plants. The N-terminal Like-Sm (Lsm) and Lsm-associated (Lsm-AD) domains maintain direct mRNA and miRNA binding, whereas the C-terminal PABP-associated motif (PAM2) associates ATXN2 indirectly to mRNA, by mediating its interaction with poly(A)-binding protein (PABP). Interspersed proline-rich domains (PRDs) modulate association with the endocytosis machinery [31], and the N-terminal polyQ domain has no specific function identified so far, other than being involved in neurological disease and facilitating interactions with other polyQ-containing proteins in disease [32]. Mainly localized in the cytoplasm, ATXN2 regulates cytosolic RNA processing and ribosomal translation, especially on the rough endoplasmic reticulum (rER) for proteins in the secretion pathway (which are subject to quality control and elimination via ER-associated degradation), while modulating growth signaling via receptor tyrosine kinase internalization at the plasma membrane [31,33,34,35]. Under various stress stimuli, ATXN2 localizes to ribonucleoprotein complexes known as stress granules (SGs), where it interacts with other RNA-binding proteins (RBPs) and several eukaryotic translation initiation factors (eIFs) to regulate mRNA stability and protein synthesis dynamics for survival [36,37,38,39]. Notably, altered SG dissociation dynamics due to intermediate-length ATXN2 expansions underlie its pathogenic involvement in ALS. Important ALS-associated proteins, such as TDP-43, FUS and TIA-1, all of which are normally nuclear RBPs involved in RNA splicing, surveillance and triage, are sequestrated in the cytosolic SGs, where they are differentially modified and depleted from their native site of action [9,40,41,42,43]. Being a stress response protein itself, both transcript and protein levels of ATXN2 are induced by stressors, especially in cell types that are more susceptible to extracellular metabolic cues, such as neurons, glia, blood platelets, hepatocytes and pancreatic islet cells [44,45,46,47,48]. Increased amounts and activation of ATXN2 under stress by phosphorylation cascades were shown to suppress mTORC1 activity, due to sequestration of its components into SGs for energetic sustainability [34,49,50]. Global transcriptome and metabolome profiling of spinal cord tissue from two SCA2 mouse models highlighted a pronounced effect of ATXN2 and its sequence homolog ATXN2L on cholesterol and membrane lipid homeostasis [46,51,52,53]. Indeed, the loss of ATXN2 function in mouse leads to a metabolic excess syndrome manifested as diabetes mellitus with insulin resistance, lipid droplet accumulation in the liver, and hypercholesterolemia [48], whereas the loss of ATXN2L leads to mid-gestation embryonic lethality [53]. Mitochondrial protein import, tricarboxylic acid cycle and nutrient catabolism pathways are severely affected by ATXN2 loss across species [36,47,54]. Quite interestingly, depletion of ATXN2 expression by antisense oligonucleotides (ASOs) has shown massive benefit as a therapeutic intervention for ALS in mice and SCA2 patients [55,56].
As a recently generated and characterized model of ATXN2 pathology, the Atxn2-CAG100-KIN (KIN) mouse faithfully mirrors the spatio-temporal pattern of SCA2 neurodegeneration. It has been thoroughly examined regarding molecular features of mutant ATXN2, progression of pathology at the molecular and behavioral levels, and manifestation of disease signs. Initial immunohistochemistry analyses and in vivo nuclear magnetic resonance measurements revealed an overall atrophy of the brain and widespread aggregation of the mutant ATXN2 protein, rather than pure Purkinje cell pathology, as in transgenic models [23]. Thus, this new model has proven itself useful in dissecting not only Purkinje-specific aspects of disease, but also the contribution from other neuron populations and glia cell types, whose collective impact is being much better appreciated today in neurological disorders. In Atxn2-CAG100-KIN mice with homozygous expansion, behavioral signs of motor dysfunction appear at the age of six months (six mo), and deteriorate progressively, until the animals have to be sacrificed at the age of 14 mo when weight declines rapidly [23]. We showed previously that the CAG-repeat expansion within the DNA and mRNA of Atxn2 leads to a chronic reduction of transcript and protein steady-state levels for Ataxin-2 already in embryonic cells, thus triggering an initial partial loss-of-function phenotype [23]. Through this mechanism, female homozygous KIN animals show an increased weight phenotype at the age of three mo, resembling Atxn2-KO animals [23]. However, the polyQ expansion within the protein triggers progressive accumulation of ATXN2 within cytosolic aggregates, leading to neurotoxicity via gain-of-function and corresponding phenotypes with time. At the molecular level, neuronal inclusion bodies and progressive expression dysregulations become detectable already at three mo, earlier than the first appearance of disease signs [23]. Given that any future neuroprotective therapy will be administered at this early disease stage, we sought to understand which molecular changes reflect this congenital partial loss-of-function of ATXN2 versus the progressive gain-of-toxic-function due to the cumulative aggregation process. For an initial unbiased survey of expression dysregulations, high-throughput transcriptome screening by microarrays was performed to compare Atxn2-CAG100-KIN cerebella with age- and sex-matched wild-type (WT) samples at three mo.
Using cerebellar homogenates from this genuine SCA2 animal model, we can be confident that the extracted mRNA has extremely little contribution from the brainstem-originating climbing fibers, so any glutamatergic dysregulations will reflect pathology in the parallel fiber synapses onto Purkinje spines. Altogether, our novel data suggest a simultaneous degeneration model for the SCA2 cerebellum, where granule layer affection starts in parallel to that of Purkinje layer at the pre-onset phase. The signaling cascades and synaptic components we investigated here represent excellent therapeutic targets, as there are readily available drugs targeting them, mostly in use for other neuronal maladies.

2. Results

2.1. Transcriptome Profile of Atxn2-CAG100-KIN Mouse Cerebellum before Disease Onset

More than 60,000 oligonucleotide spots were quantified, identifying 20,299 coding mRNAs, 1729 miRNA precursors, 130 miRNAs, 107 small RNAs (plus 2621 non-identified), 16 mitochondrial tRNAs, 388 ascertained or predicted ribosomal RNAs, 2758 pseudogenes, 24 unassigned and 31,717 non-coding transcripts (Supplementary Table S1). There was no preferential impact of ATXN2 expansion on one of these RNA classes. Our main focus in this study was on more than 20,000 coding mRNAs to elucidate disease pathology. Considering that the dataset comes from an age before the onset of motor deficits, and that the relevant dysregulations will not be massive at this stage, we empirically set a low 35% expression dysregulation threshold for data filtering, as already successfully done for Parkinson’s disease [57], instead of the commonly used 50% threshold. Among all quantified mRNA oligonucleotides, 2162 showed a significant expression change, revealing 209 significantly downregulated (< 65%) and 94 significantly upregulated (> 135%) transcripts (Figure 1A,B). The upregulated transcript group was dominated by the alteration of some of the hundreds of olfactory and vomeronasal receptors, whose number reflects the importance of smell for rodents, but are irrelevant for SCA2 patients. Among the significantly downregulated transcripts, insulin signaling mediator Igfbp5, cell migration and adhesion factor Sema7a, protein methyltransferases (Prmt8, Icmt), G-protein coupled receptor signaling mediator Rgs8, neurotransmitter receptors (Gria3, Grm4), and many Ca2+ signaling associated factors (Plcb3, Inpp5a, Itpka, Itpr1, Atp2a3, Cabp7, Car8, Prkcd, Camk2a, Rora) were prominent. Hence, we focused on the downregulations of the latter big group, and further examined the data with STRING database (https://string-db.org/) to generate a protein interaction network and assess the significant pathway enrichments. Interaction analysis (Figure 1C) revealed a tightly interconnected network with two rather central nodes at Camk2a and Itpr1. Many other Ca2+ signaling associated factors, Ca2+ transport machinery, ion channels and neurotransmitter receptors completed the network. Functional enrichment analysis by STRING in Biological Process, KEGG Pathways, Reactome Pathways, UniProt Keywords and Molecular Function databases revealed numerous significantly dysregulated subcellular processes mostly associated with Ca2+ mediated intracellular cascades, synaptic transmission and alternative splicing (Figure 1D).
In summary, the global transcriptome profile of Atxn2-CAG100-KIN cerebellum at pre-onset stage revealed a collective downregulation of various Ca2+-associated factors involved in its transport or downstream intracellular signaling cascades. These findings are in line with the well-established involvement of Ca2+ in various cerebellar maladies through altered neuronal excitability [58].

2.2. Ataxin-2 Pathology Alters the Expression of Ca2+ Channels and Transporters

We aimed to validate the high-throughput transcriptome data, focusing on Ca2+-associated transcripts and their role in ATXN2 expansion-driven disease and in complete ATXN2 loss. This work also extends previous findings that report similar dysregulations of Ca2+-associated transcripts in other mouse mutants [59,60]. Targeted expression analyses of the most relevant candidates were performed by reverse-transcriptase quantitative polymerase chain reaction (RT-qPCR). Protein abundance was assessed for promising factors, where specific and sensitive commercial antibodies were available. The levels of various Ca2+ channels and transporters were quantified in Atxn2-CAG100-KIN cerebella at different stages of disease progression (3 and 14 mo) and were also tested in Atxn2-KO cerebella, in order to distinguish partial loss-of-function effects from progressive aggregation pathology.
Depending on their expression profile at pre-onset and late disease stages, we categorized the transcript changes as “early” (present at 3 mo and persisting at 14 mo), and “late/secondary” changes (occurring at 14 mo). Early changes occurred for ER-membrane channels Itpr1 (encoding the protein IP3R) and Ryr3 (RYR), transporters Atp2a2 (SERCA2) and Atp2a3 (SERCA3), and plasma membrane channel Trpc3 (TRPC3). In contrast, ER-membrane factors Ryr1 (RYR), Stim1 (STIM1), Atp2a1 (SERCA1), plasma membrane carrier Slc8a2 (NCX) and transporter Atp2b2 (PMCA) showed rather late dysregulations in disease process (Figure 2A). Among the early and late changes, Ryr1, Atp2a1, Atp2a3 and Trpc3 also showed similar dysregulations in Atxn2-KO cerebellum, suggesting a physiological regulation of these transcripts by ATXN2 protein. Plasma membrane channels Orai1 (ORAI1) and Cacna1a (CaV2.1) were found unaltered throughout the disease course or in Atxn2-KO cerebellum (Figure 2A). Two factors of special interest, ITPR1/IP3R and ATP2A2/SERCA2, were further analyzed at the protein level in cytosolic (extracted by RIPA buffer) and insoluble/membrane-associated (pellet subsequently treated with 2x SDS buffer) fractions of Atxn2-CAG100-KIN mouse cerebellum (Figure 2B). At the pre-onset stage, both proteins were unaltered in the cytosolic soluble protein fraction, and showed subtle reductions with disease progression at 14 mo. In the more insoluble protein fraction, ITPR1 showed a strong decrease at 3 mo, persisting throughout disease progression until the terminal stage of 14 mo (Figure 2B, individual fold changes and p-values are available in Supplementary Table S3). Interestingly, ITPR1 was previously reported to interact exclusively with expanded ATXN2, and to have increased abundance in the insoluble protein fraction of aged Atxn2-CAG42-KIN cerebellum [59]. Similar to ITPR1, ATP2A2 also showed decreased abundance in the insoluble protein fraction at both 3 mo and 14 mo of age (Figure 2B, Supplementary Table S3).
Overall, the expression data highlight Itpr1, Atp2a2 and Atp2a3 as the early-onset downregulations, which worsen over time in parallel to the expansion-driven aggregation process and are absent in Atxn2-KO cerebellum.

2.3. Subcellular Ca2+ Imbalance Promotes Ataxin-2 Relocalization into Stress Granules

Potent dysregulations observed in various ER and plasma membrane associated Ca2+ factors at early disease stage could lead to the mislocalization of Ca2+ ions among the subcellular organelles. It is known that Ca2+ ions are deliberately kept at very high concentrations in the ER for proper chaperone function in the ER lumen and for structural integrity of the cytosolic proteins, which tend to expose their internal hydrophobic residues at high Ca2+ concentration and start forming aggregates [61]. Thus, it is intriguing to investigate whether an aggregation-prone protein such as ATXN2 is affected by high cytosolic Ca2+ concentration and changes its subcellular distribution or expression. In order to test this notion, we treated WT and Atxn2-KO primary mouse embryonal fibroblasts (MEFs) with thapsigargin (TG), an ER-stress inducer known to increase Ca2+ concentration in the cytosol by blocking the ATP2A2 (SERCA2) transporter [61]. As hypothesized, TG-mediated high cytosolic Ca2+ concentration triggered ATXN2 protein to redistribute into PABP-positive SGs (Figure 3A). The complete loss of ATXN2 did not alter SG dynamics under TG treatment, in agreement with the previous findings under sodium arsenite-driven oxidative stress [34]. In order to ensure that SG formation and ATXN2 relocalization are induced by increased cytosolic Ca2+ levels per se, and not due to ER-stress response in general, we performed tunicamycin (TM) treatment in parallel, which induces ER-stress via the blockage of N-linked protein glycosylation and accumulation of the un- or misfolded proteins in the ER lumen [61]. This arm of ER-stress induction did not lead to SG formation or any relocalization of ATXN2 (Figure 3A). In conclusion, the subcellular localization of ATXN2 was found to be specifically modulated by cytosolic Ca2+ levels, but not by ER stress in general.
As a stress-response factor, ATXN2 is often regulated transcriptionally under stress conditions, mostly towards upregulation [34,36]. Therefore, we analyzed the regulation of Atxn2 expression under increased cytosolic Ca2+ concentration in a time- and dose-dependent manner. While no change was observed in Atxn2 levels after 1 h of TG treatment, prolonged Ca2+ imbalance over 6 h led to a decrease in Atxn2 abundance, independent of the drug dosage (Figure 3B), which is compatible with the notion of delayed protein turnover due to the aggregation of ATXN2 leading to diminished transcriptional resynthesis. The expression of ER stress markers was also quantified under TG treatment to validate successful stress induction and to observe the potential effects of ATXN2 loss in ER-stress response. ER lumen chaperone Bip and further downstream apoptosis promoting factor Chop were readily upregulated upon 1 h of TG treatment, with further inductions at 6 h (Figure 3B). Splicing of Xbp1 transcript by ER membrane-associated RNase IRE1 is another hallmark of ER stress. Quantification of the unspliced isoform (Xbp1u) revealed a time-dependent decrease, while the spliced isoform (Xbp1s) showed a time-dependent increase in abundance under TG treatment (Figure 3B). Interestingly, lower dosage of TG at 6 h seemed to induce more of a stress response than the higher dosage suggested by Bip, Chop and Xbp1s levels in WT cells. Quantification of the same transcripts in Atxn2-KO MEFs revealed no initial dysregulation in untreated cells due to ATXN2 loss, although a subtle increase was observed in Xbp1u levels without significance. At 6 h under lower dosage of TG, Bip, Chop and Xbp1s levels showed a significant induction deficit in Atxn2-KO cells, suggesting that ATXN2 is necessary for a maximal ER stress response when Ca2+ homeostasis is abnormal.
Recent work on ATXN2 revealed its role in mitochondrial dynamics and proteostasis during stress through the modulation of PINK1 and OPA1 levels [45], regulation of mitochondrial protein import [54], and affecting metabolic enzymes involved in TCA cycle, amino acid and fatty acid catalysis [36,47]. In addition, ATXN2 was found to localize at the rER, and regulate two important ER-associated aspects: protein translation and Ca2+ homeostasis [37,59]. Therefore, we asked whether the contact sites between mitochondria and ER, namely mitochondria-associated membrane (MAM) complex, could be affected from ATXN2 expansion, and somehow initiate the pathology targeting two organelles at once. Expression analyses of important MAM complex components Mcu, Micu1, Micu2, Micu3, Smdt1, Vdac1, Grp75, Mfn1, Mfn2 and Sigmar1 in Atxn2-CAG100-KIN cerebellum revealed no major alteration of this complex, even at the terminal disease phase (Supplementary Figure S1A). Yet, subtle downregulations were observed for many components, which could downgrade the collective activity of the complex. The previously mentioned Ca2+ channel ITPR1 (Figure 2A,B) also belongs to the MAM complex. Thus, the biggest dysregulation among all MAM complex members at the terminal phase was found to occur for Itpr1 with an early onset expansion-associated downregulation, while the subtle changes of the other members could represent a secondary coping mechanism.
Taking these findings into account, we questioned the extent of ER stress and associated transcript inductions in Atxn2-CAG100-KIN mouse cerebellum at terminal stage. Expression analyses of ER-resident primary unfolded protein response (UPR) mediators Perk, Ire1 and Atf6 interestingly revealed no transcriptional induction, but decreased abundance (Supplementary Figure S1B). Their luminal regulator Bip, and direct downstream effectors Xbp1u and Xbp1s were found unaltered. The further downstream effector Chop was found subtly upregulated, together with its transcriptional activator Atf4, which could have arisen from a plethora of stress inputs of different origins (Supplementary Figure S1B). This set of data indicates that, although ATXN2 might acutely modulate ER stress response and the induction of apoptosis, chronic UPR activation is not a prominent aspect of disease pathology in the brain, showing only mild alterations at the terminal stage when numerous stress stimuli converge and cross-activate each other.
Finally, after establishing the effect of cytosolic Ca2+ concentration on ATXN2 distribution, and the lack of significant ER stress induction at terminal stage, we aimed to see if there is overall subcellular Ca2+ mislocalization in the intact cerebellum at pre-onset stage. Fresh cerebella were fractionated into cytosolic and membrane-encapsulated organelle rich fragments, and Ca2+ concentrations of these lysates were measured with a commercially available colorimetric kit. As expected, organelle rich fraction showed a significantly higher Ca2+ content in comparison to cytosol in both WT and Atxn2-CAG100-KIN samples (Figure 3C). However, no change was observed by this steady-state assay in Ca2+ levels or subcellular distribution in KIN samples compared to WT animals, indicating that chronic Ca2+ mislocalization is not an initial cause of the disease, and that the early onset alterations of several ER, and plasma membrane channels and transporters are able to maintain the balance at this stage.

2.4. Pre-Onset Dysregulation of the Ca2+/Calmodulin-Dependent Protein Kinase Pathway

Aside from the role of Ca2+ in the maintenance of ER dynamics and proteostasis, it is also an important secondary messenger in signaling cascades, especially for excitable cells, such as neurons and myocytes. While low cytosolic concentrations normally prevail, bursts of Ca2+ increase, for instance, due to synaptic impulse, and are recognized as specific input, and activate the Ca2+/Calmodulin-dependent protein kinase (CaMK) pathway. CaMKs are involved in a broad spectrum of cellular processes, such as regulation of phosphorylation cascades, gene expression, mRNA splicing, metabolism and cell survival/death [62].
We observed several members of the CaMK family and associated pathway components among the significantly dysregulated transcripts in the global transcriptome data, such as Camk2a, Camkk2, Gria3, Grm4, Plcb3, Inpp5a and Pcp4 (Supplementary Table S1). Targeted expression analyses of these transcripts together with other pathway components were performed in 3 mo and 14 mo Atxn2-CAG100-KIN cerebellum in parallel to Atxn2-KO samples.
Upon extracellular activation of receptor tyrosine kinases (RTKs) or ionotropic glutamate receptors (e.g., GluAs) or metabotropic glutamate receptors (mGluRs), the phospholipase C (PLC) isoforms are activated at the intracellular plasma membrane leaflet and catalyze the cleavage of PIP2 (phosphatidylinositol-4,5-bisphosphate) into IP3 (inositol 1,4,5-trisphosphate), as well as DAG (diacylglycerol) [63,64]. IP3 may directly bind and activate IP3R leading to Ca2+ flux from ER to cytosol; alternatively, it can be phosphorylated by ITPKA or de-phosphorylated by INPP5A for recycling [65]. On the other hand, DAG signals either directly to plasma membrane Ca2+ channel TRPC3 or indirectly via activating protein kinase C (PKC) [63]. The ionotropic AMPA receptor subunit Gria3 (encoding GluA3) showed an early and strongly progressive downregulation, and the two mGluR isoforms Grm1 (mGluR1) and Grm4 (mGluR4) showed a subtle yet significant downregulation in Atxn2-CAG100-KIN cerebella already at three mo of age (Figure 4A). In view of the relevance of Gria3 dysregulation as an early risk marker and later progression marker, these changes were assessed at the protein level. At the pre-onset stage of three mo, GluA3 abundance showed a significant decrease to 74% in the soluble but not the insoluble/membrane-bound protein fraction. At the terminal stage of 14 mo, GluA3 abundance was similarly decreased in the soluble fraction (to 72%), but now also in the membrane-bound fraction to 53% (Figure 4B).
As important downstream membrane-associated signaling factors, the PLC isoforms β3 and β4 (Plcb3 and Plcb4) also showed a subtle downregulation, which became more prominent later in disease pathology. The presence of a similar dysregulation of both transcripts in Atxn2-KO cerebellum indicates their potential modulation by native ATXN2 function (Figure 4A). PLC isoform γ1 (Plcg1) showed a significant downregulation at three mo of age, and interestingly, no alteration afterwards or in Atxn2-KO samples, which represents a very specific early-pathology marker. Inpp5a and Itpka expression were found significantly downregulated at pre-onset phase, progressively decreasing with disease pathology at 14 mo, and diminished in Atxn2-KO cerebella, representing ATXN2 native function-dependent progression markers. Downstream of DAG, however, PKC subunit δ (Prkcd) showed an expansion pathology-specific downregulation in Atxn2-CAG100-KIN cerebella, starting from pre-onset stage (Figure 4A). This arm of the signaling pathway revealed that the polyQ expansion influence starts from the plasma membrane with reduced glutamate receptor transcript levels, extends to altered conversion of membrane lipids to DAG and IP3, and reaches IP3 recycling that is probably diminished.
During further signal transduction in the cytoplasm, CaMK is activated upon Calmodulin (CaM) association with four Ca2+ ions. PCP4 (or PEP-19) was shown to be a regulator of Ca2+/CaM association and dissociation dynamics [66]. Activated CaM further initiates a phosphorylation cascade involving CaMK-kinases (CaMKKs), CaMKs and downstream targets. In Atxn2-CAG100-KIN cerebellum, Pcp4 showed a prominent downregulation, starting early and progressing with the disease. Lack of its dysregulation in Atxn2-KO cerebellum indicates an expansion-driven alteration of Pcp4 expression (Figure 4A). Both CaMKKs, Camkk1 and Camkk2, showed an ATXN2-dependent downregulation to 80% in Atxn2-KO cerebellum, and a decrease to 60% at the late phase of the disease. In addition, Camkk2 showed a significant downregulation at the pre-onset phase, showing an earlier alteration than Camkk1 (Figure 4A). Due to their thoroughly investigated roles in dendritic spine morphology and synaptic integrity maintenance, we further examined the dysregulations in CaMKII isoforms and CaMKIV expression. Both Camk2a and Camk2b isoforms showed a progressive decrease in expression parallel to the disease pathology, with Camk2a also showing a mild downregulation in Atxn2-KO cerebellum. Camk2g showed downregulation later in disease and Atxn2-KO cerebellum, whereas no significant change was observed in Camk2d levels at any age or in Atxn2-KO (Figure 4A). Similar to the expression profile of Camk2a, Camk4 also showed prominent downregulation at the pre-onset phase, maintained throughout the disease until the terminal phase, and also mildly downregulated in Atxn2-KO cerebellum (Figure 4A). Both transcripts represent potent markers of early pathology and disease progression, and were therefore also validated at the protein level. At the pre-onset stage of 3 mo, CaMKIIα showed no dysregulation in the soluble protein fraction, but showed a significant downregulation to 57% in the insoluble/membrane-bound protein fraction. At the terminal stage of 14 mo, CaMKIIα abundance had progressively decreased in both fractions (Figure 4B). Similarly, CaMKIV abundance was unaltered at the pre-onset phase in soluble fraction, with a significant decrease to 77% in the insoluble fraction. At 14 mo, CaMKIV protein was also found significantly downregulated in both fractions, a decrease in parallel to CaMKIIα and disease progression (Figure 4B).
Overall, these data suggest that ATXN2 loss modulates intracellular Ca2+ signaling component levels, especially that of PLCβ and IP3 recycling enzymes, but does not alter glutamate receptor levels (as indicated by mRNA changes in Atxn2-KO cerebellum). The ATXN2 expansion at 14 mo triggers a stronger dysregulation in the same direction, when compared to the Atxn2-KO, for these Ca2+ signaling components (namely Plcb3, Plcb4, Inpp4a, Itpka, Camkk1, Camk2a, Camk4), and in addition, it affects the ionotropic and metabotropic glutamate receptors.

2.5. Impact of Ataxin-2 Pathology on the CamKIV-Modulated RNA Splicing Factor Khdrbs1/Sam68

Initiation of Ca2+/CaM-dependent signaling cascade in cerebellar granule neurons upon frequent stimulation activates CaMKIV and leads to the phosphorylation of its substrates, one of which is the K-homology domain, containing RNA-binding protein Sam68 (gene symbol Khdrbs1). Phosphorylated Sam68 detaches from its target mRNAs, thus differentially regulating their alternative splicing [67]. Thus, any loss of CaMKIV-dependent phosphorylation might influence the nuclear distribution of Sam68, and its association with ribonucleoprotein (RNP) granules, known for their poor solubility in phase separation. One of the Sam68 target transcripts is Nrxn1 pre-mRNA, encoding different isoforms of the pre-synaptic Neurexin-1 protein involved in structural synapse maintenance [68]. Quantitative assessment of Sam68 (Khdrbs1) expression revealed an expansion-specific downregulation at late disease stage in Atxn2-CAG100-KIN cerebellum, without an alteration at the pre-onset stage or in Atxn2-KO (Figure 4A). Likewise, the two closely related family members of Sam68, namely Slm1 and Slm2 (encoded by Khdrbs2 and Khdrbs3, respectively), also showed no dysregulation in Atxn2-KO cerebella. Only Slm2 (Khdrbs3) showed an expansion-driven downregulation at the terminal disease stage, while Slm1 (Khdrbs2) showed no dysregulation at the transcript level throughout the disease course (Figure 4A).
At the protein level, Sam68 abundance in the soluble fraction showed no alteration at the early or late disease stages. However, in the SDS fraction that is enriched for insoluble cytosolic aggregates or membrane encapsulated organelles including nuclei, Sam68 abundance was found to be subtly decreased at the age of three mo, but significantly increased up to 150% at the terminal stage of 14 mo (Figure 4B). This observation is consistent with the normally nuclear localization of Sam68, its potential redistribution into RNP granules and potential interaction with ATXN2. We therefore questioned whether Sam68 could be trapped in cytosolic ATXN2 aggregates like many other nuclear RNA processing proteins such as TDP-43, FUS, TIA-1 [52,69], which would explain its increased abundance at the terminal stage. Immunohistochemical staining of Sam68 and ATXN2 confirmed the nuclear localization of Sam68 in Purkinje and granule neurons of the WT cerebellum at 14 mo of age, while ATXN2 showed a diffuse cytosolic localization (Supplementary Figure S2). In the Purkinje neurons of Atxn2-CAG100-KIN cerebellum, ATXN2 was found clumped into a single large aggregate localized at the entrance of the dendritic arbor, in agreement with a previous report [23]. Sam68 immunostaining in Atxn2-CAG100-KIN cerebellum did not seem to co-localize with these aggregates and was solely detected in the nuclei (Supplementary Figure S2). However, the nuclear Sam68 signal in both Purkinje and granule neurons of Atxn2-CAG100-KIN cerebellum was stronger and more punctate compared to WT (Supplementary Figure S2), indicating the higher nuclear abundance of Sam68, which explains its upregulation in the SDS fraction at this age.
In short, detailed investigation of the glutamate-dependent synaptic signaling and Ca2+/CaM-dependent kinase signaling revealed an early defect in Ca2+ association dynamics of CaM, and reduced the expression of many cascade components at both transcript and protein levels, including GluA3, CaMKIIα and CaMKIV as early risk and progression markers of the disease. Sam68, a downstream target of CaMKIV, was found to be affected later in disease progression with increased nuclear abundance and granular redistribution, but without detectable sequestration into cytosolic ATXN2 aggregates.

2.6. Alternative Splicing Profile of Nrxn1 in Ataxin-2 Pathology

It is well known that expanded ATXN2 interacts with other RNA-binding proteins, and prominently with the splice modulator TDP-43. To investigate the potential downstream effects of CaMKIV-Sam68 pathway alterations observed in Atxn2-CAG100-KIN mouse cerebellum starting before disease onset, we focused on the alternative splicing of Neurexin-1 (encoded by Nrxn1), a well-studied structural synapse component. Nrxn1 transcript has six alternative splice (AS) sites, AS1-6 (Figure 5A), generating a plethora of mature mRNA and protein isoforms exhibiting differential interactions with synaptic cleft or post-synaptic membrane proteins, such as cerebellins, neuroligins, leucine-rich repeat proteins (LRRTMs), dystroglycan and latrophilins [68,70]. The neuronal activity-dependent splicing of Nrxn1, especially at AS4, is governed by Sam68, Slm1 or Slm2 in distinct neuronal populations [71]. In cerebellar granule neurons, Sam68 is the dominant regulator, and enhances the Nrxn1 splicing towards AS4(−) isoform lacking the alternatively spliced exon at this site. Loss of Sam68 activity in cerebellum, or that of Slm1 and Slm2 in different CNS regions, has been shown to significantly diminish splicing activity at this site, therefore reducing the abundance of AS4(−) and increasing AS4(+) isoform [67,72,73]. In parallel to the widely studied AS4 site, we investigated the splicing activity at all Nrxn1 AS sites in Atxn2-CAG100-KIN cerebellum at terminal disease stage, when Khdrbs1 (Sam68) and Khdrbs3 (Slm2) are significantly decreased.
Excision of the alternatively spliced exon at each AS site produces the “spliced” or (−) isoform, whereas retaining the exon generates the “unspliced” or (+) isoform. Due to high structural complexity of the AS1 site, only the AS1(−) variant lacking all intermediate exons was successfully quantified with RT-qPCR, showing a significant increase in Atxn2-CAG100-KIN cerebellum compared to WT animals, indicative of higher exon excision rate at AS1 (Figure 5B). While the AS2(−) isoform showed no significant alteration, AS2(+) isoform was found increased in Atxn2-CAG100-KIN animals indicating a tendency towards exon retention at this site. In contrast, exon excision at AS3 site was found to be increased, as supported by significantly high abundance of AS3(−) isoform in Atxn2-CAG100-KIN samples, without a change in AS3(+) levels. All the other splice sites located downstream, namely AS4, AS5 and AS6, showed the increased abundance of all splice variants in Atxn2-CAG100-KIN cerebellum, without a selective preference for (+) or (−) isoforms (Figure 5B). The ratio of spliced-to-unspliced variant abundance for each AS site reveals the splicing activity (i.e., exon excision rate) at this region. The assessment of excision rates at AS2-6 revealed significantly lower splicing activity at AS2 and significantly higher activity at AS3 in Atxn2-CAG100-KIN cerebellum at terminal disease stage, whereas no alteration of splicing rate was observed at AS4-6 (Figure 5C). The AS2(−) isoform of Nrxn1 protein was reported to selectively interact with the postsynaptic dystroglycan/dystrophin complex [74,75], and currently there are no studies revealing a selective interaction of Nrxn1 based on AS3 site splicing. Quantification of the total levels of Nrxn1, together with Nrxn2 and Nrxn3, revealed no alteration in Atxn2-CAG100-KIN cerebellum at terminal disease stage (Figure 5D).
Altogether, these results suggest synaptic connections between granule and Purkinje neurons in Atxn2-CAG100-KIN cerebellum to be affected by abnormal splicing of selective Nrxn1 isoforms, rather than by the steady-state abundance change of all Neurexins.
Investigation of total Nrxn1 level and AS4 splicing pattern, as the most studied Nrxn1 splicing event, in Atxn2-KO and pre-onset Atxn2-CAG100-KIN cerebella showed no significant dysregulations (Supplementary Figure S3A), indicating that the splicing alterations emerge and contribute to disease pathogenesis in an expansion-driven manner and rather late in progression.

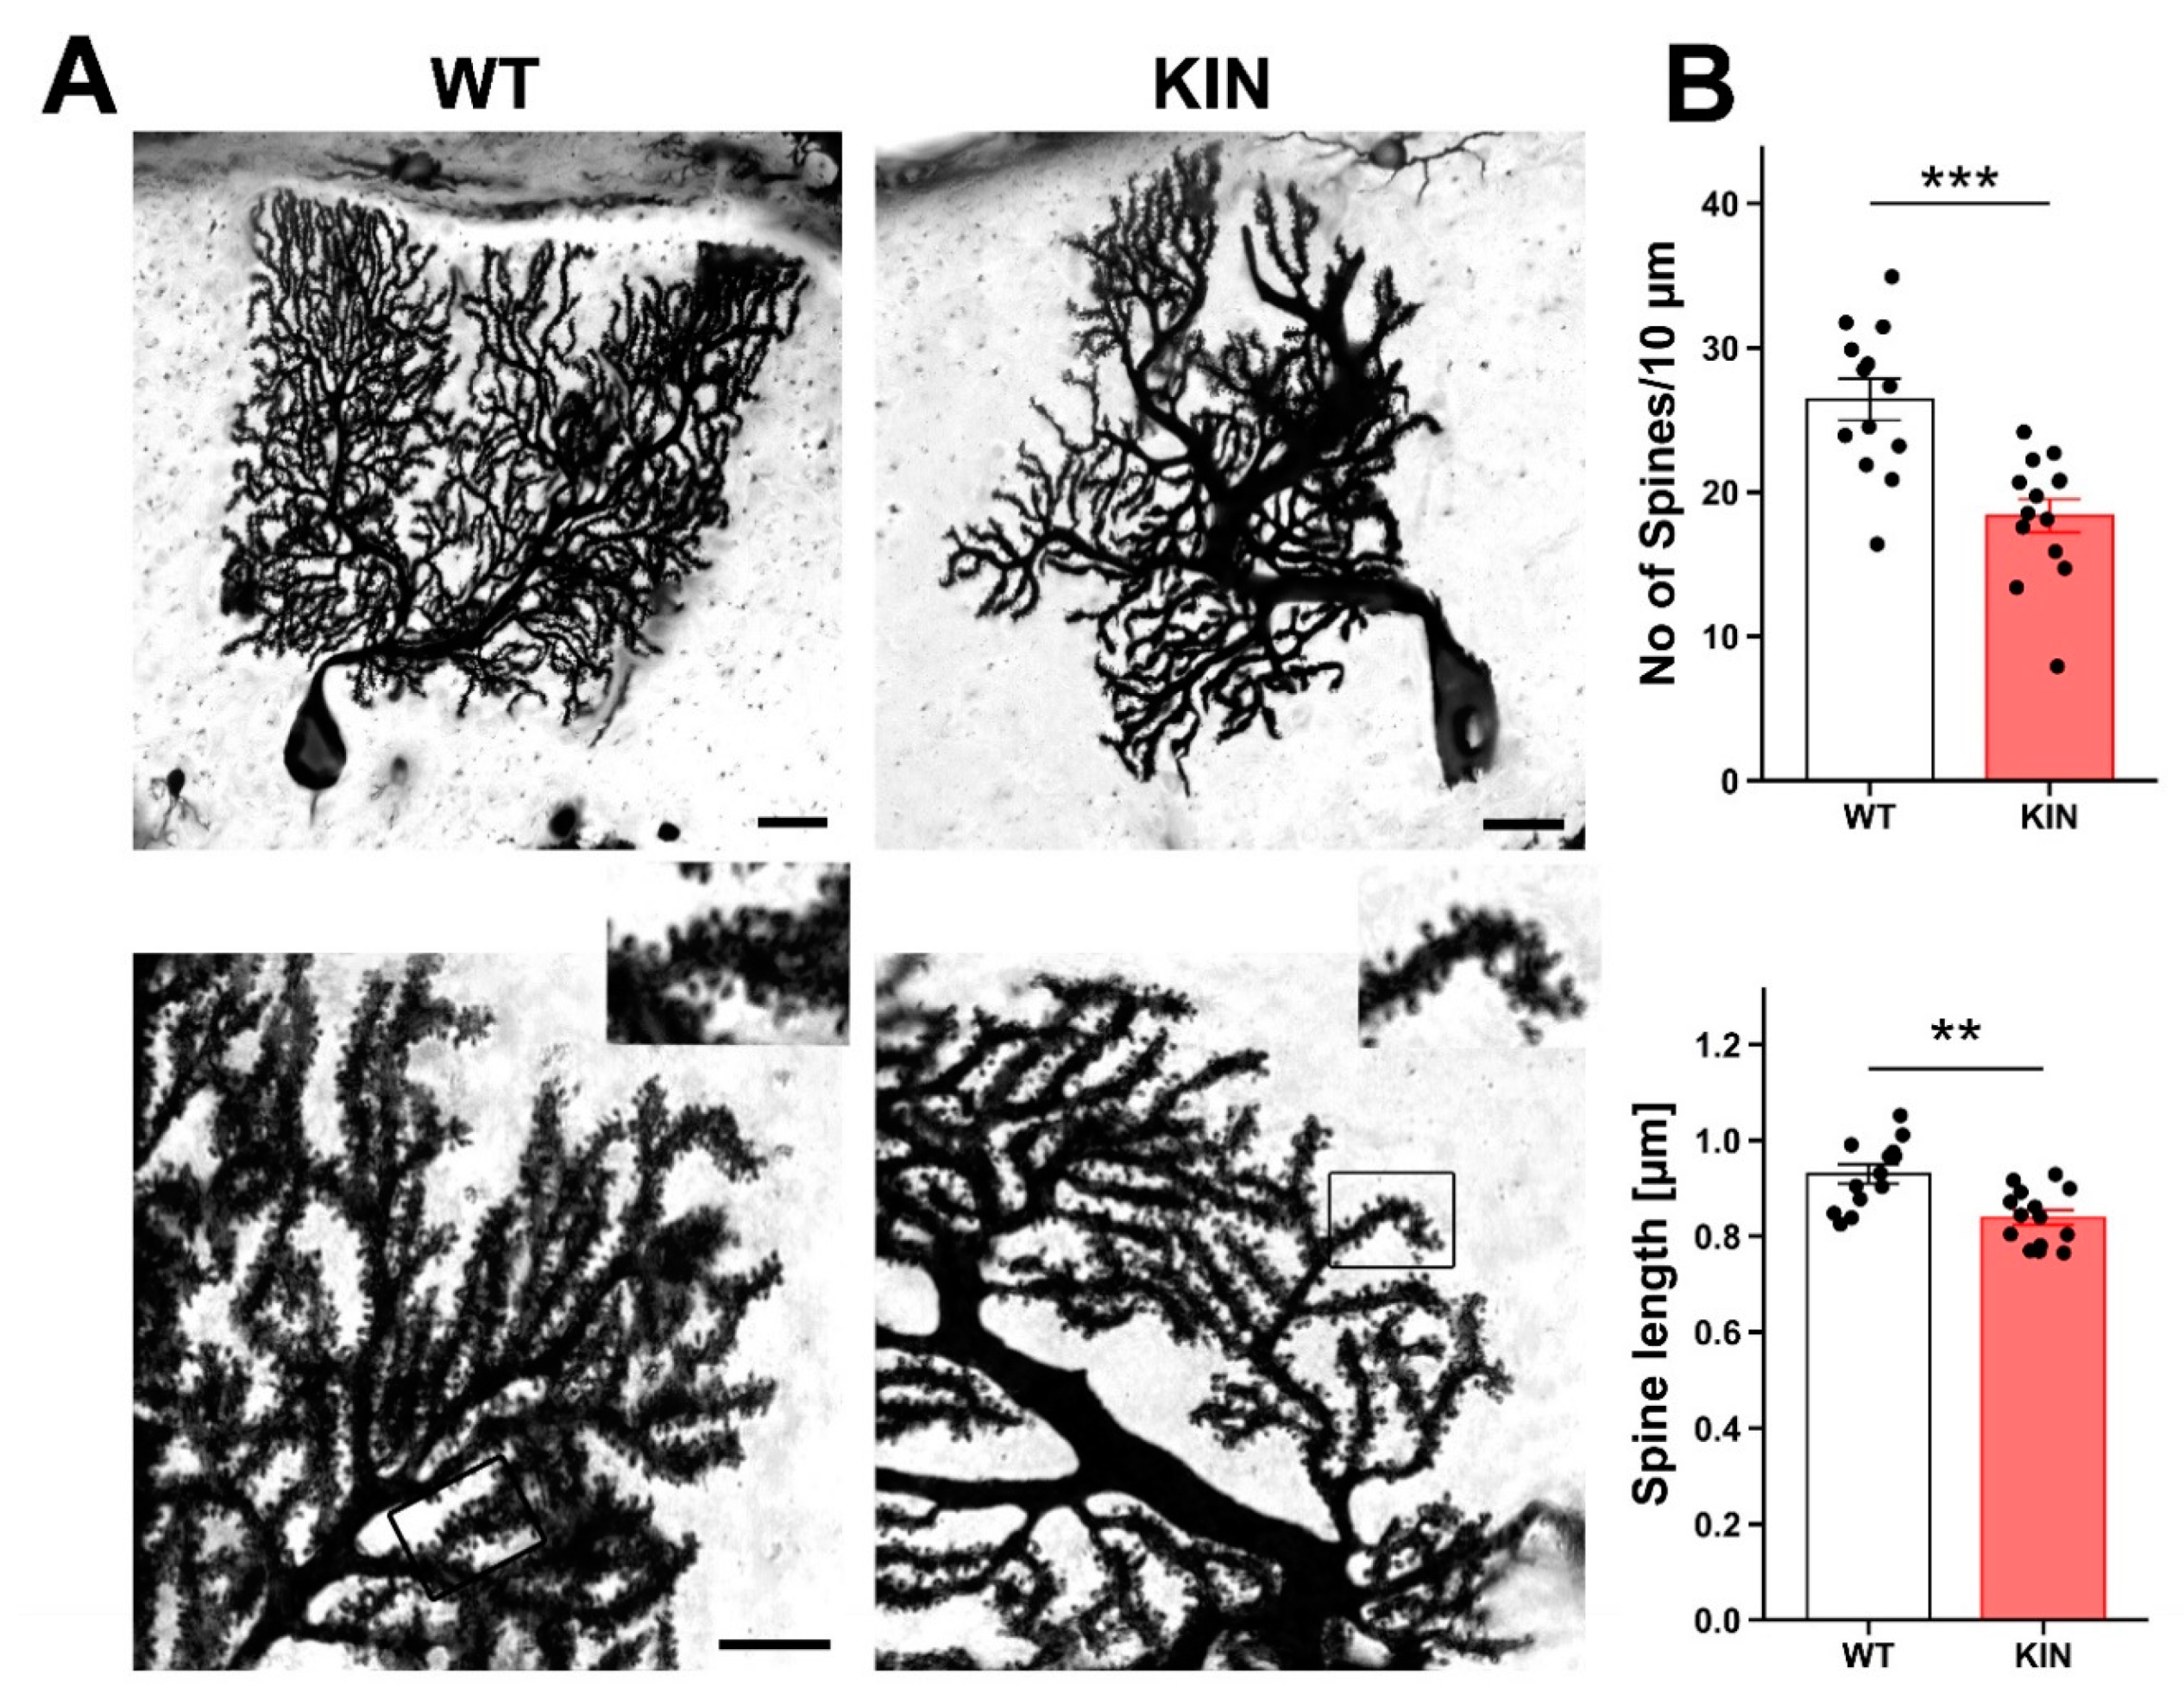
2.7. Morphological Assessment of Purkinje Cell Spines

Having established the early influence of ATXN2 expansion on CaMKIIα and CaMKIV signaling, and its downstream effects on the alternative splicing of presynaptic Neurexin-1 protein, we assessed whether the deficit of these crucial factors for synaptic plasticity and adhesion triggered morphological correlates for the synapses between granule and Purkinje neurons. Golgi silver impregnation of Atxn2-CAG100-KIN cerebella showed a significant reduction in spine length and spine density at the age of 9 mo, at a stage when motor incoordination had become apparent in each individual mouse (Figure 6).
Overall, both poles of the parallel fiber synapse onto Purkinje spines were found to be influenced by the ATXN2 expansion; this was prominently reflected by CaMKIV-dependent alternative splicing anomalies in the presynaptic granule neuron, and by CaMKIIα-driven dendritic spine collapse in the postsynaptic Purkinje neuron.

2.8. Molecular Assessment of Glutamatergic Synapse Strength and Adhesion

The morphological atrophy of Purkinje dendrite spines and the altered Neurexin-1 splicing suggest impaired synaptic strength and adhesion. Parallel fiber activity via glutamatergic excitation determines the growth of Purkinje spine postsynaptic compartments, the facilitation of synaptic plasticity, and the interaction stability between pre- and post-synaptic structures. Differentially spliced isoforms of Nrxn1 were previously shown to interact with postsynaptic ionotrophic Glutamate receptor δ2 (Grid2 encoding GluD2) via extracellular cerebellins (Cbln1-4), neuroligins (Nlgn1-3), dystroglycan, LRRTMs and latrophilin, to regulate the long-term potentiation and depression features of the synapse [68]. Systematic analyses of cerebellin isoforms revealed an early dysregulation of Cbln4, with progressive decrease throughout the disease course, and late-onset downregulations of Cbln2 and Cbln3 (Figure 7). Transcript levels for the postsynaptic effector of NRXN1 and Cerebellins, Grid2, also showed a significant downregulation, which started at the pre-onset phase and further decreased with disease progression (Figure 7). Another group of postsynaptic NRXN1 interactors, Neuroligins, only showed a significant dysregulation of the Nlgn2 isoform in parallel with the disease progression (Figure 7). A glutamatergic trans-synaptic adhesion protein complex, which consists of membrane-associated Adam22, extracellular Lgi1 and Lgi3, and membrane-associated Adam23 on the opposite side of the synaptic cleft, serves also as a clustering platform for other synaptic entities such as K+ channels or AMPA receptors [76]. Expression analyses of these complex components revealed an early dysregulation of Adam23 and Lgi1 at 3 mo, with a progressive decrease of Adam23 at 14 mo. Interestingly, Lgi1 showed normal expression at the terminal disease phase in Atxn2-CAG100-KIN cerebellum (Figure 7). Finally, transcript levels of ionotropic glutamate receptor NMDA type 1 (Grin1) and of the IP3R-associated postsynaptic structural component Shank (Shank1, Shank2) showed a significant dysregulation at 14 mo. This is in line with the previous observation of dendritic spine pathology in Purkinje cells at 9 mo. Shank2 also showed an earlier trend towards downregulation at three mo, and a milder dysregulation in Atxn2-KO cerebellum. The postsynaptic receptor scaffold PSD95 (Dlg4) did not show altered expression throughout the disease course (Figure 7), in good agreement with a previous report that PSD95 binding and relocalization are under the control of CamKII [77]. Together, the data highlight extracellular intermediates Cbln2 and Cbln4, and post-synaptic Grid2, Nlgn2, Adam23 and Shank2 transcripts as important targets of ATXN2 aggregation pathology, among many other structural synapse components. A schematic representation of all the signaling cascades and transcripts/proteins studied in the context of this work is depicted in Figure 8.

2.9. Dissecting the Molecular Signature of SCA2 Pathology to Define Purkinje Neuron Contribution

In order to clarify which dysregulated molecules in the Atxn2-CAG100-KIN cerebellum at pre-onset and terminal disease stages are due to Purkinje pathology rather than granule neuron affection, we evaluated their cerebellar in situ hybridization data from the public Allen Mouse Brain Atlas. Prominent expression in Purkinje neurons was observed for most calcium homeostasis channels/transporter (see compilation in Supplementary Figure S3), the glutamate receptors Grm1 and Grid2, Plcb4, Camk2a, Khdrbs1, as well as the adhesion factors Adam23 and Nlgn2-3 (Supplementary Figures S4 and S5). Prominent expression in granule neurons was detected for Plcg1, Camkk2, Camk4, the adhesion factors Cbln1-4 and Nlgn1 (Supplementary Figures S4 and S5).
It is relevant to understand whether the postsynaptic pathology is secondary to abnormal presynaptic input, or cell-autonomous. To address this question, we examined several prominent changes that progressed throughout the disease, using another mouse model of SCA2 with human ATXN2-Q58 transgenic overexpression under control of the Purkinje cell specific Pcp2 promoter [78], shortly named Q58-Tg here. Two stages of disease in the Q58-Tg model were investigated, using 16-week (wk) and 46-wk-old cerebella, in accordance with the behavioral and neuropathology data reported earlier [78]. Among the investigated Ca2+ transporters, only Itpr1 showed a rather noteworthy downregulation at early disease stage, with no alteration at late stage. Ryr1, Inpp5a, Camk2a, Camk4, Khdrbs1, Nrxn1, Nrxn2, Nrxn3, Nrxn1 AS4 splicing, Grid2 or Adam23 were not found dysregulated at any point in disease duration (Supplementary Figure S6). The only other significant finding was the upregulation of the postsynaptic adhesion factor Nlgn2 at younger age in Q58-Tg cerebellum, which again was not observed in old cerebella. Thus, almost all of the many dysregulations observed in the Atxn2-CAG100-KIN mouse cerebellum appear to occur in granule neurons or to occur in Purkinje neurons due to altered glutamatergic input from granule neurons. Only two of the dysregulations could be attributed to Purkinje neuron events in a cell-autonomous manner.

3. Discussion

Generation of the Atxn2-CAG100-KIN mouse allowed us to employ cerebellum from this authentic SCA2 model, to define molecular markers of pathology at the pre-onset stage and the terminal stage. The first survey of unbiased global transcriptome profiles and its systematic targeted validation defined a physiological role of ATXN2 for calcium homeostasis and calcium-dependent signaling, while the neurotoxic progressive aggregation of ATXN2 has a stronger impact and affects signaling cascades more broadly, including synaptic strength via glutamate receptors, inositol second messengers, stimulus-dependent allelic splicing, and adhesion factors. The downregulation of about 50 factors in these pathways was assessed regarding progression across lifespan, determining the impact of gain-of-toxic-function versus loss-of-physiological-function of ATXN2 in each case. Prominent disease-associated mRNA markers with significant early downregulation and strongly progressive deficits included Atp2a2, Trpc3, Gria3, Inpp5a, Itpka, Camkk2, Camk2a, Camk2b, Camk4, Cbln4, Grid2 and Adam23. Overall, the emerging scenario indicates that the marked Purkinje neuron degeneration to occur largely within the framework of impaired connectivity and stimuli from the glutamatergic granule neurons in the cerebellum.
Itpr1 mRNA downregulation was significant, but not as strong as expected from the Q58-Tg mouse model, in view of the reported abnormal interaction between expanded ATXN2 and the ITPR1 protein as a potential cause of pathology in Purkinje neurons [79]. Even in the Q58-Tg mouse, the Itpr1 downregulation was not progressive with age. Of course, the disease mechanisms may result from a combination of pathways and protein interactions, the role of key molecules is not mutually exclusive, and additional abnormal interactions of ATXN2 beyond ITPR1 may contribute. Interestingly, two of the other progression markers have also been implicated among the primary causal events in the pathogenesis of SCA2.
Firstly, Sam68, as a K-homology domain-containing RNA-binding signal transduction factor, which is under the control of CaMKIV and of the insulin receptor, was found to co-immunopurify with Ataxin-2 in several species [80]. It was therefore noteworthy that Sam68 protein was elevated in a tissue where ATXN2 aggregates accumulate progressively, and might reflect sequestration into the cytosolic inclusion bodies. Although our immunohistochemical studies observed a granular nuclear redistribution instead, it cannot be excluded that Sam68 is also relocalized to cytosolic stress granules by the expanded ATXN2, where its epitopes may be masked from detection. The sequestration of Sam68 into intranuclear RBP aggregates was shown to be an early disease event and crucial in fragile-X-tremor-ataxia-syndrome (FXTAS), impacting the mRNA splicing/metabolism in dendrites and thus determining the number of glutamatergic synapses [81,82].
Secondly, the Camk2a mRNA may have a crucial role in initial pathogenesis, given that Drosophila melanogaster studies showed Ataxin-2 to modulate olfactory habituation via CaMKIIα, and demonstrated the Camk2a mRNA to copurify with Ataxin-2 in fly head extracts, so it might be a direct mRNA target of Ataxin-2 binding and regulation effects [83]. The impact of fly Ataxin-2 as well as mouse Ataxin-2 on CaMKIIα is phylogenetically conserved, and it may explain the selective atrophy of nervous tissue better than the conserved effect of Ataxin-2 on mTORC1. CaMKIIα is a central hub for the regulation of the electrophysiological long-term potentiation in glutamatergic synapses, for the subsequent biochemical and morphological adaptations of synaptic strength known as plasticity, and for functional consequences such as motor learning [84,85,86,87]. Its progressive deficiency in the Atxn2-CAG100-KIN cerebellum is expected to cause a visible atrophy of the dendritic spines in Purkinje neurons, a process that became conspicuous and statistically significant at the age of 9 mo. In the global transcriptome profile of 3-month-old Atxn2-CAG100-KIN cerebellum, the strongly significant and massive downregulation of several growth-associated factors such as Igfbp5 and Prkcd may represent very early events in this process of synaptic atrophy.
Alternative splicing is a known downstream effect of several known ATXN2 protein interactors, with a contributing role to the neurodegenerative process, such as TDP-43, RBFOX1, and Sam68. In the disease process of SCA2, it is unclear at present what the crucial mRNA targets of such splice anomalies can be. Neurexin-1 (Nrxn1) splicing is under the control of Sam68, its role as presynaptic receptor for the Neuroligins (Nlgn1-3) and the Cerebellins (Cbln1-4), with subsequent effects on postsynaptic GluD2 and Adam23 [88,89], may be responsible for the downregulation of these factors, and all these anomalies together suggest that synaptic adhesion is impaired. Of course, the Camk2a mRNA itself can also be alternatively spliced, and numerous other excitability factors in neural tissue are regulated in dependence on trophic stimuli versus stress, via alternative splicing or by alternative polyadenylation, so extensive studies at genome-wide levels will be necessary to obtain a systematic overview.
A question that remains unclear is the role of calcium homeostasis in this process—is its disruption only a consequence of the altered RNA processing and protein interactions in SCA2, or does it have a causal role promoting the aggregation of expanded ATXN2 protein? Several lines of evidence indicate that ATXN2 expansion affects one of the most important neuronal processes, namely the regulation of calcium (Ca2+) flux and homeostasis, probably at the ER and at mitochondria. Studies in a transgenic mouse model with overexpression of Q58-expanded human ATXN2 in cerebellar Purkinje neurons showed that mutant ATXN2 physically interacts with inositol-1,4,5-trisphosphate (IP3) receptor (IP3R), which was not observed in healthy animals. Mice with transgenic overexpression of Q127-expanded ATXN2 show decreased firing rates of Purkinje neurons that precede motor deficits [90]. Direct interaction of ATXN2 was proposed to increase IP3R sensitivity to activation by IP3, and leads to an enhanced cytosolic Ca2+ burst upon glutamatergic stimulation in primary Purkinje cell culture [79]. Overexpression of the IP3 phosphatase INPP5A, thus reducing IP3R activation in mutant Purkinje cells, was reported to decrease Purkinje cell death, regulate firing patterns and alleviate motor incoordination [91]. In addition to several other transgenic overexpression models, an Atxn2-CAG42 knock-in (KIN) mouse model was generated, which showed very mild neurological disease signs towards the end of normal mouse lifespan without obvious metabolic alterations [22]. Investigation of Atxn2-CAG42-KIN mouse cerebellum and its comparison to Atxn2-KO mice revealed similar downregulations of Ca2+ homeostasis pathway components such as Itpr1, Atp2a2 and Inpp5a [59]. Moreover, Atxn2-CAG42-KIN cerebella showed increased IP3R levels in the insoluble protein fraction, suggesting its accumulation in the aggregates. However, co-immunoprecipitation experiments did not show a direct interaction of IP3R with expanded ATXN2, contrasting with previous observations in overexpression mutants [59,79]. Machado–Joseph disease (also known as Spinocerebellar ataxia type 3) is caused by polyQ expansions of Ataxin-3, and it was shown that the mutant disease protein does not undergo aggregation in fibroblasts, induced pluripotent stem cells, glia cells, but only in neurons after stimulation by glutamate in processes that depended on Ca2+ [92]. In the case of SCA2 pathogenesis, deficient or abnormal stimulation of Purkinje neurons by parallel fibers and erroneous retrograde feedback within the circuit might lead to non-physiological release and reuptake of Ca2+ within synapses and neuronal soma, thus promoting the aggregation tendency of expanded ATXN2. This notion is supported by our observation that the Ca2+ modulator thapsigargin, but not the glycosylation modulator tunicamycin enhance the interaction of RNA-binding proteins such as ATXN2 and PABP within granular cytosolic structures, as an unspecific effect on proteins and RNAs that is not blocked by the genetic ablation of Ataxin-2. Although the thapsigargin treatment also caused ER stress features in cultured cells, in brain tissue, the ATXN2 aggregation is clearly progressive, while the ER stress at terminal stages of disease is not prominent. Overall, the availability of drugs that enhance or inhibit glutamate stimulation, inositol signals and calcium homeostasis, combined with the generation of authentic SCA2 animal models, will help us to distinguish primary events of SCA2 pathogenesis from the unspecific downstream affection of cerebellar circuit efficiency.
A final consideration should focus on the physiological function of ATXN2 for these signaling pathways. Given that the genetic ablation or knockdown of Ataxin-2 via the suppression of its physiological roles is able to mitigate and postpone the neurodegenerative process in several disorders (spinocerebellar ataxia type 1, known as SCA1, fronto-temporal lobar degeneration/dementia known as FTLD, amyotrophic lateral sclerosis known as ALS, tauopathies) [55,93,94], it is critical to ask which of the above factors are also modulated in the Atxn2-KO mouse cerebellum. Among the promising markers of disease progression summarized in the first Discussion paragraph, only Trpc3, Inpp5a, Itpka, Camk2a and Camk4 show significant impact by the ATXN2 deficiency, and may therefore be core elements of the neurodegenerative process, while the glutamate receptors and the adhesion factors might represent secondary players. Interestingly, the downregulated expression of these five factors in the Atxn2-CAG100-KIN cerebellum at pre-onset stage is on average as strong as in the Atxn2-KO cerebellum, but at terminal stage, about one third stronger than the Atxn2-KO. This observation suggests that a cerebellar phenotype does not appear in the Atxn2-KO because the deficit is non-progressive and compensated by other molecules within the same pathway, while the Atxn2-CAG100-KIN develops a cerebellar phenotype when the aggregation process sequestrates ATXN2 interactor molecules within the relevant pathway into insolubility, progressively eliminating the compensatory players and challenging multiple stress response pathways (i.e., ERAD, autophagy, mitochondrial dysfunction, energy deprivation) to be activated simultaneously. These mouse data on the role of Ataxin-2 in signal transduction and integration are compatible with the previous fly observations that Ataxin-2 modulates the habituation of sensory input in the olfactory system [83,95]. Sensory habitation was shown to depend also on other RNA-binding proteins, such as FMR1, both in flies and rodents [96,97].
Jointly, the understanding of molecular expression profiles at different ages of Atxn2-CAG100-KIN cerebellum and its comparison to that of Atxn2-KO is essential to elucidate the molecular chain of causality in the onset and progression of the pathology. The precise identification of native ATXN2 target pathways vs. expansion/aggregation effects is crucial. This approach identifies useful molecular markers to assess the benefit of neuroprotective treatment approaches, at a time when the utilization of ATXN2-ASOs for the treatment of SCA2 and ALS in clinical trials is imminent. The data presented here will also help to understand potential side effects of an ATXN2 knockdown approach.

4. Materials and Methods

4.1. Animals and Genotyping

The generation, housing and genotyping of both Atxn2-CAG100-knock in (KIN) and Atxn2-knock out (KO) lines were described before [23,48]. The generation of ATXN2-Q58-Tg line was described earlier [78], and the genotyping was done according to the published protocol. All animals were housed in individually ventilated cages with 12 h light/dark cycle at the Central Animal Facility (ZFE) of the Goethe University Medical School in Frankfurt am Main, Germany. All animal experiments were performed in accordance with the German Animal Welfare Act, the Council Directive of 24th November 1986 (86/609/EWG) with Annex II, and the ETS123 (European Convention for the Protection of Vertebrate Animals), and were reviewed by the Regierungspräsidium Darmstadt with approval code V54-19c20/15-FK/1083 (approved on 27th of March, 2017).

4.2. Transcriptome Screening

Single-stranded cDNA library was generated from DNase treated 1 μg of total RNA (3 WT vs. 3 Atxn2-CAG100-KIN cerebella), using GeneChipTM WT PLUS Reagent Kit (Applied Biosystems, Thermo Scientific, Waltham, MA, USA). Fragmentation and labeling of the cDNA library was performed immediately before hybridization to a Clariom D Array (Thermo Scientific, Waltham, MA, USA). The microarrays were scanned with the Affymetrix GeneChip Scanner, and data analysis was done with the Transcriptome Analysis Console (TAC) 4.0.1 (Applied Biosystems, Thermo Scientific, Waltham, MA, USA) using default parameters. For STRING interaction and pathway enrichment analysis, default parameters were employed.

4.3. Cell Culture and Treatments

Different clones of WT and Atxn2-KO murine embryonal fibroblasts (MEFs) were generated and cultured as described before [34], in growth medium consisting of DMEM (4.5 g/L glucose, Gibco, Thermo Scientific, Waltham, MA, USA), 10% FCS (Gibco, Thermo Scientific, Waltham, MA, USA), 2 mM L-Glutamine (Gibco, Thermo Scientific, Waltham, MA, USA) and 1% Penicillin-Streptomycin (Gibco, Thermo Scientific, Waltham, MA, USA). ER stress inducers Thapsigargin (TG) (Sigma Aldrich, St. Louis, MO, USA) and Tunicamycin (TM) (Sigma Aldrich, St. Louis, MO, USA) were added in the normal growth medium in various final concentrations and time intervals, as indicated on the figures.

4.4. RNA Isolation and Expression Analyses

Cerebellar tissue from WT and homozygous Atxn2-CAG100-KIN and Atxn2-KO animals were dissected and immediately frozen in liquid nitrogen. The numbers of animals used in transcript expression analyses are as follows: 4 WT vs. 4 Atxn2-CAG100-KIN at 3 mo, 5 WT vs. 3 Atxn2-CAG100-KIN at 14 mo, and 4 WT vs. 4 Atxn2-KO at 6 mo of age. RNA extraction from frozen tissue samples and MEFs was performed with the TRIzol Reagent (Sigma Aldrich, St. Louis, MO, USA) following manufacturer’s instructions. cDNA synthesis was done from 1 µg of total RNA using the SuperScript IV VILO kit (Thermo Scientific, Waltham, MA, USA), according to the user’s manual. Transcript expression analyses were done by quantitative real-time PCR utilizing StepOnePlus™ Real-Time PCR System (Applied Biosystems, Thermo Scientific, Waltham, MA, USA). For quantification with TaqMan® Assays, each qPCR reaction consisted of cDNA from 25 ng total RNA, 1 µL TaqMan® Assay (Applied Biosystems, Thermo Scientific, Waltham, MA, USA), 10 µL FastStart Universal Probe Master 2x (Rox) Mix (Roche, Basel, Switzerland) and ddH2O up to 20 µL of total volume. All TaqMan® Assays utilized in this study are listed in Table 1. Each sample was measured in duplicate with the following cycling conditions: 50 °C for 2 min, 95 °C for 10 min, followed by 40 cycles of 95 °C for 15 s and 60 °C for 1 min. Expression data were analyzed using 2−ΔΔCt method [98] with Tbp as housekeeping gene.
For quantification with SYBR® Green primers (Merck, Darmstadt, Germany), each qPCR reaction consisted of cDNA from 25 ng total RNA, 5 pmol/μL primers, 10 µL qPCR Mastermix Plus for SYBR Green I (Eurogentec, Liège, Belgium) and ddH2O up to 20 µL of total volume. All SYBR® Green primers utilized in this study are listed in Table 2. Each sample was measured in duplicates with the following cycling conditions: 95 °C for 10 min, followed by 40 cycles of 95 °C for 15 s and 60 °C for 1 min, and a melt curve stage of 95 °C for 15 s, 60 °C for 1 min and 95 °C for 15 s. Expression data were analyzed using 2−ΔΔCt method [98] with Actb as housekeeping gene.

4.5. Protein Extraction and Quantitative Immunoblots

Frozen cerebella from 5 WT vs. 5 homozygous Atxn2-CAG100-KIN animals were homogenized with a motor pestle in 5–10x weight/volume amount of RIPA lysis buffer (50 mM Tris-HCl pH8.0, 150 mM NaCl, 1% NP-40, 0.5% sodium deoxycholate, 0.1% SDS, 2 mM EDTA, and Protease Inhibitor Cocktail, cOmplete™, Mini, EDTA-free (Roche, Basel, Switzerland)). Following centrifugation at 13,000× g for 15 min at 4 °C, supernatant was transferred to a fresh tube, and the pellet was homogenized in 2x SDS lysis buffer (137 mM Tris-HCl, pH 6.8, 4% SDS, 20% glycerol) with a motor pestle, after which, samples were sonicated with an ultrasonic homogenizer (Bandelin, Berlin, Germany). Aliquots with 20 µg of total protein from the RIPA lysates and 10 µg of total protein from the SDS lysates were mixed with 2x Loading Buffer (250mM Tris-HCl pH 7.4, 20% Glycerol, 4% SDS, 10% 2-Mercaptoethanol, 0.005% Bromophenol blue, 5% ddH2O) and incubated at 90 °C for 3 min. Proteins were separated on polyacrylamide gels and transferred to Nitrocellulose membranes (Protran, GE Healthcare, Chicago, IL, USA). The membranes were blocked in 5% BSA/TBS-T for 1 h, and incubated overnight at 4 °C, with primary antibodies diluted in blocking buffer. The primary antibodies utilized in this study are: ACTB (Sigma Aldrich, St. Louis, MO, USA, A5441, 1:10,000), ATP2A2 (Cell Signaling, Danvers, MA, USA, #9580, 1:1000), CaMKIIα (Cell Signaling, Danvers, MA, USA, #3357, 1:1000), CaMKIV (Cell Signaling, Danvers, MA, USA, #4032, 1:500), GluA3 (Cell Signaling, Danvers, MA, USA, #4676, 1:1000), ITPR1 (Abcam, Cambridge, UK, ab5804, 1:500), and Sam68 (Abclonal, Woburn, MA, USA, A6101, 1:1000). Membranes were washed and incubated in fluorescent-labeled secondary antibodies diluted in blocking buffer for 1 h at RT. Secondary antibodies used in this study are: goat anti-mouse (Licor Biosciences, Lincoln, NE, USA, 926-32280 IRDye 800CW or 926-68070 IRDye 680RD, 1:10,000) and goat anti-rabbit (Licor Biosciences, Lincoln, NE, USA, 926-32211 IRDye 800CW or 926-68071 IRDye 680RD, 1:10,000). Membranes were scanned using Li-Cor Odyssey Classic instrument (Licor Biosciences, Lincoln, NE, USA), and image analyses were performed on ImageStudio software.

4.6. Colorimetric Ca2+ Measurement

Colorimetric Calcium Detection Assay Kit (Abcam, Cambridge, UK) was utilized for the measurement of total Ca2+ concentrations in cytosolic and membrane-encapsulated organelle-rich fractions of mouse cerebellum following manufacturer’s protocol with minor modifications in the sample lysis step. Fresh cerebellar tissue from 7 WT vs. 6 homozygous Atxn2-CAG100-KIN animals at the age of 3 mo were homogenized with a motor pestle in 5-10x weight/volume amount of low detergent PN Buffer (1x PBS, 1% NP-40, 150 mM NaCl) immediately after dissection. Following centrifugation at 13,000× g for 15 min at 4 °C, supernatant was transferred to a fresh tube, and the pellet was homogenized in high-detergent Urea Lysis Buffer (8 M Urea, 10 mM Tris(2-carboxyethyl)phosphine, 40 mM 2-Chloroacetamide, 100 mM Tris) with a motor pestle, after which samples were sonicated with an ultrasonic homogenizer (Bandelin, Berlin, Germany). Colorimetric Calcium Detection Assay Kit was used according to user manual from this point on, each sample being measured in duplicates. The Ca2+ standard provided in the kit was used to generate a standard curve and determine the Ca2+ concentrations of unknown samples. Densitometric measurements were performed with Spark® multimode microplate reader (Tecan Technologies, Zürich, Switzerland) by measuring the absorbance value at 575 nm. Final concentration calculations were done in Microsoft Excel software following the instructions of the manufacturer.

4.7. Immunostainings

For immunocytochemistry, 5 × 10⁴ cells from WT and Atxn2-KO MEF cultures were seeded on 12 mm cover slips. The next day, the cells were stressed with 5 µM TG and 10 µg/mL TM supplemented in the growth medium for 6 h at 37 °C, then were fixed with 4% PFA/PBS at RT for 20 min. Following permeabilization with 0.1% Triton-X-100/PBS for 20 min at RT, and blocking with 3% BSA/PBS solution for 1 h at RT, cells were incubated in primary antibody solution for 1 h at RT with anti-ATXN2 (BD Biosciences, Franklin Lakes, NJ, USA, #611378, 1:100) and PABP (Abcam, Cambridge, UK, ab21060, 1:250), diluted in blocking buffer. After 3× washing in PBS, secondary antibody incubation with chicken anti-mouse-Alexa Fluor 488 (Molecular Probes, Eugene, OR, USA, A21200, 1:1000), goat anti-rabbit-Alexa Fluor 546 (Molecular Probes, Eugene, OR, USA, A11036, 1:1000) and DAPI (Thermo Scientific, Waltham, MA, USA, 1 µg/mL) diluted in blocking buffer was performed for 1 h at RT in dark. Coverslips were mounted with Lab Vision™ PermaFluor™ fluorescent mounting medium (Thermo Scientific, Waltham, MA, USA) on glass slides and dried overnight. Imaging was done with Zeiss Axiovert 200M (Carl Zeiss, Oberkochen, Germany) inverted microscope using a 100× objective, and image processing was done with ImageJ software.
For immunohistochemistry, 14-month-old WT and homozygous Atxn2-CAG100-KIN mice were deeply anesthetized with intraperitoneal Ketaset (300 mg/kg) and Domitor (3 mg/kg). Intracardial perfusion was performed with PBS for 5 min and 4% PFA in 0.1 M PBS for 5 min. Then, the tissue was post-fixed overnight in 4% PFA at 4 °C, immersed in 30% sucrose until it sank to the bottom, cryosectioned to 30 μm sagittal slices and stored at −20 °C in cryoprotection buffer (30% ethylene glycol, 25% glycerin, 0.01% sodium azide in 0.1 M PBS). Free floating cryosections were washed 3× for 10 min with 0.3% Triton-X-100/PBS and blocked with 5% goat serum (Sigma Aldrich, St. Louis, MO, USA) in 0.1% Triton-X-100/PBS for 1 h at RT with slow shaking. Primary antibody solution with anti-ATXN2 (BD Biosciences, Franklin Lakes, NJ, USA, #611378, 1:100) and anti-SAM68 (Abclonal, Woburn, MA, USA, A6101, 1:1000) diluted in blocking buffer was performed at 4 °C with slow shaking overnight. Sections were washed 3 × 10 min with PBS and incubated in secondary antibody solution for 2 h at RT in dark with goat anti-mouse-Alexa Fluor 546 (Molecular Probes, Eugene, OR, USA, A11003, 1:1000), goat anti-rabbit-Alexa Fluor 488 (Molecular Probes, Eugene, OR, USA, A11034, 1:1000) and DAPI (Thermo Scientific, Waltham, MA, USA, 1 µg/mL) diluted in blocking buffer. After 3 × 10 min washes in PBS, sections were mounted on glass slides with Lab Vision™ PermaFluor™ fluorescent mounting medium (Thermo Scientific, Waltham, MA, USA) and dried overnight. Imaging was done with Nikon Eclipse TE2000-E (Nikon, Tokyo, Japan) inverted confocal microscope using a 40× objective, and image processing was done with Fiji BioVoxxel software.

4.8. Silver Impregnation

Silver impregnation was done as described before [100]. Since Purkinje cell morphology differs between lobes, only cells from lobules 1 to 6 have been evaluated. In addition, only cells were selected for analysis, which were stained throughout most of the cell and which were positioned isolated from other stained cells so that the whole dendritic profile was visible. Images were taken with a confocal microscope (TCS SP2, Leica, Wetzlar, Germany), having a 40× oil immersion objective (NA = 1.25) using a zoom factor of 1.8 (lower magnifications) and 6.0 (higher magnifications). Voxel sizes have been set to 0.2 µm (x and y) and 2.0 µm (z) for lower magnifications, and 0.06 (x and y) and 0.5 (z) for higher magnifications. Z stacks were imported into ImageJ (v 1.53c) and an extended depth of field calculation was done using ImageJ Plugin of Forster et al. [101]. Three animals have been prepared from each genotype, at least 10 sections from the vermal region have been stained and 1–2 Purkinje cells of each slice have been selected and photographed. For each Purkinje cell 3–4 dendritic regions have been selected and spines were measured along a segment which was defined by the following criteria: (i) it is part of the terminal endings, (ii) it is visible along a length of at least 5 µm, and (iii) the segment was visible within 10 z planes. Using the segmented line tool in ImageJ, the lengths of spines were measured and combined for each Purkinje cell. In order to validate measurement, images of unknown genotype to the investigator were analyzed by three different experimentators (NC, SLB and NES) and results were compared. There was a 95% confidence of obtaining the same results. For statistical evaluation, equal data distribution was assessed with Levene’s test, and one-way ANOVA was used to compare genotype dependent spine number and length differences.

4.9. Statistical Analyses

Unless specified otherwise, all statistical tests for comparisons between WT and mutant mice (except for silver impregnation analyses) were performed using unpaired Student’s t-test with Welch’s correction, and for cell culture experiments using 2-way ANOVA with multiple testing corrections on GraphPad Prism software version 7. The fold-change differences and p-values of all the expression analyses performed in mouse tissue and cell culture are listed in Supplementary Table S3. Graphs display mean values with standard error of the mean (s.e.m.). Values p < 0.05 were considered significant and marked with asterisks p < 0.05 *, p < 0.01 **, p < 0.001 ***, p < 0.0001 ****. T indicates a trend towards statistical significance (0.05 < p < 0.1).

5. Conclusions

The Atxn2-CAG100-KIN mouse holds the advantage of modelling ATXN2-dependent neurological disease, not only in a targeted neuron population, but also in the whole organism. Studying different stages of disease progression in this SCA2 model, and especially the primary pathogenesis events at pre-onset phase, is crucial to dissect the causal chains of molecular dysregulations as the crucial effectors of pathology, and to identify potential targets for preventive therapeutic interventions. The global transcriptome profile of Atxn2-CAG100-KIN cerebellum at pre-onset phase highlights Ca2+ homeostasis and associated downstream effectors, such as CaMK signaling and glutamatergic neurotransmission, as the prominent targets of early-stage pathology. Progressively altered expression levels of various Ca2+ channels and transporters indicate an imbalanced Ca2+ localization between cytosol and ER. Normally diffuse cytosolic ATXN2 protein was found to relocalize into stress granules upon thapsigargin-triggered ER stress via enforced Ca2+ imbalance, but not upon ER stress via blocking glycosylation. In accordance with their dependence on Ca2+ homeostasis, CaMKIIα and CaMKIV signaling pathways and their molecular outcomes, i.e., post-synaptic dendritic spine morphology in Purkinje neurons and pre-synaptic alternative splicing of Neurexins in granule neurons, were found to be affected by ATXN2 pathology. These initial findings were further supported by subsequent dysregulations of numerous pre- and post-synaptic adhesion factors at the granule cell-Purkinje neuron interface, suggesting a simultaneous onset and progression of pathology in different neuron types in the cerebellum.

Supplementary Materials

Supplementary materials can be found at https://www.mdpi.com/1422-0067/21/18/6673/s1.

Author Contributions

Conceptualization, G.A. and N.-E.S.; methodology, A.A., J.C.-P., M.V.H., K.S. and N.-E.S.; software, C.D., D.E.-S.; validation, A.A., J.C.-P.; formal analysis, A.A., S.B., N.-E.S.; investigation, A.A., J.C.-P., D.E.-S. and N.C.; resources, M.V.H. and S.G.; data curation, J.C.-P. and D.E.-S.; writing—original draft preparation, A.A., N.-E.S. and G.A.; writing—review and editing, S.L.B. and G.A.; visualization, N.-E.S. and S.L.B.; supervision, F.F., S.L.B. and G.A.; project administration, N.-E.S.; funding acquisition, F.F., S.L.B. and G.A. All authors have read and agreed to the published version of the manuscript.

Funding

This study was funded by the Deutsche Forschungsgemeinschaft, grant numbers AU96/11-1 and AU96/11-3 (to G.A.), grant number FR3420/2–2 (to F.F.), equipment grant number INST1172/37-1 (to S.L.B.), and by the Avicenna-Studienwerk with funds from the German Federal Ministry of Education and Research (to D.E.-S.).

Acknowledgments

We are grateful for the excellent experimental assistance of Gabriele Köpf, and the kind technical help provided by Elif Fidan and Annett Wilken-Schmidt.

Conflicts of Interest

The authors declare no conflict of interest.

Abbreviations

°CDegrees Celcius
µgMicrogram
µmMicrometer
μLMicroliter
μMMicromolar
ACTBBeta Actin
Adam22A Disintegrin And Metalloproteinase Domain 22
Adam23A Disintegrin And Metalloproteinase Domain 23
ALSAmyotrophic lateral sclerosis
AMPAα-amino-3-hydroxy-5-methyl-4-isoxazolepropionic acid
ANOVAAnalysis of variance
ASAlternative splicing
ASOAntisense oligonucleotide
Atf4Activating Transcription Factor 4
Atf6Activating Transcription Factor 6
Atp2a1ATPase Sarcoplasmic/Endoplasmic Reticulum Ca2+ Transporting 1
Atp2a2ATPase Sarcoplasmic/Endoplasmic Reticulum Ca2+ Transporting 2
Atp2a3ATPase Sarcoplasmic/Endoplasmic Reticulum Ca2+ Transporting 3
Atp2b2ATPase Plasma Membrane Ca2+ Transporting 2
ATXN2Ataxin-2
ATXN2LAtaxin-2-Like
BiPEndoplasmic Reticulum Lumenal Ca2+-Binding Protein Grp78 (Hspa5)
BSABovine serum albumin
Ca2+Calcium ion
CAACytosine-Adenine-Adenine trinucleotide
Cabp7Calcium Binding Protein 7
Cacna1aCalcium Voltage-Gated Channel Subunit alpha-1-A
CAGCytosine-Adenine-Guanine trinucleotide
CaMCalmodulin
CaMKCa2+/Calmodulin-Dependent Protein Kinase
Camk2aCa2+/Calmodulin-Dependent Protein Kinase II alpha
Camk2bCa2+/Calmodulin-Dependent Protein Kinase II beta
Camk2dCa2+/Calmodulin-Dependent Protein Kinase II delta
Camk2gCa2+/Calmodulin-Dependent Protein Kinase II gamma
Camk4Ca2+/Calmodulin-Dependent Protein Kinase IV
CaMKIIαCa2+/Calmodulin-Dependent Protein Kinase II alpha
CaMKIVCa2+/Calmodulin-Dependent Protein Kinase IV
Camkk1Ca2+/Calmodulin-Dependent Protein Kinase Kinase 1
Camkk2Ca2+/Calmodulin-Dependent Protein Kinase Kinase 2
Car8Carbonic Anhydrase 8
CaV2.1Calcium Voltage-Gated Channel Subunit alpha-1-A
Cbln1Cerebellin 1
Cbln2Cerebellin 2
Cbln3Cerebellin 3
Cbln4Cerebellin 4
cDNAComplementary DNA
ChopC/EBP-Homologous Protein (Ddit3)
CNSCentral nervous system
CtCycle threshold
C-terminalCarboxy-terminal end
DAGDiacylglycerol
DAPI4′,6-diamidino-2-phenylindole
ddH2ODouble-distilled water
Dlg4Discs Large MAGUK Scaffold Protein 4
DMEMDulbecco’s modified essential medium
DNA Deoxyribonucleic acid
DNaseDeoxyribonuclease
EDTAEthylenediaminetetraacetic acid
eIFEukaryotic Translation Initiation Factor
EREndoplasmic reticulum
ERADEndoplasmic reticulum—associated degradation
FCSFetal calf serum
FMR1Fragile X Mental Retardation 1
FTLDFronto-temporal lobar degeneration
FUSFused in Sarcoma
FwdForward primer
FXTASFragile-X-tremor-ataxia syndrome
gGram
GCGranule cell
GCLGranule cell layer
GluA3Glutamate Ionotropic Receptor AMPA Type Subunit 3
GluD2Glutamate Ionotropic Receptor Delta Type Subunit 2
GOGene Ontology
Gria3Glutamate Ionotropic Receptor AMPA Type Subunit 3
Grid2Glutamate Ionotropic Receptor Delta Type Subunit 2
Grin1Glutamate Ionotropic Receptor NMDA Type Subunit 1
Grm1Glutamate Metabotropic Receptor 1
Grm4Glutamate Metabotropic Receptor 4
Grp75Glucose-Regulated Protein 75 Kda (Hspa9)
hHour
HClHydrochloric acid
i.e.,id est
IcmtIsoprenylcysteine Carboxyl Methyltransferase
Igfbp5Insulin Like Growth Factor Binding Protein 5
Inpp5aInositol Polyphosphate-5-Phosphatase A
IP3Inositol-1,4,5-trisphosphate
IP3RInositol-1,4,5-Trisphosphate Receptor Type 1
Ire1Inositol-Requiring Protein 1 (Ern1)
ItpkaInositol-Trisphosphate 3-Kinase A
Itpr1Inositol-1,4,5-Trisphosphate Receptor Type 1
K+Potassium ion
kDKilo Dalton
KEGGKyoto Encyclopedia of Genes and Genomes
kgKilogram
Khdrbs1KH RNA Binding Domain Containing, Signal Transduction Associated 1
Khdrbs2KH RNA Binding Domain Containing, Signal Transduction Associated 2
Khdrbs3KH RNA Binding Domain Containing, Signal Transduction Associated 3
KINKnock in
KOKnock out
lLiter
Lgi1Leucine Rich Glioma Inactivated 1
Lgi3Leucine Rich Glioma Inactivated 3
LRRTMLeucine Rich Repeat Transmembrane Protein
LsmLike-Smith antigen protein domain
Lsm-ADLsm-associated domain
MMolar
MAMMitochondria-associated membrane
McuMitochondrial Calcium Uniporter
MEFMouse embryonal fibroblast
Mfn1Mitofusin 1
Mfn2Mitofusin 2
mgMilligram
mGluRGlutamate Metabotropic Receptor
Micu1Mitochondrial Calcium Uptake 1
Micu2Mitochondrial Calcium Uptake 2
Micu3Mitochondrial Calcium Uptake 3
minMinute
miRNAMicro RNA
mlMilliliter
MLMolecular layer
mmMillimeter
mMMillimolar
moMonth
mRNAMessenger RNA
mTORC1Mechanistic Target of Rapamycin Complex 1
nNumber of samples
NANumerical Aperture
NaClSodium chloride
NCXNa+/Ca2+-Exchange Protein (Slc8a2)
ngNanogram
Nlgn1Neuroligin 1
Nlgn2Neuroligin 2
Nlgn3Neuroligin 3
nmNanometer
NMDAN-methyl-d-aspartic acid
NoNumber
NP-40Nonidet P-40 (nonyl phenoxypolyethoxylethanol)
Nrxn1Neurexin 1
Nrxn2Neurexin 2
Nrxn3Neurexin 3
N-terminalAmino (NH2)-terminal end
OPA1Optic Atrophy Protein 1
Orai1ORAI Calcium Release-Activated Calcium Modulator 1
pProbability value
PABPPoly(A)-Binding Protein
PAM2PABP-interacting motif 2
PBSPhosphate buffered saline
PCPurkinje cell
PCLPurkinje cell layer
Pcp2Purkinje Cell Protein 2
Pcp4Purkinje Cell Protein 4 (PEP-19)
PCRPolymerase chain reaction
PDParkison’s disease
PerkPRKR-Like Endoplasmic Reticulum Kinase (Eif2ak3)
PFAParaformaldehyde
PINK1PTEN Induced Kinase 1
PIP2Phosphatidylinositol-4,5-bisphosphate
PKCProtein Kinase C
PLCPhospholipase C
Plcb3Phospholipase C Beta 3
Plcb4Phospholipase C Beta 4
Plcg1Phospholipase C Gamma 1
PMCAPlasma Membrane Ca2+ Pump (Atp2b2)
pmolPicomole
PolyQPoly-Glutamine
PRDProline-rich domain
PrkcdProtein Kinase C Delta
Prmt8Protein Arginine Methyltransferase 8
PSD95Postsynaptic Density Protein 95 (Dlg4)
QGlutamine
RBFOX1RNA Binding Fox-1 Homolog 1
RBPRNA-binding protein
RevReverse primer
Rgs8Regulator of G Protein Signaling 8
RIPARadioimmunoprecipitation assay
RNARibonucleic acid
RNaseRibonuclease
RoraRetinoic Acid Receptor-Related Orphan Receptor Alpha
RTRoom temperature
RTKReceptor Tyrosine Kinase
RT-qPCRReverse-Transcriptase quantitative PCR
Ryr1Ryanodine Receptor 1
Ryr3Ryanodine Receptor 3
secSecond
s.e.m.Standard error of the mean
Sam68Src-Associated In Mitosis 68 KDa Protein (Khdrbs1)
SCA1Spinocerebellar ataxia type 1
SCA2Spinocerebellar ataxia type 2
SDSSodium dodecyl sulfate
Sema7aSemaphorin 7A
SERCA1Sarcoplasmic/Endoplasmic Reticulum Calcium ATPase 1 (Atp2a1)
SERCA2Sarcoplasmic/Endoplasmic Reticulum Calcium ATPase 2 (Atp2a2)
SERCA3Sarcoplasmic/Endoplasmic Reticulum Calcium ATPase 3 (Atp2a3)
SGStress granule
Shank1SH3 And Multiple Ankyrin Repeat Domains 1
Shank2SH3 And Multiple Ankyrin Repeat Domains 2
Sigmar1Sigma Non-Opioid Intracellular Receptor 1
Slc8a2Solute Carrier Family 8 Member A2
Slm1Sam68-Like Mammalian Protein 1 (Khdrbs2)
Slm2Sam68-Like Mammalian Protein 2 (Khdrbs3)
Smdt1Single-Pass Membrane Protein with Aspartate Rich Tail 1
Stim1Stromal Interaction Molecule 1
STRINGSearch Tool for the Retrieval of Interacting Genes/Proteins
TTrend
TbpTATA-binding factor of transcription
TBS-TTris-buffered saline with Tween20
TCATricarboxylic acid cycle
TDP-43TAR DNA-Binding Protein 43 (Tardbp)
TGThapsigargin
TgTransgenic (mouse)
TIA-1T-Cell-Restricted Intracellular Antigen-1
TMTunicamycin
tRNATransfer RNA
Trpc3Transient Receptor Potential Cation Channel Subfamily C Member 3
UniProtUniversal Protein resource
UPRUnfolded protein response
Vdac1Voltage Dependent Anion Channel 1
vs.versus
wkWeek
WTWild type
Xbp1sX-Box Binding Protein 1 spliced
Xbp1uX-Box Binding Protein 1 unspliced

References

  1. Pulst, S.M.; Nechiporuk, A.; Nechiporuk, T.; Gispert, S.; Chen, X.N.; Lopes-Cendes, I.; Pearlman, S.; Starkman, S.; Orozco-Diaz, G.; Lunkes, A.; et al. Moderate expansion of a normally biallelic trinucleotide repeat in spinocerebellar ataxia type 2. Nat. Genet. 1996, 14, 269–276. [Google Scholar] [CrossRef] [PubMed]
  2. Sanpei, K.; Takano, H.; Igarashi, S.; Sato, T.; Oyake, M.; Sasaki, H.; Wakisaka, A.; Tashiro, K.; Ishida, Y.; Ikeuchi, T.; et al. Identification of the spinocerebellar ataxia type 2 gene using a direct identification of repeat expansion and cloning technique, DIRECT. Nat. Genet. 1996, 14, 277–284. [Google Scholar] [CrossRef] [PubMed]
  3. Imbert, G.; Saudou, F.; Yvert, G.; Devys, D.; Trottier, Y.; Garnier, J.M.; Weber, C.; Mandel, J.L.; Cancel, G.; Abbas, N.; et al. Cloning of the gene for spinocerebellar ataxia 2 reveals a locus with high sensitivity to expanded CAG/glutamine repeats. Nat. Genet. 1996, 14, 285–291. [Google Scholar] [CrossRef] [PubMed]
  4. Velázquez-Pérez, L.; Seifried, C.; Santos-Falcón, N.; Abele, M.; Ziemann, U.; Almaguer, L.E.; Martínez-Góngora, E.; Sánchez-Cruz, G.; Canales, N.; Pérez-González, R.; et al. Saccade velocity is controlled by polyglutamine size in spinocerebellar ataxia 2. Ann. Neurol. 2004, 56, 444–447. [Google Scholar] [CrossRef]
  5. Velázquez-Pérez, L.; Rodríguez-Labrada, R.; Canales-Ochoa, N.; Montero, J.M.; Sánchez-Cruz, G.; Aguilera-Rodríguez, R.; Almaguer-Mederos, L.E.; Laffita-Mesa, J.M. Progression of early features of spinocerebellar ataxia type 2 in individuals at risk: A longitudinal study. Lancet Neurol. 2014, 13, 482–489. [Google Scholar] [CrossRef]
  6. Auburger, G.W.J. Spinocerebellar ataxia type 2. Handb. Clin. Neurol. 2012, 103, 423–436. [Google Scholar] [CrossRef] [Green Version]
  7. Velázquez-Pérez, L.; Seifried, C.; Abele, M.; Wirjatijasa, F.; Rodríguez-Labrada, R.; Santos-Falcón, N.; Sánchez-Cruz, G.; Almaguer-Mederos, L.; Tejeda, R.; Canales-Ochoa, N.; et al. Saccade velocity is reduced in presymptomatic spinocerebellar ataxia type 2. Clin. Neurophysiol. 2009, 120, 632–635. [Google Scholar] [CrossRef]
  8. Almaguer-Mederos, L.E.; Aguilera Rodríguez, R.; González Zaldivar, Y.; Almaguer Gotay, D.; Cuello Almarales, D.; Laffita Mesa, J.; Vázquez Mojena, Y.; Zayas Feria, P.; Auburger, G.; Gispert, S.; et al. Estimation of survival in spinocerebellar ataxia type 2 Cuban patients. Clin. Genet. 2013, 83, 293–294. [Google Scholar] [CrossRef]
  9. Elden, A.C.; Kim, H.-J.; Hart, M.P.; Chen-Plotkin, A.S.; Johnson, B.S.; Fang, X.; Armakola, M.; Geser, F.; Greene, R.; Lu, M.M.; et al. Ataxin-2 intermediate-length polyglutamine expansions are associated with increased risk for ALS. Nature 2010, 466, 1069–1075. [Google Scholar] [CrossRef]
  10. Gwinn-Hardy, K.; Chen, J.Y.; Liu, H.C.; Liu, T.Y.; Boss, M.; Seltzer, W.; Adam, A.; Singleton, A.; Koroshetz, W.; Waters, C.; et al. Spinocerebellar ataxia type 2 with parkinsonism in ethnic Chinese. Neurology 2000, 55, 800–805. [Google Scholar] [CrossRef]
  11. Ross, O.A.; Rutherford, N.J.; Baker, M.; Soto-Ortolaza, A.I.; Carrasquillo, M.M.; DeJesus-Hernandez, M.; Adamson, J.; Li, M.; Volkening, K.; Finger, E.; et al. Ataxin-2 repeat-length variation and neurodegeneration. Hum. Mol. Genet. 2011, 20, 3207–3212. [Google Scholar] [CrossRef] [PubMed]
  12. Gispert, S.; Kurz, A.; Waibel, S.; Bauer, P.; Liepelt, I.; Geisen, C.; Gitler, A.D.; Becker, T.; Weber, M.; Berg, D.; et al. The modulation of Amyotrophic Lateral Sclerosis risk by ataxin-2 intermediate polyglutamine expansions is a specific effect. Neurobiol. Dis. 2012, 45, 356–361. [Google Scholar] [CrossRef]
  13. Seidel, K.; Siswanto, S.; Brunt, E.R.P.; den Dunnen, W.; Korf, H.-W.; Rüb, U. Brain pathology of spinocerebellar ataxias. Acta Neuropathol. 2012, 124, 1–21. [Google Scholar] [CrossRef] [PubMed]
  14. Rüb, U.; Del Turco, D.; Del Tredici, K.; de Vos, R.A.I.; Brunt, E.R.; Reifenberger, G.; Seifried, C.; Schultz, C.; Auburger, G.; Braak, H. Thalamic involvement in a spinocerebellar ataxia type 2 (SCA2) and a spinocerebellar ataxia type 3 (SCA3) patient, and its clinical relevance. Brain 2003, 126, 2257–2272. [Google Scholar] [CrossRef] [PubMed] [Green Version]
  15. Rüb, U.; Brunt, E.R.; Petrasch-Parwez, E.; Schöls, L.; Theegarten, D.; Auburger, G.; Seidel, K.; Schultz, C.; Gierga, K.; Paulson, H.; et al. Degeneration of ingestion-related brainstem nuclei in spinocerebellar ataxia type 2, 3, 6 and 7. Neuropathol. Appl. Neurobiol. 2006, 32, 635–649. [Google Scholar] [CrossRef] [PubMed]
  16. Gierga, K.; Bürk, K.; Bauer, M.; Orozco Diaz, G.; Auburger, G.; Schultz, C.; Vuksic, M.; Schöls, L.; de Vos, R.A.I.; Braak, H.; et al. Involvement of the cranial nerves and their nuclei in spinocerebellar ataxia type 2 (SCA2). Acta Neuropathol. 2005, 109, 617–631. [Google Scholar] [CrossRef]
  17. Hoche, F.; Balikó, L.; den Dunnen, W.; Steinecker, K.; Bartos, L.; Sáfrány, E.; Auburger, G.; Deller, T.; Korf, H.-W.; Klockgether, T.; et al. Spinocerebellar ataxia type 2 (SCA2): Identification of early brain degeneration in one monozygous twin in the initial disease stage. Cerebellum 2011, 10, 245–253. [Google Scholar] [CrossRef]
  18. Schöls, L.; Reimold, M.; Seidel, K.; Globas, C.; Brockmann, K.; Hauser, T.K.; Auburger, G.; Bürk, K.; den Dunnen, W.; Reischl, G.; et al. No parkinsonism in SCA2 and SCA3 despite severe neurodegeneration of the dopaminergic substantia nigra. Brain 2015, 138, 3316–3326. [Google Scholar] [CrossRef] [Green Version]
  19. Rüb, U.; Farrag, K.; Seidel, K.; Brunt, E.R.; Heinsen, H.; Bürk, K.; Melegh, B.; von Gall, C.; Auburger, G.; Bohl, J.; et al. Involvement of the cholinergic basal forebrain nuclei in spinocerebellar ataxia type 2 (SCA2). Neuropathol. Appl. Neurobiol. 2013, 39, 634–643. [Google Scholar] [CrossRef]
  20. Tuin, I.; Voss, U.; Kang, J.-S.; Kessler, K.; Rüb, U.; Nolte, D.; Lochmüller, H.; Tinschert, S.; Claus, D.; Krakow, K.; et al. Stages of sleep pathology in spinocerebellar ataxia type 2 (SCA2). Neurology 2006, 67, 1966–1972. [Google Scholar] [CrossRef]
  21. Seidel, K.; Siswanto, S.; Fredrich, M.; Bouzrou, M.; den Dunnen, W.F.A.; Özerden, I.; Korf, H.-W.; Melegh, B.; de Vries, J.J.; Brunt, E.R.; et al. On the distribution of intranuclear and cytoplasmic aggregates in the brainstem of patients with spinocerebellar ataxia type 2 and 3. Brain Pathol. 2017, 27, 345–355. [Google Scholar] [CrossRef] [PubMed]
  22. Damrath, E.; Heck, M.V.; Gispert, S.; Azizov, M.; Nowock, J.; Seifried, C.; Rüb, U.; Walter, M.; Auburger, G. ATXN2-CAG42 sequesters PABPC1 into insolubility and induces FBXW8 in cerebellum of old ataxic knock-in mice. PLoS Genet. 2012, 8, e1002920. [Google Scholar] [CrossRef] [PubMed]
  23. Sen, N.-E.; Canet-Pons, J.; Halbach, M.V.; Arsovic, A.; Pilatus, U.; Chae, W.-H.; Kaya, Z.-E.; Seidel, K.; Rollmann, E.; Mittelbronn, M.; et al. Generation of an Atxn2-CAG100 knock-in mouse reveals N-acetylaspartate production deficit due to early Nat8l dysregulation. Neurobiol. Dis. 2019, 132, 104559. [Google Scholar] [CrossRef]
  24. Velázquez-Pérez, L.; Tünnerhoff, J.; Rodríguez-Labrada, R.; Torres-Vega, R.; Ruiz-Gonzalez, Y.; Belardinelli, P.; Medrano-Montero, J.; Canales-Ochoa, N.; González-Zaldivar, Y.; Vazquez-Mojena, Y.; et al. Early corticospinal tract damage in prodromal SCA2 revealed by EEG-EMG and EMG-EMG coherence. Clin. Neurophysiol. 2017, 128, 2493–2502. [Google Scholar] [CrossRef]
  25. Empson, R.M.; Knöpfel, T. Functional integration of calcium regulatory mechanisms at Purkinje neuron synapses. Cerebellum 2012, 11, 640–650. [Google Scholar] [CrossRef] [PubMed] [Green Version]
  26. Hoxha, E.; Tempia, F.; Lippiello, P.; Miniaci, M.C. Modulation, Plasticity and Pathophysiology of the Parallel Fiber-Purkinje Cell Synapse. Front. Synaptic Neurosci. 2016, 8, 35. [Google Scholar] [CrossRef] [PubMed] [Green Version]
  27. Hoxha, E.; Balbo, I.; Miniaci, M.C.; Tempia, F. Purkinje Cell Signaling Deficits in Animal Models of Ataxia. Front. Synaptic Neurosci. 2018, 10, 6. [Google Scholar] [CrossRef] [Green Version]
  28. Paulson, H.L.; Shakkottai, V.G.; Clark, H.B.; Orr, H.T. Polyglutamine spinocerebellar ataxias—From genes to potential treatments. Nat. Rev. Neurosci. 2017, 18, 613–626. [Google Scholar] [CrossRef]
  29. Estrada, R.; Galarraga, J.; Orozco, G.; Nodarse, A.; Auburger, G. Spinocerebellar ataxia 2 (SCA2): Morphometric analyses in 11 autopsies. Acta Neuropathol. 1999, 97, 306–310. [Google Scholar] [CrossRef]
  30. Pang, J.T.; Giunti, P.; Chamberlain, S.; An, S.F.; Vitaliani, R.; Scaravilli, T.; Martinian, L.; Wood, N.W.; Scaravilli, F.; Ansorge, O. Neuronal intranuclear inclusions in SCA2: A genetic, morphological and immunohistochemical study of two cases. Brain 2002, 125, 656–663. [Google Scholar] [CrossRef]
  31. Nonis, D.; Schmidt, M.H.H.; van de Loo, S.; Eich, F.; Dikic, I.; Nowock, J.; Auburger, G. Ataxin-2 associates with the endocytosis complex and affects EGF receptor trafficking. Cell. Signal. 2008, 20, 1725–1739. [Google Scholar] [CrossRef] [PubMed]
  32. Auburger, G.; Sen, N.-E.; Meierhofer, D.; Başak, A.-N.; Gitler, A.D. Efficient Prevention of Neurodegenerative Diseases by Depletion of Starvation Response Factor Ataxin-2. Trends Neurosci. 2017, 40, 507–516. [Google Scholar] [CrossRef] [PubMed] [Green Version]
  33. van de Loo, S.; Eich, F.; Nonis, D.; Auburger, G.; Nowock, J. Ataxin-2 associates with rough endoplasmic reticulum. Exp. Neurol. 2009, 215, 110–118. [Google Scholar] [CrossRef]
  34. Lastres-Becker, I.; Nonis, D.; Eich, F.; Klinkenberg, M.; Gorospe, M.; Kötter, P.; Klein, F.A.C.; Kedersha, N.; Auburger, G. Mammalian ataxin-2 modulates translation control at the pre-initiation complex via PI3K/mTOR and is induced by starvation. Biochim. Biophys. Acta 2016, 1862, 1558–1569. [Google Scholar] [CrossRef] [PubMed]
  35. Drost, J.; Nonis, D.; Eich, F.; Leske, O.; Damrath, E.; Brunt, E.R.; Lastres-Becker, I.; Heumann, R.; Nowock, J.; Auburger, G. Ataxin-2 modulates the levels of Grb2 and SRC but not ras signaling. J. Mol. Neurosci. 2013, 51, 68–81. [Google Scholar] [CrossRef] [PubMed] [Green Version]
  36. Seidel, G.; Meierhofer, D.; Şen, N.-E.; Guenther, A.; Krobitsch, S.; Auburger, G. Quantitative Global Proteomics of Yeast PBP1 Deletion Mutants and Their Stress Responses Identifies Glucose Metabolism, Mitochondrial, and Stress Granule Changes. J. Proteome Res. 2017, 16, 504–515. [Google Scholar] [CrossRef]
  37. Fittschen, M.; Lastres-Becker, I.; Halbach, M.V.; Damrath, E.; Gispert, S.; Azizov, M.; Walter, M.; Müller, S.; Auburger, G. Genetic ablation of ataxin-2 increases several global translation factors in their transcript abundance but decreases translation rate. Neurogenetics 2015, 16, 181–192. [Google Scholar] [CrossRef] [Green Version]
  38. Ralser, M.; Albrecht, M.; Nonhoff, U.; Lengauer, T.; Lehrach, H.; Krobitsch, S. An integrative approach to gain insights into the cellular function of human ataxin-2. J. Mol. Biol. 2005, 346, 203–214. [Google Scholar] [CrossRef]
  39. Nonhoff, U.; Ralser, M.; Welzel, F.; Piccini, I.; Balzereit, D.; Yaspo, M.-L.; Lehrach, H.; Krobitsch, S. Ataxin-2 interacts with the DEAD/H-box RNA helicase DDX6 and interferes with P-bodies and stress granules. Mol. Biol. Cell 2007, 18, 1385–1396. [Google Scholar] [CrossRef]
  40. Hart, M.P.; Brettschneider, J.; Lee, V.M.Y.; Trojanowski, J.Q.; Gitler, A.D. Distinct TDP-43 pathology in ALS patients with ataxin 2 intermediate-length polyQ expansions. Acta Neuropathol. 2012, 124, 221–230. [Google Scholar] [CrossRef] [Green Version]
  41. Hart, M.P.; Gitler, A.D. ALS-associated ataxin 2 polyQ expansions enhance stress-induced caspase 3 activation and increase TDP-43 pathological modifications. J. Neurosci. 2012, 32, 9133–9142. [Google Scholar] [CrossRef] [Green Version]
  42. McGurk, L.; Lee, V.M.; Trojanowksi, J.Q.; van Deerlin, V.M.; Lee, E.B.; Bonini, N.M. Poly-A binding protein-1 localization to a subset of TDP-43 inclusions in amyotrophic lateral sclerosis occurs more frequently in patients harboring an expansion in C9orf72. J. Neuropathol. Exp. Neurol. 2014, 73, 837–845. [Google Scholar] [CrossRef] [PubMed] [Green Version]
  43. Hirsch-Reinshagen, V.; Pottier, C.; Nicholson, A.M.; Baker, M.; Hsiung, G.-Y.R.; Krieger, C.; Sengdy, P.; Boylan, K.B.; Dickson, D.W.; Mesulam, M.; et al. Clinical and neuropathological features of ALS/FTD with TIA1 mutations. Acta Neuropathol. Commun. 2017, 5, 96. [Google Scholar] [CrossRef] [Green Version]
  44. Hansen, M.; Zeddies, S.; Meinders, M.; Di Summa, F.; van Alphen, F.P.J.; Hoogendijk, A.J.; Moore, K.S.; Halbach, M.; Gutiérrez, L.; van den Biggelaar, M.; et al. The RNA-Binding Protein ATXN2 is Expressed during Megakaryopoiesis and May Control Timing of Gene Expression. Int. J. Mol. Sci. 2020, 21, 967. [Google Scholar] [CrossRef] [PubMed] [Green Version]
  45. Sen, N.E.; Drost, J.; Gispert, S.; Torres-Odio, S.; Damrath, E.; Klinkenberg, M.; Hamzeiy, H.; Akdal, G.; Güllüoğlu, H.; Başak, A.N.; et al. Search for SCA2 blood RNA biomarkers highlights Ataxin-2 as strong modifier of the mitochondrial factor PINK1 levels. Neurobiol. Dis. 2016, 96, 115–126. [Google Scholar] [CrossRef] [PubMed]
  46. Sen, N.-E.; Arsovic, A.; Meierhofer, D.; Brodesser, S.; Oberschmidt, C.; Canet-Pons, J.; Kaya, Z.-E.; Halbach, M.-V.; Gispert, S.; Sandhoff, K.; et al. In Human and Mouse Spino-Cerebellar Tissue, Ataxin-2 Expansion Affects Ceramide-Sphingomyelin Metabolism. Int. J. Mol. Sci. 2019, 20, 5854. [Google Scholar] [CrossRef] [PubMed] [Green Version]
  47. Meierhofer, D.; Halbach, M.; Şen, N.E.; Gispert, S.; Auburger, G. Ataxin-2 (Atxn2)-Knock-Out Mice Show Branched Chain Amino Acids and Fatty Acids Pathway Alterations. Mol. Cell. Proteom. 2016, 15, 1728–1739. [Google Scholar] [CrossRef] [Green Version]
  48. Lastres-Becker, I.; Brodesser, S.; Lütjohann, D.; Azizov, M.; Buchmann, J.; Hintermann, E.; Sandhoff, K.; Schürmann, A.; Nowock, J.; Auburger, G. Insulin receptor and lipid metabolism pathology in ataxin-2 knock-out mice. Hum. Mol. Genet. 2008, 17, 1465–1481. [Google Scholar] [CrossRef] [Green Version]
  49. Takahara, T.; Maeda, T. Transient sequestration of TORC1 into stress granules during heat stress. Mol. Cell 2012, 47, 242–252. [Google Scholar] [CrossRef] [Green Version]
  50. DeMille, D.; Badal, B.D.; Evans, J.B.; Mathis, A.D.; Anderson, J.F.; Grose, J.H. PAS kinase is activated by direct SNF1-dependent phosphorylation and mediates inhibition of TORC1 through the phosphorylation and activation of Pbp1. Mol. Biol. Cell 2015, 26, 569–582. [Google Scholar] [CrossRef]
  51. Scoles, D.R.; Dansithong, W.; Pflieger, L.T.; Paul, S.; Gandelman, M.; Figueroa, K.P.; Rigo, F.; Bennett, C.F.; Pulst, S.M. ALS-associated genes in SCA2 mouse spinal cord transcriptomes. Hum. Mol. Genet. 2020, 29, 1658–1672. [Google Scholar] [CrossRef] [PubMed] [Green Version]
  52. Canet-Pons, J.; Sen, N.-E.; Arsovic, A.; Almaguer-Mederos, L.-E.; Halbach, M.V.; Key, J.; Döring, C.; Kerksiek, A.; Picchiarelli, G.; Cassel, R.; et al. Atxn2-CAG100-KnockIn Mouse Spinal Cord Shows Progressive TDP43 Pathology Associated with Cholesterol Biosynthesis Suppression. bioRxiv 2019. [Google Scholar] [CrossRef] [Green Version]
  53. Key, J.; Harter, P.N.; Sen, N.-E.; Gradhand, E.; Auburger, G.; Gispert, S. Mid-Gestation lethality of Atxn2l-Ablated Mice. Int. J. Mol. Sci. 2020, 21, 5124. [Google Scholar] [CrossRef]
  54. Wang, X.; Chen, X.J. A cytosolic network suppressing mitochondria-mediated proteostatic stress and cell death. Nature 2015, 524, 481–484. [Google Scholar] [CrossRef] [Green Version]
  55. Becker, L.A.; Huang, B.; Bieri, G.; Ma, R.; Knowles, D.A.; Jafar-Nejad, P.; Messing, J.; Kim, H.J.; Soriano, A.; Auburger, G.; et al. Therapeutic reduction of ataxin-2 extends lifespan and reduces pathology in TDP-43 mice. Nature 2017, 544, 367–371. [Google Scholar] [CrossRef] [Green Version]
  56. Scoles, D.R.; Meera, P.; Schneider, M.D.; Paul, S.; Dansithong, W.; Figueroa, K.P.; Hung, G.; Rigo, F.; Bennett, C.F.; Otis, T.S.; et al. Antisense oligonucleotide therapy for spinocerebellar ataxia type 2. Nature 2017, 544, 362–366. [Google Scholar] [CrossRef] [PubMed]
  57. Torres-Odio, S.; Key, J.; Hoepken, H.-H.; Canet-Pons, J.; Valek, L.; Roller, B.; Walter, M.; Morales-Gordo, B.; Meierhofer, D.; Harter, P.N.; et al. Progression of pathology in PINK1-deficient mouse brain from splicing via ubiquitination, ER stress, and mitophagy changes to neuroinflammation. J. Neuroinflamm. 2017, 14, 154. [Google Scholar] [CrossRef] [Green Version]
  58. Prestori, F.; Moccia, F.; D’Angelo, E. Disrupted Calcium Signaling in Animal Models of Human Spinocerebellar Ataxia (SCA). Int. J. Mol. Sci. 2019, 21, 216. [Google Scholar] [CrossRef] [Green Version]
  59. Halbach, M.V.; Gispert, S.; Stehning, T.; Damrath, E.; Walter, M.; Auburger, G. Atxn2 Knockout and CAG42-Knock-in Cerebellum Shows Similarly Dysregulated Expression in Calcium Homeostasis Pathway. Cerebellum 2017, 16, 68–81. [Google Scholar] [CrossRef] [Green Version]
  60. Pflieger, L.T.; Dansithong, W.; Paul, S.; Scoles, D.R.; Figueroa, K.P.; Meera, P.; Otis, T.S.; Facelli, J.C.; Pulst, S.M. Gene co-expression network analysis for identifying modules and functionally enriched pathways in SCA2. Hum. Mol. Genet. 2017, 26, 3069–3080. [Google Scholar] [CrossRef]
  61. Krebs, J.; Agellon, L.B.; Michalak, M. Ca(2+) homeostasis and endoplasmic reticulum (ER) stress: An integrated view of calcium signaling. Biochem. Biophys. Res. Commun. 2015, 460, 114–121. [Google Scholar] [CrossRef] [PubMed]
  62. Swulius, M.T.; Waxham, M.N. Ca(2+)/calmodulin-dependent protein kinases. Cell. Mol. Life Sci. 2008, 65, 2637–2657. [Google Scholar] [CrossRef] [Green Version]
  63. Becker, E.B.E. From Mice to Men: TRPC3 in Cerebellar Ataxia. Cerebellum 2017, 16, 877–879. [Google Scholar] [CrossRef] [PubMed]
  64. Yang, A.W.; Sachs, A.J.; Nystuen, A.M. Deletion of Inpp5a causes ataxia and cerebellar degeneration in mice. Neurogenetics 2015, 16, 277–285. [Google Scholar] [CrossRef] [PubMed]
  65. Windhorst, S.; Song, K.; Gazdar, A.F. Inositol-1,4,5-trisphosphate 3-kinase-A (ITPKA) is frequently over-expressed and functions as an oncogene in several tumor types. Biochem. Pharmacol. 2017, 137, 1–9. [Google Scholar] [CrossRef] [PubMed] [Green Version]
  66. Wei, P.; Blundon, J.A.; Rong, Y.; Zakharenko, S.S.; Morgan, J.I. Impaired locomotor learning and altered cerebellar synaptic plasticity in pep-19/PCP4-null mice. Mol. Cell. Biol. 2011, 31, 2838–2844. [Google Scholar] [CrossRef] [PubMed] [Green Version]
  67. Iijima, T.; Wu, K.; Witte, H.; Hanno-Iijima, Y.; Glatter, T.; Richard, S.; Scheiffele, P. SAM68 regulates neuronal activity-dependent alternative splicing of neurexin-1. Cell 2011, 147, 1601–1614. [Google Scholar] [CrossRef] [PubMed] [Green Version]
  68. Südhof, T.C. Synaptic Neurexin Complexes: A Molecular Code for the Logic of Neural Circuits. Cell 2017, 171, 745–769. [Google Scholar] [CrossRef] [PubMed] [Green Version]
  69. Farg, M.A.; Soo, K.Y.; Warraich, S.T.; Sundaramoorthy, V.; Blair, I.P.; Atkin, J.D. Ataxin-2 interacts with FUS and intermediate-length polyglutamine expansions enhance FUS-related pathology in amyotrophic lateral sclerosis. Hum. Mol. Genet. 2013, 22, 717–728. [Google Scholar] [CrossRef] [PubMed] [Green Version]
  70. Treutlein, B.; Gokce, O.; Quake, S.R.; Südhof, T.C. Cartography of neurexin alternative splicing mapped by single-molecule long-read mRNA sequencing. Proc. Natl. Acad. Sci. USA 2014, 111, E1291–E1299. [Google Scholar] [CrossRef] [Green Version]
  71. Iijima, T.; Hidaka, C.; Iijima, Y. Spatio-temporal regulations and functions of neuronal alternative RNA splicing in developing and adult brains. Neurosci. Res. 2016, 109, 1–8. [Google Scholar] [CrossRef] [PubMed]
  72. Iijima, T.; Iijima, Y.; Witte, H.; Scheiffele, P. Neuronal cell type-specific alternative splicing is regulated by the KH domain protein SLM1. J. Cell Biol. 2014, 204, 331–342. [Google Scholar] [CrossRef] [PubMed] [Green Version]
  73. Sato, Y.; Suzuki, S.; Iijima, Y.; Iijima, T. Neuroligin-induced presynaptic differentiation through SLM2-mediated splicing modifications of neurexin in cerebellar cultures. Biochem. Biophys. Res. Commun. 2017, 493, 1030–1036. [Google Scholar] [CrossRef] [PubMed]
  74. Sugita, S.; Saito, F.; Tang, J.; Satz, J.; Campbell, K.; Südhof, T.C. A stoichiometric complex of neurexins and dystroglycan in brain. J. Cell Biol. 2001, 154, 435–445. [Google Scholar] [CrossRef] [Green Version]
  75. Reissner, C.; Stahn, J.; Breuer, D.; Klose, M.; Pohlentz, G.; Mormann, M.; Missler, M. Dystroglycan binding to α-neurexin competes with neurexophilin-1 and neuroligin in the brain. J. Biol. Chem. 2014, 289, 27585–27603. [Google Scholar] [CrossRef] [Green Version]
  76. Fukata, Y.; Lovero, K.L.; Iwanaga, T.; Watanabe, A.; Yokoi, N.; Tabuchi, K.; Shigemoto, R.; Nicoll, R.A.; Fukata, M. Disruption of LGI1-linked synaptic complex causes abnormal synaptic transmission and epilepsy. Proc. Natl. Acad. Sci. USA 2010, 107, 3799–3804. [Google Scholar] [CrossRef] [Green Version]
  77. Zhang, P.; Lisman, J.E. Activity-dependent regulation of synaptic strength by PSD-95 in CA1 neurons. J. Neurophysiol. 2012, 107, 1058–1066. [Google Scholar] [CrossRef] [Green Version]
  78. Huynh, D.P.; Figueroa, K.; Hoang, N.; Pulst, S.M. Nuclear localization or inclusion body formation of ataxin-2 are not necessary for SCA2 pathogenesis in mouse or human. Nat. Genet. 2000, 26, 44–50. [Google Scholar] [CrossRef]
  79. Liu, J.; Tang, T.-S.; Tu, H.; Nelson, O.; Herndon, E.; Huynh, D.P.; Pulst, S.M.; Bezprozvanny, I. Deranged calcium signaling and neurodegeneration in spinocerebellar ataxia type 2. J. Neurosci. 2009, 29, 9148–9162. [Google Scholar] [CrossRef]
  80. Wan, C.; Borgeson, B.; Phanse, S.; Tu, F.; Drew, K.; Clark, G.; Xiong, X.; Kagan, O.; Kwan, J.; Bezginov, A.; et al. Panorama of ancient metazoan macromolecular complexes. Nature 2015, 525, 339–344. [Google Scholar] [CrossRef] [Green Version]
  81. Sellier, C.; Rau, F.; Liu, Y.; Tassone, F.; Hukema, R.K.; Gattoni, R.; Schneider, A.; Richard, S.; Willemsen, R.; Elliott, D.J.; et al. Sam68 sequestration and partial loss of function are associated with splicing alterations in FXTAS patients. EMBO J. 2010, 29, 1248–1261. [Google Scholar] [CrossRef] [PubMed] [Green Version]
  82. Klein, M.E.; Younts, T.J.; Castillo, P.E.; Jordan, B.A. RNA-binding protein Sam68 controls synapse number and local β-actin mRNA metabolism in dendrites. Proc. Natl. Acad. Sci. USA 2013, 110, 3125–3130. [Google Scholar] [CrossRef] [PubMed] [Green Version]
  83. Sudhakaran, I.P.; Hillebrand, J.; Dervan, A.; Das, S.; Holohan, E.E.; Hülsmeier, J.; Sarov, M.; Parker, R.; VijayRaghavan, K.; Ramaswami, M. FMRP and Ataxin-2 function together in long-term olfactory habituation and neuronal translational control. Proc. Natl. Acad. Sci. USA 2014, 111, E99–E108. [Google Scholar] [CrossRef] [PubMed] [Green Version]
  84. Herring, B.E.; Nicoll, R.A. Long-Term Potentiation: From CaMKII to AMPA Receptor Trafficking. Annu. Rev. Physiol. 2016, 78, 351–365. [Google Scholar] [CrossRef]
  85. Bayer, K.U.; Schulman, H. CaM Kinase: Still Inspiring at 40. Neuron 2019, 103, 380–394. [Google Scholar] [CrossRef]
  86. Borovac, J.; Bosch, M.; Okamoto, K. Regulation of actin dynamics during structural plasticity of dendritic spines: Signaling messengers and actin-binding proteins. Mol. Cell. Neurosci. 2018, 91, 122–130. [Google Scholar] [CrossRef]
  87. Zalcman, G.; Federman, N.; Romano, A. CaMKII Isoforms in Learning and Memory: Localization and Function. Front. Mol. Neurosci. 2018, 11, 445. [Google Scholar] [CrossRef]
  88. Ibata, K.; Kono, M.; Narumi, S.; Motohashi, J.; Kakegawa, W.; Kohda, K.; Yuzaki, M. Activity-Dependent Secretion of Synaptic Organizer Cbln1 from Lysosomes in Granule Cell Axons. Neuron 2019, 102, 1184–1198.e10. [Google Scholar] [CrossRef]
  89. Zhang, B.; Chen, L.Y.; Liu, X.; Maxeiner, S.; Lee, S.-J.; Gokce, O.; Südhof, T.C. Neuroligins Sculpt Cerebellar Purkinje-Cell Circuits by Differential Control of Distinct Classes of Synapses. Neuron 2015, 87, 781–796. [Google Scholar] [CrossRef] [Green Version]
  90. Hansen, S.T.; Meera, P.; Otis, T.S.; Pulst, S.M. Changes in Purkinje cell firing and gene expression precede behavioral pathology in a mouse model of SCA2. Hum. Mol. Genet. 2013, 22, 271–283. [Google Scholar] [CrossRef] [Green Version]
  91. Kasumu, A.W.; Liang, X.; Egorova, P.; Vorontsova, D.; Bezprozvanny, I. Chronic suppression of inositol 1,4,5-triphosphate receptor-mediated calcium signaling in cerebellar Purkinje cells alleviates pathological phenotype in spinocerebellar ataxia 2 mice. J. Neurosci. 2012, 32, 12786–12796. [Google Scholar] [CrossRef] [PubMed] [Green Version]
  92. Koch, P.; Breuer, P.; Peitz, M.; Jungverdorben, J.; Kesavan, J.; Poppe, D.; Doerr, J.; Ladewig, J.; Mertens, J.; Tüting, T.; et al. Excitation-induced ataxin-3 aggregation in neurons from patients with Machado-Joseph disease. Nature 2011, 480, 543–546. [Google Scholar] [CrossRef] [PubMed]
  93. Al-Ramahi, I.; Am, P.; Lim, J.; Zhang, M.; Sorensen, R.; de Haro, M.; Branco, J.; Pulst, S.M.; Zoghbi, H.Y.; Botas, J. dAtaxin-2 mediates expanded Ataxin-1-induced neurodegeneration in a Drosophila model of SCA1. PLoS Genet. 2007, 3, e234. [Google Scholar] [CrossRef] [PubMed] [Green Version]
  94. Shulman, J.M.; Feany, M.B. Genetic modifiers of tauopathy in Drosophila. Genetics 2003, 165, 1233–1242. [Google Scholar] [PubMed]
  95. McCann, C.; Holohan, E.E.; Das, S.; Dervan, A.; Larkin, A.; Lee, J.A.; Rodrigues, V.; Parker, R.; Ramaswami, M. The Ataxin-2 protein is required for microRNA function and synapse-specific long-term olfactory habituation. Proc. Natl. Acad. Sci. USA 2011, 108, E655–E662. [Google Scholar] [CrossRef] [Green Version]
  96. Rais, M.; Binder, D.K.; Razak, K.A.; Ethell, I.M. Sensory Processing Phenotypes in Fragile X Syndrome. ASN Neuro 2018, 10, 1759091418801092. [Google Scholar] [CrossRef] [Green Version]
  97. Twick, I.; Lee, J.A.; Ramaswami, M. Olfactory habituation in Drosophila-odor encoding and its plasticity in the antennal lobe. Prog. Brain Res. 2014, 208, 3–38. [Google Scholar] [CrossRef] [PubMed]
  98. Livak, K.J.; Schmittgen, T.D. Analysis of relative gene expression data using real-time quantitative PCR and the 2(-Delta Delta C(T)) Method. Methods 2001, 25, 402–408. [Google Scholar] [CrossRef]
  99. Nguyen, T.-M.; Schreiner, D.; Le, X.; Traunmüller, L.; Bornmann, C.; Scheiffele, P. An alternative splicing switch shapes neurexin repertoires in principal neurons versus interneurons in the mouse hippocampus. Elife 2016, 5, e22757. [Google Scholar] [CrossRef]
  100. Czechowska, N.; van Rienen, A.; Lang, F.; Eiberger, B.; Baader, S.L. An update on the Golgi staining technique improving cerebellar cell type specificity. Histochem. Cell Biol. 2019, 151, 327–341. [Google Scholar] [CrossRef]
  101. Forster, B.; van de Ville, D.; Berent, J.; Sage, D.; Unser, M. Complex wavelets for extended depth-of-field: A new method for the fusion of multichannel microscopy images. Microsc. Res. Tech. 2004, 65, 33–42. [Google Scholar] [CrossRef] [PubMed] [Green Version]
Figure 1. Global transcriptome profile of Atxn2-CAG100-KIN mouse cerebellum at pre-onset stage. (A) Volcano plot analysis of all the quantified mRNAs showing significant up- or downregulations beyond 20% fold-change in red and green, respectively. Highly significant and cerebellar pathology-relevant transcripts among downregulations are colored in magenta. Transcriptome analysis was performed with Affymetrix Clariom D oligonucleotide microarray technology, comparing 3 Atxn2-CAG100-KIN cerebellum samples with 3 age- and sex-matched WT controls. Statistical assessment of the expression data was done using the Affymetrix Transcriptome Analysis Console; (B) Representative diagrams depicting the numbers of all mRNA transcripts measured (20,299), versus those that are dysregulated more than 35%, regardless of statistical significance (253 down, 147 up), with the number of significant alterations among all (2162), and the numbers of nominally significant (p < 0.05) dysregulations in either direction more than 35% (209 down, 94 up); (C) Protein interaction network of the significantly downregulated transcripts (<−1.35 fold) generated with STRING database (https://string-db.org/) revealed a core network with two central nodes of Itpr1 and Camk2a. Many factors in the network contributed to significantly altered pathways and cellular processes identified by Functional Enrichment Analysis function of STRING, and are highlighted in different colors corresponding to the colored bars in the subsequent panel D; (D) Functional Enrichment Analysis results of STRING utilizing GO terms Biological Process, KEGG Pathways, Reactome Pathways, UniProt Keywords and GO terms Molecular Function. Top ten dysregulated pathways and cellular processes are depicted per database for clarity, and complete lists are available in Supplementary Table S2. Colored bars represent pathways corresponding to similarly colored proteins in panel C.
Ijms 21 06673 g001
Figure 2. Expression analyses of Ca2+ channels, transporters and associated factors in Atxn2-CAG100-KIN cerebellum throughout the disease course. (A) Transcript levels of various plasma membrane and ER resident Ca2+-associated factors in Atxn2-KO (blue bars) and Atxn2-CAG100-KIN versus WT mouse cerebellum at pre-onset stage of 3 mo (pink bars) and terminal stage of 14 mo (red bars) were measured by RT-qPCR; (B) Protein levels of ER resident Ca2+ channel ITPR1 and transporter ATP2A2 in soluble/cytosolic (RIPA) and insoluble/membrane-associated (SDS) protein fractions of Atxn2-CAG100-KIN mouse cerebellum at pre-onset and final disease stages were determined by quantitative immunoblots. Student’s t-test with Welch’s correction; 0.05 < p < 0.1 T, p < 0.05 *, p < 0.01 **, p < 0.001 ***. Further information regarding individual fold changes and p-values can be found in Supplementary Table S3.
Ijms 21 06673 g002
Figure 3. The effect of subcellular Ca2+ imbalance on ATXN2 localization and expression in mouse embryonal fibroblasts. (A) Immunocytochemical assessment of ATXN2 and SG marker PABP in WT and Atxn2-KO MEFs under thapsigargin-(TG, 5 μM, 6 h) or tunicamycin-induced (TM, 10 μg/mL, 6 h) ER stress. ATXN2 relocalization into PABP-positive SGs was observed, solely upon cytosolic Ca2+ imbalance driven by TG, but not upon blockage of N-glycosylation by TM. Atxn2-KO MEFs did not show a difference in SG formation upon TG treatment. (B) Transcriptional regulation of Atxn2 and ER stress markers under TG treatment, in a time- and dosage-dependent setup. Three different clones of WT and Atxn2-KO MEF pairs were treated simultaneously with 1 μM or 5 μM TG for 1 h or 6 h. Stress response was already visible at 1 h for both TG dosages, and further increased at 6 h. While Atxn2 showed a significant downregulation under TG treatment, ER stress markers Bip, Chop and Xbp1s showed a suppressed induction in the absence of ATXN2 in KO cells (blue bars). Expression data obtained by RT-qPCR; (C) Colorimetric Ca2+ concentration measurement in cytosolic and organelle-enriched fractions of WT and Atxn2-CAG100-KIN cerebellum at three mo of age. Higher Ca2+ concentrations were observed in the membrane-encapsulated organelle fraction with no difference between WT and KIN animals. Statistical assessment of the cell culture data was done using 2-way ANOVA with multiple testing corrections. Statistical assessment of the cerebellar Ca2+ measurement was done using Student’s t-test with Welch’s correction; p < 0.05 *, p < 0.01 **, p < 0.001 ***, p < 0.0001 ****. Hashtag (#) indicates comparison of KO cells with untreated KO cells, with p < 0.05 #, p < 0.001 ###, p < 0.0001 ####. Further information regarding individual fold changes and p-values can be found in Supplementary Table S3.
Ijms 21 06673 g003
Figure 4. Expression analyses of Ca2+ associated subcellular signaling pathways in Atxn2-CAG100-KIN cerebellum throughout disease course. (A) Transcript levels of cytoplasmic IP3 metabolism components (Gria3, Grm1, Grm4, Plcb3, Plcb4, Plcg1, Inpp5a, Itpka, Prkcd), Ca2+-CaM signaling components (Pcp4, Camkk1, Camkk2, Camk2a, Camk2b, Camk2d, Camk2g, Camk4) and downstream CaMKIV targets (Khdrbs1-3) were quantified by RT-qPCR in Atxn2-KO (blue bars) and Atxn2-CAG100-KIN mouse cerebellum at pre-onset (pink bars) and terminal (red bars) disease stages; (B) Protein levels of GluA3, CaMKIIα, CaMKIV and Sam68 in soluble (RIPA) and insoluble (SDS) fractions of Atxn2-CAG100-KIN mouse cerebellum at pre-onset and final disease stages were determined by quantitative immunoblots. Student’s t-test with Welch’s correction; 0.05 < p < 0.1 T, p < 0.05 *, p < 0.01 **, p < 0.001 ***, p < 0.0001 ****. Further information regarding individual fold changes and p-values can be found in Supplementary Table S3.
Ijms 21 06673 g004
Figure 5. Expression analyses of Nrxn1-3 transcripts and alternative splicing isoforms of Nrxn1 in Atxn2-CAG100-KIN cerebellum at 14 mo. (A) Schematic representation of Nrxn1 structure showing six alternative splice (AS) sites. Constitutive exons are depicted in beige and alternatively spliced exons are in red. The transcript structure and spatial distribution of the AS sites were adapted from Treutlein et al. 2014 [70]; (B) Transcript levels of spliced (−) or unspliced (+) variants of Nrxn1 at AS1-6 show altered splicing in Atxn2-CAG100-KIN cerebellum at 14 mo. Site-specific primers were designed to selectively amplify exon inclusion or excision at a given AS site by RT-qPCR. At AS1 site, only AS1(−) isoform lacking all intermediate exons could be quantified with this method, due to the structural complexity of the region and impossibility of proper primer design for all splice variants; (C) Splicing activity ratio at AS2-6 sites of Nrxn1 reveal the missplicing of AS2 and AS3 sites in Atxn2-CAG100-KIN cerebellum at 14 mo. The ratio between spliced (−) to unspliced (+) variants shown in panel B was calculated for each AS site to assess splicing activity at each site. Significantly decreased activity at AS2, and significantly increased splicing at AS3 was observed; (D) Total levels of Nrxn1-3 transcripts measured by RT-qPCR amplifying constitutive exons showed no dysregulation in Atxn2-CAG100-KIN cerebellum at the terminal disease stage. Student’s t-test with Welch’s correction; p < 0.05 *, p < 0.01 **, p < 0.001 ***. Further information regarding individual fold changes and p-values can be found in Supplementary Table S3.
Ijms 21 06673 g005
Figure 6. Golgi impregnation of Purkinje cells in WT and Atxn2-CAG100-KIN cerebella at pre-terminal age of 9 mo. (A) Representative images of Purkinje neurons of both genotypes in low and high magnifications. Scale bars indicate 20 µm (upper row) and 10 µm (lower row); in order to be able to appreciate differences in spine length and spine density, an inlet was added showing a dendritic segment at higher magnification. This image is a digital zoom-in at a factor of 2. It can be clearly seen that the density is much less in KIN mice, while the spine length is a little smaller. (B) Significant reductions of spine number and length were observed in Atxn2-CAG100-KIN Purkinje dendrites compared to WT (n = 13 WT vs. 14 KIN Purkinje cells, from 4 WT vs. 3 KIN animals). Levene’s test was used for evaluating equal data distribution, and ANOVA equals t-test was used to compare WT vs. KIN cells; p < 0.01 **, p < 0.001 ***. Further information regarding individual fold changes and p-values can be found in Supplementary Table S3.
Ijms 21 06673 g006
Figure 7. Expression analyses of synaptic structure, transmission and dendrite morphology factors. In Atxn2-CAG100-KIN cerebellum throughout disease course at 3 mo and 14 mo of age and in Atxn2-KO cerebellum, transcript levels of Cerebellin isoforms (Cbln1-4), ionotrophic glutamate receptor δ2 (Grid2) and Neuroligin isoforms (Nlgn1-3) were examined as extracellular and postsynaptic interactors of Neurexins in maintaining synaptic integrity. The structural bridge of glutamatergic synapses consisting of Adam22, Adam23, Lgi1 and Lgi3, together with ionotrophic glutamate receptor NMDA type 1 (Grin1) involved in synaptic transmission, post-synaptic density markers PSD95 (Dlg4) and Shank isoforms (Shank1-2) were also quantified throughout disease course by RT-qPCR. Student’s t-test with Welch’s correction; 0.05 < p < 0.1 T, p < 0.05 *, p < 0.01 **, p < 0.001 ***, p < 0.0001 ****. Further information regarding individual fold changes and p-values can be found in Supplementary Table S3.
Ijms 21 06673 g007
Figure 8. Schematic representation of the Ca2+ associated signaling cascades and synaptic integrity components investigated in the framework of this project. Bottom panel corresponds to red inset in the top panel. Neurexin structure and preferential interactions were adapted from Südhof T.C. 2017 [68].
Ijms 21 06673 g008
Table 1. List of TaqMan® Assays utilized in this study.
TranscriptAssay IDTranscriptAssay IDTranscriptAssay ID
Adam22Mm01316488_m1Ern1(Ire1)Mm00470233_m1Nrxn1Mm03011136_m1
Adam23Mm00478606_m1Gria3Mm00497506_m1Nrxn2Mm01236851_m1
Atf4Mm00515324_m1Grid2Mm00515053_m1Nrxn3Mm00553213_m1
Atf6Mm01295319_m1Grm1Mm00810219_m1Orai1Mm00774349_m1
Atp2a1Mm01275320_m1Grm4Mm01306128_m1Pcp4Mm00500973_m1
Atp2a2Mm01201431_m1Hspa5(Bip)Mm00517691_m1Plcb3Mm00476953_m1
Atp2a3Mm00443898_m1Hspa9(Grp75)Mm00477716_g1Plcb4Mm00649825_m1
Atp2b2Mm00437640_m1Inpp5aMm00805812_m1Plcg1Mm01247293_m1
Atxn2Mm01199894_m1ItpkaMm00525139_m1PrkcdMm00440891_m1
Cacna1aMm00432190_m1Itpr1Mm00439907_m1Ryr1Mm01175211_m1
Camk2aMm00437967_m1Khdrbs1Mm00516130_m1Ryr3Mm01328421_m1
Camk2bMm00432284_m1Khdrbs2Mm00504671_m1Shank1Mm01206737_m1
Camk2dMm00499266_m1Khdrbs3Mm00501666_m1Shank2Mm00683065_m1
Camk2gMm00618047_m1Lgi1Mm01198941_m1Sigmar1Mm00448086_m1
Camk4Mm01135329_m1Lgi3Mm00507490_m1Slc8a2Mm00455836_m1
Camkk1Mm00517053_m1McuMm01168773_m1Smdt1Mm01306306_m1
Camkk2Mm00520236_m1Mfn1Mm00612599_m1Stim1Mm01158413_m1
Cbln1Mm01247194_g1Mfn2Mm00500120_m1TbpMm00446973_m1
Cbln2Mm01261557_g1Micu1Mm00522783_m1Trpc3Mm00444690-m1
Cbln3Mm00490772_g1Micu2Mm00551312_m1Vdac1Mm00834272_m1
Cbln4Mm00558663_m1Micu3Mm01194824_m1Xbp1sMm03464496_m1
Ddit3(Chop)Mm00499207_m1Nlgn1Mm02344307_m1Xbp1uMm03464497_s1
Dlg4(Psd-95)Mm00492193_m1Nlgn2Mm01703404_m1
Eif2ak3(Perk)Mm00438708_m1Nlgn3Mm01225951_m1
Table 2. List of mouse-specific SYBR® Green primers utilized in this study.
Primer NameSequence (5′ → 3′)Reference
AS1 − FwdACTGCAGCCAAGGAAAAGAAGAGTA
AS1 − RevGTTTTAAAGGACAGAGTTATTTCAT
AS2 − FwdTCTGCGTCAGGTGACAATATCAG
AS2 + FwdCTCAGGCATTGGACACGCTA
AS2 −/+ RevGAAGGTCGGCTGTGCTGGGGNguyen et al. 2016 [99]
AS3 − FwdTCAATCTAGGCAAAGGTCCTG
AS3 + FwdTTGTATCAGGATTAACTGTAATTCC
AS3 −/+ RevTTTCCTCGCCGAACCACACGIijima et al. 2011 [67]
AS4 − FwdCGCTACCCTGCAGGGCGTCAGCTCAC
AS4 + FwdTAGTTGATGAATGGCTACTCGACAAAIijima et al. 2011 [67]
AS4 −/+ RevGACTCAGTTGTCATAGAGGAAGGCACIijima et al. 2011 [67]
AS5 − FwdAGCCAGCCAACCCCACCAGAGTA
AS5 + FwdAGATGACATCCTTGTGGCCT
AS5 −/+ RevACCATGCCAGTGGTACTGCT
AS6 − FwdATGCGAAGGGCCCAGCA
AS6 + FwdGCATTGATGAAAGCTGACTTGC
AS6 −/+ RevGGAAGTCATGCTACAGTCACAGC
Actb FwdGGAAATCGTGCGTGACATCAAAG
Actb RevCATACCCAAGAAGGAAGGCTGG

