Circulating Exosomal miRNAs Signal Circadian Misalignment to Peripheral Metabolic Tissues

 , , ,
, , ,  , and
, and 
Abstract
1. Introduction
2. Results
2.1. Exosome Characterization
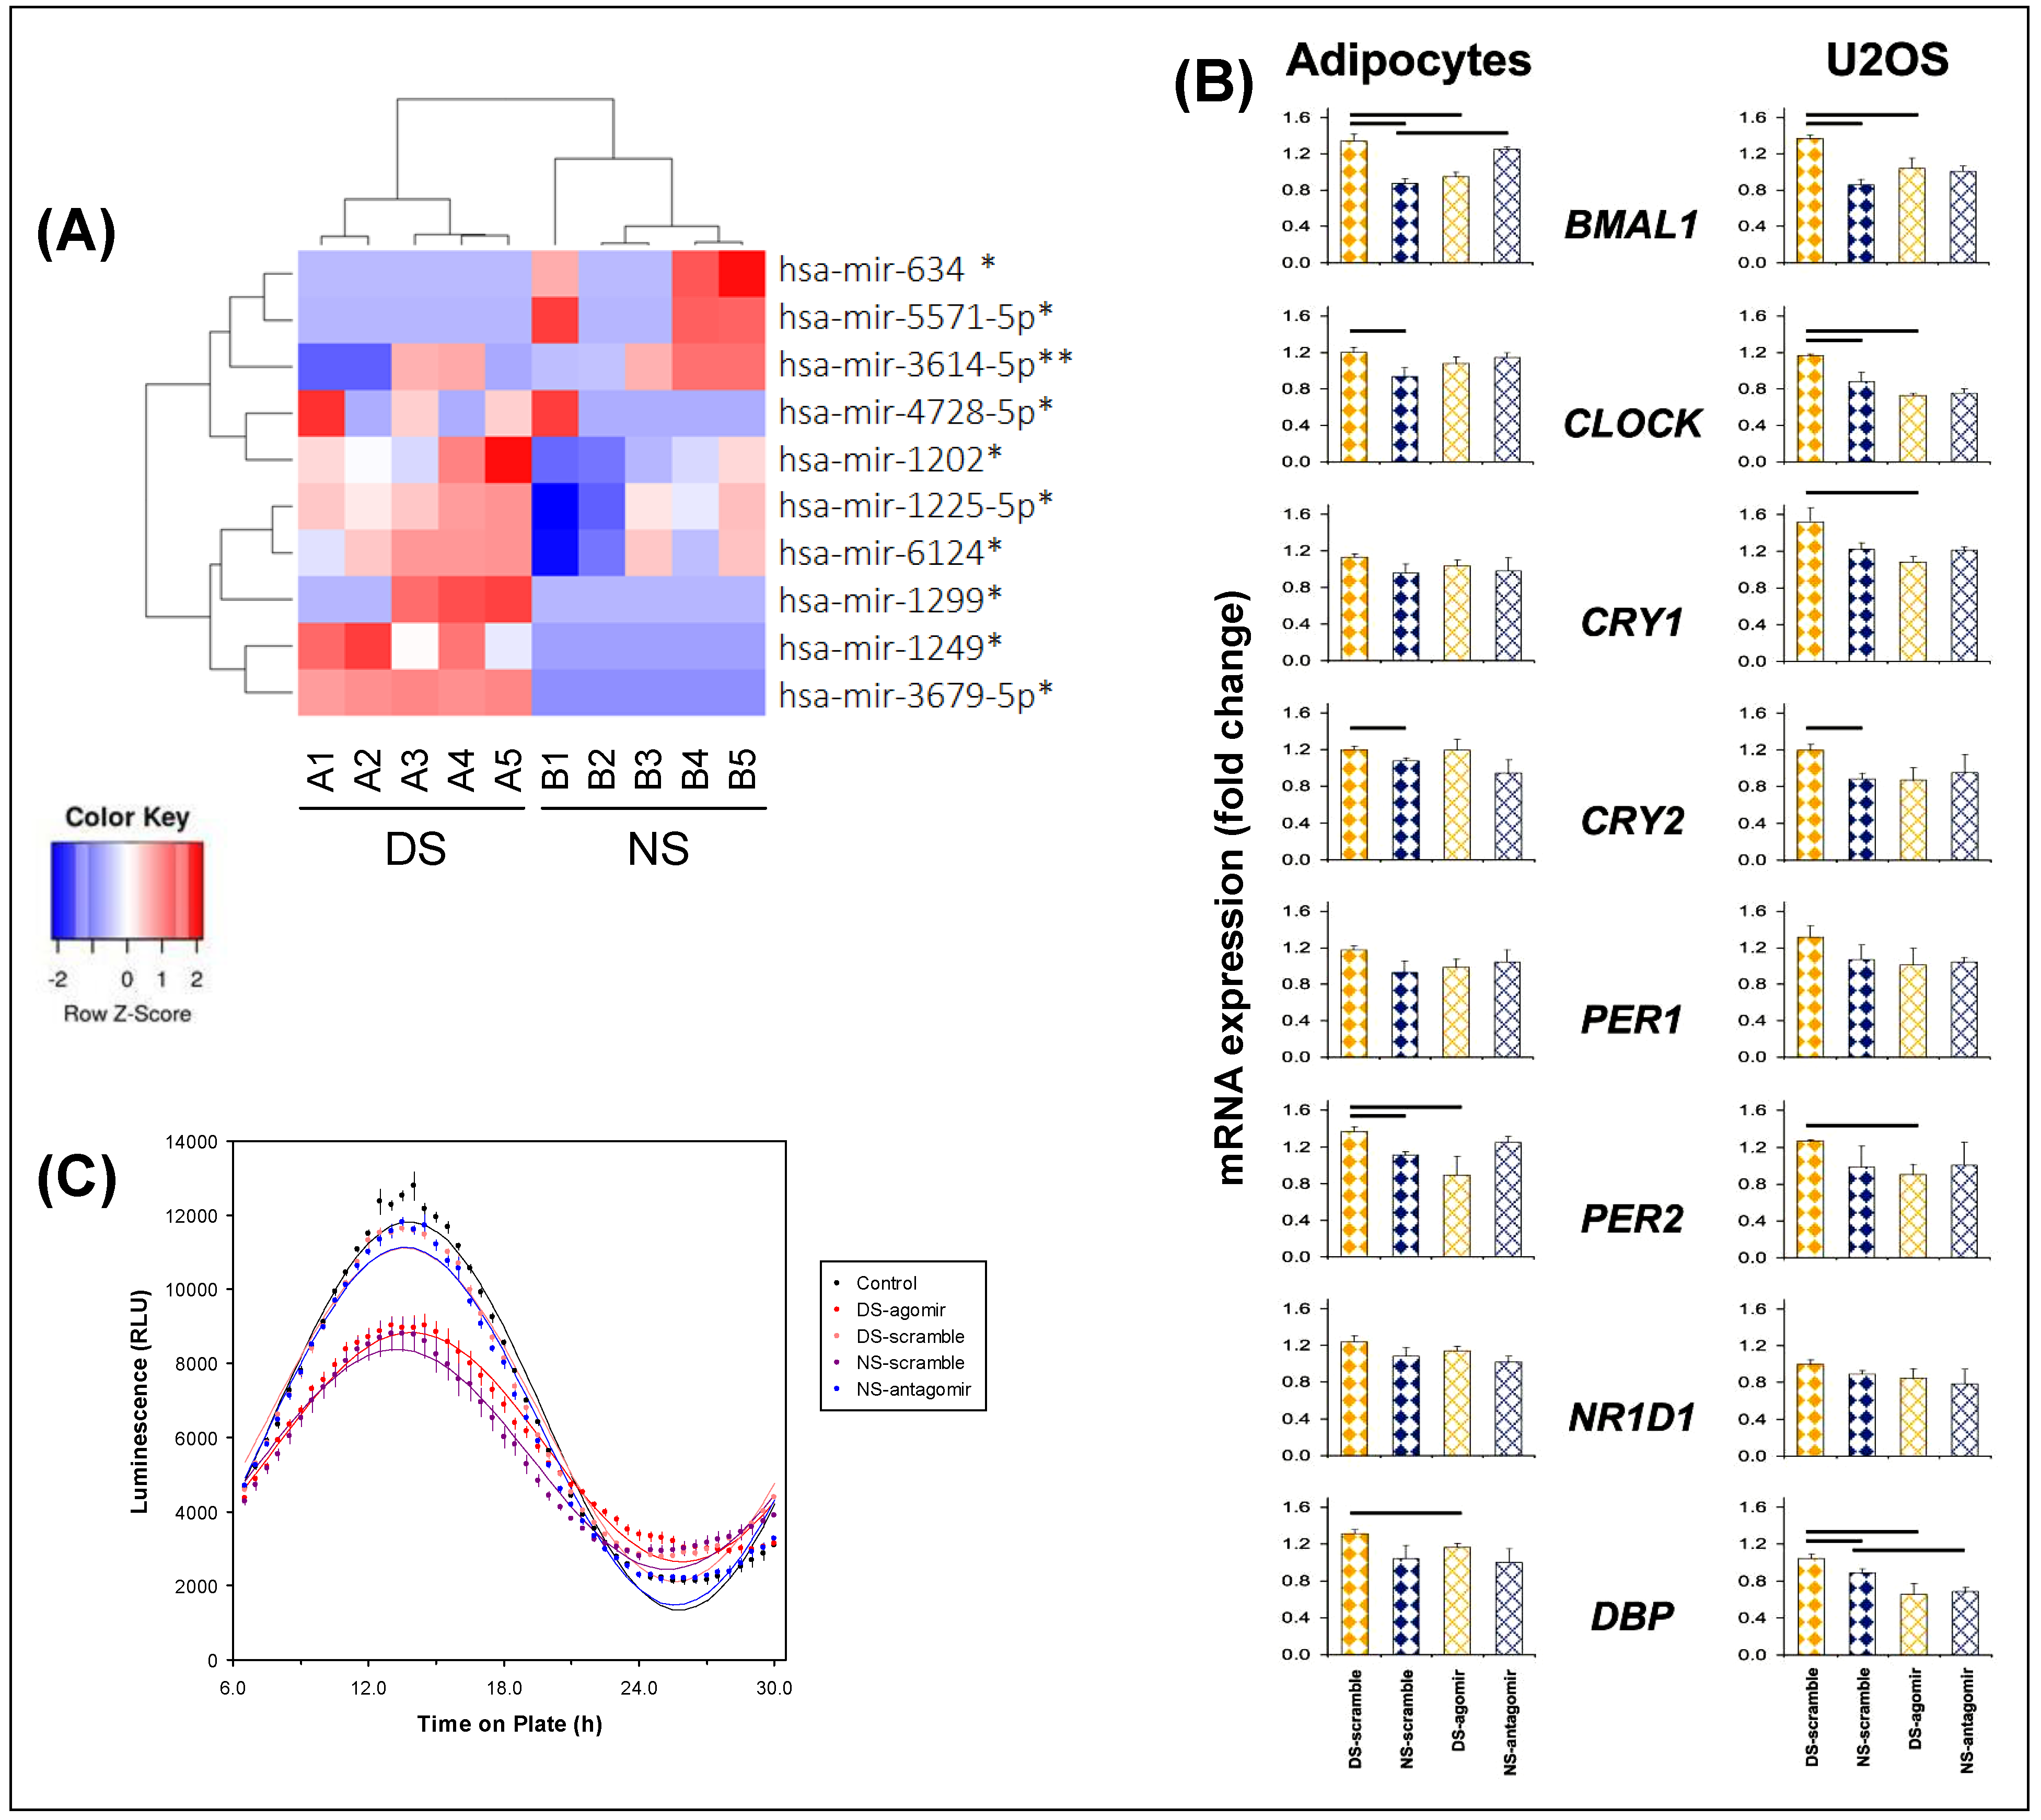
2.2. Exosomal miRNA Cargo
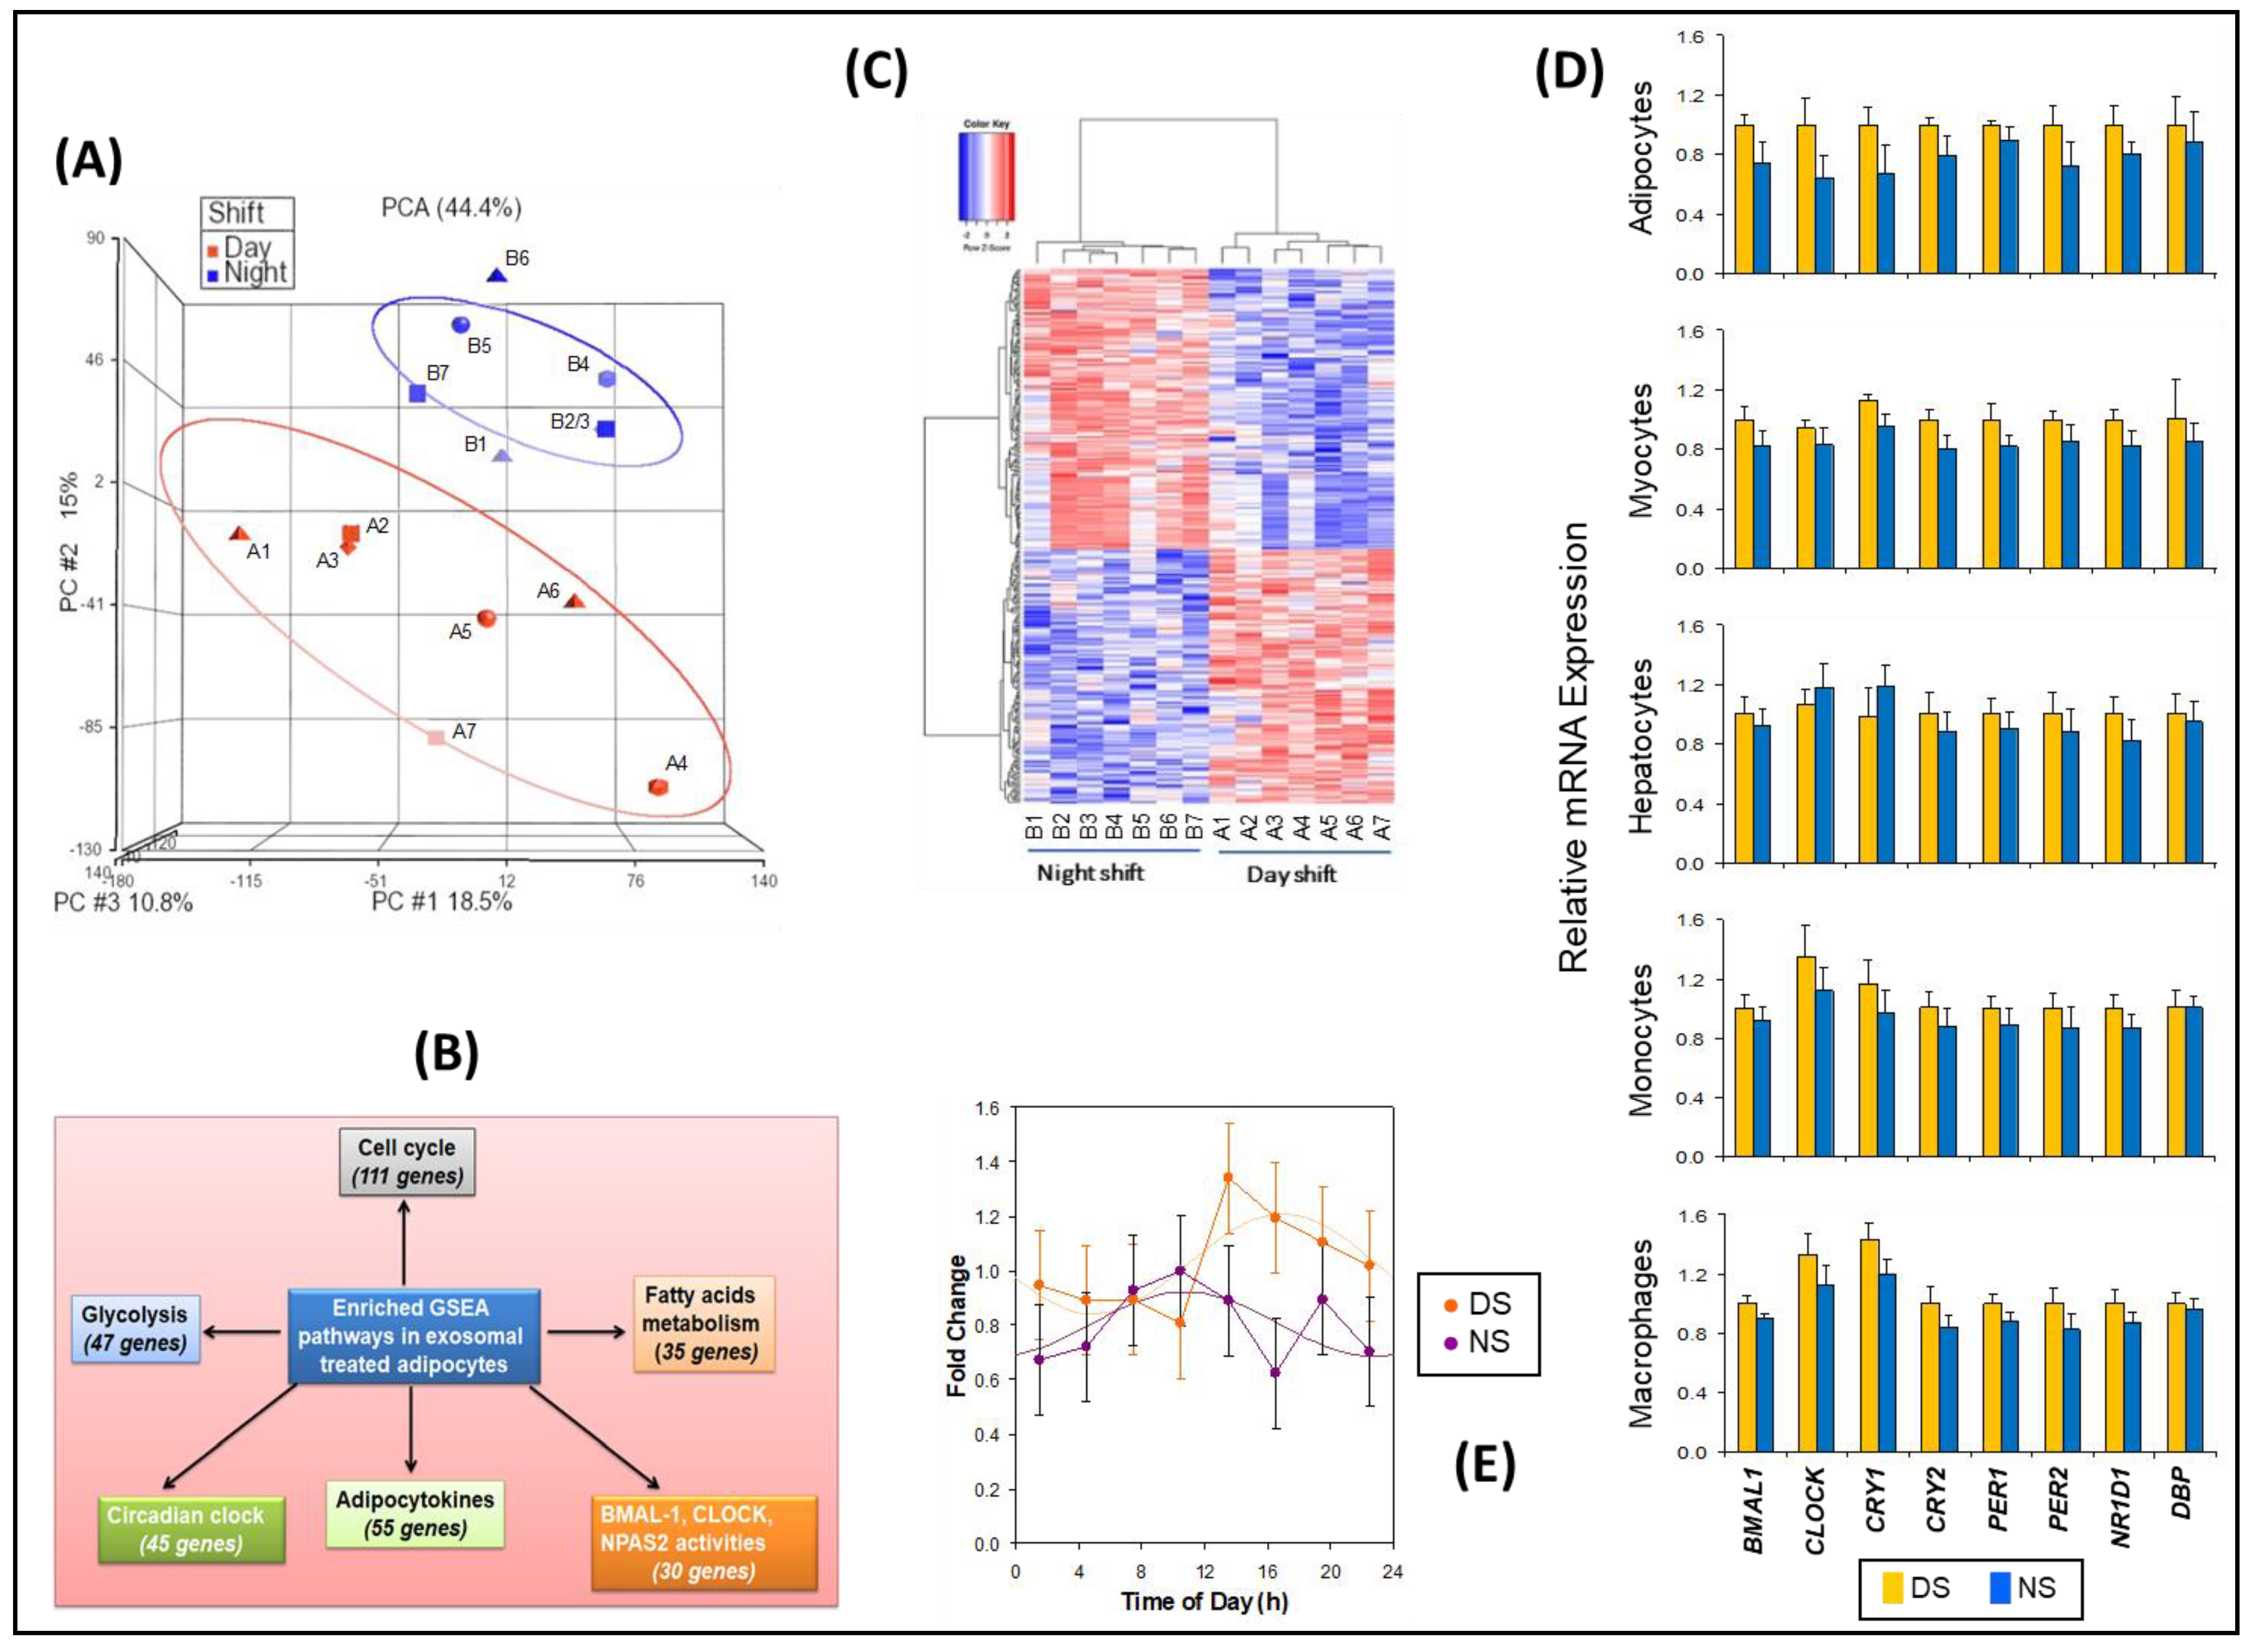
2.3. Effects of Exosomes on Transcriptome in Adipocytes Cells
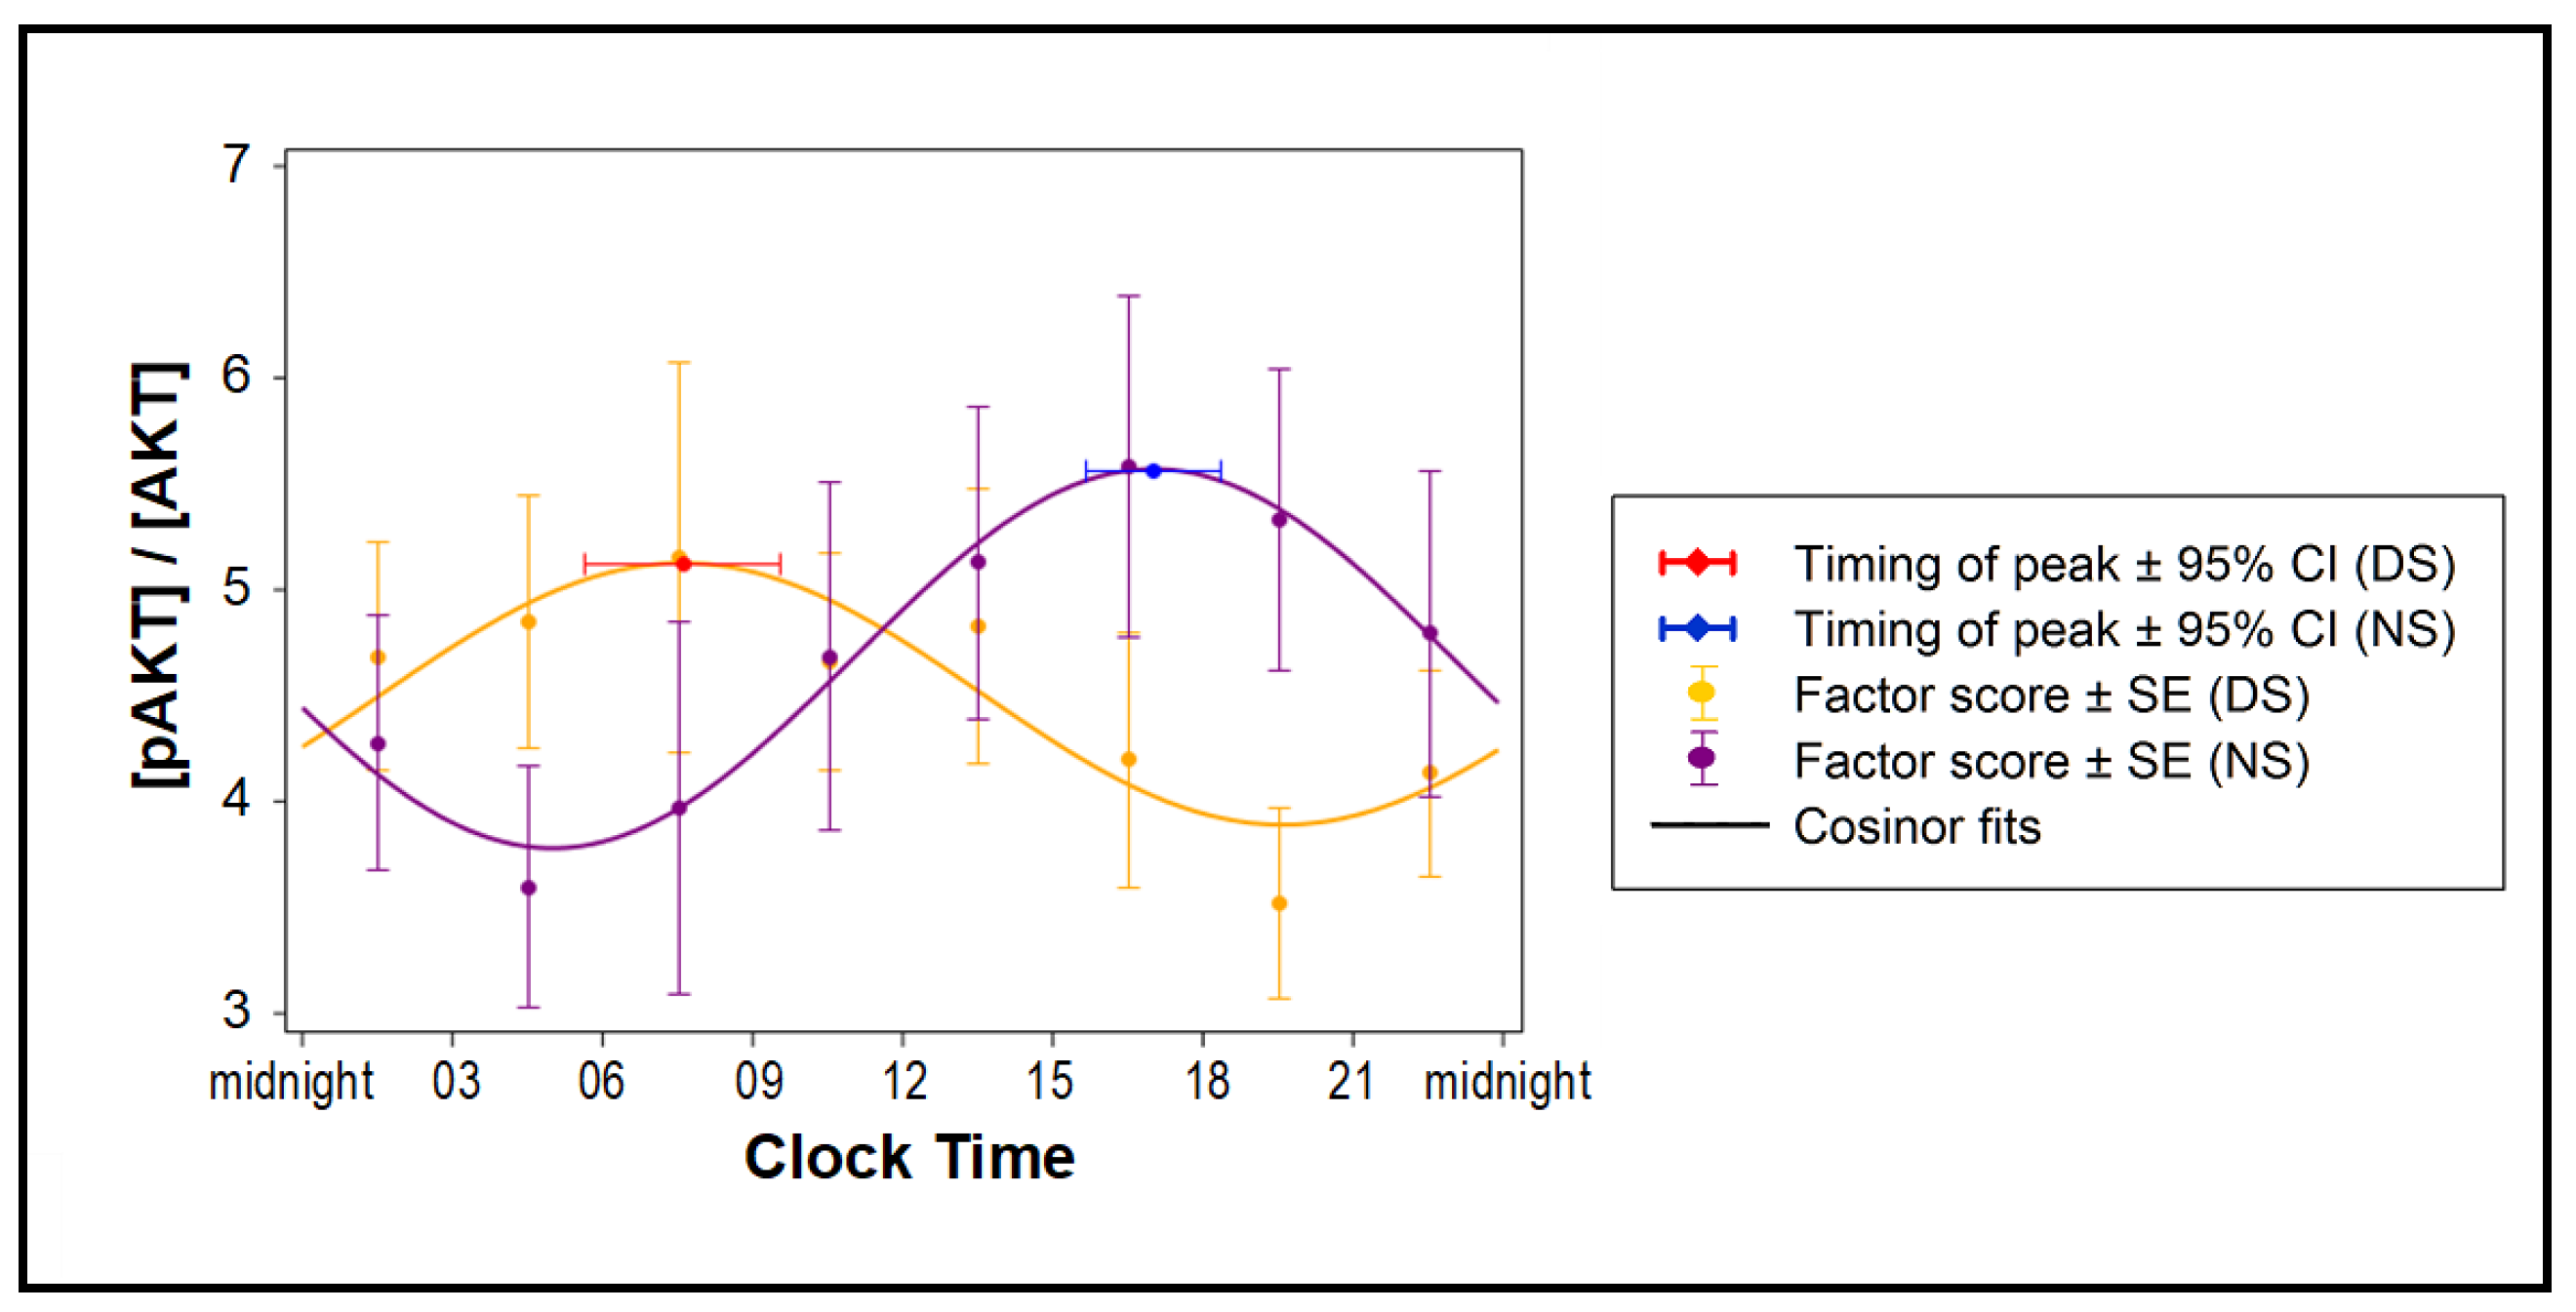
2.4. Effects of Exosomes on Insulin Sensitivity
2.5. Effects of Exosomes on BMAL1 Binding Sites
3. Discussion
4. Methods
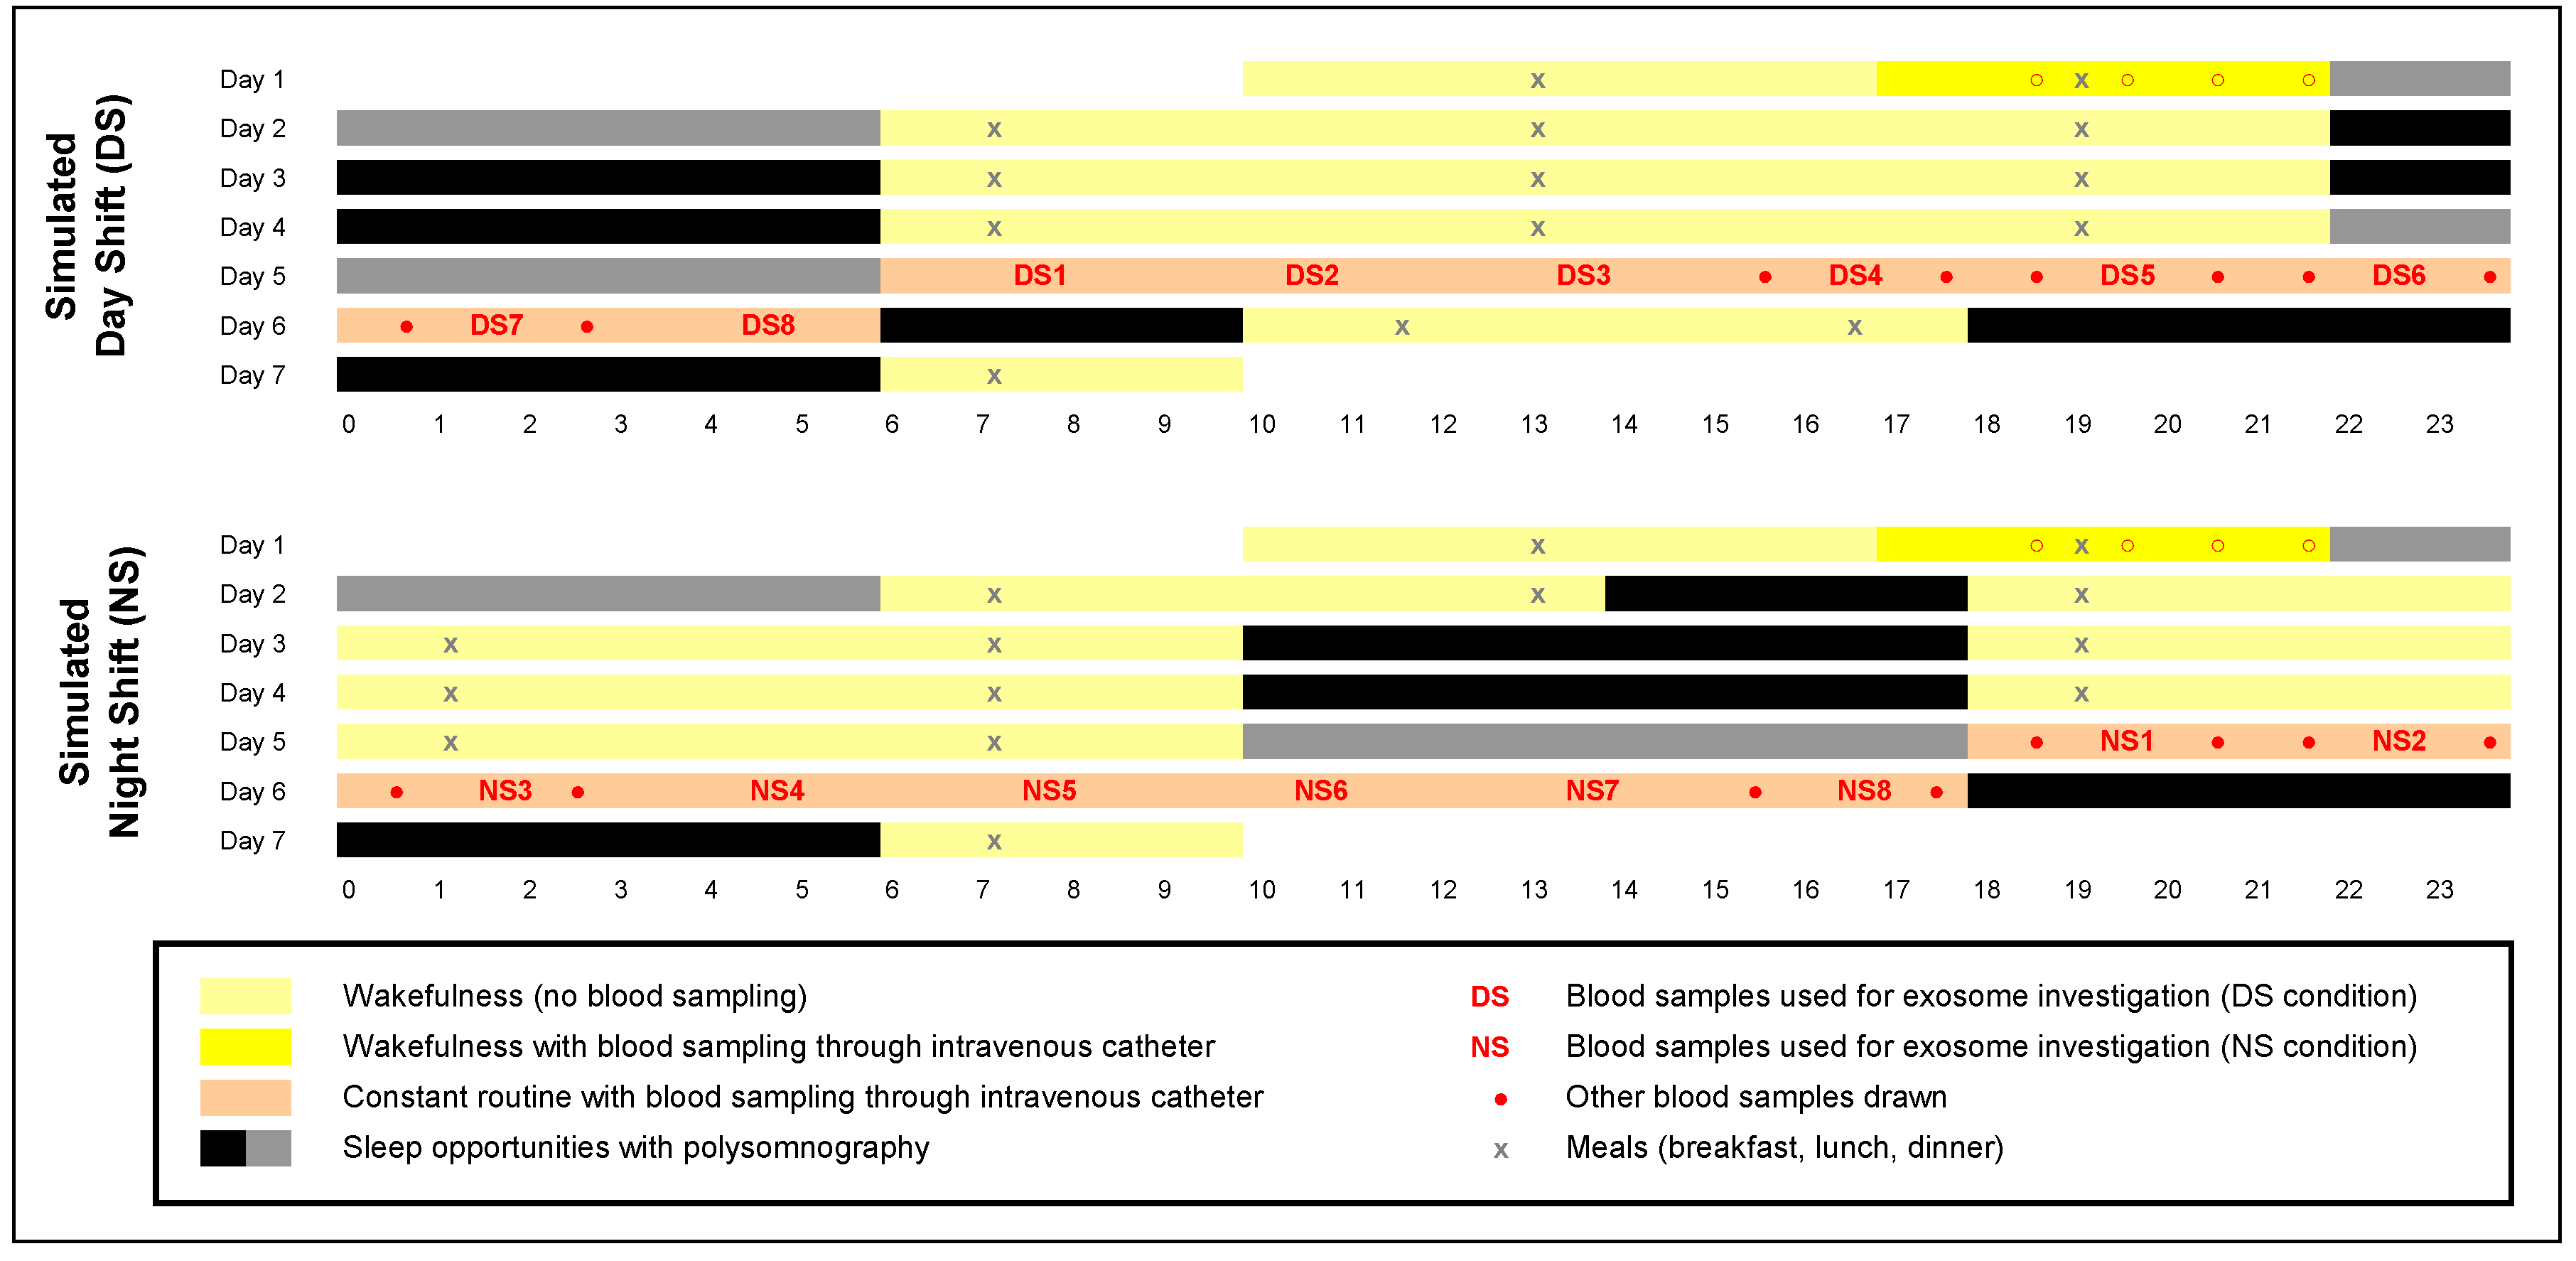
4.1. Human Subjects
4.2. Laboratory Experiment and Blood Samples
4.3. Overview of Exosome Investigation
4.4. Glucose and Insulin Assays
4.5. Exosome Isolation, Quantification, and Size Determination
4.6. Exosome Markers
4.7. Cellular Uptake of Exosomes
4.8. Human Cell Cultures
4.9. Insulin Sensitivity Assay in Vitro
4.10. Bmal1-dLuc Reporter Assay
4.11. Exosomal miRNA Isolation and Microarrays
4.12. Computational Target Predictions and Functional Annotation
4.13. miRNA Agomir and Antagomir in Vitro
4.14. mRNA Microarrays
4.15. qRT-PCR Validation
4.16. Chromatin Immunoprecipitation Sequencing
4.17. Statistical Analyses
Supplementary Materials
Author Contributions
Funding
Acknowledgments
Conflicts of Interest
Statement of Significance
References
- James, S.M.; Honn, K.A.; Gaddameedhi, S.; Van Dongen, H.P.A. Shift work: Disrupted circadian rhythms and sleep—Implications for health and well-being. Curr. Sleep Med. Rep. 2017, 3, 104–112. [Google Scholar] [CrossRef] [PubMed]
- Morris, C.J.; Aeschbach, D.; Scheer, F.A. Circadian system, sleep and endocrinology. Mol. Cell. Endocrinol. 2012, 349, 91–104. [Google Scholar] [CrossRef] [PubMed]
- Sun, M.; Feng, W.; Wang, F.; Li, P.; Li, Z.; Li, M.; Tse, G.; Vlaanderen, J.; Vermeulen, R.; Tse, L.A. Meta-analysis on shift work and risks of specific obesity types. Obes. Rev. 2018, 19, 28–40. [Google Scholar] [CrossRef] [PubMed]
- Skene, D.J.; Skornyakov, E.; Chowdhury, N.R.; Gajula, R.; Middleton, B.; Satterfield, B.C.; Porter, K.I.; Van Dongen, H.P.; Gaddameedhi, S. Separation of circadian- and behavior-driven metabolite rhythms in humans provides a window on peripheral oscillators and metabolism. Proc. Natl. Acad. Sci. USA 2018, 115, 7825–7830. [Google Scholar] [CrossRef] [PubMed]
- Duffy, J.F.; Dijk, D.J. Getting through to circadian oscillators: Why use constant routines? J. Biol. Rhythm. 2002, 17, 4–13. [Google Scholar] [CrossRef]
- Mohawk, J.A.; Green, C.B.; Takahashi, J.S. Central and peripheral circadian clocks in mammals. Annu. Rev. Neurosci. 2012, 35, 445–462. [Google Scholar] [CrossRef]
- Liu, J.; Zhou, B.; Yan, M.; Huang, R.; Wang, Y.; He, Z.; Yang, Y.; Dai, C.; Wang, Y.; Zhang, F.; et al. CLOCK and BMAL1 regulate muscle insulin sensitivity via SIRT1 in male mice. Endocrinology 2016, 157, 2259–2269. [Google Scholar] [CrossRef]
- Ehlen, J.C.; Brager, A.J.; Baggs, J.; Pinckney, L.; Gray, C.L.; Debruyne, J.P.; Esser, K.A.; Takahashi, J.S.; Paul, K.N. Bmal1 function in skeletal muscle regulates sleep. eLife 2017, 6, e26557. [Google Scholar] [CrossRef]
- Selcho, M.; Millán, C.; Palacios-Muñoz, A.; Ruf, F.; Ubillo, L.; Chen, J.; Bergmann, G.A.; Ito, C.; Silva, V.; Wegener, C.; et al. Central and peripheral clocks are coupled by a neuropeptide pathway in Drosophila. Nat. Commun. 2017, 8, 15563. [Google Scholar] [CrossRef]
- Tahara, Y.; Shibata, S. Entrainment of the mouse circadian clock: Effects of stress, exercise, and nutrition. Free. Radic. Biol. Med. 2018, 119, 129–138. [Google Scholar] [CrossRef]
- Tamaru, T.; Takamatsu, K. Circadian modification network of a core clock driver BMAL1 to harmonize physiology from brain to peripheral tissues. Neurochem. Int. 2018, 119, 11–16. [Google Scholar] [CrossRef] [PubMed]
- Nader, N.; Chrousos, G.P.; Kino, T. Circadian rhythm transcription factor CLOCK regulates the transcriptional activity of the glucocorticoid receptor by acetylating its hinge region lysine cluster: Potential physiological implications. FASEB J. 2009, 23, 1572–1583. [Google Scholar] [CrossRef] [PubMed]
- Marti, A.R.; Patil, S.; Mrdalj, J.; Meerlo, P.; Skrede, S.; Pallesen, S.; Pedersen, T.T.; Bramham, C.R.; Grønli, J. No escaping the rat race: Simulated night shift work alters the time-of-day variation in BMAL1 translational activity in the prefrontal cortex. Front. Neural Circuits 2017, 11, 70. [Google Scholar] [CrossRef] [PubMed]
- Pegtel, D.M.; Cosmopoulos, K.; Thorley-Lawson, D.A.; Van Eijndhoven, M.A.J.; Hopmans, E.S.; Lindenberg, J.L.; De Gruijl, T.D.; Würdinger, T.; Middeldorp, J.M. Functional delivery of viral miRNAs via exosomes. Proc. Natl. Acad. Sci. USA 2010, 107, 6328–6333. [Google Scholar] [CrossRef] [PubMed]
- Khalyfa, A.; Kheirandish-Gozal, L.; Gozal, D. Circulating exosomes in obstructive sleep apnea as phenotypic biomarkers and mechanistic messengers of end-organ morbidity. Respir. Physiol. Neurobiol. 2018, 256, 143–156. [Google Scholar] [CrossRef] [PubMed]
- Shifrin, D.A.; Beckler, M.D.; Coffey, R.J.; Tyska, M.J. Extracellular vesicles: Communication, coercion, and conditioning. Mol. Biol. Cell 2013, 24, 1253–1259. [Google Scholar] [CrossRef]
- Colombo, M.; Raposo, G.; Théry, C. Biogenesis, secretion, and intercellular interactions of exosomes and other extracellular vesicles. Annu. Rev. Cell Dev. Biol. 2014, 30, 255–289. [Google Scholar] [CrossRef]
- Kourembanas, S. Exosomes: Vehicles of intercellular signaling, biomarkers, and vectors of cell therapy. Annu. Rev. Physiol. 2015, 77, 13–27. [Google Scholar] [CrossRef]
- Boriachek, K.; Islam, N.; Möller, A.; Salomon, C.; Nguyen, N.T.; Hossain, S.A.; Yamauchi, Y.; Shiddiky, M.J.A. Biological functions and current advances in isolation and detection strategies for exosome nanovesicles. Small 2018, 14, 201702153. [Google Scholar] [CrossRef]
- Ratajczak, J.; Miekus, K.; Kucia, M.; Zhang, J.; Reca, R.; Dvorák, P.; Ratajczak, M.Z. Embryonic stem cell-derived microvesicles reprogram hematopoietic progenitors: Evidence for horizontal transfer of mRNA and protein delivery. Leukemia 2006, 20, 847–856. [Google Scholar] [CrossRef]
- Valadi, H.; Ekstrom, K.; Bossios, A.; Sjöstrand, M.; Lee, J.J.; Lötvall, J. Exosome-mediated transfer of mRNAs and microRNAs is a novel mechanism of genetic exchange between cells. Nat. Cell Biol. 2007, 9, 654–659. [Google Scholar] [CrossRef] [PubMed]
- Kosaka, N.; Iguchi, H.; Yoshioka, Y.; Takeshita, F.; Matsuki, Y.; Ochiya, T. Secretory mechanisms and intercellular transfer of MicroRNAs in living cells. J. Biol. Chem. 2010, 285, 17442–17452. [Google Scholar] [CrossRef] [PubMed]
- Zhang, Y.; Liu, D.; Chen, X.; Li, J.; Li, L.; Bian, Z.; Sun, F.; Lu, J.; Yin, Y.; Cai, X.; et al. Secreted monocytic mir-150 enhances targeted endothelial cell migration. Mol. Cell 2010, 39, 133–144. [Google Scholar] [CrossRef]
- Mitchell, P.S.; Parkin, R.K.; Kroh, E.M.; Fritz, B.R.; Wyman, S.K.; Pogosova-Agadjanyan, E.L.; Peterson, A.; Noteboom, J.; O’Briant, K.C.; Allen, A.; et al. Circulating microRNAs as stable blood-based markers for cancer detection. Proc. Natl. Acad. Sci. USA 2008, 105, 10513–10518. [Google Scholar] [CrossRef] [PubMed]
- Khalyfa, A.; Kheirandish-Gozal, L.; Khalyfa, A.A.; Philby, M.F.; Alonso-Álvarez, M.L.; Mohammadi, M.; Bhattacharjee, R.; Terán-Santos, J.; Huang, L.; Andrade, J.; et al. Circulating plasma extracellular microvesicle MicroRNA cargo and endothelial dysfunction in children with obstructive sleep apnea. Am. J. Respir. Crit. Care Med. 2016, 194, 1116–1126. [Google Scholar] [CrossRef] [PubMed]
- Cheng, L.; Sharples, R.A.; Scicluna, B.J.; Hill, A.F. Exosomes provide a protective and enriched source of miRNA for biomarker profiling compared to intracellular and cell-free blood. J. Extracell. Vesicles 2014, 3, 23743. [Google Scholar] [CrossRef]
- Eissa, N.T. The exosome in lung diseases: Message in a bottle. J. Allergy Clin. Immunol. 2013, 131, 904–905. [Google Scholar] [CrossRef]
- Wang, X.; Omar, O.; Vazirisani, F.; Thomsen, P.; Ekström, K. Mesenchymal stem cell-derived exosomes have altered microRNA profiles and induce osteogenic differentiation depending on the stage of differentiation. PLoS ONE 2018, 13, e0193059. [Google Scholar] [CrossRef]
- Deng, Z.B.; Poliakov, A.; Hardy, R.W.; Clements, R.; Liu, C.; Liu, Y.; Wang, J.; Xiang, X.; Zhang, S.; Zhuang, X.; et al. Adipose tissue exosome-like vesicles mediate activation of macrophage-induced insulin resistance. Diabetes 2009, 58, 2498–2505. [Google Scholar] [CrossRef]
- Kranendonk, M.E.; De Kleijn, D.P.V.; Kalkhoven, E.; Kanhai, D.A.; Uiterwaal, C.S.P.M.; Van Der Graaf, Y.; Pasterkamp, G.; Visseren, F.L. Extracellular vesicle markers in relation to obesity and metabolic complications in patients with manifest cardiovascular disease. Cardiovasc. Diabetol. 2014, 13, 37. [Google Scholar] [CrossRef]
- Santovito, D.; De Nardis, V.; Marcantonio, P.; Mandolini, C.; Paganelli, C.; Vitale, E.; Buttitta, F.; Bucci, M.; Mezzetti, A.; Consoli, A.; et al. Plasma exosome MicroRNA profiling unravels a new potential modulator of adiponectin pathway in diabetes: Effect of glycemic control. J. Clin. Endocrinol. Metab. 2014, 99, E1681–E1685. [Google Scholar] [CrossRef] [PubMed]
- Milbank, E.; Martinez, M.; Andriantsitohaina, R. Extracellular vesicles: Pharmacological modulators of the peripheral and central signals governing obesity. Pharmacol. Ther. 2016, 157, 65–83. [Google Scholar] [CrossRef] [PubMed]
- Mullins, R.J.; Mustapic, M.; Goetzl, E.J.; Kapogiannis, D. Exosomal biomarkers of brain insulin resistance associated with regional atrophy in Alzheimer’s disease. Hum. Brain Mapp. 2017, 38, 1933–1940. [Google Scholar] [CrossRef] [PubMed]
- Conde-Vancells, J.; Rodriguez-Suarez, E.; Embade, N.; Gil, D.; Matthiesen, R.; Valle, M.; Elortza, F.; Lu, S.C.; Mato, J.M.; Falcón-Pérez, J.M. Characterization and comprehensive proteome profiling of exosomes secreted by hepatocytes. J. Proteome Res. 2008, 7, 5157–5166. [Google Scholar] [CrossRef] [PubMed]
- Guescini, M.; Guidolin, D.; Vallorani, L.; Casadei, L.; Gioacchini, A.; Tibollo, P.; Battistelli, M.; Falcieri, E.; Battistin, L.; Agnati, L.; et al. C2C12 myoblasts release micro-vesicles containing mtDNA and proteins involved in signal transduction. Exp. Cell Res. 2010, 316, 1977–1984. [Google Scholar] [CrossRef]
- Bartel, B. MicroRNAs: Target recognition and regulatory functions. Cell 2009, 136, 215–233. [Google Scholar] [CrossRef]
- Ameres, S.L.; Zamore, P.D. Diversifying microRNA sequence and function. Nat. Rev. Mol. Cell Biol. 2013, 14, 475–488. [Google Scholar] [CrossRef]
- Rodríguez-Dorantes, M.; Romero-Córdoba, S.; Peralta-Zaragoza, O.; Salido-Guadarrama, I.; Hidalgo-Miranda, A. MicroRNAs transported by exosomes in body fluids as mediators of intercellular communication in cancer. OncoTargets Ther. 2014, 7, 1327–1328. [Google Scholar] [CrossRef]
- Vienberg, S.; Geiger, J.; Madsen, S.; Dalgaard, L.T. MicroRNAs in metabolism. Acta Physiol. 2017, 219, 346–361. [Google Scholar] [CrossRef]
- Liu, K.; Wang, R. MicroRNA-mediated regulation in the mammalian circadian rhythm. J. Theor. Biol. 2012, 304, 103–110. [Google Scholar] [CrossRef]
- Khalyfa, A.; Kheirandish-Gozal, L.; Bhattacharjee, R.; Khalyfa, A.A.; Gozal, D. Circulating microRNAs as potential biomarkers of endothelial dysfunction in obese children. Chest 2016, 149, 786–800. [Google Scholar] [CrossRef] [PubMed]
- Thomou, T.; Mori, M.A.; Dreyfuss, J.M.; Konishi, M.; Sakaguchi, M.; Wolfrum, C.; Rao, T.N.; Winnay, J.N.; Garcia-Martin, R.; Grinspoon, S.K.; et al. Adipose-derived circulating miRNAs regulate gene expression in other tissues. Nature 2017, 542, 450–455. [Google Scholar] [CrossRef]
- Hirota, T.; Lee, J.W.; John, P.C.S.; Sawa, M.; Iwaisako, K.; Noguchi, T.; Pongsawakul, P.Y.; Sonntag, T.; Welsh, D.K.; Brenner, D.A.; et al. Identification of small molecule activators of cryptochrome. Science 2012, 337, 1094–1097. [Google Scholar] [CrossRef] [PubMed]
- Marcheva, B.; Ramsey, K.M.; Peek, C.B.; Affinati, A.; Maury, E.; Bass, J. Circadian clocks and metabolism. Handb. Exp. Pharmacol. 2013, 217, 127–155. [Google Scholar] [CrossRef]
- Qian, J.; Man, C.D.; Morris, C.J.; Cobelli, C.; Scheer, F.A.J.L. Differential effects of the circadian system and circadian misalignment on insulin sensitivity and insulin secretion in humans. Diabetes Obes. Metab. 2018, 20, 2481–2485. [Google Scholar] [CrossRef] [PubMed]
- Khalyfa, A.; Poroyko, V.A.; Qiao, Z.; Gileles-Hillel, A.; Khalyfa, A.A.; Akbarpour, M.; Almendros, I.; Farre, R.; Gozal, D. Exosomes and metabolic function in mice exposed to alternating dark-light cycles mimicking night shift work schedules. Front. Physiol. 2017, 8, 882. [Google Scholar] [CrossRef]
- Mendoza-Viveros, L.; Bouchard-Cannon, P.; Hegazi, S.; Cheng, A.H.; Pastore, S.; Cheng, H.Y.M. Molecular modulators of the circadian clock: Lessons from flies and mice. Cell. Mol. Life Sci. 2017, 74, 1035–1059. [Google Scholar] [CrossRef]
- Bass, J.; Takahashi, J.S. Circadian integration of metabolism and energetics. Science 2010, 330, 1349–1354. [Google Scholar] [CrossRef]
- Kecklund, G.; Axelsson, J. Health consequences of shift work and insufficient sleep. BMJ 2016, 355, i5210. [Google Scholar] [CrossRef]
- Bescos, R.; Boden, M.; Jackson, M.L.; Trewin, A.J.; Marin, E.C.; Levinger, I.; Garnham, A.; Hiam, D.; Falcao-Tebas, F.; Conte, F.; et al. Four days of simulated shift work reduces insulin sensitivity in humans. Acta Physiol. 2018, 223, e13039. [Google Scholar] [CrossRef]
- Lamia, K.A.; Storch, K.F.; Weitz, C.J. Physiological significance of a peripheral tissue circadian clock. Proc. Natl. Acad. Sci. USA 2008, 105, 15172–15177. [Google Scholar] [CrossRef] [PubMed]
- HogenEsch, J.B.; Panda, S.; Kay, S.; Takahashi, J.S. Circadian transcriptional output in the SCN and liver of the mouse. Novartis Found. Symp. 2003, 253, 171–183. [Google Scholar] [CrossRef] [PubMed]
- Scheer, F.A.; Hilton, M.F.; Mantzoros, C.S.; Shea, S. Adverse metabolic and cardiovascular consequences of circadian misalignment. Proc. Natl. Acad. Sci. USA 2009, 106, 4453–4458. [Google Scholar] [CrossRef] [PubMed]
- McHill, A.W.; Melanson, E.L.; Higgins, J.; Connick, E.; Moehlman, T.M.; Stothard, E.R.; Wright, K.P.J. Impact of circadian misalignment on energy metabolism during simulated nightshift work. Proc. Natl. Acad. Sci. USA 2014, 111, 17302–17307. [Google Scholar] [CrossRef] [PubMed]
- Fonken, L.K.; Workman, J.L.; Walton, J.C.; Weil, Z.M.; Morris, J.S.; Haim, A.; Nelson, R.J. Light at night increases body mass by shifting the time of food intake. Proc. Natl. Acad. Sci. USA 2010, 107, 18664–18669. [Google Scholar] [CrossRef] [PubMed]
- Eckel-Mahan, K.; Sassone-Corsi, P. Metabolism and the circadian clock converge. Physiol. Rev. 2013, 93, 107–135. [Google Scholar] [CrossRef]
- Kojima, S.; Shingle, D.L.; Green, C.B. Post-transcriptional control of circadian rhythms. J. Cell Sci. 2011, 124, 311–320. [Google Scholar] [CrossRef]
- Théry, C.; Ostrowski, M.; Segura, E. Membrane vesicles as conveyors of immune responses. Nat. Rev. Immunol. 2009, 9, 581–593. [Google Scholar] [CrossRef]
- Yáñez-Mó, M.; Siljander, P.R.-M.; Andreu, Z.; Zavec, A.B.; Borràs, F.E.; Buzas, E.I.; Buzas, K.; Casal, E.; Cappello, F.; Carvalho, J.; et al. Biological properties of extracellular vesicles and their physiological functions. J. Extracell. Vesicles 2015, 4, 27066. [Google Scholar] [CrossRef]
- Ailhaud, G. Adipose tissue as a secretory organ: From adipogenesis to the metabolic syndrome. Comptes Rendus Biol. 2006, 329, 570–577. [Google Scholar] [CrossRef]
- Sorisky, A.; Molgat, A.S.D.; Gagnon, A. Macrophage-induced adipose tissue dysfunction and the preadipocyte: Should I stay (and differentiate) or should I go? Adv. Nutr. 2013, 4, 67–75. [Google Scholar] [CrossRef] [PubMed]
- Wu, J.; Ji, A.L.; Wang, Z.X.; Qiang, G.H.; Qu, Z.; Wu, J.; Jiang, C. Exosome-Mimetic Nanovesicles from Hepatocytes promote hepatocyte proliferation in vitro and liver regeneration in vivo. Sci. Rep. 2018, 8, 2471. [Google Scholar] [CrossRef]
- Nakagawa, H.; Okumura, N. Coordinated regulation of circadian rhythms and homeostasis by the suprachiasmatic nucleus. Proc. Jpn. Acad. Ser. B 2010, 86, 391–409. [Google Scholar] [CrossRef] [PubMed]
- Declercq, V.; D’Eon, B.; McLeod, R. Fatty acids increase adiponectin secretion through both classical and exosome pathways. Biochim. Biophys. Acta 2015, 1851, 1123–1133. [Google Scholar] [CrossRef]
- Ferrante, S.C.; Nadler, E.P.; Pillai, D.K.; Hubal, M.; Wang, Z.; Wang, J.M.; Gordish-Dressman, H.; Koeck, E.; Sevilla, S.; Wiles, A.A.; et al. Adipocyte-derived exosomal miRNAs: A novel mechanism for obesity-related disease. Pediatr. Res. 2015, 77, 447–454. [Google Scholar] [CrossRef] [PubMed]
- Choi, J.S.; Yoon, H.I.; Lee, K.S.; Choi, Y.C.; Yang, S.H.; Kim, I.S.; Cho, Y.W. Exosomes from differentiating human skeletal muscle cells trigger myogenesis of stem cells and provide biochemical cues for skeletal muscle regeneration. J. Control. Release Soc. 2016, 222, 107–115. [Google Scholar] [CrossRef] [PubMed]
- Ying, W.; Riopel, M.; Bandyopadhyay, G.; Dong, Y.; Birmingham, A.; Seo, J.B.; Ofrecio, J.M.; Wollam, J.; Hernandez-Carretero, A.; Fu, W.; et al. Adipose tissue macrophage-derived exosomal miRNAs Can modulate in vivo and in vitro insulin sensitivity. Cell 2017, 171, 372–384. [Google Scholar] [CrossRef]
- De Silva, N.; Samblas, M.; Martínez, A.; Milagro, F.I. Effects of exosomes from LPS-activated macrophages on adipocyte gene expression, differentiation, and insulin-dependent glucose uptake. J. Physiol. Biochem. 2018, 74, 559–568. [Google Scholar] [CrossRef]
- Guo, J.; Cheng, P.; Yuan, H.; Liu, Y. The exosome regulates circadian gene expression in a posttranscriptional negative feedback loop. Cell 2009, 138, 1236–1246. [Google Scholar] [CrossRef]
- Tao, S.C.; Guo, S. Extracellular vesicles: Potential participants in circadian rhythm synchronization. Int. J. Biol. Sci. 2018, 14, 1610–1620. [Google Scholar] [CrossRef]
- Chaput, N.; Théry, C. Exosomes: Immune properties and potential clinical implementations. Semin. Immunopathol. 2011, 33, 419–440. [Google Scholar] [CrossRef] [PubMed]
- Gao, X.; Salomon, C.; Freeman, D.J. Extracellular vesicles from adipose tissue—A potential role in obesity and type 2 diabetes? Front. Endocrinol. 2017, 8, 202. [Google Scholar] [CrossRef] [PubMed]
- Gupta, C.C.; Coates, A.M.; Dorrian, J.; Banks, S. The factors influencing the eating behaviour of shiftworkers: What, when, where and why. Ind. Health 2019, 57, 419–453. [Google Scholar] [CrossRef] [PubMed]
- Thaiss, C.A.; Zeevi, D.; Levy, M.; Zilberman-Schapira, G.; Suez, J.; Tengeler, A.C.; Abramson, L.; Katz, M.N.; Korem, T.; Zmora, N.; et al. Transkingdom control of microbiota diurnal oscillations promotes metabolic homeostasis. Cell 2014, 159, 514–529. [Google Scholar] [CrossRef] [PubMed]
- Voigt, R.M.; Forsyth, C.B.; Green, S.J.; Mutlu, E.; Engen, P.; Vitaterna, M.H.; Turek, F.W.; Keshavarzian, A. Circadian disorganization alters intestinal microbiota. PLoS ONE 2014, 9, e97500. [Google Scholar] [CrossRef]
- Reynolds, A.C.; Broussard, J.; Paterson, J.L.; Wright, K.P.; Ferguson, S.A. Sleepy, circadian disrupted and sick: Could intestinal microbiota play an important role in shift worker health? Mol. Metab. 2017, 6, 12–13. [Google Scholar] [CrossRef]
- Grant, C.L.; Coates, A.M.; Dorrian, J.; Kennaway, D.J.; Wittert, G.A.; Heilbronn, L.K.; Pajcin, M.; Della Vedova, C.; Gupta, C.C.; Banks, S. Timing of food intake during simulated night shift impacts glucose metabolism: A controlled study. Chrono. Int. 2017, 34, 1003–1013. [Google Scholar] [CrossRef]
- Khalyfa, A.; Gozal, D.; Masa, J.F.; Marín, J.M.; Qiao, Z.; Corral, J.; González, M.; Marti, S.; Kheirandish-Gozal, L.; Egea, C.; et al. Sleep-disordered breathing, circulating exosomes, and insulin sensitivity in adipocytes. Int. J. Obes. 2018, 42, 1127–1139. [Google Scholar] [CrossRef]
- Pant, S.; Hilton, H.; Burczynski, M.E. The multifaceted exosome: Biogenesis, role in normal and aberrant cellular function, and frontiers for pharmacological and biomarker opportunities. Biochem. Pharmacol. 2012, 83, 1484–1494. [Google Scholar] [CrossRef]
- Revenfeld, A.L.; Bæk, R.; Nielsen, M.H.; Stensballe, A.; Varming, K.; Jørgensen, M. Diagnostic and prognostic potential of extracellular vesicles in peripheral blood. Clin. Ther. 2014, 36, 830–846. [Google Scholar] [CrossRef]
- Tkach, M.; Théry, C. Communication by extracellular vesicles: Where we are and where we need to go. Cell 2016, 164, 1226–1232. [Google Scholar] [CrossRef] [PubMed]
- Khalyfa, A.; Kheirandish-Gozal, L.; Gozal, D. Exosome and macrophage crosstalk in sleep-disordered breathing-induced metabolic dysfunction. Int. J. Mol. Sci. 2018, 19, 3383. [Google Scholar] [CrossRef] [PubMed]
- Villarroya-Beltri, C.; Gutiérrez-Vázquez, C.; Sánchez-Cabo, F.; Pérez-Hernandez, D.; Vázquez, J.; Martín-Cófreces, N.B.; Martínez-Herrera, D.J.; Pascual-Montano, A.; Mittelbrunn, M.; Sánchez-Madrid, F. Sumoylated hnRNPA2B1 controls the sorting of miRNAs into exosomes through binding to specific motifs. Nat. Commun. 2013, 4, 2980. [Google Scholar] [CrossRef] [PubMed]
- Doyle, L.M.; Wang, M.Z. Overview of extracellular vesicles, their origin, composition, purpose, and methods for exosome isolation and analysis. Cells 2019, 8, 727. [Google Scholar] [CrossRef]
- Peng, Q.; Yang, J.-Y.; Zhou, G. Emerging functions and clinical applications of exosomes in human oral diseases. Cell Biosci. 2020, 10, 68. [Google Scholar] [CrossRef]
- Reategui, E.; Van Der Vos, K.E.; Lai, C.P.; Zeinali, M.; Atai, N.A.; Aldikacti, B.; Floyd, F.P.; Khankhel, A.H.; Thapar, V.; Hochberg, F.H.; et al. Engineered nanointerfaces for microfluidic isolation and molecular profiling of tumor-specific extracellular vesicles. Nat. Commun. 2018, 9, 175. [Google Scholar] [CrossRef]
- Broussard, J.L.; Ehrmann, D.A.; Van Cauter, E.; Tasali, E.; Brady, M.J. Impaired insulin signaling in human adipocytes after experimental sleep restriction. Ann. Intern. Med. 2012, 157, 549–557. [Google Scholar] [CrossRef]
- Dinges, D.F.; Whitehouse, W.G.; Orne, E.C.; Orne, M.T. The benefits of a nap during prolonged work and wakefulness. Work Stress 1988, 2, 139–153. [Google Scholar] [CrossRef]
- Koike, N.; Yoo, S.H.; Huang, H.C.; Kumar, V.; Lee, C.; Kim, T.K.; Takahashi, J.S. Transcriptional architecture and chromatin landscape of the core circadian clock in mammals. Science 2012, 338, 349–354. [Google Scholar] [CrossRef]
- Partch, C.L.; Green, C.B.; Takahashi, J.S. Molecular architecture of the mammalian circadian clock. Trends Cell Biol. 2014, 24, 90–99. [Google Scholar] [CrossRef]
- Early, J.O.; Curtis, A.M. Immunometabolism: Is it under the eye of the clock? Semin. Immunol. 2016, 28, 478–490. [Google Scholar] [CrossRef] [PubMed]
- Trott, A.J.; Menet, J.S. Regulation of circadian clock transcriptional output by CLOCK:BMAL1. PLoS Genet. 2018, 14, e1007156. [Google Scholar] [CrossRef] [PubMed]
- Hatanaka, F.; Matsubara, C.; Myung, J.; Yoritaka, T.; Kamimura, N.; Tsutsumi, S.; Kanai, A.; Suzuki, Y.; Sassone-Corsi, P.; Aburatani, H.; et al. Genome-wide profiling of the core clock protein BMAL1 targets reveals a strict relationship with metabolism. Mol. Cell. Biol. 2010, 30, 5636–5648. [Google Scholar] [CrossRef] [PubMed]
- Rey, G.; Cesbron, F.; Rougemont, J.; Reinke, H.; Brunner, M.; Naef, F. Genome-wide and phase-specific DNA-binding rhythms of BMAL1 control circadian output functions in mouse liver. PLoS Biol. 2011, 9, e1000595. [Google Scholar] [CrossRef]
- Hakola, T.; Härmä, M.; Laitinen, J.T. Circadian adjustment of men and women to night work. Scand. J. Work. Environ. Health 1996, 22, 133–138. [Google Scholar] [CrossRef]
- Härmä, M. Ageing, physical fitness and shiftwork tolerance. Appl. Ergon. 1996, 27, 25–29. [Google Scholar] [CrossRef]
- Denzer, K.; Kleijmeer, M.J.; Heijnen, H.F.; Stoorvogel, W.; Geuze, H.J. Exosome: From internal vesicle of the multivesicular body to intercellular signaling device. J. Cell Sci. 2000, 113, 3365–3374. [Google Scholar]
- Arendtw, J. Shift work: Coping with the biological clock. Occup. Med. 2010, 60, 10–20. [Google Scholar] [CrossRef]
- Kerkhof, G.A.; Van Dongen, H.P. Morning-type and evening-type individuals differ in the phase position of their endogenous circadian oscillator. Neurosci. Lett. 1996, 218, 153–156. [Google Scholar] [CrossRef]
- Cui, J.; Shi, M.; Xie, D.; Wei, D.; Jia, Z.; Zheng, S.; Gao, Y.; Huang, S.; Xie, K. FOXM1 promotes the warburg effect and pancreatic cancer progression via transactivation of LDHA expression. Clin. Cancer Res. 2014, 20, 2595–2606. [Google Scholar] [CrossRef]
- Makinoshima, H.; Takita, M.; Matsumoto, S.; Yagishita, A.; Owada, S.; Esumi, H.; Tsuchihara, K. Epidermal growth factor receptor (EGFR) signaling regulates global metabolic pathways in EGFR-mutated lung adenocarcinoma. J. Biol. Chem. 2014, 289, 20813–20823. [Google Scholar] [CrossRef]
- Leproult, R.; Holmb??ck, U.; Van Cauter, E. Circadian misalignment augments markers of insulin resistance and inflammation, independently of sleep loss. Diabetes 2014, 63, 1860–1869. [Google Scholar] [CrossRef]
- Wefers, J.; Van Moorsel, D.; Hansen, J.; Connell, N.J.; Havekes, B.; Hoeks, J.; Lichtenbelt, W.D.V.M.; Duez, H.; Phielix, E.; Kalsbeek, A.; et al. Circadian misalignment induces fatty acid metabolism gene profiles and compromises insulin sensitivity in human skeletal muscle. Proc. Natl. Acad. Sci. USA 2018, 115, 7789–7794. [Google Scholar] [CrossRef] [PubMed]
- Coumans, F.A.; Brisson, A.R.; Buzás, E.; Dignat-George, F.; Drees, E.E.; Andaloussi, S.E.L.; Emanueli, C.; Gasecka, A.; Hendrix, A.; Hill, A.F.; et al. Methodological guidelines to study extracellular vesicles. Circ. Res. 2017, 120, 1632–1648. [Google Scholar] [CrossRef] [PubMed]
- Khalyfa, A.; Khalyfa, A.A.; Akbarpour, M.; Connes, P.; Romana, M.; Lapping-Carr, G.; Zhang, C.; Andrade, J.; Gozal, D. Extracellular microvesicle microRNAs in children with sickle cell anaemia with divergent clinical phenotypes. Br. J. Haematol. 2016, 174, 786–798. [Google Scholar] [CrossRef]
- Khalyfa, A.; Zhang, C.; Khalyfa, A.A.; Foster, G.E.; Beaudin, A.E.; Andrade, J.; Hanly, P.J.; Poulin, M.J.; Gozal, D. Effect on intermittent hypoxia on plasma exosomal micro RNA signature and endothelial function in healthy adults. Sleep 2016, 39, 2077–2090. [Google Scholar] [CrossRef]
- Yagita, K.; Okamura, H. Forskolin induces circadian gene expression of rPer1, rPer2 and dbp in mammalian rat-1 fibroblasts. FEBS Lett. 2000, 465, 79–82. [Google Scholar] [CrossRef]
- Dennis, C. Genomics: Compare and contrast. Nature 2003, 426, 750–751. [Google Scholar] [CrossRef] [PubMed][Green Version]
- Ritchie, M.E.; Silver, J.D.; Oshlack, A.; Holmes, M.; Diyagama, D.; Holloway, A.; Smyth, G.K. A comparison of background correction methods for two-colour microarrays. Bioinformatics 2007, 23, 2700–2707. [Google Scholar] [CrossRef]
- Bolstad, B.; Irizarry, R.A.; Astrand, M.; Speed, T. A comparison of normalization methods for high density oligonucleotide array data based on variance and bias. Bioinformatics 2003, 19, 185–193. [Google Scholar] [CrossRef]
- Subramanian, A.; Tamayo, P.; Mootha, V.K.; Mukherjee, S.; Ebert, B.L.; Gillette, M.A.; Paulovich, A.; Pomeroy, S.L.; Golub, T.R.; Lander, E.S.; et al. Gene set enrichment analysis: A knowledge-based approach for interpreting genome-wide expression profiles. Proc. Natl. Acad. Sci. USA 2005, 102, 15545–15550. [Google Scholar] [CrossRef] [PubMed]
- Liberzon, A.; Birger, C.; Thorvaldsdottir, H.; Ghandi, M.; Mesirov, J.P.; Tamayo, P. The molecular signatures database hallmark gene set collection. Cell Syst. 2015, 1, 417–425. [Google Scholar] [CrossRef] [PubMed]
- Mikulich-Gilbertson, S.K.; Zerbe, G.O.; Jones, R.H.; Crowley, T.J. Comparing linear and nonlinear mixed model approaches to cosinor analysis. Stat. Med. 2003, 22, 3195–3211. [Google Scholar] [CrossRef] [PubMed]
- Skornyakov, E.; Gaddameedhi, S.; Paech, G.M.; Sparrow, A.R.; Satterfield, B.C.; Shattuck, N.L.; Layton, M.E.; Karatsoreos, I.; Van Dongen, H.P.A. Cardiac autonomic activity during simulated shift work. Ind. Health 2019, 57, 118–132. [Google Scholar] [CrossRef] [PubMed]


© 2020 by the authors. Licensee MDPI, Basel, Switzerland. This article is an open access article distributed under the terms and conditions of the Creative Commons Attribution (CC BY) license (http://creativecommons.org/licenses/by/4.0/).
Share and Cite
Khalyfa, A.; Gaddameedhi, S.; Crooks, E.; Zhang, C.; Li, Y.; Qiao, Z.; Trzepizur, W.; Kay, S.A.; Andrade, J.; Satterfield, B.C.; et al. Circulating Exosomal miRNAs Signal Circadian Misalignment to Peripheral Metabolic Tissues. Int. J. Mol. Sci. 2020, 21, 6396. https://doi.org/10.3390/ijms21176396
Khalyfa A, Gaddameedhi S, Crooks E, Zhang C, Li Y, Qiao Z, Trzepizur W, Kay SA, Andrade J, Satterfield BC, et al. Circulating Exosomal miRNAs Signal Circadian Misalignment to Peripheral Metabolic Tissues. International Journal of Molecular Sciences. 2020; 21(17):6396. https://doi.org/10.3390/ijms21176396
Chicago/Turabian StyleKhalyfa, Abdelnaby, Shobhan Gaddameedhi, Elena Crooks, Chunling Zhang, Yan Li, Zhuanhong Qiao, Wojciech Trzepizur, Steve A. Kay, Jorge Andrade, Brieann C. Satterfield, and et al. 2020. "Circulating Exosomal miRNAs Signal Circadian Misalignment to Peripheral Metabolic Tissues" International Journal of Molecular Sciences 21, no. 17: 6396. https://doi.org/10.3390/ijms21176396
APA StyleKhalyfa, A., Gaddameedhi, S., Crooks, E., Zhang, C., Li, Y., Qiao, Z., Trzepizur, W., Kay, S. A., Andrade, J., Satterfield, B. C., Hansen, D. A., Kheirandish-Gozal, L., Van Dongen, H. P. A., & Gozal, D. (2020). Circulating Exosomal miRNAs Signal Circadian Misalignment to Peripheral Metabolic Tissues. International Journal of Molecular Sciences, 21(17), 6396. https://doi.org/10.3390/ijms21176396