Proteomic Characterization of the Olfactory Molecular Imbalance in Dementia with Lewy Bodies

 , ,
, , 

Abstract
1. Introduction
2. Results and Discussion
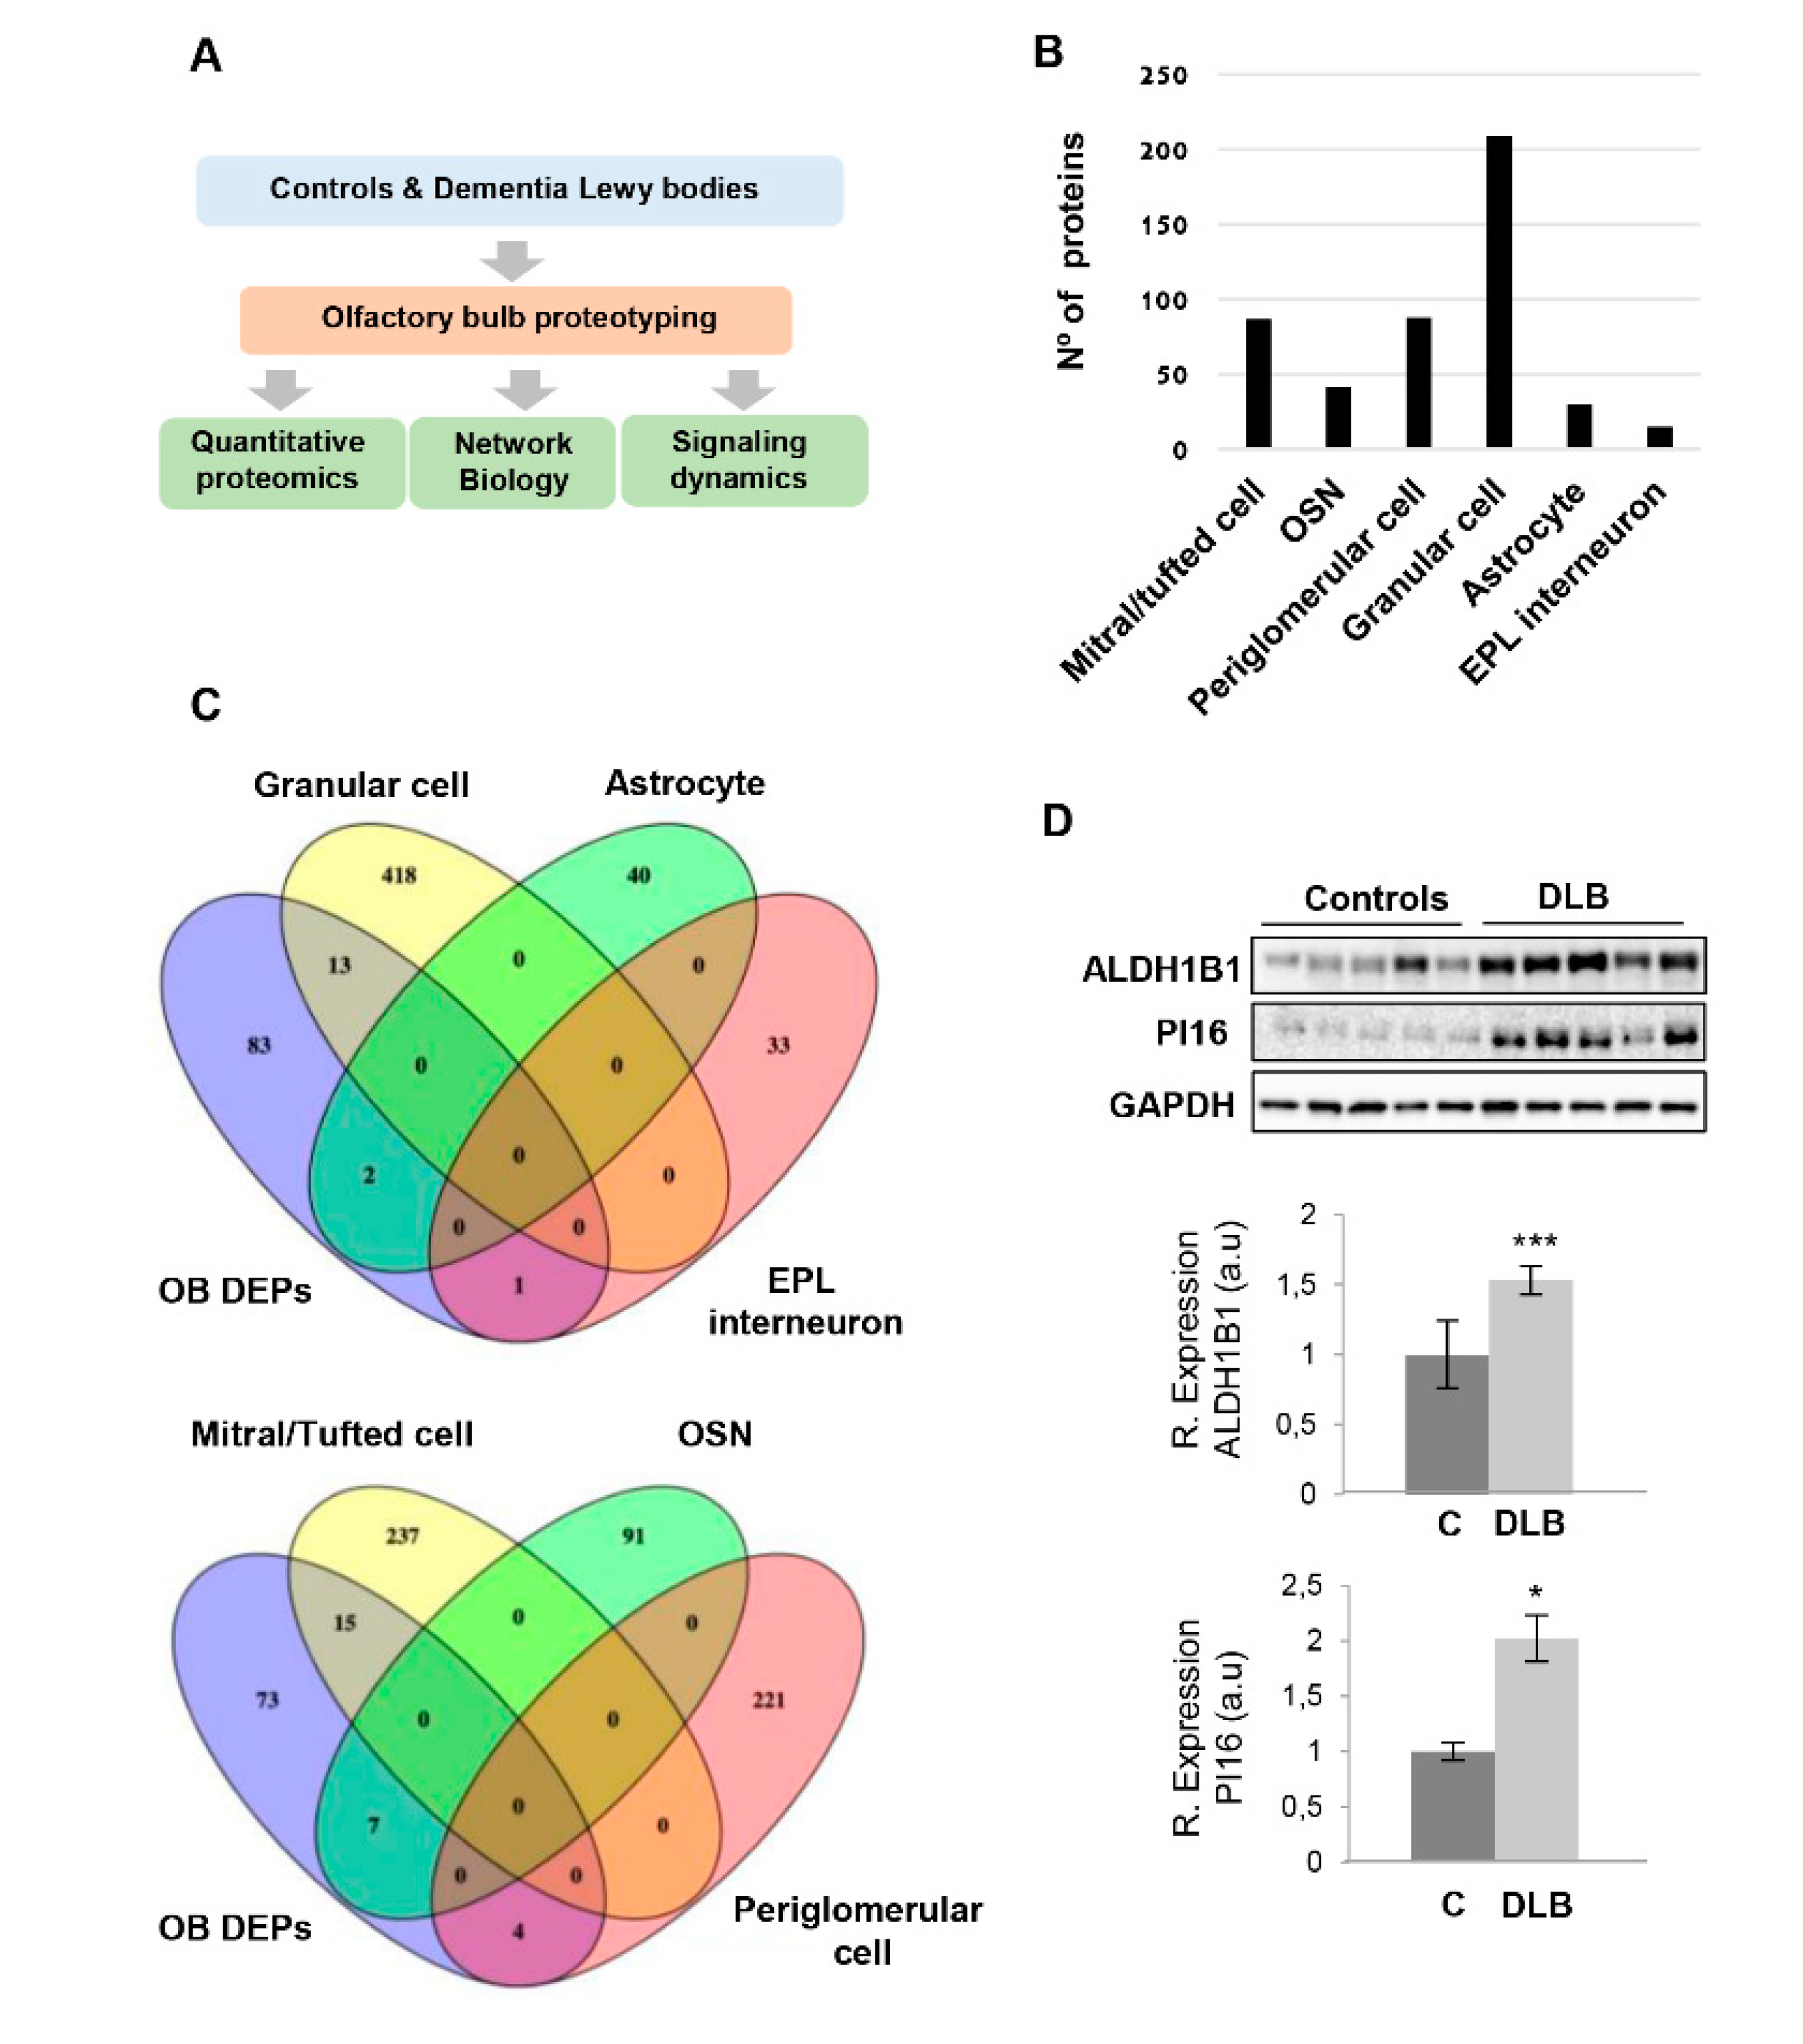
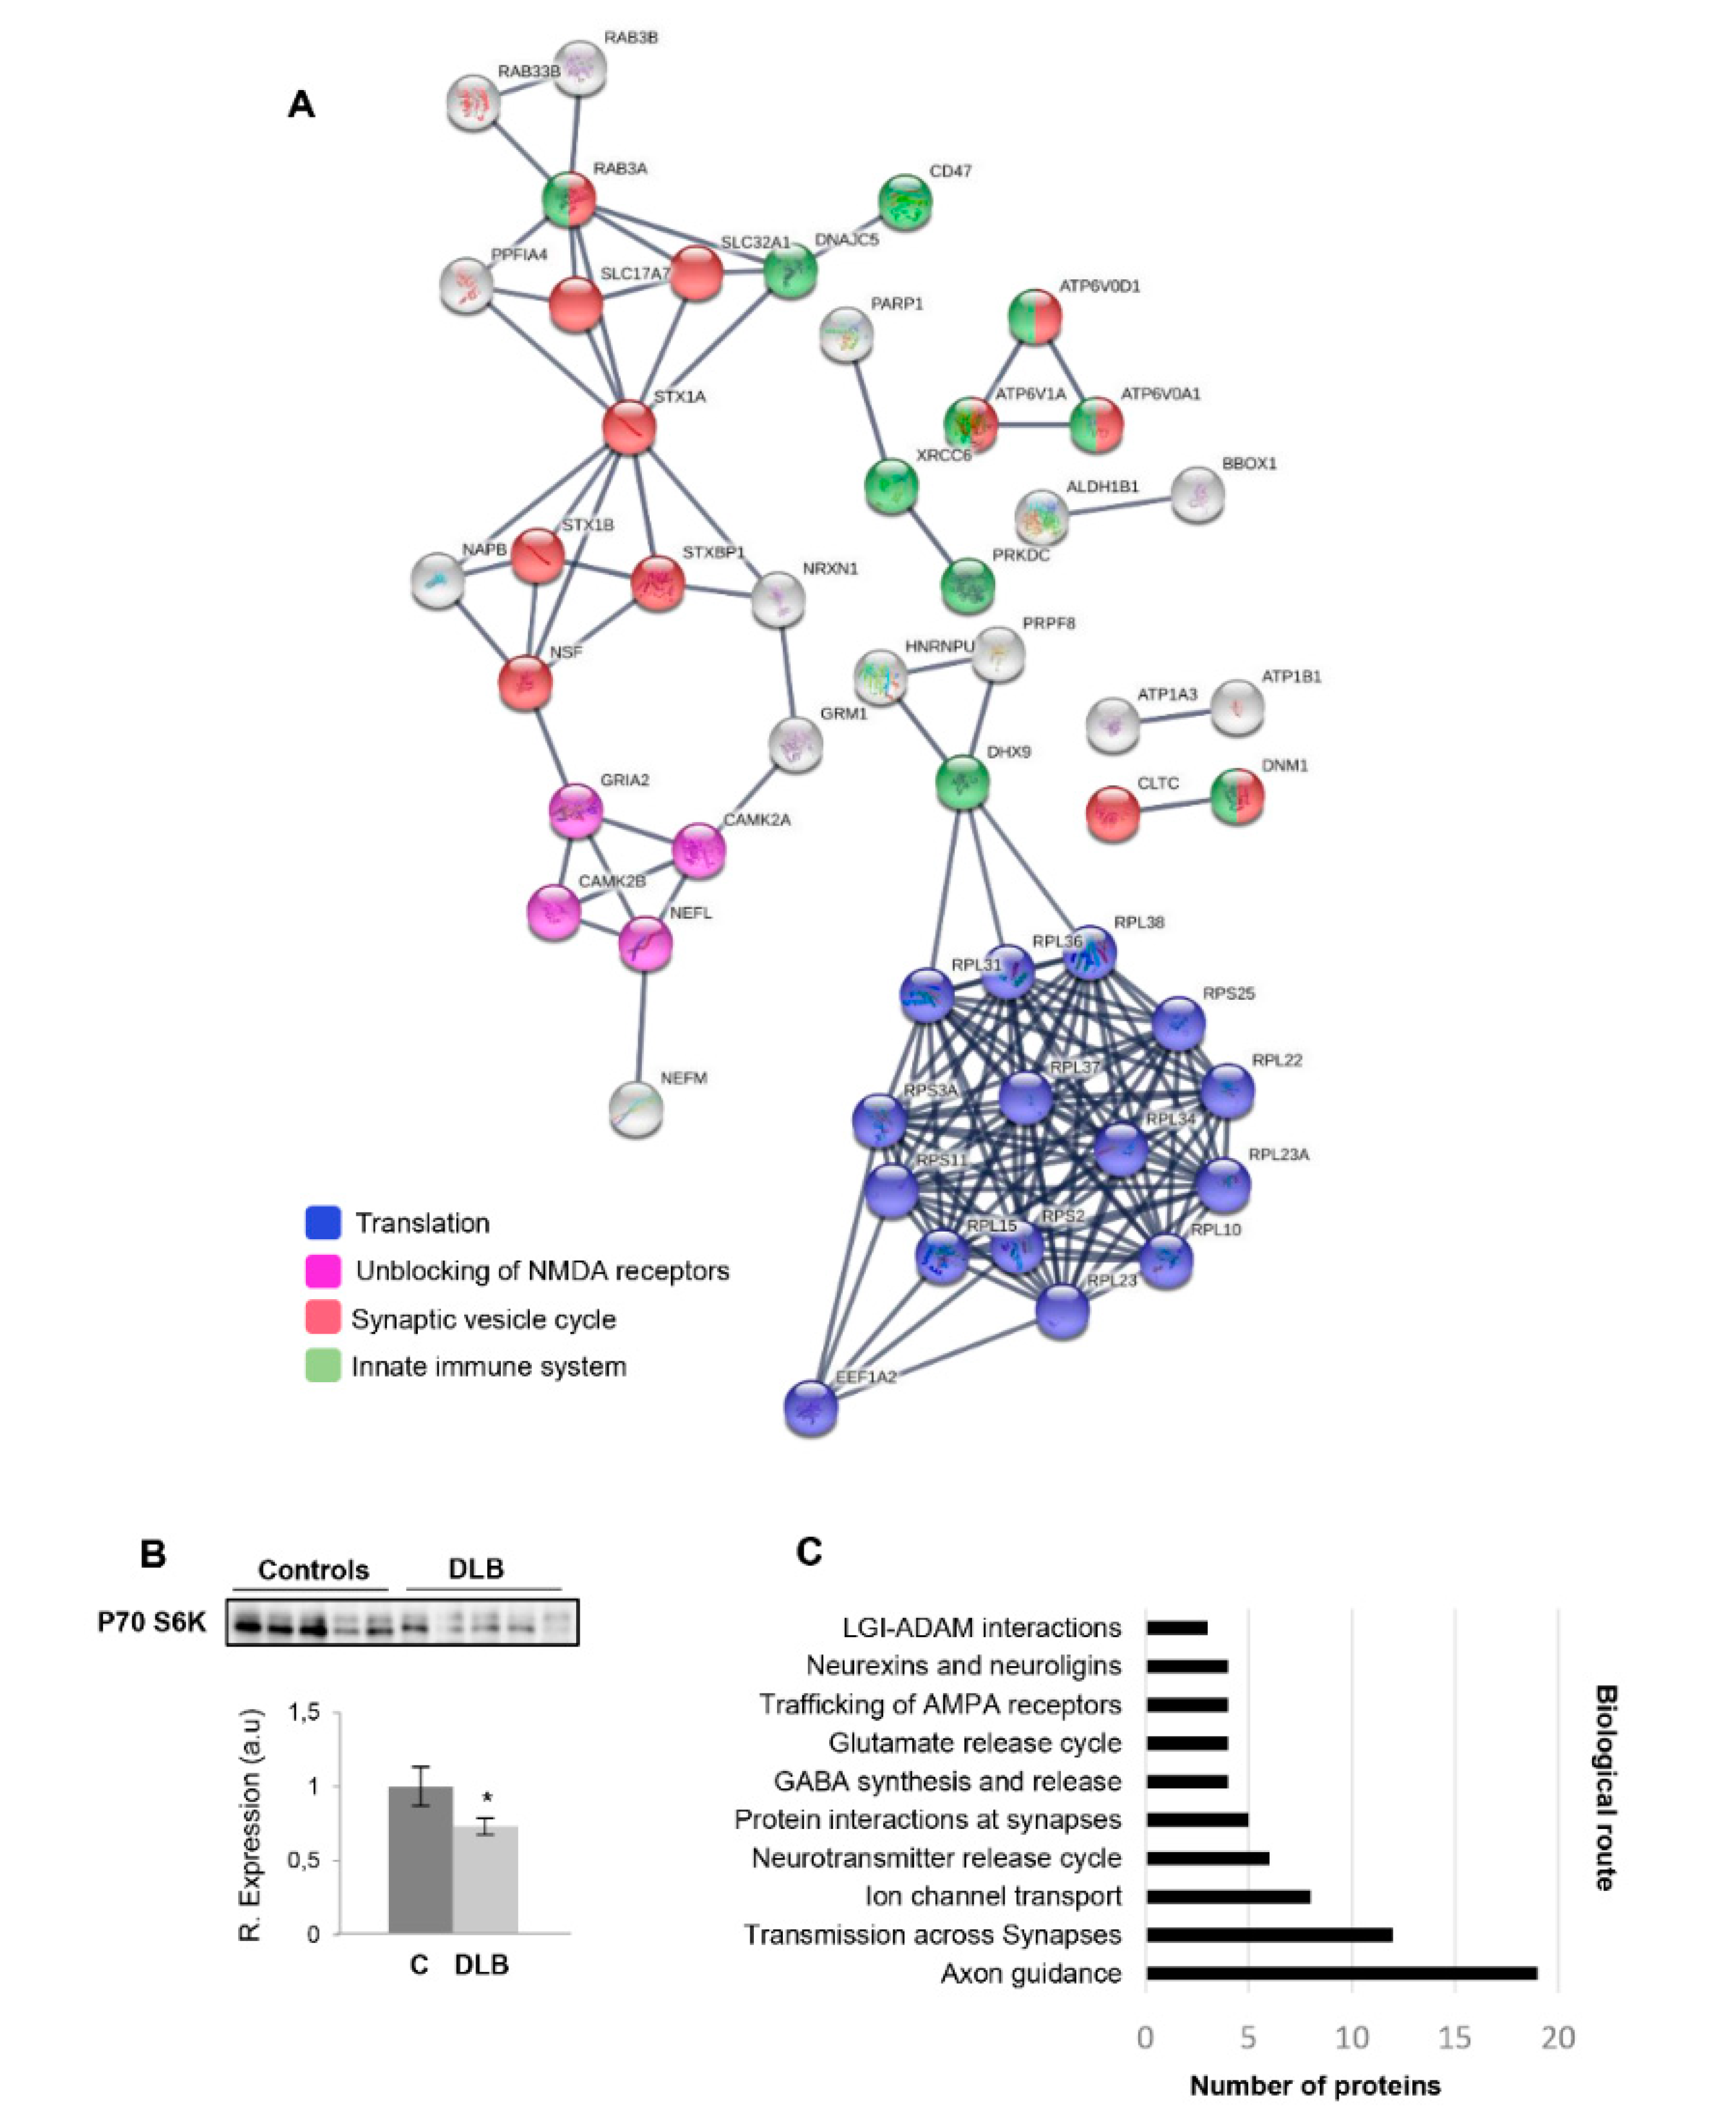
2.1. Olfactory Protein Translation and Synaptic Function are Impaired in DLB
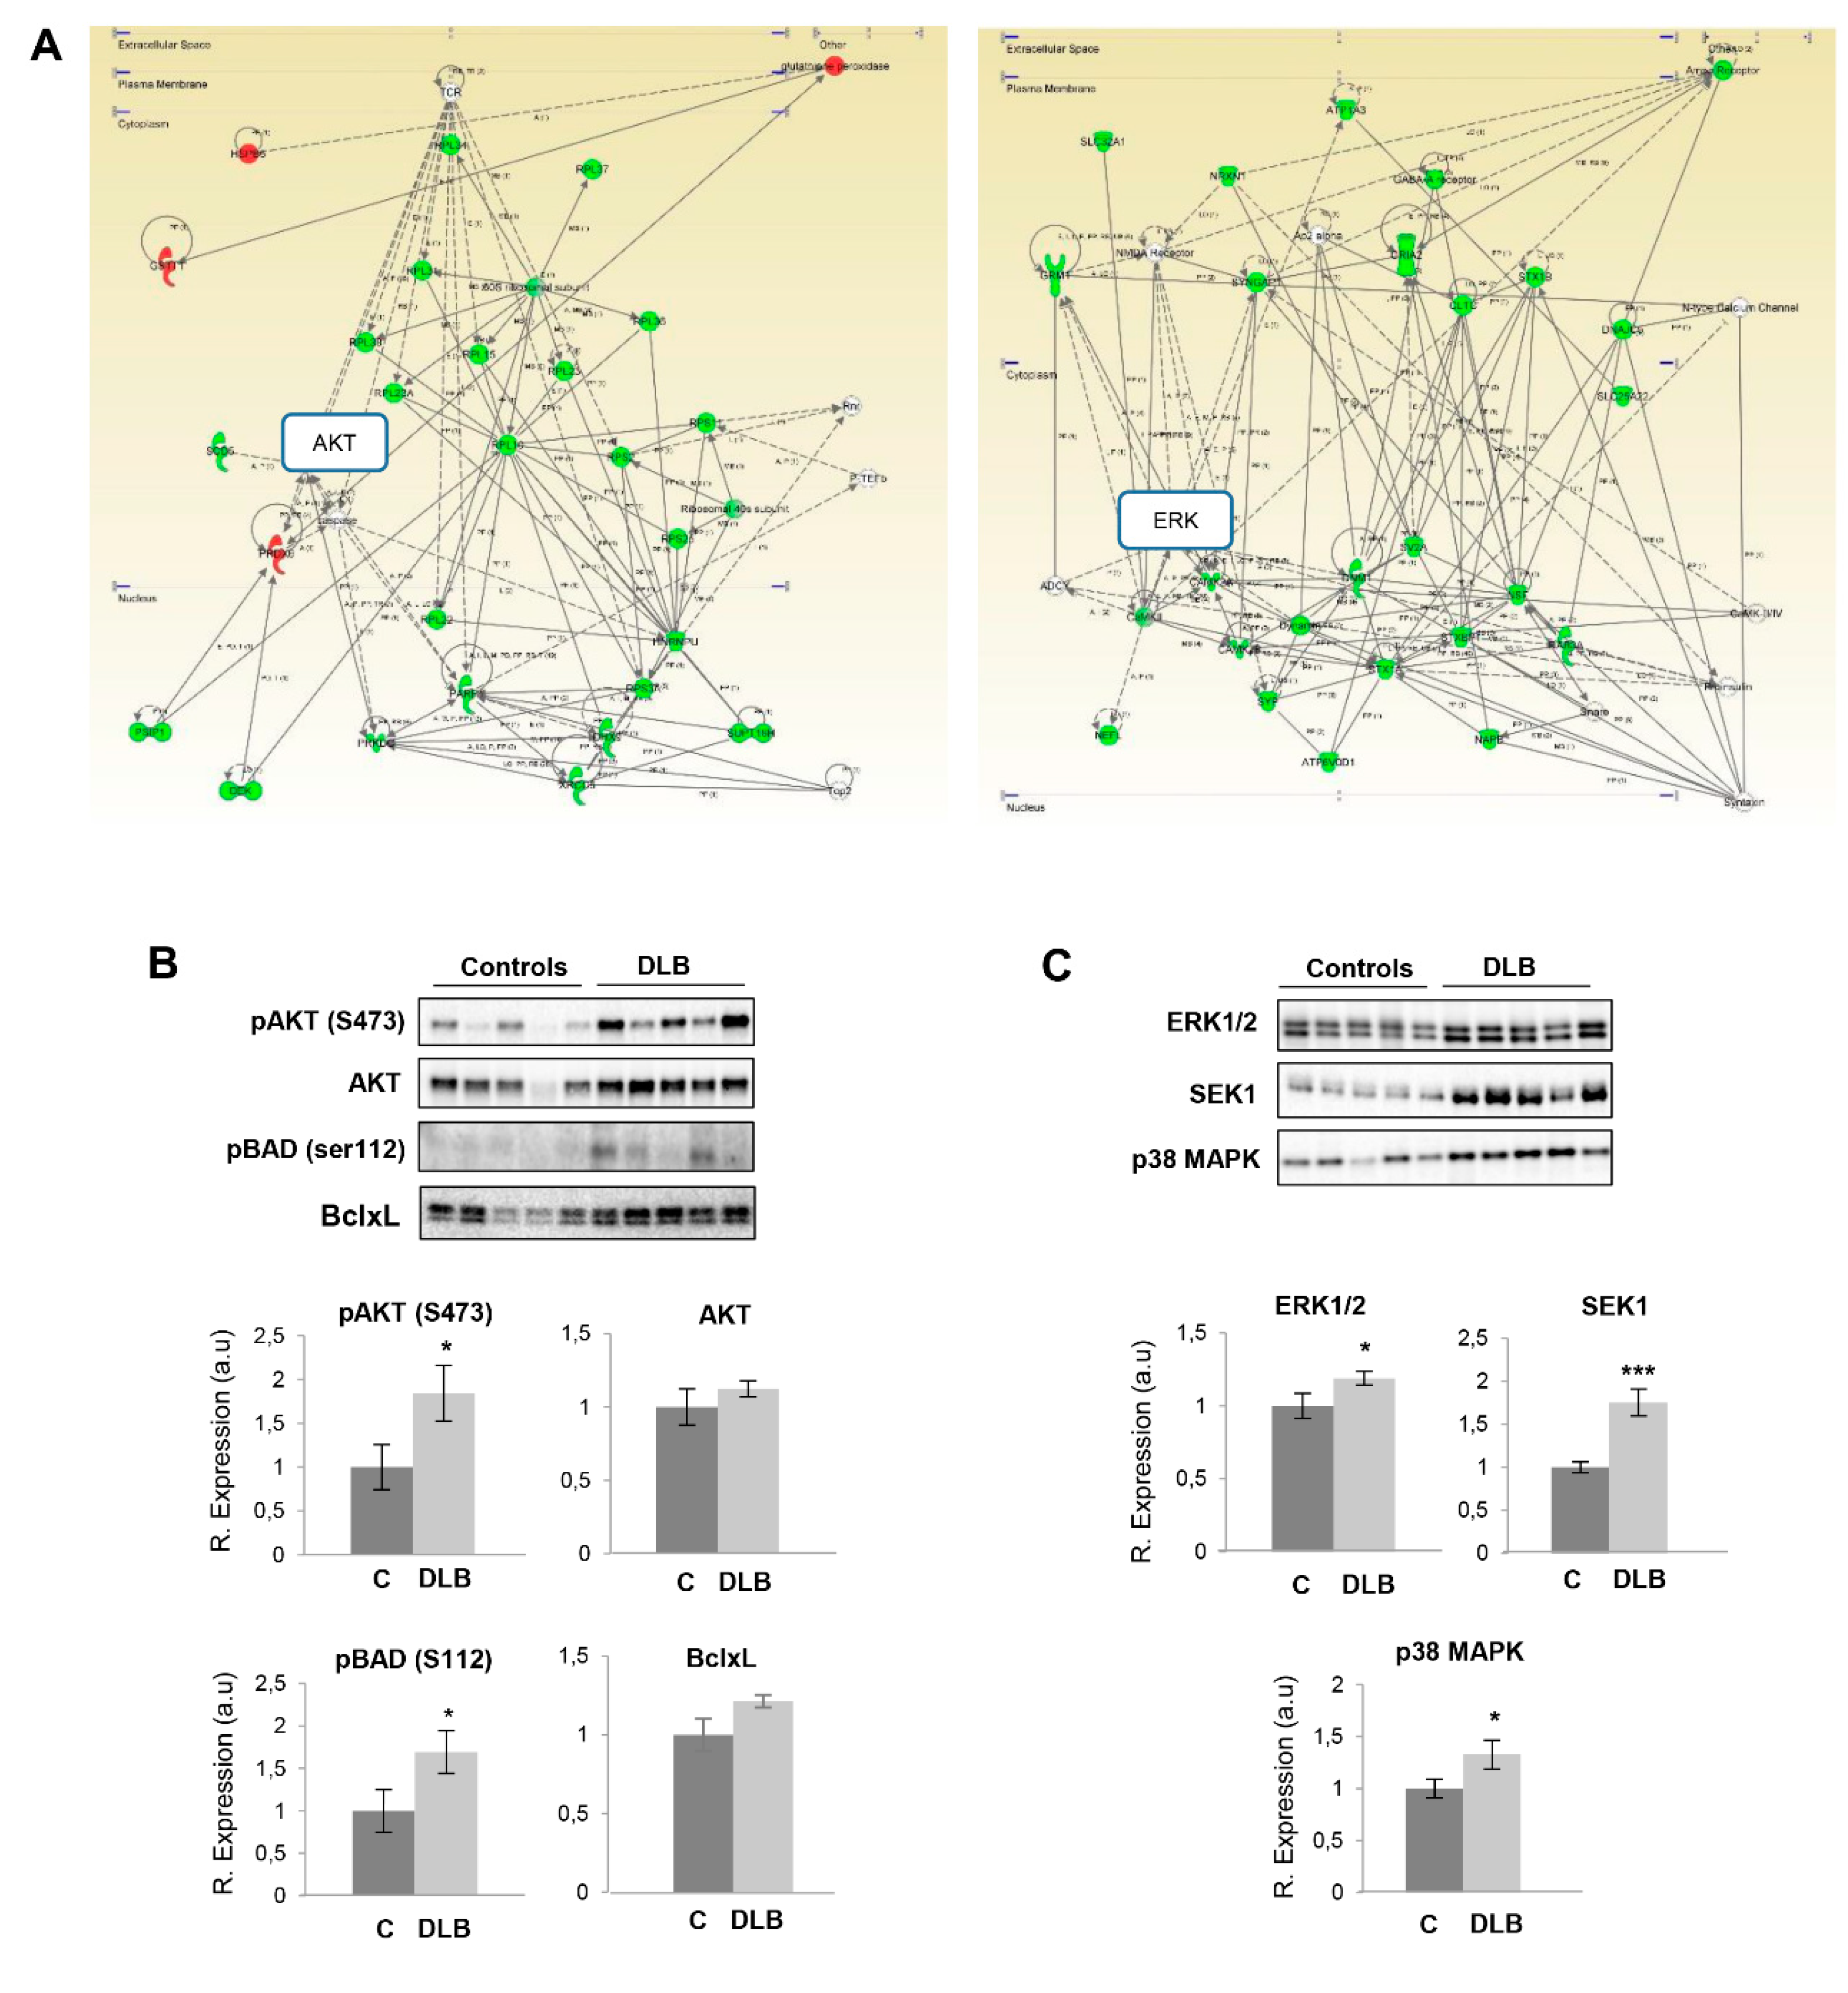
2.2. Specific Olfactory Derangements in Survival Pathways in DLB
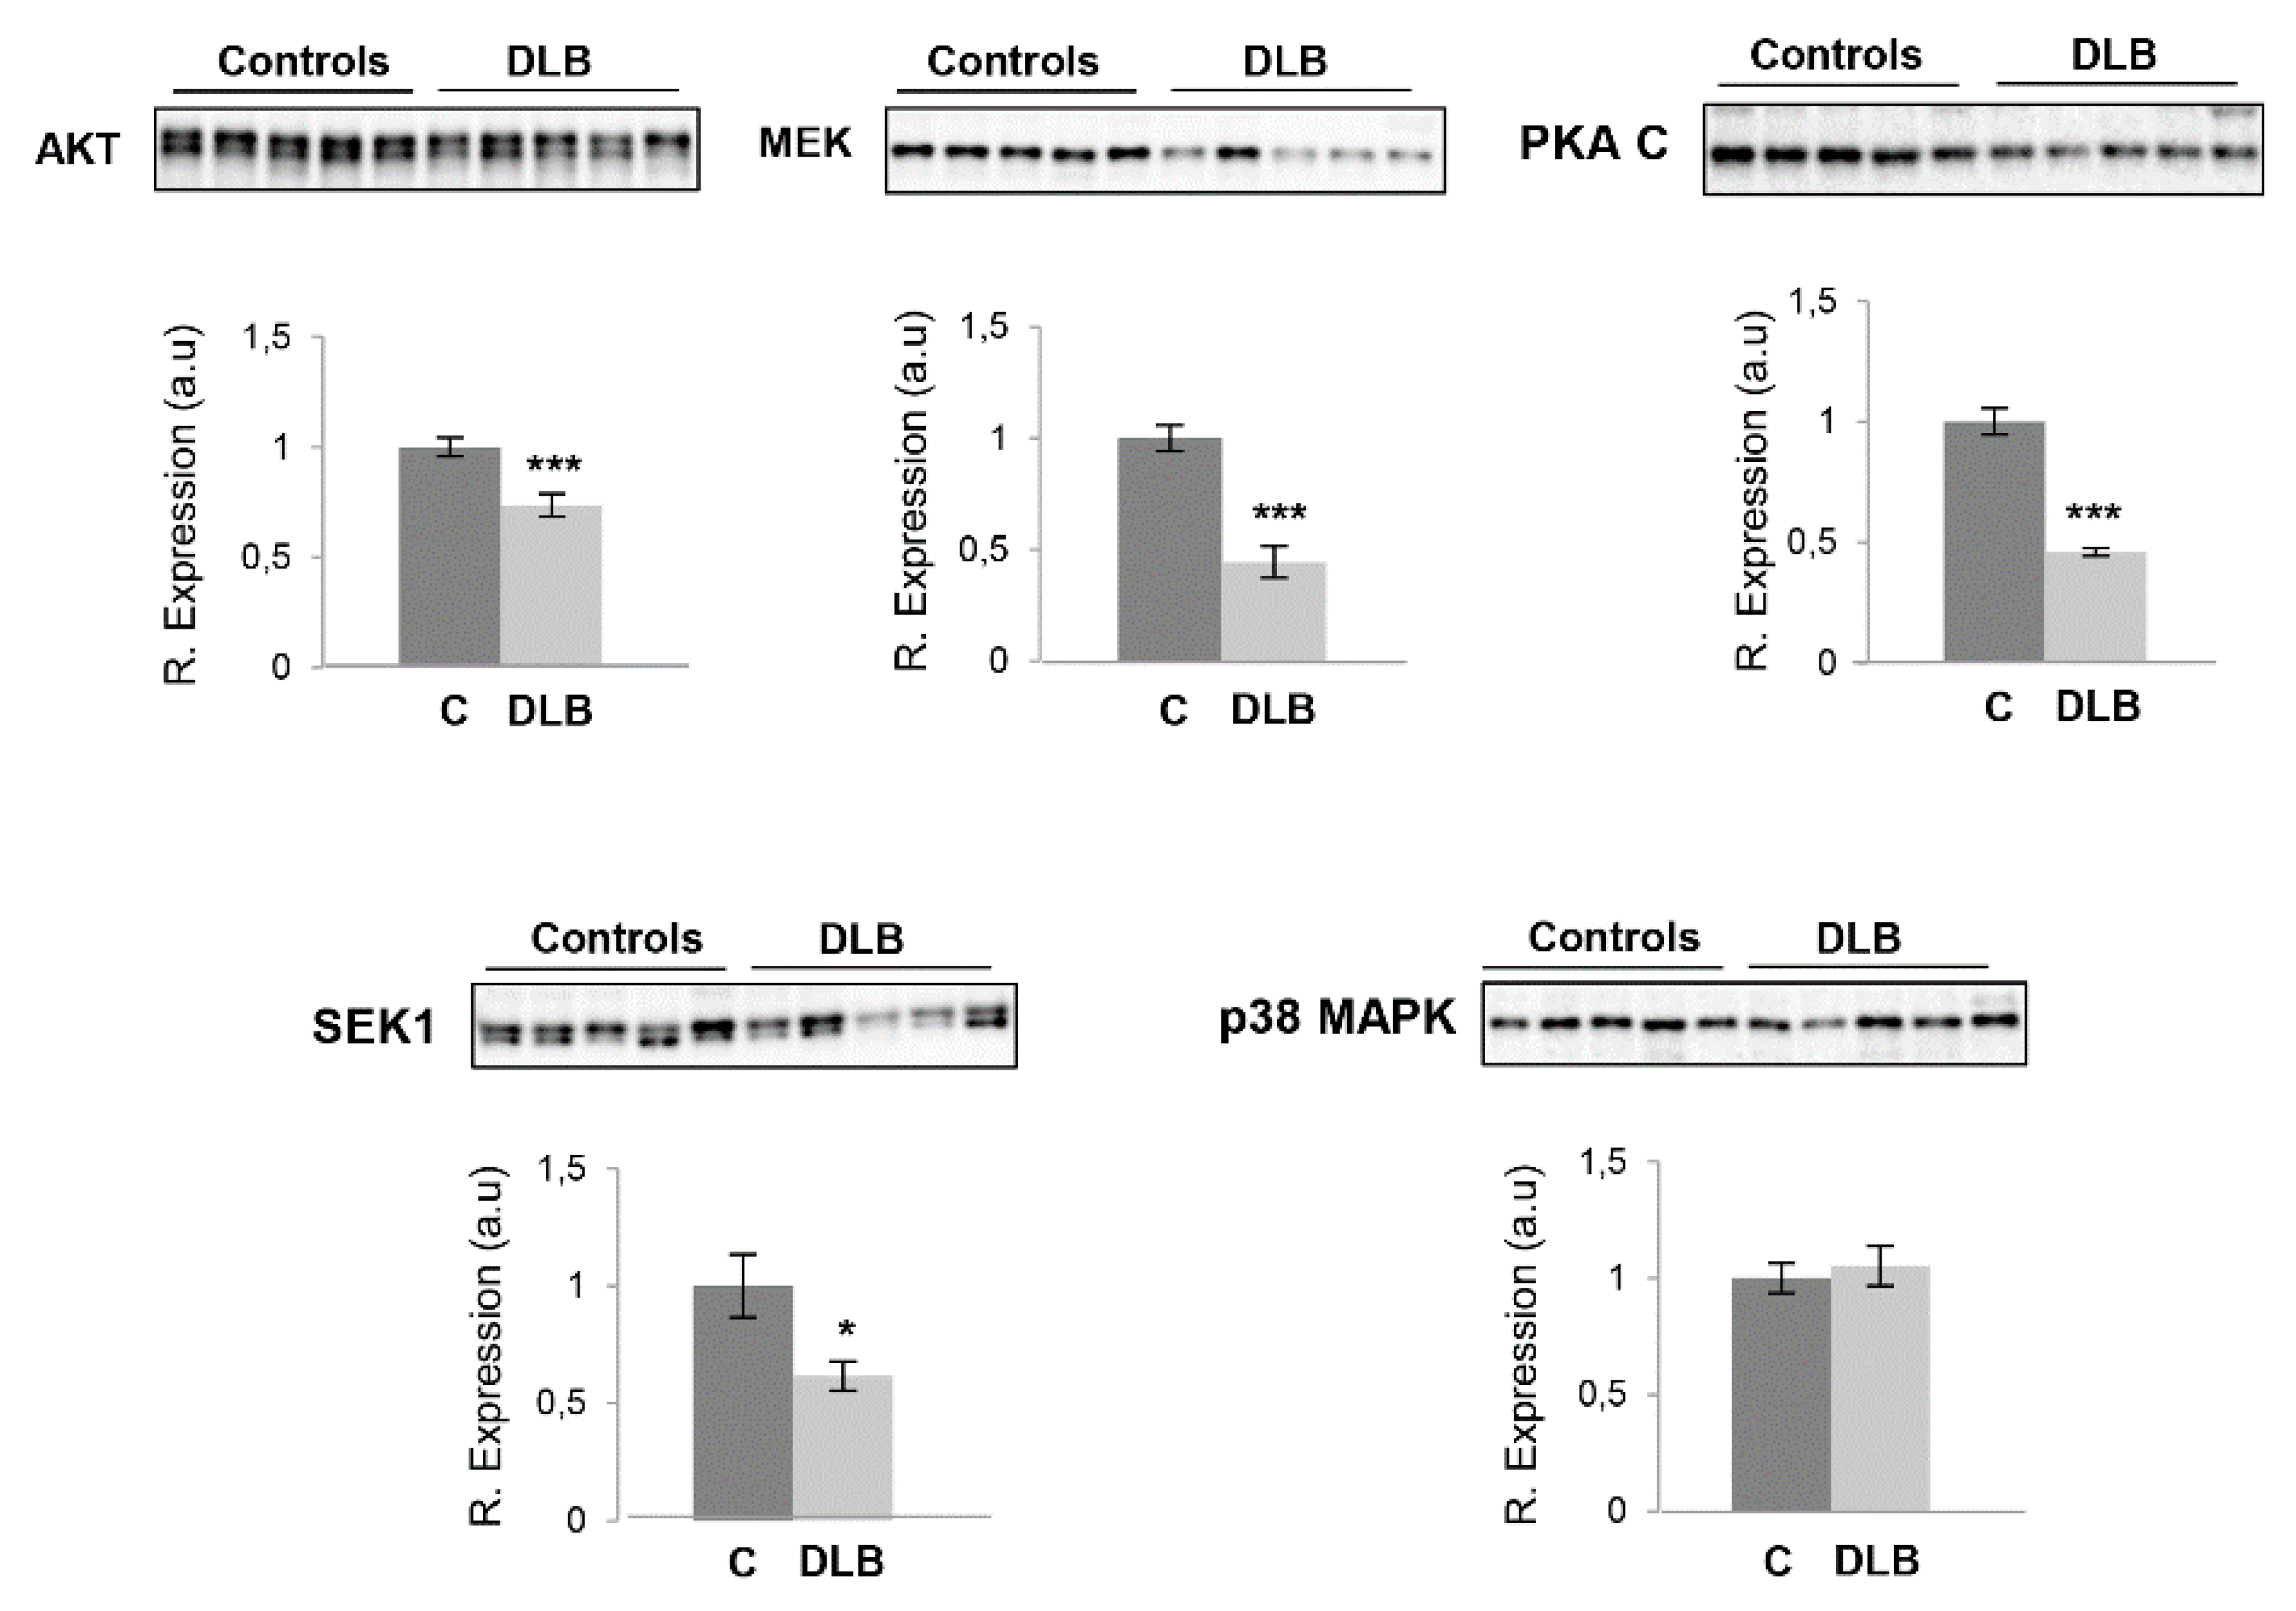
2.3. Survival Kinome Differs across the OB–OT Axis in DLB
3. Materials and Methods
3.1. Materials
3.2. Human Samples
3.3. Sample Preparation for Proteomic Analysis
3.4. Reduction, Alkylation, Digestion and TMT Labeling
3.5. Off-Gel Electrophoresis and LC-MS/MS Analysis
3.6. Protein Identification and Quantification
3.7. Bioinformatics
3.8. Western-Blotting
4. Conclusions
Supplementary Materials
Author Contributions
Funding
Acknowledgments
Conflicts of Interest
Abbreviations
| AD | Alzheimer’s disease |
| BAD | Bcl2-associated agonist of cell death |
| CAMK II | Calmodulin-dependent protein kinase II |
| DLB | Dementia with lewy bodies |
| ERK | Extracellular signal-regulated kinase |
| FDR | False discovery rate |
| MEK | Mitogen-activated protein kinase kinase |
| MKK3 | Dual specificity mitogen-activated protein kinase kinase 3 |
| MKK6 | Dual specificity mitogen-activated protein kinase kinase 6 |
| OB/OT | Olfactory bulb/olfactory tract |
| P70 S6K | P70 S6K beta (Ribosomal protein S6 kinase beta |
| PD | Parkinson’s disease |
| PDD | Parkinson’s disease dementia |
| PSP | Progressive supranuclear palsy |
| PKA | Protein kinase A |
| PKC | Protein kinase C |
| p38 MAPK | p38 mitogen-activated protein kinase |
| PMI | Post-mortem interval |
| SAPK/JNK | Stress-activated protein kinase/Jun-amino terminal kinase |
| SEK1 | Mitogen-activated protein kinase Kinase 4 |
References
- McRitchie, D.A.; Reid, W.G.; Halliday, G.M.; Hely, M.A.; Brooks, W.S.; Morris, J.G. Neuropathology of three clinical cases prospectively diagnosed as dementia with Lewy bodies. J. Clin. Neurosci. 1999, 6, 149–154. [Google Scholar] [CrossRef]
- McKeith, I.G.; Dickson, D.W.; Lowe, J.; Emre, M.; O’Brien, J.T.; Feldman, H.; Cummings, J.; Duda, J.E.; Lippa, C.; Perry, E.K.; et al. Diagnosis and management of dementia with Lewy bodies: Third report of the DLB Consortium. Neurology 2005, 65, 1863–1872. [Google Scholar] [CrossRef] [PubMed]
- McKeith, I.G.; Galasko, D.; Kosaka, K.; Perry, E.K.; Dickson, D.W.; Hansen, L.A.; Salmon, D.P.; Lowe, J.; Mirra, S.S.; Byrne, E.J.; et al. Consensus guidelines for the clinical and pathologic diagnosis of dementia with Lewy bodies (DLB): Report of the consortium on DLB international workshop. Neurology 1996, 47, 1113–1124. [Google Scholar] [CrossRef] [PubMed]
- McKeith, I.; Mintzer, J.; Aarsland, D.; Burn, D.; Chiu, H.; Cohen-Mansfield, J.; Dickson, D.; Dubois, B.; Duda, J.E.; Feldman, H.; et al. Dementia with Lewy bodies. Lancet Neurol. 2004, 3, 19–28. [Google Scholar] [CrossRef]
- Mayo, M.C.; Bordelon, Y. Dementia with Lewy bodies. Semin. Neurol. 2014, 34, 182–188. [Google Scholar] [CrossRef]
- Fujishiro, H.; Nakamura, S.; Sato, K.; Iseki, E. Prodromal dementia with Lewy bodies. Geriatr. Gerontol. Int. 2015, 15, 817–826. [Google Scholar] [CrossRef]
- Donaghy, P.C.; O’Brien, J.T.; Thomas, A.J. Prodromal dementia with Lewy bodies. Psychol. Med. 2015, 45, 259–268. [Google Scholar] [CrossRef]
- Doty, R.L. Olfactory dysfunction in neurodegenerative diseases: Is there a common pathological substrate? Lancet Neurol. 2017, 16, 478–488. [Google Scholar] [CrossRef]
- Attems, J.; Walker, L.; Jellinger, K.A. Olfactory bulb involvement in neurodegenerative diseases. Acta Neuropathol. 2014, 127, 459–475. [Google Scholar] [CrossRef]
- Westervelt, H.J.; Bruce, J.M.; Faust, M.A. Distinguishing Alzheimer’s disease and dementia with Lewy bodies using cognitive and olfactory measures. Neuropsychology 2016, 30, 304–311. [Google Scholar] [CrossRef]
- Westervelt, H.J.; Stern, R.A.; Tremont, G. Odor identification deficits in diffuse lewy body disease. Cogn. Behav. Neurol. 2003, 16, 93–99. [Google Scholar] [CrossRef] [PubMed]
- Yoo, H.S.; Jeon, S.; Chung, S.J.; Yun, M.; Lee, P.H.; Sohn, Y.H.; Evans, A.C.; Ye, B.S. Olfactory dysfunction in Alzheimer’s disease- and Lewy body-related cognitive impairment. Alzheimers Dement 2018, 14, 1243–1252. [Google Scholar] [CrossRef]
- Yoon, J.H.; Kim, M.; Moon, S.Y.; Yong, S.W.; Hong, J.M. Olfactory function and neuropsychological profile to differentiate dementia with Lewy bodies from Alzheimer’s disease in patients with mild cognitive impairment: A 5-year follow-up study. J. Neurol. Sci. 2015, 355, 174–179. [Google Scholar] [CrossRef] [PubMed]
- Beach, T.G.; Adler, C.H.; Zhang, N.; Serrano, G.E.; Sue, L.I.; Driver-Dunckley, E.; Mehta, S.H.; Zamrini, E.E.; Sabbagh, M.N.; Shill, H.A.; et al. Severe hyposmia distinguishes neuropathologically confirmed dementia with Lewy bodies from Alzheimer’s disease dementia. PLoS ONE 2020, 15, e0231720. [Google Scholar] [CrossRef]
- Wilson, R.S.; Yu, L.; Schneider, J.A.; Arnold, S.E.; Buchman, A.S.; Bennett, D.A. Lewy bodies and olfactory dysfunction in old age. Chem. Senses 2011, 36, 367–373. [Google Scholar] [CrossRef]
- McShane, R.H.; Nagy, Z.; Esiri, M.M.; King, E.; Joachim, C.; Sullivan, N.; Smith, A.D. Anosmia in dementia is associated with Lewy bodies rather than Alzheimer’s pathology. J. Neurol. Neurosurg. Psychiatry 2001, 70, 739–743. [Google Scholar] [CrossRef] [PubMed]
- Fujishiro, H.; Ferman, T.J.; Boeve, B.F.; Smith, G.E.; Graff-Radford, N.R.; Uitti, R.J.; Wszolek, Z.K.; Knopman, D.S.; Petersen, R.C.; Parisi, J.E.; et al. Validation of the neuropathologic criteria of the third consortium for dementia with Lewy bodies for prospectively diagnosed cases. J. Neuropathol. Exp. Neurol. 2008, 67, 649–656. [Google Scholar] [CrossRef] [PubMed]
- Goedert, M. Alpha-synuclein and neurodegenerative diseases. Nat. Rev. Neurosci. 2001, 2, 492–501. [Google Scholar] [CrossRef]
- Hasegawa, M.; Fujiwara, H.; Nonaka, T.; Wakabayashi, K.; Takahashi, H.; Lee, V.M.; Trojanowski, J.Q.; Mann, D.; Iwatsubo, T. Phosphorylated alpha-synuclein is ubiquitinated in alpha-synucleinopathy lesions. J. Biol. Chem. 2002, 277, 49071–49076. [Google Scholar] [CrossRef]
- Mukaetova-Ladinska, E.B.; McKeith, I.G. Pathophysiology of synuclein aggregation in Lewy body disease. Mech. Ageing Dev. 2006, 127, 188–202. [Google Scholar] [CrossRef]
- Spillantini, M.G.; Crowther, R.A.; Jakes, R.; Hasegawa, M.; Goedert, M. Alpha-Synuclein in filamentous inclusions of Lewy bodies from Parkinson’s disease and dementia with lewy bodies. Proc. Natl. Acad. Sci. USA 1998, 95, 6469–6473. [Google Scholar] [CrossRef] [PubMed]
- McKeith, I.G.; Boeve, B.F.; Dickson, D.W.; Halliday, G.; Taylor, J.P.; Weintraub, D.; Aarsland, D.; Galvin, J.; Attems, J.; Ballard, C.G.; et al. Diagnosis and management of dementia with Lewy bodies: Fourth consensus report of the DLB Consortium. Neurology 2017, 89, 88–100. [Google Scholar] [CrossRef]
- Emre, M.; Aarsland, D.; Brown, R.; Burn, D.J.; Duyckaerts, C.; Mizuno, Y.; Broe, G.A.; Cummings, J.; Dickson, D.W.; Gauthier, S.; et al. Clinical diagnostic criteria for dementia associated with Parkinson’s disease. Mov. Disord. 2007, 22, 1689–1707. [Google Scholar] [CrossRef] [PubMed]
- Beach, T.G.; White, C.L., 3rd; Hladik, C.L.; Sabbagh, M.N.; Connor, D.J.; Shill, H.A.; Sue, L.I.; Sasse, J.; Bachalakuri, J.; Henry-Watson, J.; et al. Olfactory bulb alpha-synucleinopathy has high specificity and sensitivity for Lewy body disorders. Acta Neuropathol. 2009, 117, 169–174. [Google Scholar] [CrossRef] [PubMed]
- Silveira-Moriyama, L.; Holton, J.L.; Kingsbury, A.; Ayling, H.; Petrie, A.; Sterlacci, W.; Poewe, W.; Maier, H.; Lees, A.J.; Revesz, T. Regional differences in the severity of Lewy body pathology across the olfactory cortex. Neurosci. Lett. 2009, 453, 77–80. [Google Scholar] [CrossRef] [PubMed]
- Braak, H.; Del Tredici, K.; Rub, U.; de Vos, R.A.; Jansen Steur, E.N.; Braak, E. Staging of brain pathology related to sporadic Parkinson’s disease. Neurobiol. Aging 2003, 24, 197–211. [Google Scholar] [CrossRef]
- Goedert, M. Alzheimer’s and Parkinson’s diseases: The prion concept in relation to assembled Abeta, tau, and alpha-synuclein. Science 2015, 349, 1255555. [Google Scholar] [CrossRef]
- Brundin, P.; Melki, R.; Kopito, R. Prion-like transmission of protein aggregates in neurodegenerative diseases. Nat. Rev. Mol. Cell Biol. 2010, 11, 301–307. [Google Scholar] [CrossRef]
- Rey, N.L.; Steiner, J.A.; Maroof, N.; Luk, K.C.; Madaj, Z.; Trojanowski, J.Q.; Lee, V.M.; Brundin, P. Widespread transneuronal propagation of alpha-synucleinopathy triggered in olfactory bulb mimics prodromal Parkinson’s disease. J. Exp. Med. 2016, 213, 1759–1778. [Google Scholar] [CrossRef]
- Hosp, F.; Mann, M. A Primer on Concepts and Applications of Proteomics in Neuroscience. Neuron 2017, 96, 558–571. [Google Scholar] [CrossRef]
- Medland, S.E.; Jahanshad, N.; Neale, B.M.; Thompson, P.M. Whole-genome analyses of whole-brain data: Working within an expanded search space. Nat. Neurosci. 2014, 17, 791–800. [Google Scholar] [CrossRef] [PubMed]
- Pollock, J.D.; Wu, D.Y.; Satterlee, J.S. Molecular neuroanatomy: A generation of progress. Trends Neurosci. 2014, 37, 106–123. [Google Scholar] [CrossRef] [PubMed]
- Bereczki, E.; Branca, R.M.; Francis, P.T.; Pereira, J.B.; Baek, J.H.; Hortobagyi, T.; Winblad, B.; Ballard, C.; Lehtio, J.; Aarsland, D. Synaptic markers of cognitive decline in neurodegenerative diseases: A proteomic approach. Brain 2018, 141, 582–595. [Google Scholar] [CrossRef]
- Datta, A.; Chai, Y.L.; Tan, J.M.; Lee, J.H.; Francis, P.T.; Chen, C.P.; Sze, S.K.; Lai, M.K.P. An iTRAQ-based proteomic analysis reveals dysregulation of neocortical synaptopodin in Lewy body dementias. Mol. Brain 2017, 10, 36. [Google Scholar] [CrossRef]
- Lundstrom, S.L.; Zhang, B.; Rutishauser, D.; Aarsland, D.; Zubarev, R.A. SpotLight Proteomics: Uncovering the hidden blood proteome improves diagnostic power of proteomics. Sci. Rep. 2017, 7, 41929. [Google Scholar] [CrossRef]
- Remnestal, J.; Just, D.; Mitsios, N.; Fredolini, C.; Mulder, J.; Schwenk, J.M.; Uhlen, M.; Kultima, K.; Ingelsson, M.; Kilander, L.; et al. CSF profiling of the human brain enriched proteome reveals associations of neuromodulin and neurogranin to Alzheimer’s disease. Proteom. Clin. Appl. 2016, 10, 1242–1253. [Google Scholar] [CrossRef] [PubMed]
- Lachen-Montes, M.; Fernandez-Irigoyen, J.; Santamaria, E. Deconstructing the molecular architecture of olfactory areas using proteomics. Proteom. Clin. Appl. 2016, 10, 1178–1190. [Google Scholar] [CrossRef] [PubMed]
- Lachen-Montes, M.; Gonzalez-Morales, A.; de Morentin, X.M.; Perez-Valderrama, E.; Ausin, K.; Zelaya, M.V.; Serna, A.; Aso, E.; Ferrer, I.; Fernandez-Irigoyen, J.; et al. An early dysregulation of FAK and MEK/ERK signaling pathways precedes the beta-amyloid deposition in the olfactory bulb of APP/PS1 mouse model of Alzheimer’s disease. J. Proteom. 2016, 148, 149–158. [Google Scholar] [CrossRef]
- Lachen-Montes, M.; Gonzalez-Morales, A.; Iloro, I.; Elortza, F.; Ferrer, I.; Gveric, D.; Fernandez-Irigoyen, J.; Santamaria, E. Unveiling the olfactory proteostatic disarrangement in Parkinson’s disease by proteome-wide profiling. Neurobiol. Aging 2019, 73, 123–134. [Google Scholar] [CrossRef]
- Lachen-Montes, M.; Gonzalez-Morales, A.; Palomino, M.; Ausin, K.; Gomez-Ochoa, M.; Zelaya, M.V.; Ferrer, I.; Perez-Mediavilla, A.; Fernandez-Irigoyen, J.; Santamaria, E. Early-Onset Molecular Derangements in the Olfactory Bulb of Tg2576 Mice: Novel Insights Into the Stress-Responsive Olfactory Kinase Dynamics in Alzheimer’s Disease. Front. Aging Neurosci. 2019, 11, 141. [Google Scholar] [CrossRef]
- Lachen-Montes, M.; Gonzalez-Morales, A.; Schvartz, D.; Zelaya, M.V.; Ausin, K.; Fernandez-Irigoyen, J.; Sanchez, J.C.; Santamaria, E. The olfactory bulb proteotype differs across frontotemporal dementia spectrum. J. Proteom. 2019, 201, 37–47. [Google Scholar] [CrossRef] [PubMed]
- Lachen-Montes, M.; Gonzalez-Morales, A.; Zelaya, M.V.; Perez-Valderrama, E.; Ausin, K.; Ferrer, I.; Fernandez-Irigoyen, J.; Santamaria, E. Olfactory bulb neuroproteomics reveals a chronological perturbation of survival routes and a disruption of prohibitin complex during Alzheimer’s disease progression. Sci. Rep. 2017, 7, 9115. [Google Scholar] [CrossRef] [PubMed]
- Lachen-Montes, M.; Zelaya, M.V.; Segura, V.; Fernandez-Irigoyen, J.; Santamaria, E. Progressive modulation of the human olfactory bulb transcriptome during Alzheimer s disease evolution: Novel insights into the olfactory signaling across proteinopathies. Oncotarget 2017, 8, 69663–69679. [Google Scholar] [CrossRef]
- Zelaya, M.V.; Perez-Valderrama, E.; de Morentin, X.M.; Tunon, T.; Ferrer, I.; Luquin, M.R.; Fernandez-Irigoyen, J.; Santamaria, E. Olfactory bulb proteome dynamics during the progression of sporadic Alzheimer’s disease: Identification of common and distinct olfactory targets across Alzheimer-related co-pathologies. Oncotarget 2015, 6, 39437–39456. [Google Scholar] [CrossRef]
- Palomino-Alonso, M.; Lachen-Montes, M.; Gonzalez-Morales, A.; Ausin, K.; Perez-Mediavilla, A.; Fernandez-Irigoyen, J.; Santamaria, E. Network-Driven Proteogenomics Unveils an Aging-Related Imbalance in the Olfactory IkappaBalpha-NFkappaB p65 Complex Functionality in Tg2576 Alzheimer’s Disease Mouse Model. Int. J. Mol. Sci. 2017, 18, 2260. [Google Scholar] [CrossRef] [PubMed]
- Fernandez-Irigoyen, J.; Santamaria, E. Olfactory proteotyping: Towards the enlightenment of the neurodegeneration. Neural Regen. Res. 2019, 14, 979–981. [Google Scholar] [CrossRef]
- Tepe, B.; Hill, M.C.; Pekarek, B.T.; Hunt, P.J.; Martin, T.J.; Martin, J.F.; Arenkiel, B.R. Single-Cell RNA-Seq of Mouse Olfactory Bulb Reveals Cellular Heterogeneity and Activity-Dependent Molecular Census of Adult-Born Neurons. Cell Rep. 2018, 25, 2689–2703. [Google Scholar] [CrossRef] [PubMed]
- Deza-Ponzio, R.; Herrera, M.L.; Bellini, M.J.; Virgolini, M.B.; Herenu, C.B. Aldehyde dehydrogenase 2 in the spotlight: The link between mitochondria and neurodegeneration. Neurotoxicology 2018, 68, 19–24. [Google Scholar] [CrossRef]
- Garcia-Esparcia, P.; Lopez-Gonzalez, I.; Grau-Rivera, O.; Garcia-Garrido, M.F.; Konetti, A.; Llorens, F.; Zafar, S.; Carmona, M.; Del Rio, J.A.; Zerr, I.; et al. Dementia with Lewy Bodies: Molecular Pathology in the Frontal Cortex in Typical and Rapidly Progressive Forms. Front. Neurol. 2017, 8, 89. [Google Scholar] [CrossRef]
- Garcia-Esparcia, P.; Hernandez-Ortega, K.; Koneti, A.; Gil, L.; Delgado-Morales, R.; Castano, E.; Carmona, M.; Ferrer, I. Altered machinery of protein synthesis is region- and stage-dependent and is associated with alpha-synuclein oligomers in Parkinson’s disease. Acta Neuropathol. Commun. 2015, 3, 76. [Google Scholar] [CrossRef]
- Bahrami, B.F.; Ataie-Kachoie, P.; Pourgholami, M.H.; Morris, D.L. p70 Ribosomal protein S6 kinase (Rps6kb1): An update. J. Clin. Pathol. 2014, 67, 1019–1025. [Google Scholar] [CrossRef] [PubMed]
- Blumenstock, S.; Angelo, M.F.; Peters, F.; Dorostkar, M.M.; Ruf, V.C.; Luckner, M.; Crux, S.; Slapakova, L.; Arzberger, T.; Claverol, S.; et al. Early defects in translation elongation factor 1alpha levels at excitatory synapses in alpha-synucleinopathy. Acta Neuropathol. 2019, 138, 971–986. [Google Scholar] [CrossRef]
- Revuelta, G.J.; Rosso, A.; Lippa, C.F. Neuritic pathology as a correlate of synaptic loss in dementia with lewy bodies. Am. J. Alzheimers Dis. Demen. 2008, 23, 97–102. [Google Scholar] [CrossRef] [PubMed]
- Schulz-Schaeffer, W.J. The synaptic pathology of alpha-synuclein aggregation in dementia with Lewy bodies, Parkinson’s disease and Parkinson’s disease dementia. Acta Neuropathol. 2010, 120, 131–143. [Google Scholar] [CrossRef] [PubMed]
- Del Peso, L.; Gonzalez-Garcia, M.; Page, C.; Herrera, R.; Nunez, G. Interleukin-3-induced phosphorylation of BAD through the protein kinase Akt. Science 1997, 278, 687–689. [Google Scholar] [CrossRef] [PubMed]
- Datta, S.R.; Dudek, H.; Tao, X.; Masters, S.; Fu, H.; Gotoh, Y.; Greenberg, M.E. Akt phosphorylation of BAD couples survival signals to the cell-intrinsic death machinery. Cell 1997, 91, 231–241. [Google Scholar] [CrossRef]
- Gomez-Santos, C.; Ferrer, I.; Reiriz, J.; Vinals, F.; Barrachina, M.; Ambrosio, S. MPP+ increases alpha-synuclein expression and ERK/MAP-kinase phosphorylation in human neuroblastoma SH-SY5Y cells. Brain Res. 2002, 935, 32–39. [Google Scholar] [CrossRef]
- Tolo, J.; Taschenberger, G.; Leite, K.; Stahlberg, M.A.; Spehlbrink, G.; Kues, J.; Munari, F.; Capaldi, S.; Becker, S.; Zweckstetter, M.; et al. Pathophysiological Consequences of Neuronal alpha-Synuclein Overexpression: Impacts on Ion Homeostasis, Stress Signaling, Mitochondrial Integrity, and Electrical Activity. Front. Mol. Neurosci. 2018, 11, 49. [Google Scholar] [CrossRef]
- Song, G.; Ouyang, G.; Bao, S. The activation of Akt/PKB signaling pathway and cell survival. J. Cell Mol. Med. 2005, 9, 59–71. [Google Scholar] [CrossRef]
- Jha, S.K.; Jha, N.K.; Kar, R.; Ambasta, R.K.; Kumar, P. p38 MAPK and PI3K/AKT Signalling Cascades inParkinson’s Disease. Int. J. Mol. Cell Med. 2015, 4, 67–86. [Google Scholar]
- Davies, D.C.; Brooks, J.W.; Lewis, D.A. Axonal loss from the olfactory tracts in Alzheimer’s disease. Neurobiol. Aging 1993, 14, 353–357. [Google Scholar] [CrossRef]
- Thomann, P.A.; Dos Santos, V.; Seidl, U.; Toro, P.; Essig, M.; Schroder, J. MRI-derived atrophy of the olfactory bulb and tract in mild cognitive impairment and Alzheimer’s disease. J. Alzheimers Dis. 2009, 17, 213–221. [Google Scholar] [CrossRef] [PubMed]
- Cross, D.J.; Anzai, Y.; Petrie, E.C.; Martin, N.; Richards, T.L.; Maravilla, K.R.; Peskind, E.R.; Minoshima, S. Loss of olfactory tract integrity affects cortical metabolism in the brain and olfactory regions in aging and mild cognitive impairment. J. Nucl. Med. 2013, 54, 1278–1284. [Google Scholar] [CrossRef]
- Bathini, P.; Mottas, A.; Jaquet, M.; Brai, E.; Alberi, L. Progressive signaling changes in the olfactory nerve of patients with Alzheimer’s disease. Neurobiol. Aging 2019, 76, 80–95. [Google Scholar] [CrossRef] [PubMed]
- Scherfler, C.; Schocke, M.F.; Seppi, K.; Esterhammer, R.; Brenneis, C.; Jaschke, W.; Wenning, G.K.; Poewe, W. Voxel-wise analysis of diffusion weighted imaging reveals disruption of the olfactory tract in Parkinson’s disease. Brain 2006, 129, 538–542. [Google Scholar] [CrossRef] [PubMed]
- Dayon, L.; Pasquarello, C.; Hoogland, C.; Sanchez, J.C.; Scherl, A. Combining low- and high-energy tandem mass spectra for optimized peptide quantification with isobaric tags. J. Proteom. 2010, 73, 769–777. [Google Scholar] [CrossRef] [PubMed]
- Gluck, F.; Hoogland, C.; Antinori, P.; Robin, X.; Nikitin, F.; Zufferey, A.; Pasquarello, C.; Fetaud, V.; Dayon, L.; Muller, M.; et al. EasyProt—An easy-to-use graphical platform for proteomics data analysis. J. Proteom. 2013, 79, 146–160. [Google Scholar] [CrossRef]
- Breitwieser, F.P.; Muller, A.; Dayon, L.; Kocher, T.; Hainard, A.; Pichler, P.; Schmidt-Erfurth, U.; Superti-Furga, G.; Sanchez, J.C.; Mechtler, K.; et al. General statistical modeling of data from protein relative expression isobaric tags. J Proteom. Res. 2011, 10, 2758–2766. [Google Scholar] [CrossRef]
- Vizcaino, J.A.; Deutsch, E.W.; Wang, R.; Csordas, A.; Reisinger, F.; Rios, D.; Dianes, J.A.; Sun, Z.; Farrah, T.; Bandeira, N.; et al. ProteomeXchange provides globally coordinated proteomics data submission and dissemination. Nat. Biotechnol. 2014, 32, 223–226. [Google Scholar] [CrossRef]
- Szklarczyk, D.; Gable, A.L.; Lyon, D.; Junge, A.; Wyder, S.; Huerta-Cepas, J.; Simonovic, M.; Doncheva, N.T.; Morris, J.H.; Bork, P.; et al. STRING v11: Protein-protein association networks with increased coverage, supporting functional discovery in genome-wide experimental datasets. Nucleic Acids Res. 2019, 47, D607–D613. [Google Scholar] [CrossRef]
- Moritz, C.P. Tubulin or Not Tubulin: Heading Toward Total Protein Staining as Loading Control in Western Blots. Proteomics 2017, 17, 1600189. [Google Scholar] [CrossRef] [PubMed]


| Description | Gene Name | Uniprot | Peptide Count | Ratio | p Value Sample |
|---|---|---|---|---|---|
| Down-regulated proteins across DLB | |||||
| 60S ribosomal protein L34 | RPL34 | P49207 | 2 | 0.44 | 4.6181 × 10⁻¹³ |
| 60S ribosomal protein L37 | RPL37 | P61927 | 2 | 0.465 | 7.3563 × 10⁻¹⁴ |
| Protein prune homolog 2 | PRUNE2 | Q8WUY3 | 3 | 0.5454 | 4.0993 × 10⁻¹⁰ |
| 60S ribosomal protein L22 | RPL22 | P35268 | 2 | 0.574 | 1.4869 × 10⁻¹² |
| Ras-related protein Rab-3B | RAB3B | P20337 | 2 | 0.6125 | 6.995 × 10⁻⁹ |
| 60S ribosomal protein L36 | RPL36 | Q9Y3U8 | 2 | 0.6139 | 2.0299 × 10⁻¹⁰ |
| V-type proton ATPase subunit d 1 | ATP6V0D1 | P61421 | 10 | 0.6144 | 6.1715 × 10⁻¹¹ |
| Heterogeneous nuclear ribonucleoprotein U | HNRNPU | Q00839 | 20 | 0.6181 | 1.9382 × 10⁻¹¹ |
| DNA-dependent protein kinase catalytic subunit | PRKDC | P78527 | 19 | 0.6264 | 1.5042 × 10⁻¹¹ |
| FACT complex subunit SPT16 | SUPT16H | Q9Y5B9 | 2 | 0.6328 | 8.6739 × 10⁻¹¹ |
| Synaptogyrin-3 | SYNGR3 | O43761 | 3 | 0.6506 | 5.5741 × 10⁻¹¹ |
| Liprin-alpha-4 | PPFIA4 | O75335 | 1 | 0.654 | 4.3343 × 10⁻¹⁰ |
| 60S ribosomal protein L10 | RPL10 | P27635 | 2 | 0.6672 | 2.1869 × 10⁻¹⁰ |
| 60S ribosomal protein L23a | RPL23A | P62750 | 3 | 0.6675 | 4.0283 × 10⁻¹⁰ |
| 40S ribosomal protein S11 | RPS11 | P62280 | 3 | 0.6679 | 4.1716 × 10⁻⁹ |
| HMG nucleosome × 10−binding domain-containing protein 3 | HMGN3 | Q15651 | 2 | 0.6692 | 1.4543 × 10⁻⁹ |
| Sodium/potassium-transporting ATPase subunit alpha-3 | ATP1A3 | P13637 | 26 | 0.6693 | 5.6496 × 10⁻¹¹ |
| Lymphocyte antigen 6H | LY6H | O94772 | 5 | 0.6734 | 2.4723 × 10⁻⁹ |
| 40S ribosomal protein S25 | RPS25 | P62851 | 3 | 0.6741 | 1.1199 × 10⁻⁹ |
| Neurofilament light polypeptide | NEFL | P07196 | 18 | 0.6743 | 7.1158 × 10⁻¹⁰ |
| 40S ribosomal protein S3a | RPS3A | P61247 | 4 | 0.6782 | 3.4891 × 10⁻⁹ |
| Vesicular inhibitory amino acid transporter | SLC32A1 | Q9H598 | 6 | 0.6816 | 2.3798 × 10⁻¹⁰ |
| Vesicular glutamate transporter 1 | SLC17A7 | Q9P2U7 | 2 | 0.6818 | 2.7575 × 10⁻¹¹ |
| Plasma membrane calcium-transporting ATPase 3 | ATP2B3 | Q16720 | 2 | 0.686 | 4.3062 × 10⁻⁹ |
| E3 ubiquitin-protein ligase MYCBP2 | MYCBP2 | O75592 | 2 | 0.6862 | 3.7771 × 10⁻¹⁰ |
| Syntaxin-1A | STX1A | Q16623 | 7 | 0.6879 | 4.8927 × 10⁻⁹ |
| Syntaxin-binding protein 1 | STXBP1 | P61764 | 29 | 0.6904 | 1.4785 × 10⁻¹⁰ |
| Neurofilament medium polypeptide | NEFM | P07197 | 27 | 0.6932 | 1.5816 × 10⁻⁹ |
| Secretory carrier-associated membrane protein 5 | SCAMP5 | Q8TAC9 | 4 | 0.6946 | 2.3559 × 10⁻¹⁰ |
| Calcium/calmodulin-dependent protein kinase type II subunit alpha | CAMK2A | Q9UQM7 | 8 | 0.7012 | 5.1862 × 10⁻¹¹ |
| Neurexin-1 | NRXN1 | Q9ULB1 | 1 | 0.7014 | 7.3383 × 10⁻¹⁰ |
| PH and SEC7 domain-containing protein 3 | PSD3 | Q9NYI0 | 11 | 0.7037 | 1.2708 × 10⁻⁹ |
| Gamma-aminobutyric acid receptor subunit beta-2 | GABRB2 | P47870 | 2 | 0.7042 | 1.5422 × 10⁻⁹ |
| Proenkephalin-A cleaved into synenkephalin; Met-enkephalin | PENK | P01210 | 5 | 0.7134 | 3.9046 × 10⁻⁸ |
| Synaptophysin | SYP | P08247 | 5 | 0.7156 | 5.4513 × 10⁻¹¹ |
| 40S ribosomal protein S27, 40S ribosomal protein S27-like | RPS27 | Q71UM5 | 2 | 0.7165 | 1.5132 × 10⁻⁹ |
| Syntaxin-1B | STX1B | P61266 | 13 | 0.7165 | 3.4018 × 10⁻¹⁰ |
| DnaJ homolog subfamily C member 5 | DNAJC5 | Q9H3Z4 | 5 | 0.7172 | 2.3736 × 10⁻¹⁰ |
| Calcium/calmodulin-dependent protein kinase type II subunit beta | CAMK2B | Q13554 | 11 | 0.7184 | 3.952 × 10⁻¹⁰ |
| Mitochondrial glutamate carrier 1 | SLC25A22 | Q9H936 | 2 | 0.7204 | 9.6273 × 10⁻⁷ |
| Sodium/potassium-transporting ATPase subunit beta-1 | ATP1B1 | P05026 | 13 | 0.7216 | 7.7815 × 10⁻¹⁰ |
| Glutamate receptor 2 | GRIA2 | P42262 | 5 | 0.7238 | 2.3865 × 10⁻⁹ |
| Tubulin beta-2A chain | TUBB2A | Q13885 | 2 | 0.7246 | 1.4984 × 10⁻⁹ |
| PC4 and SFRS1-interacting protein | PSIP1 | O75475 | 11 | 0.7258 | 1.7917 × 10⁻⁹ |
| 60S ribosomal protein L38 | RPL38 | P63173 | 2 | 0.7272 | 3.6241 × 10⁻⁹ |
| Clathrin heavy chain 1 | CLTC | Q00610 | 58 | 0.7305 | 1.1969 × 10⁻⁹ |
| Ras-related protein Rab-3A | RAB3A | P20336 | 4 | 0.7312 | 2.1299 × 10⁻⁹ |
| Leukocyte surface antigen CD47 | CD47 | Q08722 | 3 | 0.7319 | 3.2189 × 10⁻⁸ |
| Metabotropic glutamate receptor 1 | GRM1 | Q13255 | 3 | 0.7365 | 4.3436 × 10⁻⁹ |
| Receptor expression-enhancing protein 5 | REEP5 | Q00765 | 5 | 0.7394 | 8.049 × 10⁻⁹ |
| Probable leucine--tRNA ligase, mitochondrial | LARS2 | Q15031 | 2 | 0.7395 | 7.1964 × 10⁻⁹ |
| Neutral cholesterol ester hydrolase 1 | NCEH1 | Q6PIU2 | 4 | 0.7407 | 1.4583 × 10⁻⁹ |
| 40S ribosomal protein S2 | RPS2 | P15880 | 7 | 0.7411 | 1.147 × 10⁻⁸ |
| Glucose 1,6-bisphosphate synthase | PGM2L1 | Q6PCE3 | 8 | 0.7438 | 3.5479 × 10⁻⁹ |
| 60S ribosomal protein L15 | RPL15 | P61313 | 3 | 0.7446 | 4.3186 × 10⁻⁸ |
| Transmembrane protein 35A | TMEM35A | Q53FP2 | 2 | 0.7446 | 3.4577 × 10⁻⁹ |
| 60S ribosomal protein L23 | RPL23 | P62829 | 2 | 0.7448 | 1.9037 × 10⁻⁷ |
| Disintegrin and metalloproteinase domain-containing protein 22 | ADAM22 | Q9P0K1 | 2 | 0.746 | 2.1643 × 10⁻⁸ |
| 60S ribosomal protein L31 | RPL31 | P62899 | 3 | 0.7469 | 2.7904 × 10⁻⁹ |
| Pre-mRNA-processing-splicing factor 8 | PRPF8 | Q6P2Q9 | 5 | 0.7484 | 3.9116 × 10⁻¹⁰ |
| V-type proton ATPase 116 kDa subunit a isoform 1 | ATP6V0A1 | Q93050 | 16 | 0.7514 | 2.8591 × 10⁻⁹ |
| Actin-related protein 3B | ACTR3B | Q9P1U1 | 5 | 0.752 | 6.086 × 10⁻⁹ |
| ATP-dependent RNA helicase A | DHX9 | Q08211 | 20 | 0.7521 | 6.8201 × 10⁻⁹ |
| cAMP-dependent protein kinase type I-beta regulatory subunit | PRKAR1B | P31321 | 1 | 0.7522 | 2.2148 × 10⁻⁷ |
| Ras/Rap GTPase-activating protein SynGAP | SYNGAP1 | Q96PV0 | 7 | 0.7527 | 2.5633 × 10⁻⁸ |
| Stearoyl-CoA desaturase 5 | SCD5 | Q86SK9 | 2 | 0.7552 | 1.0027 × 10⁻⁶ |
| Elongation factor 1-alpha 2 | EEF1A2 | Q05639 | 7 | 0.7557 | 3.9797 × 10⁻⁹ |
| Synaptic vesicle glycoprotein 2A | SV2A | Q7L0J3 | 6 | 0.7558 | 3.2828 × 10⁻⁹ |
| Protein rogdi homolog | ROGDI | Q9GZN7 | 3 | 0.7569 | 5.4595 × 10⁻⁹ |
| X-ray repair cross-complementing protein 6 | XRCC6 | P12956 | 15 | 0.7573 | 2.6216 × 10⁻¹⁰ |
| Protein DEK | DEK | P35659 | 2 | 0.7598 | 1.2282 × 10⁻⁸ |
| Vesicle-fusing ATPase | NSF | P46459 | 32 | 0.7608 | 2.2491 × 10⁻⁹ |
| Cytochrome c oxidase subunit 7A-related protein, mitochondrial | COX7A2L | O14548 | 2 | 0.7613 | 2.1107 × 10⁻⁸ |
| Ras-related protein Rab-33B | RAB33B | Q9H082 | 1 | 0.7614 | 5.1009 × 10⁻⁷ |
| Kelch-like protein 22 | KLHL22 | Q53GT1 | 2 | 0.7633 | 2.2287 × 10⁻⁸ |
| Dynamin-1 | DNM1 | Q05193 | 22 | 0.7641 | 1.0564 × 10⁻⁸ |
| Probable G-protein coupled receptor 158 | GPR158 | Q5T848 | 2 | 0.7653 | 1.1577 × 10⁻⁶ |
| Poly [ADP-ribose] polymerase 1 | PARP1 | P09874 | 10 | 0.7654 | 4.795 × 10⁻⁷ |
| Synaptoporin | SYNPR | Q8TBG9 | 2 | 0.7657 | 5.4958 × 10⁻⁹ |
| Beta-soluble NSF attachment protein | NAPB | Q9H115 | 14 | 0.7666 | 2.9345 × 10⁻⁸ |
| V-type proton ATPase catalytic subunit A | ATP6V1A | P38606 | 23 | 0.7674 | 1.3052 × 10⁻⁸ |
| Contactin-associated protein-like 2 | CNTNAP2 | Q9UHC6 | 7 | 0.7674 | 1.2516 × 10⁻⁸ |
| ATPase inhibitor, mitochondrial | ATPIF1 | Q9UII2 | 6 | 0.769 | 5.9459 × 10⁻⁸ |
| Up-regulated proteins across DLB | |||||
| Glutathione S-transferase theta-1 | GSTT1 | P30711 | 4 | 1.34 | 6.8584 × 10⁻⁸ |
| Phosphoglycerate mutase 2 | PGAM2 | P15259 | 4 | 1.3405 | 2.2404 × 10⁻⁹ |
| Cysteine and glycine-rich protein 1 | CSRP1 | P21291 | 12 | 1.3412 | 5.701 × 10⁻⁹ |
| Phosphotriesterase-related protein | PTER | Q96BW5 | 4 | 1.3447 | 2.9204 × 10⁻¹⁰ |
| Peroxiredoxin-6 | PRDX6 | P30041 | 15 | 1.357 | 2.3469 × 10⁻⁹ |
| Phenazine biosynthesis-like domain-containing protein | PBLD | P30039 | 2 | 1.3623 | 8.8245 × 10⁻⁶ |
| Gamma-butyrobetaine dioxygenase | BBOX1 | O75936 | 5 | 1.4003 | 8.8403 × 10⁻¹⁰ |
| Heat shock protein beta-6 | HSPB6 | O14558 | 2 | 1.4074 | 4.9675 × 10⁻¹⁰ |
| GMP reductase 1 | GMPR | P36959 | 4 | 1.4169 | 1.2597 × 10⁻¹¹ |
| Pirin | PIR | O00625 | 3 | 1.4254 | 3.3049 × 10⁻⁹ |
| Protein S100-A4 | S100A4 | P26447 | 3 | 1.4504 | 2.1294 × 10⁻⁹ |
| Aldehyde dehydrogenase X, mitochondrial | ALDH1B1 | P30837 | 5 | 1.5159 | 1.3337 × 10⁻¹⁰ |
| Nicotinate-nucleotide pyrophosphorylase [carboxylating] | QPRT | Q15274 | 4 | 1.516 | 5.6656 × 10⁻⁸ |
| Metallothionein-1E | MT1E | P04732 | 1 | 1.5881 | 1.6841 × 10⁻¹⁰ |
| Collagen alpha-3(VI) chain | COL6A3 | P12111 | 28 | 1.9992 | 1.5501 × 10⁻¹⁴ |
| Peptidase inhibitor 16 | PI16 | Q6UXB8 | 3 | 2.0955 | 1.2432 × 10⁻¹⁰ |
| Groups | Case (Code) | Age (Years) | Sex | PMI | OB | OT | Definitive DX | Proteomic Phase | Western Blot Analysis |
|---|---|---|---|---|---|---|---|---|---|
| Control | BK-0300 | 75 | F | - | Yes | Yes | ARP I-II | x | x |
| BK-1378 | 78 | M | 6 h | Yes | Yes | multi-infarct | x | x | |
| BK-1078 | 84 | F | 6 h | Yes | Yes | Vascular encephalopathy | x | x | |
| BK-1195 | 82 | F | 8 h | Yes | Yes | Acute stroke left cerebral artery | x | x | |
| BK-1563 | 79 | M | 5 h | Yes | Yes | Acute stroke left cerebral artery | x | ||
| DLB | CS-0622 | 78 | M | 8 h 30 min | Yes | Yes | DLB-AD neocortical | x | x |
| CS-0870 | 74 | M | 15 h | Yes | Yes | DLB-AD neocortical | x | x | |
| CS-0938 | 80 | M | 9 h 40 min | Yes | Yes | DLB-AD neocortical | x | x | |
| CS-0947 | 72 | M | 11 h | Yes | Yes | DLB-AD neocortical | x | x | |
| CS-1096 | 73 | F | 15 h 30 min | Yes | Yes | DLB-AD neocortical | x | ||
| CS-1140 | 82 | F | 4 h 30 min | Yes | Yes | DLB-AD neocortical | x | ||
| CS-1158 | 74 | M | 10 h | Yes | Yes | DLB-AD neocortical | x | ||
| CS-1215 | 67 | F | 13 h 30 min | Yes | Yes | DLB-AD neocortical | x | ||
| CS-1282 | 78 | F | 5 h | Yes | Yes | DLB-AD neocortical | x | ||
| CS-1192 | 77 | F | 14 h 20 min | Yes | Yes | DLB-AD neocortical | x | ||
| 432 | 71 | F | 9 h | Yes | No | DLB-AD neocortical | x | ||
| 397 | 90 | F | 5 h | Yes | No | DLB-AD neocortical | x | ||
| 394 | 70 | M | 4 h | Yes | No | DLB-AD neocortical | x | ||
| 339 | 70 | M | 4 h 15 min | Yes | No | DLB-AD neocortical | x | ||
| 325 | 91 | M | 12 h | Yes | No | DLB-AD neocortical | x |
© 2020 by the authors. Licensee MDPI, Basel, Switzerland. This article is an open access article distributed under the terms and conditions of the Creative Commons Attribution (CC BY) license (http://creativecommons.org/licenses/by/4.0/).
Share and Cite
Lachén-Montes, M.; Mendizuri, N.; Schvartz, D.; Fernández-Irigoyen, J.; Sánchez, J.C.; Santamaría, E. Proteomic Characterization of the Olfactory Molecular Imbalance in Dementia with Lewy Bodies. Int. J. Mol. Sci. 2020, 21, 6371. https://doi.org/10.3390/ijms21176371
Lachén-Montes M, Mendizuri N, Schvartz D, Fernández-Irigoyen J, Sánchez JC, Santamaría E. Proteomic Characterization of the Olfactory Molecular Imbalance in Dementia with Lewy Bodies. International Journal of Molecular Sciences. 2020; 21(17):6371. https://doi.org/10.3390/ijms21176371
Chicago/Turabian StyleLachén-Montes, Mercedes, Naroa Mendizuri, Domitille Schvartz, Joaquín Fernández-Irigoyen, Jean Charles Sánchez, and Enrique Santamaría. 2020. "Proteomic Characterization of the Olfactory Molecular Imbalance in Dementia with Lewy Bodies" International Journal of Molecular Sciences 21, no. 17: 6371. https://doi.org/10.3390/ijms21176371
APA StyleLachén-Montes, M., Mendizuri, N., Schvartz, D., Fernández-Irigoyen, J., Sánchez, J. C., & Santamaría, E. (2020). Proteomic Characterization of the Olfactory Molecular Imbalance in Dementia with Lewy Bodies. International Journal of Molecular Sciences, 21(17), 6371. https://doi.org/10.3390/ijms21176371