Premature Activation of Immune Transcription Programs in Autoimmune-Predisposed Mouse Embryonic Stem Cells and Blastocysts

 , , and
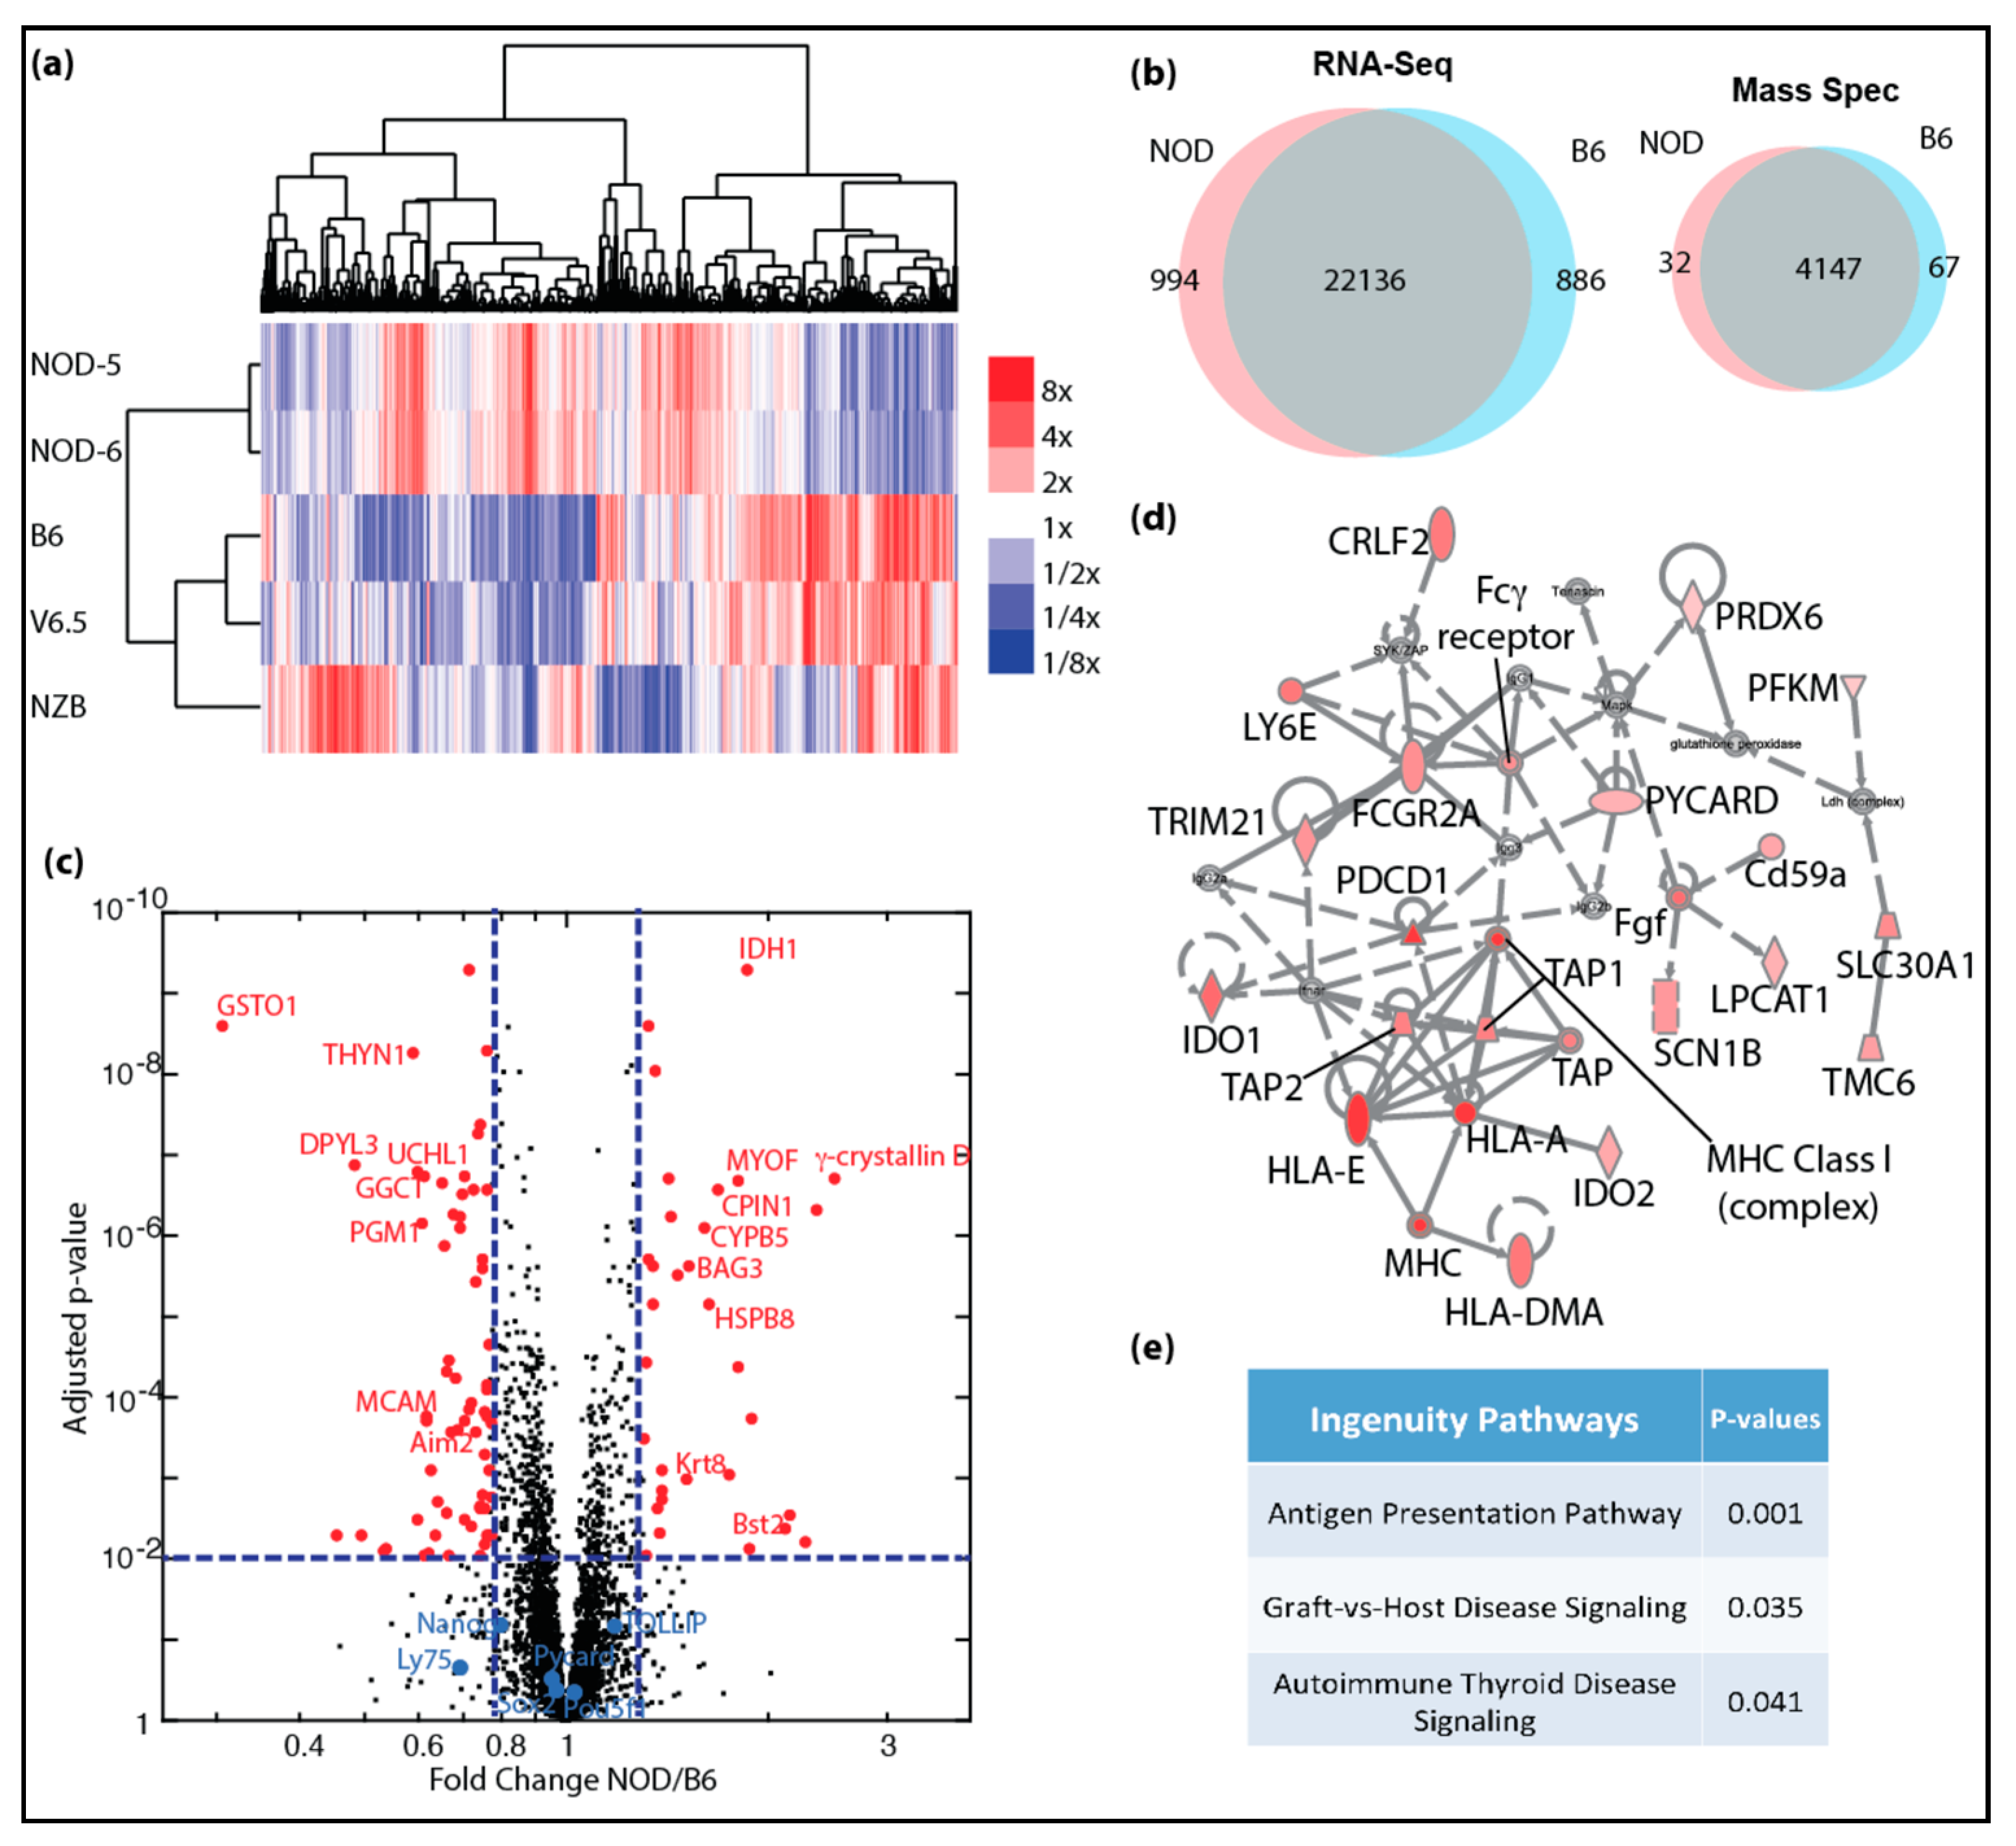
Abstract
1. Introduction
2. Results
2.1. Derivation of ES Cells from the Inbred Strains NOD and B6
2.2. Transcriptional and Proteomic Comparison between NOD and B6 ES Cells
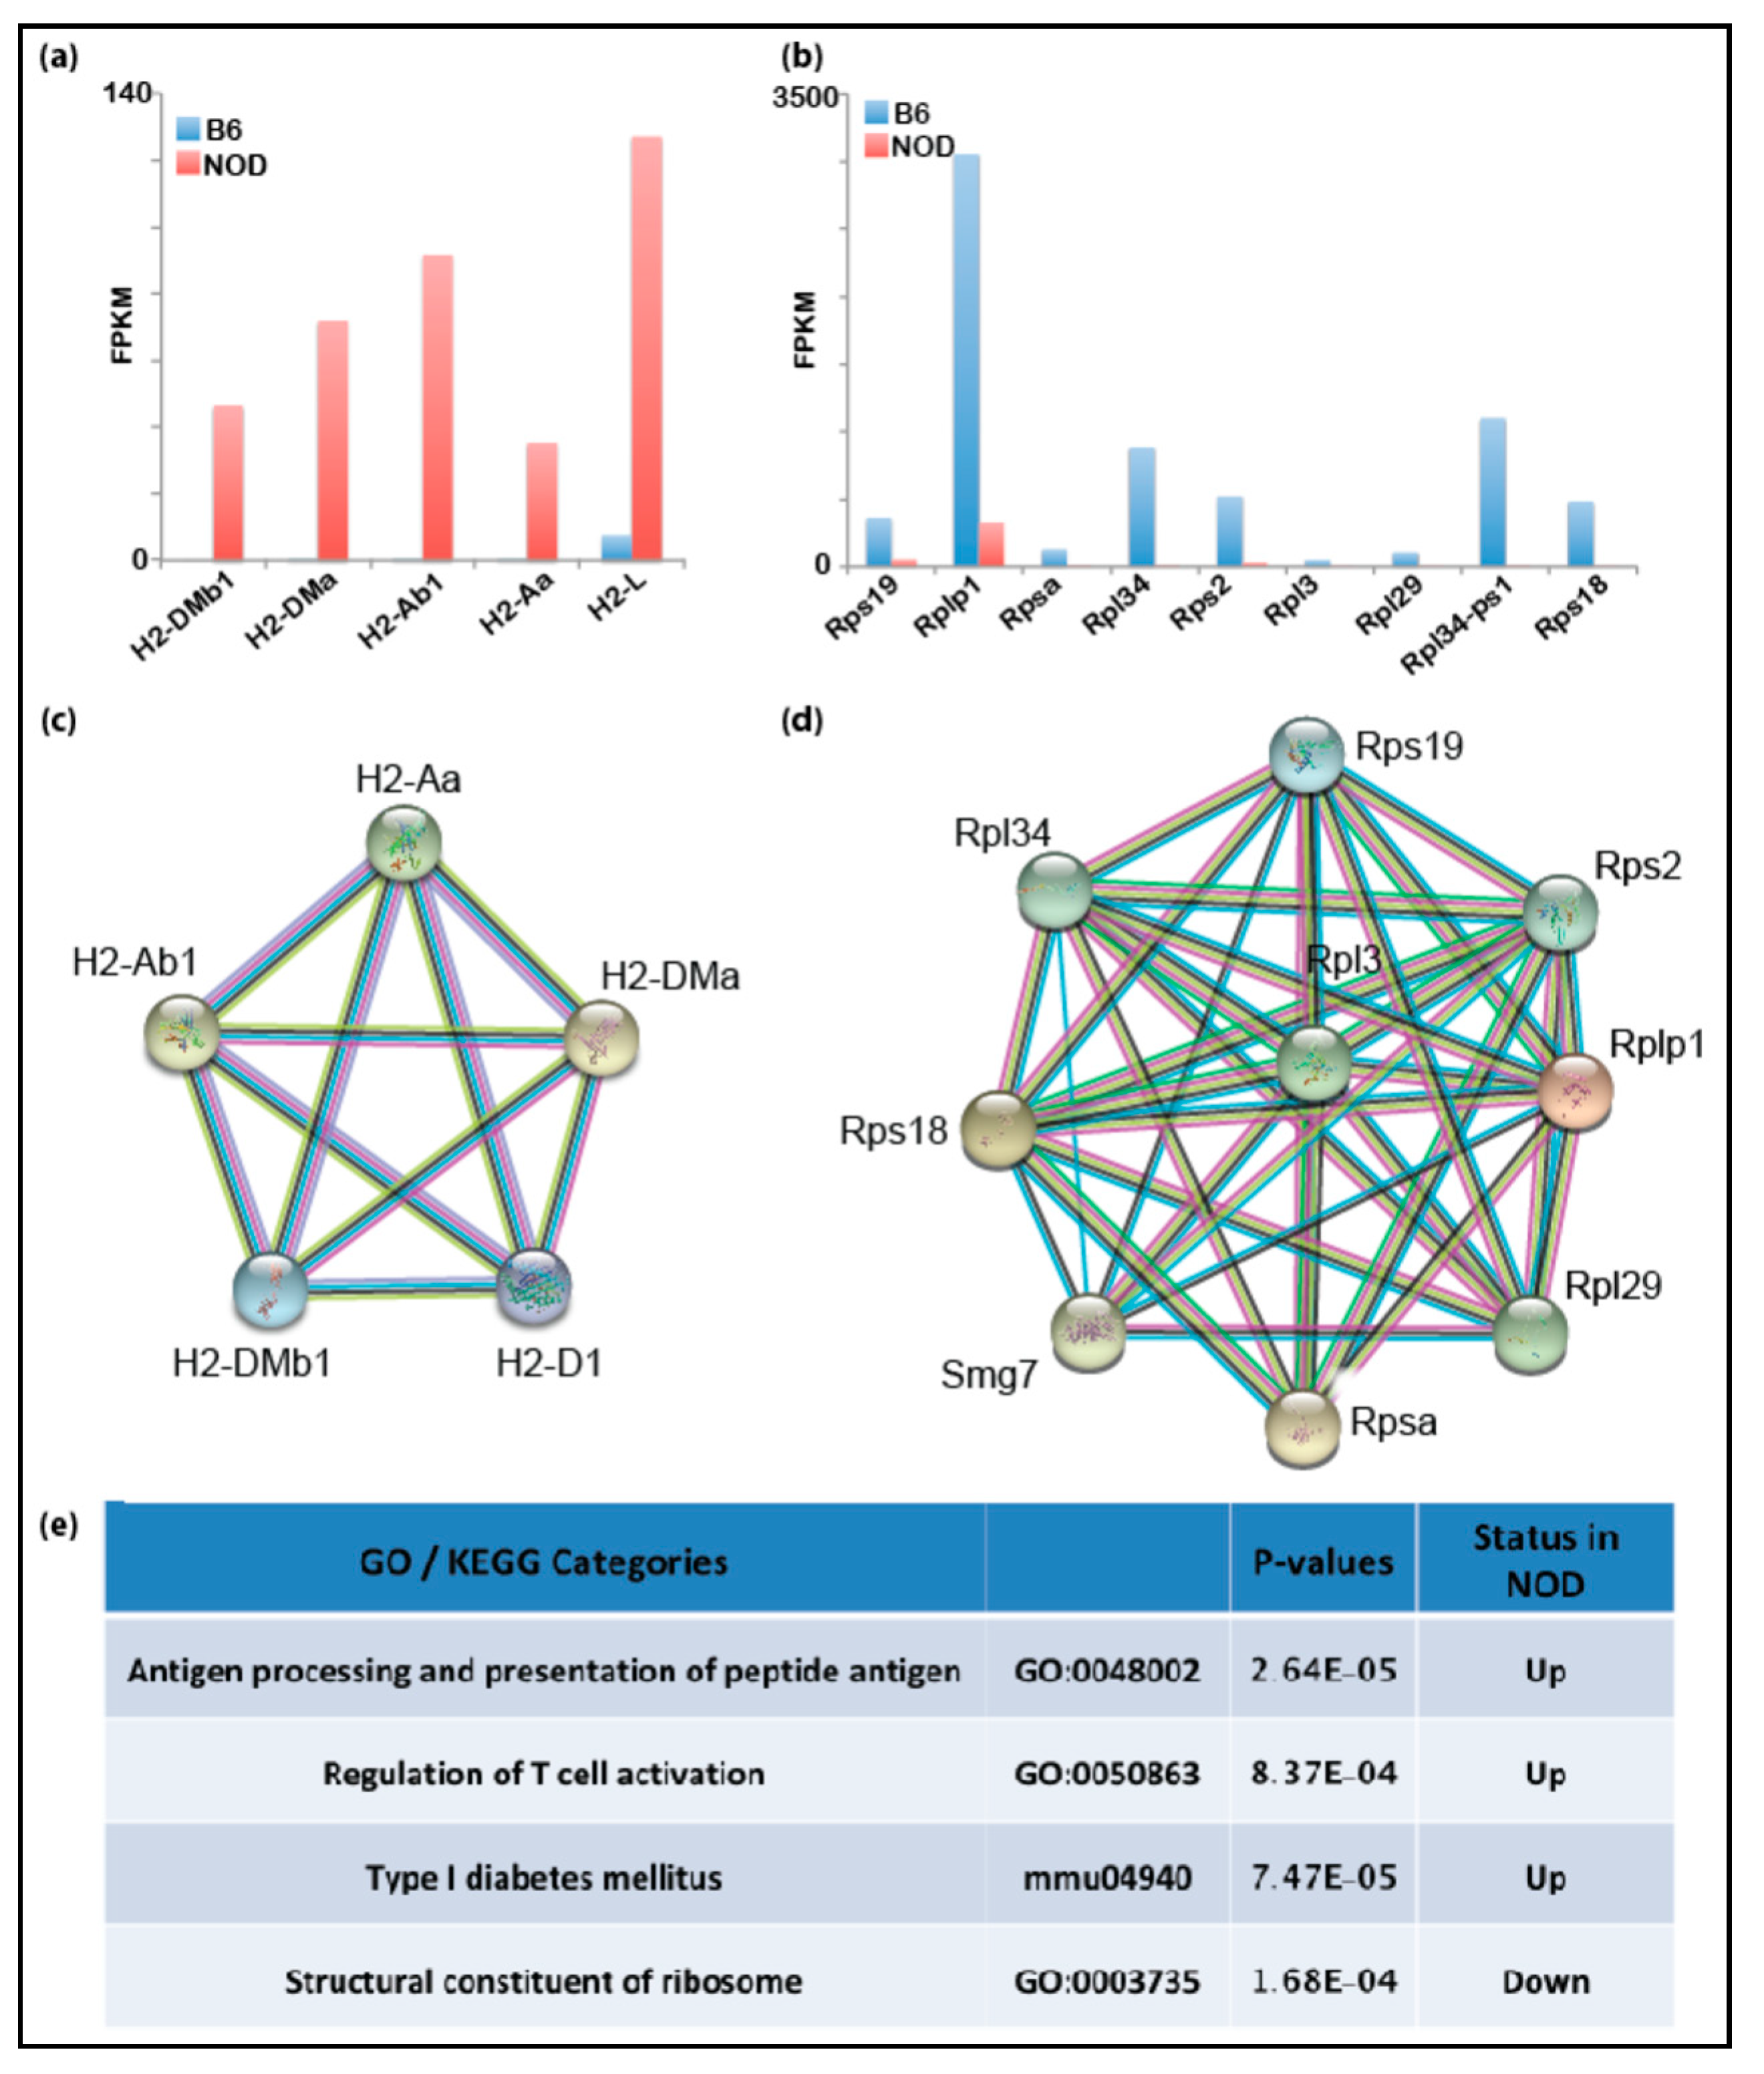
2.3. De-repression of Idd Genes and Other Immune-Related Genes in Diabetic-Prone NOD ES Cells
2.4. Characterization of Diabetes-Prone and Diabetes-Resistant Preimplantation Embryos
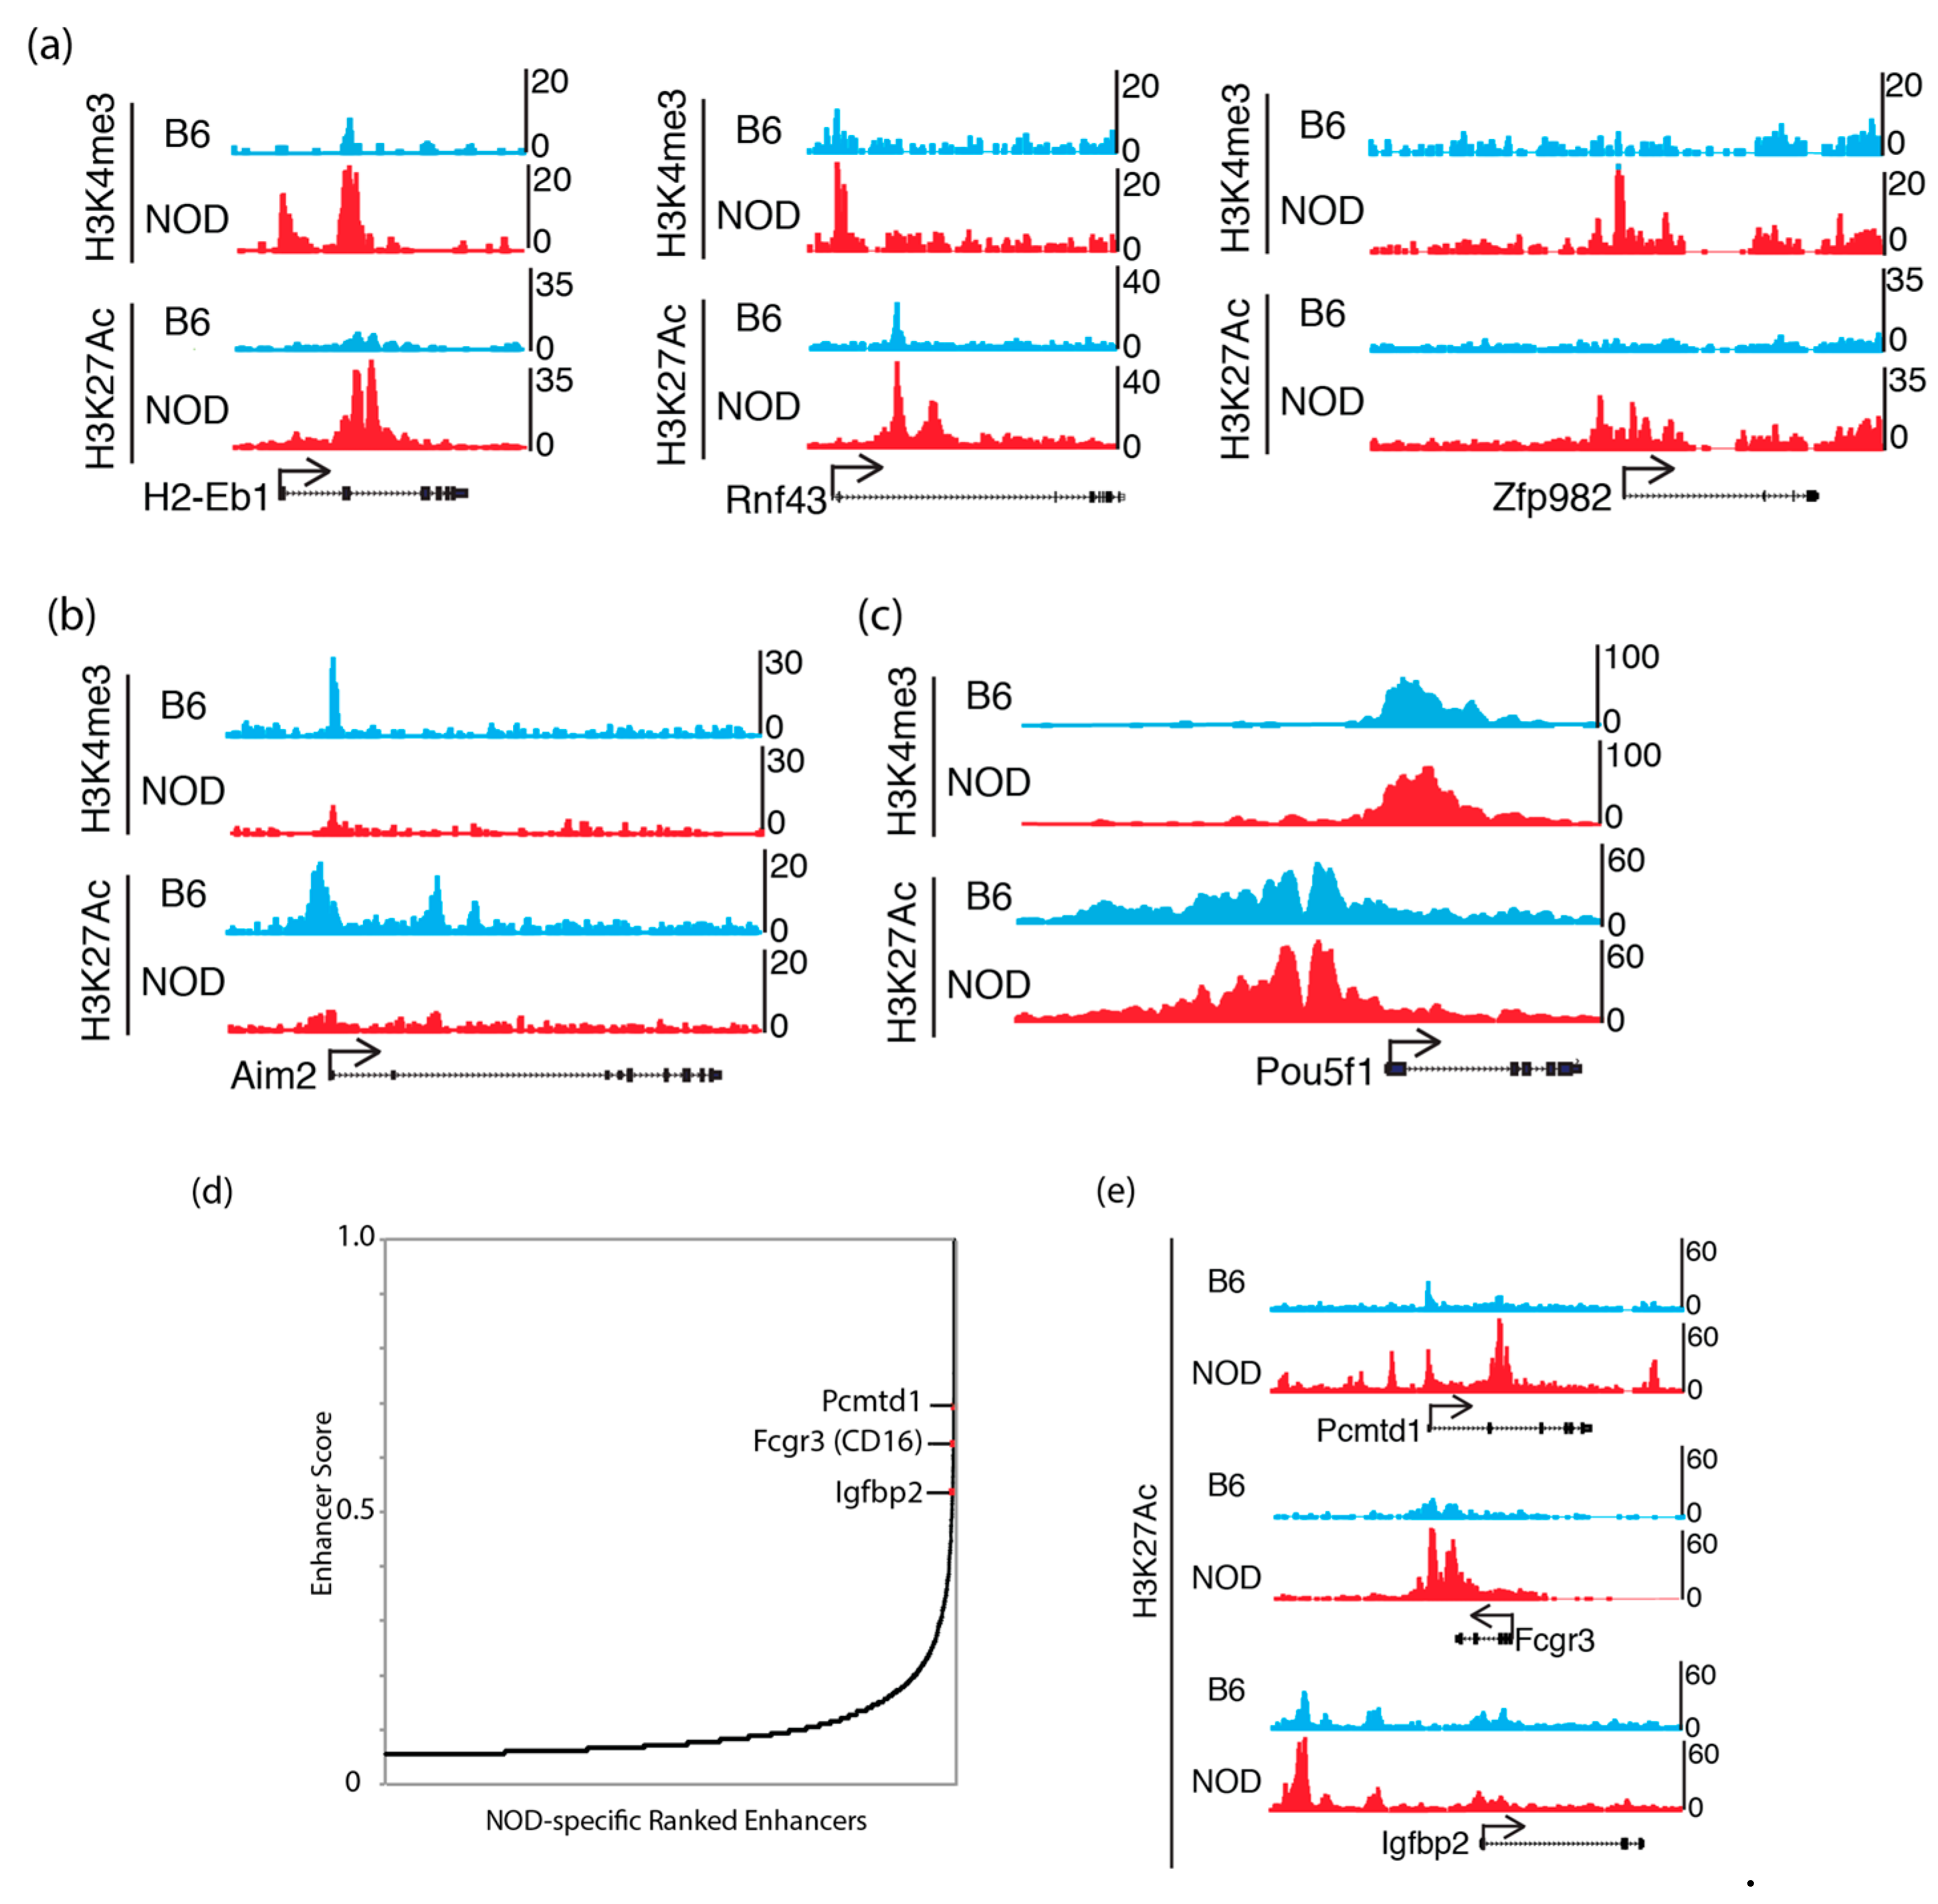
2.5. Epigenomic Characterization of Diabetic-Prone NOD ES Cells
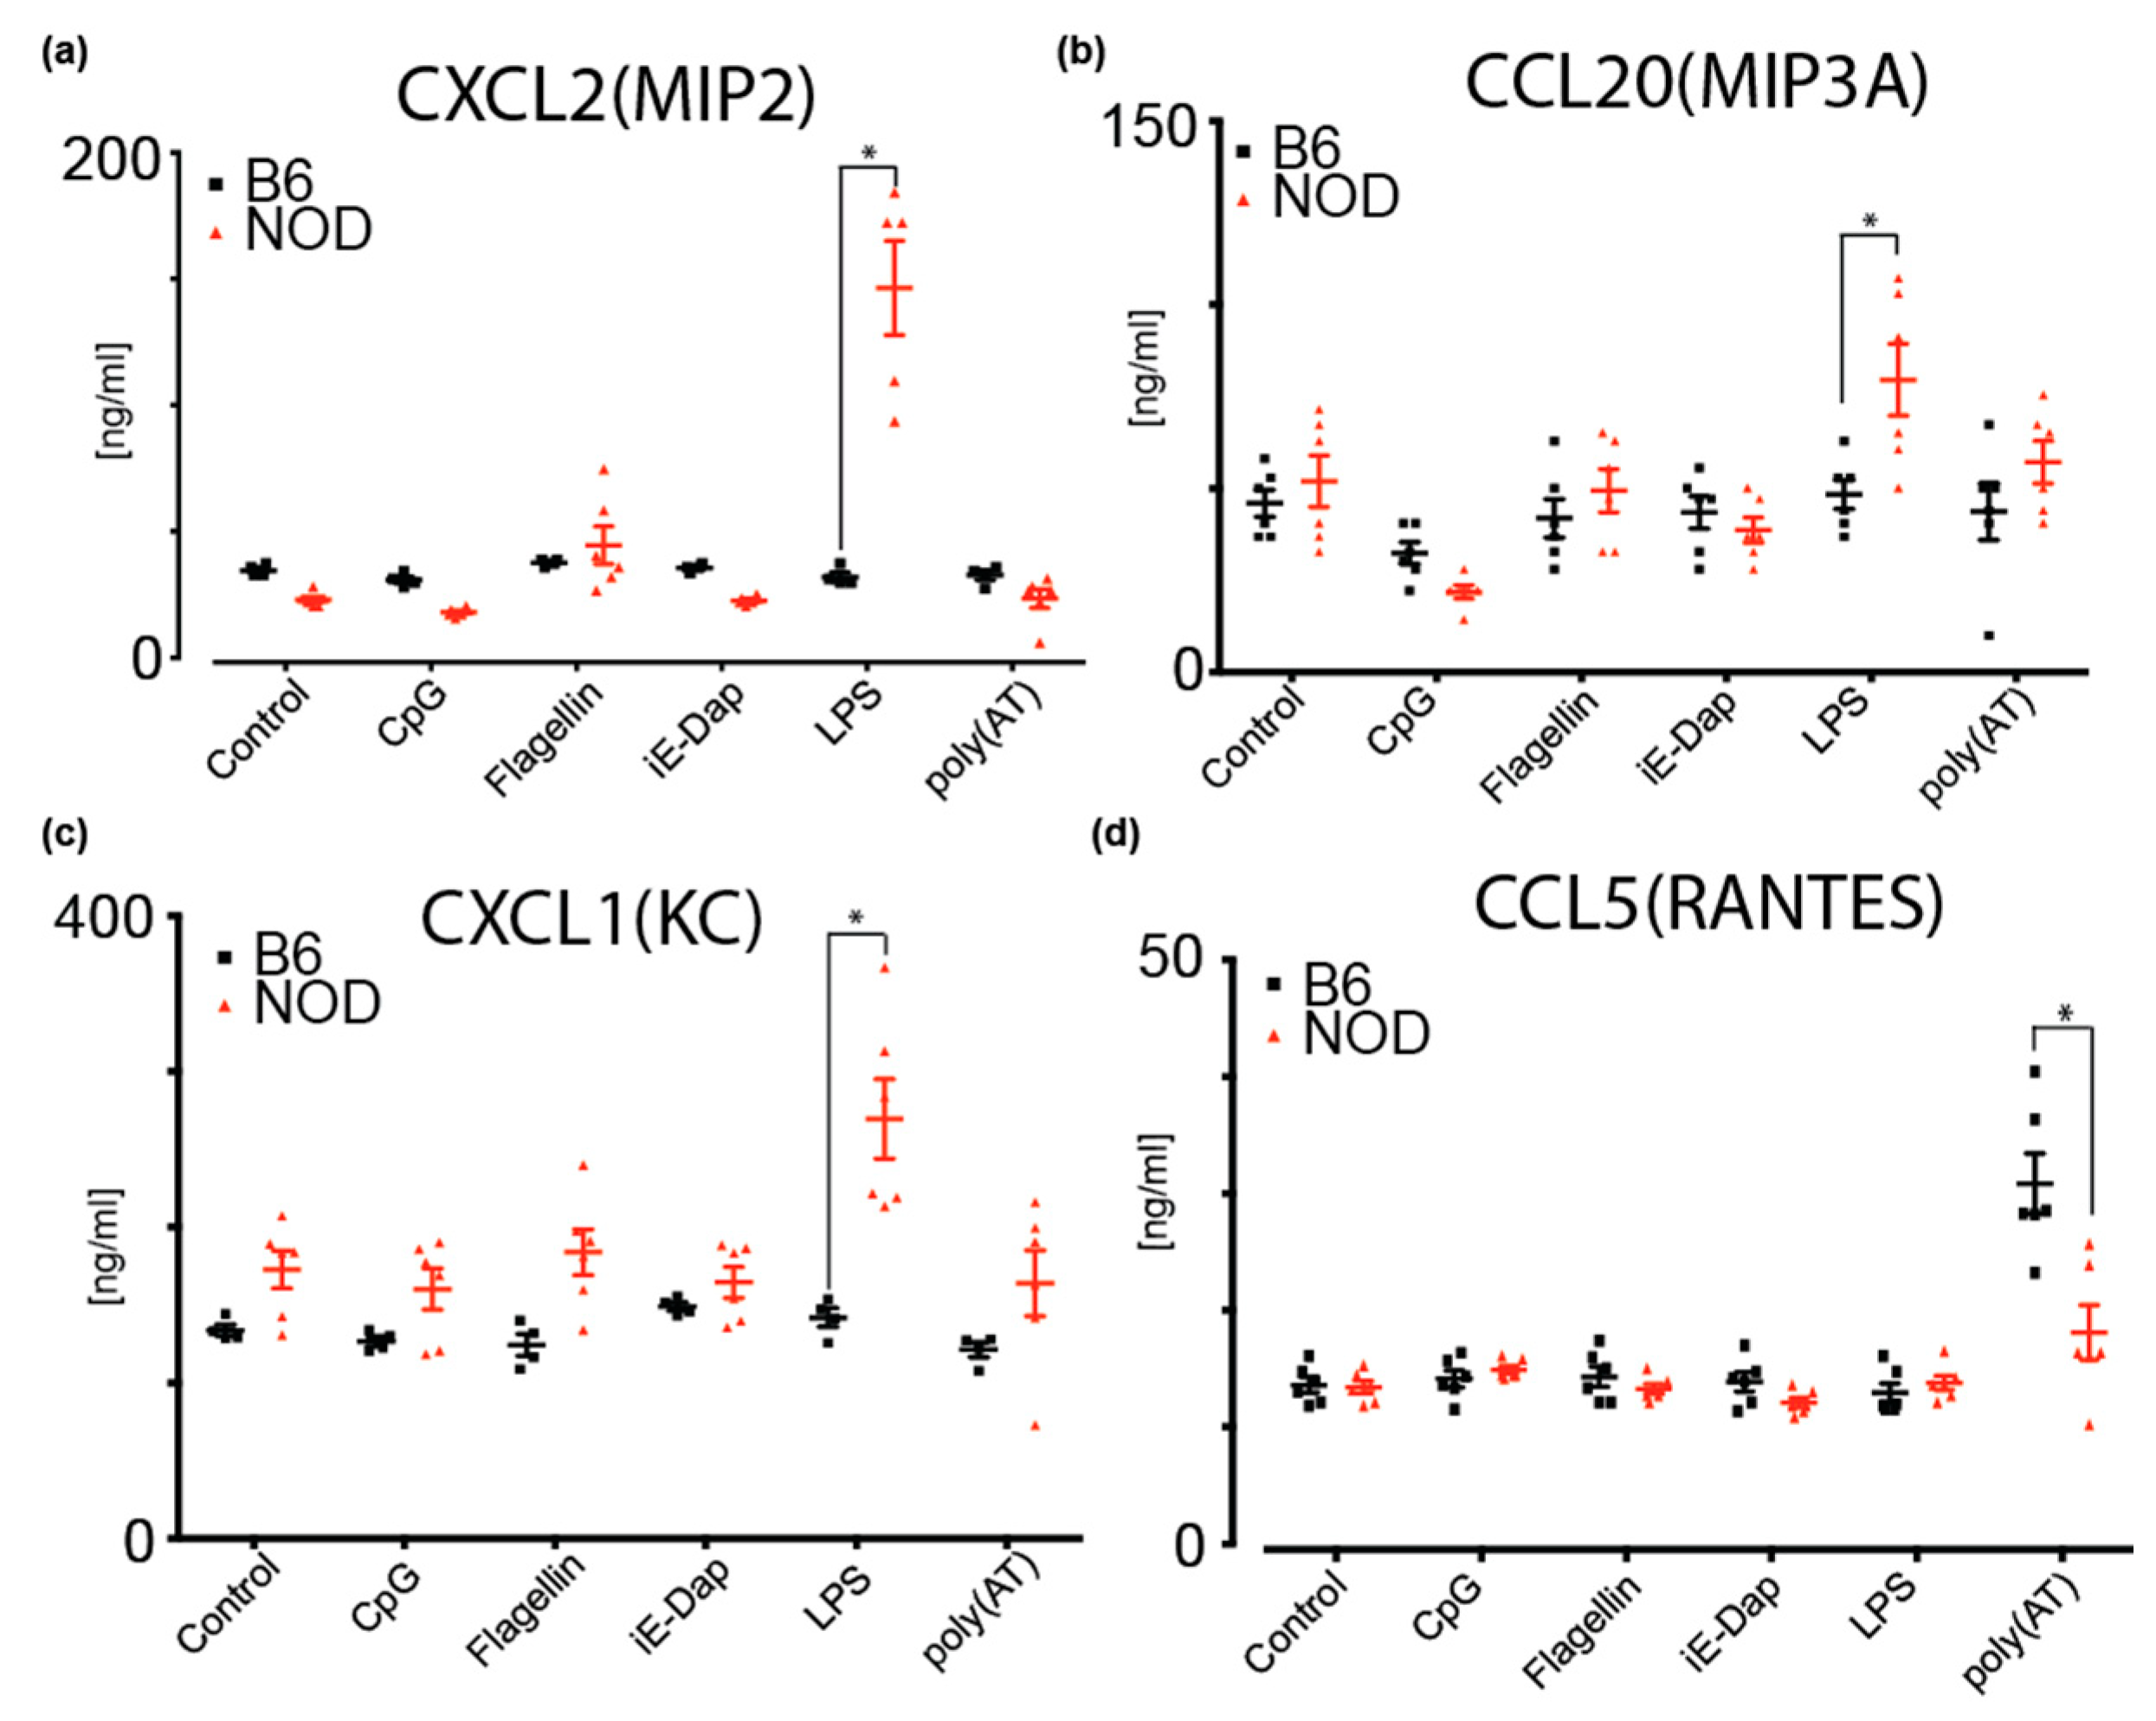
2.6. NOD ES Cells Secrete Inflammatory Cytokines and Chemokines
3. Discussion
4. Materials and Methods
4.1. Mice, Preimplantation Embryos and ES Cell Derivation
4.2. Alkaline Phosphatase Detection
4.3. Embryoid Body Formation
4.4. Quantitative Real-Time PCR
4.5. Immunofluorescence
4.6. Stranded mRNA-Seq
4.7. Mass Spectrometry
4.8. Low Input RNA-Seq and Analysis
4.9. Chromatin Immunoprecipitation Coupled with Sequencing (ChIP-Seq)
4.10. Luminex Measurement of Cytokines and Chemokines
5. Conclusions
Supplementary Materials
Author Contributions
Funding
Acknowledgments
Conflicts of Interest
Abbreviations
| NOD | Non-obese diabetic mice |
| NZB | New Zealand black mice |
| RNA-Seq | RNA Sequencing |
References
- Bluestone, J.A.; Herold, K.; Eisenbarth, G. Genetics, pathogenesis and clinical interventions in type 1 diabetes. Nature 2010, 464, 1293–1300. [Google Scholar] [CrossRef] [PubMed]
- Bell, G.I.; Horita, S.; Karam, J.H. A polymorphic locus near the human insulin gene is associated with insulin-dependent diabetes mellitus. Diabetes. 1984, 33, 176–183. [Google Scholar] [CrossRef] [PubMed]
- Bottini, N.; Musumeci, L.; Alonso, A.; Rahmouni, S.; Nika, K.; Rostamkhani, M.; MacMurray, J.; Meloni, G.F.; Lucarelli, P.; Pellecchia, M.; et al. A functional variant of lymphoid tyrosine phosphatase is associated with type I diabetes. Nat. Genet. 2004, 36, 337–338. [Google Scholar] [CrossRef] [PubMed]
- Nisticò, L. The CTLA-4 gene region of chromosome 2q33 is linked to, and associated with, type 1 diabetes. Belgian Diabetes Registry. Hum. Mol. Genet. 1996, 5, 1075–1080. [Google Scholar] [CrossRef] [PubMed]
- Noble, J.A.; Valdes, A.M.; Cook, M.; Klitz, W.; Thomson, G.; Erlich, H.A. The role of HLA class II genes in insulin-dependent diabetes mellitus: Molecular analysis of 180 Caucasian, multiplex families. Am. J. Hum. Genet. 1996, 59, 1134–1148. [Google Scholar] [PubMed]
- Todd, J.A.; Walker, N.M.; Cooper, J.D.; Smyth, D.; Downes, K.; Plagnol, V.; Bailey, R.; Nejentsev, S.; Field, S.F.; Payne, F.; et al. Robust associations of four new chromosome regions from genome-wide analyses of type 1 diabetes. Nat. Genet. 2007, 39, 857–864. [Google Scholar] [CrossRef]
- Rewers, M.; Ludvigsson, J. Environmental risk factors for type 1 diabetes. Lancet 2016, 387, 2340–2348. [Google Scholar] [CrossRef]
- Galleri, L.; Sebastiani, G.; Vendrame, F.; Grieco, F.A.; Spagnuolo, I.; Dotta, F. Viral infections and diabetes. Retinal Degenerative Diseases 2012, 771, 252–271. [Google Scholar] [CrossRef]
- De Beeck, A.O.; Eizirik, D.L. Viral infections in type 1 diabetes mellitus—why the beta cells? Nat. Rev. Endocrinol. 2016, 12, 263–273. [Google Scholar] [CrossRef]
- Cardwell, C.R.; Stene, L.C.; Joner, G.; Davis, E.A.; Cinek, O.; Rosenbauer, J.; Ludvigsson, J.; Castell, C.; Svensson, J.; Goldacre, M.J.; et al. Birthweight and the risk of childhood-onset type 1 diabetes: A meta-analysis of observational studies using individual patient data. Diabetologia 2010, 53, 641–651. [Google Scholar] [CrossRef]
- Harder, T.; Roepke, K.; Diller, N.; Stechling, Y.; Dudenhausen, J.W.; Plagemann, A. Birth Weight, Early Weight Gain, and Subsequent Risk of Type 1 Diabetes: Systematic Review and Meta-Analysis. Am. J. Epidemiol. 2009, 169, 1428–1436. [Google Scholar] [CrossRef] [PubMed]
- Lamb, M.M.; Yin, X.; Barriga, K.; Hoffman, M.R.; Barón, A.E.; Eisenbarth, G.S.; Rewers, M.; Norris, J.M. Dietary glycemic index, development of islet autoimmunity, and subsequent progression to type 1 diabetes in young children. J. Clin. Endocrinol. Metab. 2008, 93, 3936–3942. [Google Scholar] [CrossRef] [PubMed]
- Norris, J.M.; Barriga, K.; Klingensmith, G.; Hoffman, M.; Eisenbarth, G.S.; Erlich, H.; Rewers, M. Timing of Initial Cereal Exposure in Infancy and Risk of Islet Autoimmunity. JAMA 2003, 290, 1713–1720. [Google Scholar] [CrossRef] [PubMed]
- Ziegler, A.-G.; Schmid, S.; Huber, D.; Hummel, M.; Bonifacio, E. Early Infant Feeding and Risk of Developing Type 1 Diabetes–Associated Autoantibodies. JAMA 2003, 290, 1721. [Google Scholar] [CrossRef]
- Sepa, A.; Wahlberg, J.; Vaarala, O.; Frodi, A.; Ludvigsson, J. Psychological Stress May Induce Diabetes-Related Autoimmunity in Infancy. Diabetes Care 2005, 28, 290–295. [Google Scholar] [CrossRef][Green Version]
- Phillips, N.; Ke, E.; Nham, A.; Seidl, M.; Freeman, B.; Abadejos, J.R.; Xiao, C.; Nemazee, D.; Ku, M.; Kirak, O. Prediabetes Induced by a Single Autoimmune B Cell Clone. Front. Immunol. 2020, 11. [Google Scholar] [CrossRef]
- Anderson, M.S.; Bluestone, J.A. THE NOD MOUSE: A Model of Immune Dysregulation. Annu. Rev. Immunol. 2005, 23, 447–485. [Google Scholar] [CrossRef]
- Aoki, C.; Borchers, A.; Ridgway, W.; Keen, C.; Ansari, A.; Gershwin, M.E. NOD mice and autoimmunity. Autoimmun. Rev. 2005, 4, 373–379. [Google Scholar] [CrossRef]
- Kikutani, H.; Makino, S. The Murine Autoimmune Diabetes Model: NOD and Related Strains. Adv. Immunol. 1992, 51, 285–322. [Google Scholar] [CrossRef]
- Makino, S.; Kunimoto, K.; Muraoka, Y.; Mizushima, Y.; Katagiri, K.; Tochino, Y. Breeding of a Non-Obese, Diabetic Strain of Mice. Exp. Anim. 1980, 29, 1–13. [Google Scholar] [CrossRef]
- Mullen, Y. Development of the Nonobese Diabetic Mouse and Contribution of Animal Models for Understanding Type 1 Diabetes. Pancreas 2017, 46, 455–466. [Google Scholar] [CrossRef] [PubMed]
- Simon, M.M.; Greenaway, S.; White, J.K.; Fuchs, H.; Gailus-Durner, V.; Wells, S.; Sorg, T.; Wong, K.; Bedu, E.; Cartwright, E.J.; et al. A comparative phenotypic and genomic analysis of C57BL/6J and C57BL/6N mouse strains. Genome Boil. 2013, 14, R82. [Google Scholar] [CrossRef] [PubMed]
- Ku, M.; Chang, S.E.; Hernandez, J.; Abadejos, J.R.; Sabouri-Ghomi, M.; Muenchmeier, N.J.; Schwarz, A.; Valencia, A.M.; Kirak, O. Nuclear transfer nTreg model reveals fate-determining TCR-beta and novel peripheral nTreg precursors. Proc. Natl. Acad. Sci. USA 2016, 113, E2316–E2325. [Google Scholar] [CrossRef] [PubMed]
- Ku, M.; Ke, E.; Sabouri-Ghomi, M.; Abadejos, J.; Freeman, B.; Nham, A.; Phillips, N.; Yang, K.Y.; Lui, K.O.; Kirak, O. Deconstructive SCNT reveals novel Treg subsets. J. Allergy Clin. Immunol. 2018, 142, 997–1000. [Google Scholar] [CrossRef]
- Nichols, J.; Jones, K.; Phillips, J.M.; A Newland, S.; Roode, M.; Mansfield, W.; Smith, A.; Cooke, A. Validated germline-competent embryonic stem cell lines from nonobese diabetic mice. Nat. Med. 2009, 15, 814–818. [Google Scholar] [CrossRef] [PubMed]
- Beard, C.; Hochedlinger, K.; Plath, K.; Wutz, A.; Jaenisch, R. Efficient method to generate single-copy transgenic mice by site-specific integration in embryonic stem cells. Genesis 2006, 44, 23–28. [Google Scholar] [CrossRef]
- The ENCODE Project Consortium. ENCODE Project Consortium An integrated encyclopedia of DNA elements in the human genome. Nature 2012, 489, 57–74. [Google Scholar] [CrossRef]
- Hughes, E.D.; Qu, Y.Y.; Genik, S.J.; Lyons, R.H.; Pacheco, C.D.; Lieberman, A.P.; Samuelson, L.C.; Nasonkin, I.O.; Camper, S.A.; Van Keuren, M.L.; et al. Genetic variation in C57BL/6 ES cell lines and genetic instability in the Bruce4 C57BL/6 ES cell line. Mamm. Genome 2007, 18, 549–558. [Google Scholar] [CrossRef]
- Hejtmancik, J.F. Congenital cataracts and their molecular genetics. Semin. Cell Dev. Boil. 2008, 19, 134–149. [Google Scholar] [CrossRef]
- Wistow, G. The human crystallin gene families. Hum. Genom. 2012, 6, 26. [Google Scholar] [CrossRef]
- Bonev, B.; Cohen, N.M.; Szabo, Q.; Fritsch, L.; Papadopoulos, G.L.; Lubling, Y.; Xu, X.; Lv, X.; Hugnot, J.-P.; Tanay, A.; et al. Multiscale 3D Genome Rewiring during Mouse Neural Development. Cell 2017, 171, 557–572.e24. [Google Scholar] [CrossRef]
- Wang, Y.; Song, F.; Zhang, B.; Zhang, L.; Xu, J.; Kuang, D.; Li, D.; Choudhary, M.N.K.; Li, Y.; Hu, M.; et al. The 3D Genome Browser: A web-based browser for visualizing 3D genome organization and long-range chromatin interactions. Genome Boil. 2018, 19, 151. [Google Scholar] [CrossRef] [PubMed]
- Ashford, A.J.; Pain, V.M. Effect of diabetes on the rates of synthesis and degradation of ribosomes in rat muscle and liver in vivo. J. Boil. Chem. 1986, 261, 4059–4065. [Google Scholar]
- Ku, M.; Koche, R.P.; Rheinbay, E.; Mendenhall, E.M.; Endoh, M.; Mikkelsen, T.S.; Presser, A.; Nusbaum, C.; Xie, X.; Chi, A.S.; et al. Genomewide Analysis of PRC1 and PRC2 Occupancy Identifies Two Classes of Bivalent Domains. PLoS Genet. 2008, 4, e1000242. [Google Scholar] [CrossRef] [PubMed]
- Heintzman, N.D.; Hon, G.C.; Hawkins, R.D.; Kheradpour, P.; Stark, A.; Harp, L.F.; Ye, Z.; Lee, L.K.; Stuart, R.K.; Ching, C.W.; et al. Histone modifications at human enhancers reflect global cell-type-specific gene expression. Nature 2009, 459, 108–112. [Google Scholar] [CrossRef]
- Hnisz, D.; Abraham, B.J.; Lee, T.I.; Lau, A.; Saint-Andre, V.; Sigova, A.A.; Hoke, H.A.; Young, R.A. Super-enhancers in the control of cell identity and disease. Cell 2013, 155, 934–947. [Google Scholar] [CrossRef]
- Li, M.J.; Wang, P.; Liu, X.; Lim, E.L.; Wang, Z.; Yeager, M.; Wong, M.P.; Sham, P.C.; Chanock, S.J.; Wang, J.-W. GWASdb: A database for human genetic variants identified by genome-wide association studies. Nucleic Acids Res. 2011, 40, D1047–D1054. [Google Scholar] [CrossRef]
- Rouillard, A.D.; Gundersen, G.W.; Fernandez, N.F.; Wang, Z.-C.; Monteiro, C.D.; McDermott, M.G.; Ma’Ayan, A. The harmonizome: A collection of processed datasets gathered to serve and mine knowledge about genes and proteins. Database 2016, 2016. [Google Scholar] [CrossRef]
- Borish, L.C.; Steinke, J.W. 2. Cytokines and chemokines. J. Allergy Clin. Immunol. 2003, 111, S460–S475. [Google Scholar] [CrossRef]
- Nackiewicz, D.; Dan, M.; He, W.; Kim, R.; Salmi, A.; Rütti, S.; Westwell-Roper, C.; Cunningham, A.; Speck, M.; Schuster-Klein, C.; et al. TLR2/6 and TLR4-activated macrophages contribute to islet inflammation and impair beta cell insulin gene expression via IL-1 and IL-6. Diabetologia 2014, 57, 1645–1654. [Google Scholar] [CrossRef]
- Kim, H.S.; Han, M.S.; Chung, K.W.; Kim, S.; Kim, E.; Kim, M.J.; Jang, E.; Lee, H.A.; Youn, J.; Akira, S.; et al. Toll-like Receptor 2 Senses β-Cell Death and Contributes to the Initiation of Autoimmune Diabetes. Immunity 2007, 27, 321–333. [Google Scholar] [CrossRef] [PubMed]
- Lee, H.-M.; Kim, J.-J.; Kim, H.J.; Shong, M.; Ku, B.J.; Jo, E.-K. Upregulated NLRP3 Inflammasome Activation in Patients With Type 2 Diabetes. Diabetes 2012, 62, 194–204. [Google Scholar] [CrossRef] [PubMed]
- Leite, J.A.; Pessenda, G.; Guerra-Gomes, I.C.; De Santana, A.K.M.; Pereira, C.A.; Costa, F.R.C.; Ramos, S.G.; Zamboni, D.S.; Faria, A.M.C.; Almeida, D.C.; et al. The DNA Sensor AIM2 Protects against Streptozotocin-Induced Type 1 Diabetes by Regulating Intestinal Homeostasis via the IL-18 Pathway. Cells 2020, 9, 959. [Google Scholar] [CrossRef] [PubMed]
- Inoue, Y.; Kaifu, T.; Sugahara-Tobinai, A.; Nakamura, A.; Miyazaki, J.-I.; Takai, T. Activating Fcγ Receptors Participate in the Development of Autoimmune Diabetes in NOD Mice. J. Immunol. 2007, 179, 764–774. [Google Scholar] [CrossRef]
- Sharma, A.; Purohit, S.; Sharma, S.; Bai, S.; Zhi, W.; Ponny, S.R.; Hopkins, D.; Steed, L.; Bode, B.; Anderson, S.W.; et al. IGF-Binding Proteins in Type-1 Diabetes Are More Severely Altered in the Presence of Complications. Front. Endocrinol. 2016, 7. [Google Scholar] [CrossRef]
- Narayanan, R.P.; Fu, B.; Heald, A.H.; Siddals, K.W.; Oliver, R.L.; E Hudson, J.; Payton, A.; Anderson, S.G.; White, A.; Ollier, W.E.R.; et al. IGFBP2 is a biomarker for predicting longitudinal deterioration in renal function in type 2 diabetes. Endocr. Connect. 2012, 1, 95–102. [Google Scholar] [CrossRef]
- Lu, J.; Liu, J.; Li, L.; Lan, Y.; Liang, Y. Cytokines in type 1 diabetes: Mechanisms of action and immunotherapeutic targets. Clin. Transl. Immunol. 2020, 9, e1122. [Google Scholar] [CrossRef]
- Lu, H.; Raptis, M.; Black, E.; Stan, M.; Amar, S.; Graves, D.T. Influence of Diabetes on the Exacerbation of an Inflammatory Response in Cardiovascular Tissue. Endocrinology 2004, 145, 4934–4939. [Google Scholar] [CrossRef]
- Naguib, G.; Al-Mashat, H.; Desta, T.; Graves, D.T.; Graves, G.N.H.A.-M.T.D.T. Diabetes Prolongs the Inflammatory Response to a Bacterial Stimulus Through Cytokine Dysregulation. J. Investig. Dermatol. 2004, 123, 87–92. [Google Scholar] [CrossRef]
- Shruthi, S.; Mohan, V.; Amutha, A.; Aravindhan, V. Increased serum levels of novel T cell cytokines IL-33, IL-9 and IL-17 in subjects with type-1 diabetes. Cytokine 2016, 86, 6–9. [Google Scholar] [CrossRef]
- Spolski, R.; Kashyap, M.; Robinson, C.; Yu, Z.; Leonard, W.J. IL-21 signaling is critical for the development of type I diabetes in the NOD mouse. Proc. Natl. Acad. Sci. USA 2008, 105, 14028–14033. [Google Scholar] [CrossRef] [PubMed]
- Wernig, M.; Meissner, A.; Foreman, R.; Brambrink, T.; Ku, M.; Hochedlinger, K.; Bernstein, B.E.; Jaenisch, R. In vitro reprogramming of fibroblasts into a pluripotent ES-cell-like state. Nature 2007, 448, 318–324. [Google Scholar] [CrossRef] [PubMed]
- Ryno, L.M.; Genereux, J.C.; Naito, T.; Morimoto, R.I.; Powers, E.; Shoulders, M.D.; Wiseman, R.L. Characterizing the Altered Cellular Proteome Induced by the Stress-Independent Activation of Heat Shock Factor 1. ACS Chem. Boil. 2014, 9, 1273–1283. [Google Scholar] [CrossRef] [PubMed]
- Park, S.K.R.; Aslanian, A.; McClatchy, D.B.; Han, X.; Shah, H.; Singh, M.; Rauniyar, N.; Moresco, J.J.; Pinto, A.F.M.; Diedrich, J.K.; et al. Census 2: Isobaric labeling data analysis. Bioinformatics 2014, 30, 2208–2209. [Google Scholar] [CrossRef]
- Xu, T.; Park, S.K.; Venable, J.D.; Wohlschlegel, J.; Diedrich, J.K.; Cociorva, D.; Lu, B.; Liao, L.; Hewel, J.; Han, X.; et al. ProLuCID: An improved SEQUEST-like algorithm with enhanced sensitivity and specificity. J. Proteom. 2015, 129, 16–24. [Google Scholar] [CrossRef]
- Perez-Riverol, Y.; Csordas, A.; Bai, J.; Llinares, M.B.; Hewapathirana, S.; Kundu, D.J.; Inuganti, A.; Griss, J.; Mayer, G.; Eisenacher, M.; et al. The PRIDE database and related tools and resources in 2019: Improving support for quantification data. Nucleic Acids Res. 2018, 47, D442–D450. [Google Scholar] [CrossRef]
- Dobin, A.; Davis, C.A.; Schlesinger, F.; Drenkow, J.; Zaleski, C.; Jha, S.; Batut, P.; Chaisson, M.; Gingeras, T. STAR: Ultrafast universal RNA-seq aligner. Bioinformatics 2012, 29, 15–21. [Google Scholar] [CrossRef]
- Heinz, S.; Benner, C.; Spann, N.; Bertolino, E.; Lin, Y.C.; Laslo, P.; Cheng, J.X.; Murre, C.; Singh, H.; Glass, C. Simple Combinations of Lineage-Determining Transcription Factors Prime cis-Regulatory Elements Required for Macrophage and B Cell Identities. Mol. Cell 2010, 38, 576–589. [Google Scholar] [CrossRef]
- Szklarczyk, D.; Franceschini, A.; Wyder, S.; Forslund, K.; Heller, D.; Huerta-Cepas, J.; Simonovic, M.; Roth, A.; Santos, A.; Tsafou, K.P.; et al. STRING v10: Protein-protein interaction networks, integrated over the tree of life. Nucleic Acids Res. 2014, 43, D447–D452. [Google Scholar] [CrossRef]
- Huang, D.W.; Sherman, B.T.; Lempicki, R.A. Systematic and integrative analysis of large gene lists using DAVID bioinformatics resources. Nat. Protoc. 2009, 4, 44–57. [Google Scholar] [CrossRef]
- Ku, M.; Jaffe, J.D.; Koche, R.P.; Rheinbay, E.; Endoh, M.; Koseki, H.; Carr, S.A.; Bernstein, B.E. H2A.Z landscapes and dual modifications in pluripotent and multipotent stem cells underlie complex genome regulatory functions. Genome Boil. 2012, 13, R85. [Google Scholar] [CrossRef] [PubMed]


© 2020 by the authors. Licensee MDPI, Basel, Switzerland. This article is an open access article distributed under the terms and conditions of the Creative Commons Attribution (CC BY) license (http://creativecommons.org/licenses/by/4.0/).
Share and Cite
Kirak, O.; Ke, E.; Yang, K.Y.; Schwarz, A.; Plate, L.; Nham, A.; Abadejos, J.R.; Valencia, A.; Wiseman, R.L.; Lui, K.O.; et al. Premature Activation of Immune Transcription Programs in Autoimmune-Predisposed Mouse Embryonic Stem Cells and Blastocysts. Int. J. Mol. Sci. 2020, 21, 5743. https://doi.org/10.3390/ijms21165743
Kirak O, Ke E, Yang KY, Schwarz A, Plate L, Nham A, Abadejos JR, Valencia A, Wiseman RL, Lui KO, et al. Premature Activation of Immune Transcription Programs in Autoimmune-Predisposed Mouse Embryonic Stem Cells and Blastocysts. International Journal of Molecular Sciences. 2020; 21(16):5743. https://doi.org/10.3390/ijms21165743
Chicago/Turabian StyleKirak, Oktay, Eugene Ke, Kevin Y. Yang, Anna Schwarz, Lars Plate, Amy Nham, Justin R. Abadejos, Anna Valencia, R. Luke Wiseman, Kathy O. Lui, and et al. 2020. "Premature Activation of Immune Transcription Programs in Autoimmune-Predisposed Mouse Embryonic Stem Cells and Blastocysts" International Journal of Molecular Sciences 21, no. 16: 5743. https://doi.org/10.3390/ijms21165743
APA StyleKirak, O., Ke, E., Yang, K. Y., Schwarz, A., Plate, L., Nham, A., Abadejos, J. R., Valencia, A., Wiseman, R. L., Lui, K. O., & Ku, M. (2020). Premature Activation of Immune Transcription Programs in Autoimmune-Predisposed Mouse Embryonic Stem Cells and Blastocysts. International Journal of Molecular Sciences, 21(16), 5743. https://doi.org/10.3390/ijms21165743