Abstract
Some drugs can be used to treat multiple diseases, suggesting potential patterns in drug treatment. Determination of drug treatment patterns can improve our understanding of the mechanisms of drug action, enabling drug repurposing. A drug can be associated with a multilayer tissue-specific protein–protein interaction (TSPPI) network for the diseases it is used to treat. Proteins usually interact with other proteins to achieve functions that cause diseases. Hence, studying drug treatment patterns is similar to studying common module structures in multilayer TSPPI networks. Therefore, we propose a network-based model to study the treatment patterns of drugs. The method was designated SDTP (studying drug treatment pattern) and was based on drug effects and a multilayer network model. To demonstrate the application of the SDTP method, we focused on analysis of trichostatin A (TSA) in leukemia, breast cancer, and prostate cancer. We constructed a TSPPI multilayer network and obtained candidate drug-target modules from the network. Gene ontology analysis provided insights into the significance of the drug-target modules and co-expression networks. Finally, two modules were obtained as potential treatment patterns for TSA. Through analysis of the significance, composition, and functions of the selected drug-target modules, we validated the feasibility and rationality of our proposed SDTP method for identifying drug treatment patterns. In summary, our novel approach used a multilayer network model to overcome the shortcomings of single-layer networks and combined the network with information on drug activity. Based on the discovered drug treatment patterns, we can predict the potential diseases that the drug can treat. That is, if a disease-related protein module has a similar structure, then the drug is likely to be a potential drug for the treatment of the disease.
1. Introduction
Drugs interact with target and non-target molecules, thus triggering downstream signal cascades and disrupting the cell’s transcriptome [1]. Discovering new drug targets is critical for improving our understanding of the mechanisms of drug action [2], which is essential for drug discovery [3,4,5,6], clinical trials, and overcoming drug resistance [7,8]. The mechanisms mediating the effects of drugs on targets have been widely studied [9,10,11,12,13,14,15]. Drug targets are not only limited to a single gene and can also include modules or pathways that participate in the regulation of disease processes [16]. Although each gene in the drug-target module may not be helpful for disease treatment, combinations of the genes within the module may play important roles in disease treatment [16]. By targeting multiple genes in the drug-target module, it may be possible to identify the function of genes related to complex disease pathology at the tissue level [17,18].
Many drugs have been shown to be effective against a variety of diseases [19], indicating that drug treatment may exhibit a certain pattern. Genes in drug-target modules are highly expressed in disease-associated tissues [20,21,22], allowing drug targets to be treated by specific small-molecule drugs [23,24,25,26]. In a previous study [27], researchers assumed that each disease corresponds to a tissue-specific protein–protein interaction (TSPPI) network, suggesting that a single drug could be associated with a multilayer TSPPI network. Because biological networks complement each other [28,29], many studies in this field have focused on multilayer networks [30]. Accordingly, it may be helpful to explore drug treatment patterns by extracting target modules from multilayer TSPPI networks.
In this report, we propose a new method to study drug treatment patterns based on drug activity and a multilayer network model, as shown in Figure 1. First, gene expression data obtained from the Gene Expression Omnibus (GEO) [31], The Cancer Genome Atlas (TCGA) [32], and the Connectivity Map (CMAP) [33,34] were preprocessed (Figure 1A). Based on the expression values of genes in disease states and drugs, we selected genes that played a key role when drugs acted on each disease. Next, we preprocessed multiple TSPPI networks downloaded from the Genome-scale Integrated Analysis of Gene Networks in Tissues (GIANT) database (Figure 1B) [27]. We selected edges with higher weights to improve the reliability of TSPPI networks. We then selected common genes from multiple high-quality TSPPI networks (Figure 1C) and created relevant subgraphs for each TSPPI network. These subgraphs were then normalized to form a multilayer network with the same nodes and no interaction between layers, and a multilayer network module mining algorithm was used to identify candidate drug target modules (Figure 1D). Finally, we performed a series of filtering processes on all candidate drug target modules and used the remaining modules as potential drug targets (Figure 1E). We performed a case study using the drug trichostatin A (TSA) [35] and three diseases (leukemia, breast cancer, and prostate cancer) that are commonly treated with TSA [36,37,38,39,40]. Our analysis identified two drug-target modules for TSA (M17 and M18) as potential treatment patterns for TSA.
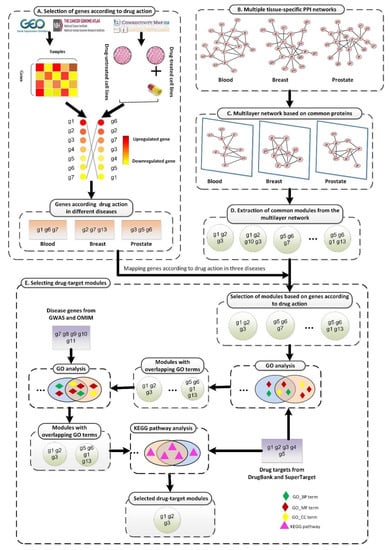
Figure 1.
The framework of the proposed SDTP method. (A) Selection of genes according to TSA activity in three diseases based on gene differential expression profiles. (B) Processing of TSPPI networks related to the three diseases from the GIANT database. (C) Standardization of a multilayer subgraph based on common proteins obtained from (B). (D) Use of the tensor-based mining algorithm to identify drug-target modules from the multilayer TSPPI network. (E) Selection and validation of drug-target modules.
Key points:
- For the first time, we proposed a network-based model to analyze the drug treatment patterns.
- The new framework to study the treatment pattern of drugs was based on the action of drug and multilayer network model.
- Taking drug TSA as a case, we found two modules from a tissue-specific multilayer protein-protein network as TSA’s treatment patterns.
- By analyzing the significance, composition, and functions, the two modules were proven to be the potential treatment patterns of TSA.
- Analysis of the treatment patterns of the drug through the network method provides novel solutions for disease treatment.
2. Materials and Methods
To develop and validate our proposed method, our study case used TSA and three diseases that are commonly treated with TSA (leukemia, breast cancer, and prostate cancer).
2.1. Datasets
2.1.1. Gene Expression Data for TSA Activity
From the CMAP database [33,34], we downloaded gene expression data for multiple samples related to TSA activity. The gene expression data represent the gene expression values before and after using TSA on cell lines of different diseases. The data were obtained from MCF7, PC3, and HL60 cells using HT_HG-U133A chips.
2.1.2. Gene Expression Data According to Disease State
We downloaded gene expression profiles for breast cancer and prostate cancer from TCGA database [41]. This gene expression profile represent the gene expression values of a patient in a disease state. The breast cancer data were obtained from 1212 samples (1100 tumor samples and 112 control samples). The prostate cancer data were obtained from 550 samples (498 tumor samples and 52 control samples). We downloaded the gene expression profiles for leukemia from the NCBI GEO database [31]. The gene expression data (GSE48558) were obtained from 170 samples (121 tumor samples and 49 control samples).
2.1.3. TSPPI Networks
We downloaded weighted TSPPI networks for breast cancer, prostate cancer, and blood tissues marked as “top edges” from the GIANT database [27]. The TSPPI network represents the interaction network between genes in the corresponding tissue. “Top edges” signified that the network was filtered to include only edges that had evidence (weight) supporting a tissue-specific functional interaction.
2.2. Standardizing Networks
We used the following equation to standardize the weights of three TSPPI networks (breast, prostate, and blood tissues):
where and were set to 1 and 0.1, respectively. and represented the maximum and minimum weights of edges before the normalization, respectively. and represented the weights of edges before and after normalization, respectively. Further, we processed the three normalized networks based on nodes, edges, and node degree distribution information.
2.3. Selecting Differentially Expressed Genes
For gene expression profiles of the disease conditions (leukemia, breast cancer, and prostate cancer) and TSA activity, we used the Limma package [42] to analyze the differential expression of genes in cases and controls. The logFC value was used to evaluate the differential expression of genes. If , gene i was an upregulated gene; if , gene i did not differ between cases and controls, and if , gene i was a downregulated gene.
Finally, we obtained three sets of differentially expressed genes (, , and ) in three different disease states (l = leukemia, b = breast cancer, and p = prostate cancer) and a set of differentially expressed genes related to TSA activity. For example, if a gene in was upregulated or downregulated in , then this gene was selected. Accordingly, we selected a subset of genes from that were critical for the treatment effects of TSA in leukemia. Finally, we obtained 824, 1213, and 1160 genes for leukemia, breast cancer, and prostate cancer, respectively.
2.4. Mining Modules from the Multilayer Network
In this study, we used a tensor-based computational framework to mine recurrent heavy subgraphs (RHSs) in multilayer networks, as proposed by Li et al. [43]. For any given m networks with the same n nodes that have different topologies, the following third-order tensor A could be used to represent the network [43]:
where indicates the weight of the edge between vertices i and j in the network. If , . If the network is a unidirectional network, . Candidate drug-target modules in disease multilayer networks based on tensor recognition can be identified by heaviness [43]. The heaviness of an RHS is defined as the summed weight of all edges in the RHS [43]:
The gene vector , where if gene i belongs to the RHS, and otherwise. The network vector , where if the RHS appears in network j, and otherwise. In this study, we used RHSs with high heaviness as candidate drug-target modules for TSA.
2.5. Quantifying the Overlap between Modules
Modules containing at least three nodes were selected. We used the following measure to quantify the overlapping coefficient c between two modules:
where A and B were the set of genes in two modules, respectively, was the number of elements in the intersection of sets A and B, and was the minimum value of the number of elements in A and B. A higher value indicated that the two modules were similar. If , the two modules were defined as overlapped modules.
3. Results
3.1. Constructing Three-Layer Tissue-Specific Networks
3.1.1. Nodes and Edges
To ensure that the TSPPI networks had a similar density, we selected 173,072 edges (top 0.5%), 170,017 edges (top 0.25%), and 167,211 edges (top 0.25%) from the blood, breast, and prostate networks, respectively. The node information is shown in Figure 2. There were 5484 common nodes. From Figure 2, we found that most genes were involved in various cancers and only a small portion of the genes were tissue-specific [44].
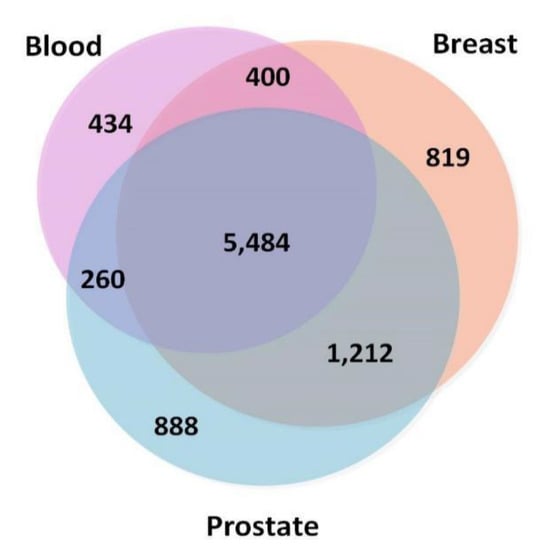
Figure 2.
Numbers of overlapping genes in three tissue-specific networks (blood, breast, and prostate).
3.1.2. Degree Distribution
PPI networks are subject to the general distribution of scale-free networks [45], with only a few nodes having a large degree and most nodes having a relatively small degree of distribution. Here, the degree of a node in a network was set as the number of connections the node has with other nodes. We calculated the degrees of all nodes while drawing their degree distributions. The results are shown in Figure 3. Notably, a small number of nodes had a degree greater than 500, and these nodes were called hub nodes. The data also showed that our processing of the edges of the three TSPPI networks was reasonable. Therefore, in the following sections, we analyzed the three-layer TSPPI networks with filtered edges.
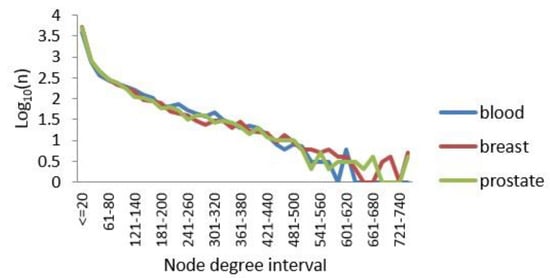
Figure 3.
Node degree distributions for the three TSPPI networks. The X axis represents the distribution interval of the node degree. The Y axis represents Log10(n), where n is the number of nodes.
3.2. Selecting Parameter Heaviness
To construct the tensor-based computational framework for mining RHSs in multilayer networks, one challenge is the determination of the key parameter value called heaviness [43] (see Formula (3)). In order to obtain the appropriate heaviness value, we determined the number of modules that could be significantly enriched in gene ontology (GO) terms and Kyoto Encyclopedia of Genes and Genomes (KEGG) pathways under different heaviness values, as shown in Figure 4A,B. As heaviness grew, the number of enriched modules Ne in GO data and KEGG pathways continued to decrease, whereas the ratio (Na is the total number of modules) increased. When heaviness was near 0.41, Rea changed smoothly, and when heaviness was equal to 0.41, Ne was slightly higher than its neighbor area.
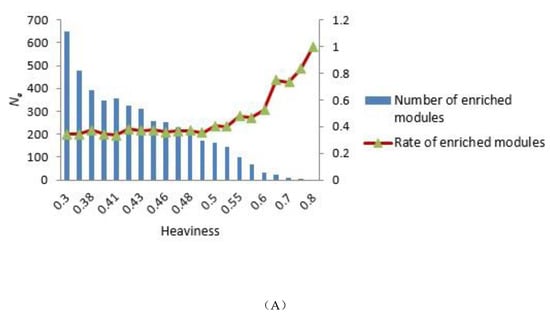
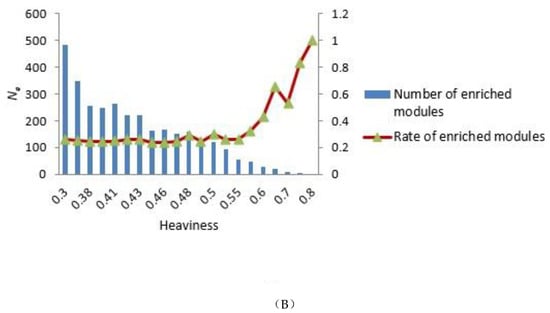
Figure 4.
Distribution of the number of modules that could be significantly enriched in GO terms and KEGG pathways. (A,B) GO terms and KEGG pathways analyses, respectively. The blue bars represent the number of modules that were significantly enriched in GO terms (A) and KEGG pathways (B) under different heaviness values, i.e., Ne. The Y coordinate on the left corresponds to changes in Ne. The red curve with triangles indicates the ratio Rea between Ne and the total number of modules Na. The Y coordinate on the right corresponds to the value of Rea.
In addition, if more known targets of the drug appeared in the module, the module was more likely to be a potential module target. Figure 5 shows the number of overlapping genes between the extracted modules and genes that TSA affected in three different diseases. We found that as module density (heaviness) increased, the number of overlapping genes decreased. Moreover, when compared with neighboring parameters, when module density (heaviness) was 0.41, the number of overlapping genes for leukemia (blood tissue) tended to increase (red line in Figure 5). For prostate cancer, a similar phenomenon was observed (green line in Figure 5). Therefore, we chose 0.41 as the value of heaviness. The drug-target modules obtained under this value were then analyzed.
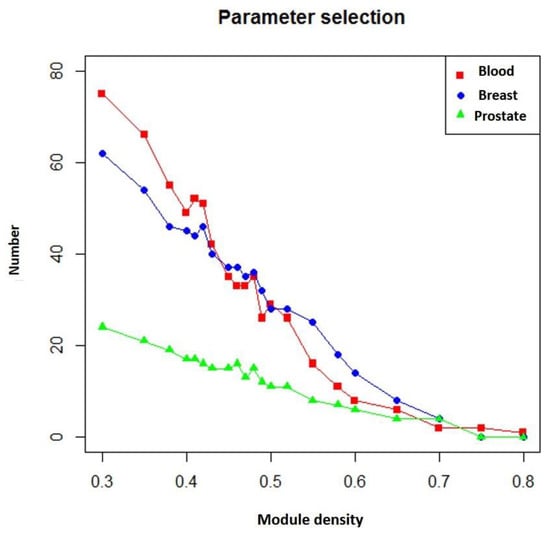
Figure 5.
Numbers of overlapping genes between modules generated under different heaviness values and genes affected by TSA in different diseases. Red line: blood (leukemia); blue line: breast (breast cancer); green line: prostate (prostate cancer). The X axis represents heaviness values (“module density), and the Y axis indicates the number of overlapping genes (“number”).
3.3. Comparison of Predicted Modules between Three-Layer and Single-Layer Networks
3.3.1. Comparison of Overlap between Modules
Next, based on the same module mining algorithm, we compared the overlap between modules mined in a single-layer network and modules mined in the three-layer network. The definition of overlap between two modules is shown in Equation (4), and the results of the comparisons are shown in Figure 6 and Figure 7. In Figure 6, if X was blood (or breast or prostate), its corresponding Y represented the number of overlapping modules between the single-layer blood (or breast or prostate) network and the three-layer network. If X was a combination of multiple single-layer networks, such as X = blood-breast, its corresponding Y represented the number of overlapping modules between the blood and breast PPI networks. Figure 7 shows the ratios between the numbers of overlapping modules shown in Figure 6 and the numbers of modules obtained from the multilayer network. The results from Figure 6 and Figure 7 showed that there were 285 (560 × 0.51 = 285) overlapping modules between the blood–breast–prostate modules and the three-layer network modules. Through this comparison, we found that modules in most single-layer networks could be detected and new modules could be found based on the multilayer network mining method. Information can be complementary between multilayer networks [46]. Therefore, the use of multilayer network mining algorithms could yield more meaningful modules [43,47].
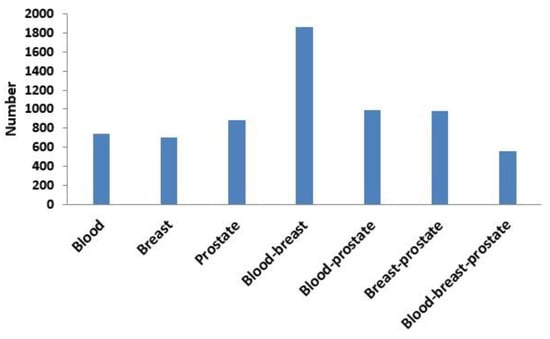
Figure 6.
Numbers of overlapping modules between the single-layer network (blood, breast, or prostate) and three-layer network and between two or three single-layer networks.
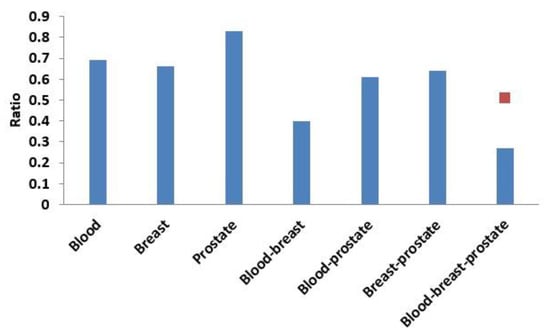
Figure 7.
Ratio of the number of overlapping modules and the number of modules obtained from the three-layer network. The red squares represent proportions of the numbers of overlapping modules between the blood-breast-prostate and three-layer network modules to the number of blood-breast-prostate modules.
3.3.2. Functional Enrichment Comparison
We enriched the functions of modules in our multilayer and three single-layer networks (blood, breast, and prostate) using GO terms [48], KEGG pathways [49], BioCarta, and Reactome. Figure 8 shows a comparison of the proportions of functionally enriched modules obtained in different networks. Except for BioCarta pathways, the enrichment proportions of multilayer modules were all higher than those of single-layer modules. For BioCarta, the enrichment proportion of multilayer modules, although not as high as that of the modules in the prostate network, was slightly higher than the other two (blood and breast) single-layer networks.
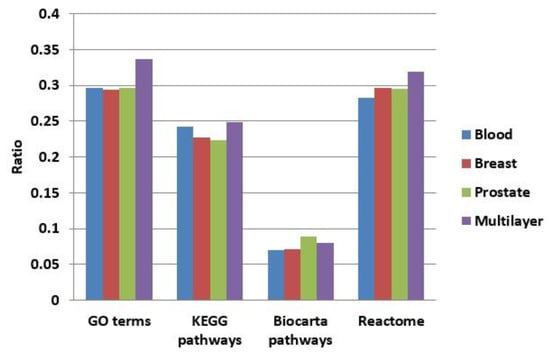
Figure 8.
Comparison of the proportions of functionally enriched modules obtained for different networks using four enrichment methods.
3.4. Filtering Extracted Modules in the Multilayer Network
In total, we found 1063 drug-target modules from the multilayer network. To improve the reliability of drug-target modules, we filtered them based on sequential three steps, i.e., TSA activity, GO terms, and KEGG pathways.
3.4.1. Analysis Based on TSA Activity
If a drug-target module contained differentially expressed genes, it was selected for further analysis. Based on this principle, 26 modules were selected, as shown in Table 1. For convenience, we numbered these modules M1–M26.

Table 1.
Selected candidate drug-target modules based on genes affected by TSA.
3.4.2. Analysis Based on GO Terms
Next, the 26 selected modules in Table 1 were subjected to additional processing. GO [48] is a framework for biological models that divides genes based on molecular functions (MFs), cellular components (CCs), and biological processes (BPs). A module was chosen if the module had overlapping GO terms with the TSA target genes. Furthermore, we also ensured that the module was related to the disease; thus, the module had overlapping GO terms with disease-causing genes. We further filtered the 26 selected modules using two steps.
In the first step, modules were filtered by overlapping GO terms with TSA targets. We downloaded the targets of TSA through SuperTarget (http://insilico.charite.de/supertarget/), a database developed to collect information about drug-target relations [50], and DrugBank (https://www.drugbank.ca/), a unique bioinformatics and cheminformatics resource that combines detailed drug data with comprehensive drug-target information databases [51]. TSA targets were mapped to DAVID (version 6.8) [52,53] for GO enrichment analysis. In total, 74 GO terms were enriched, including 42 BP terms, 20 MF terms, and 12 CC terms. For each of the 26 modules, the same analysis in DAVID was performed. That is, each module corresponded to a GO term list, including BP, MF, and CC terms. For each of the BP, MF, and CC terms, we first obtained the number of terms common to each module and the corresponding TSA targets. We then calculated the proportion of the number of common terms among the total number of terms related to each module. The results are shown in Figure 9.
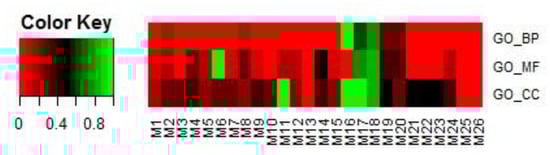
Figure 9.
Proportions of the numbers of common terms between each of the 26 selected modules and TSA targets among the total number of terms related to the module. Terms included BPs, MFs, and CCs.
If a module had more overlapping GO terms in BPs, MFs, and CCs, it was selected in this step for further analysis in step 2. In this study, eight modules, i.e., M1, M2, M3, M8, M17, M18, M19, and M20, were selected.
In the second step, the eight modules selected in step 1 were filtered by overlapping GO terms with disease genes. Genes related to leukemia, breast cancer, and prostate cancer were downloaded from OMIM [54,55] and GWAS databases [56]. The same GO enrichment analysis was performed. For leukemia, breast cancer, and prostate cancer, the overlap rates between the disease-enriched GO terms and the selected eight module-enriched GO terms are shown in Figure 10A–C.
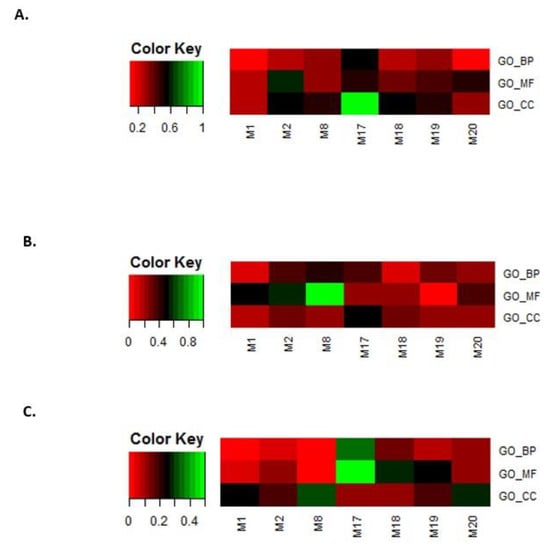
Figure 10.
Overlap rates between disease-enriched GO terms and the eight selected module-enriched GO terms. (A) leukemia, (B) breast cancer, and (C) prostate cancer.
We only kept modules that overlapped with the BP, MF, and CC terms that were enriched for the three disease gene sets. In this way, we obtained four modules, i.e., M2, M17, M18, and M20.
3.4.3. Analysis Based on KEGG Pathways
To further elucidate the relationships between modules, we also analyzed the relationships between internal genes and their first-order neighbors in the modules. The external genes were more closely related to the module and were more affected by the module. The strength of the relationship between a module and its first-order gene was defined as:
where represents the weight between () and .
For each of the modules (M2, M17, M18, and M20), we separately calculated their connection strength with their first-order nodes in blood, breast, and prostate TSPPI networks. The results are shown in Figure 11A–C. For each module, we selected first-order genes with high scores to analyze KEGG pathway enrichment by DAVID.
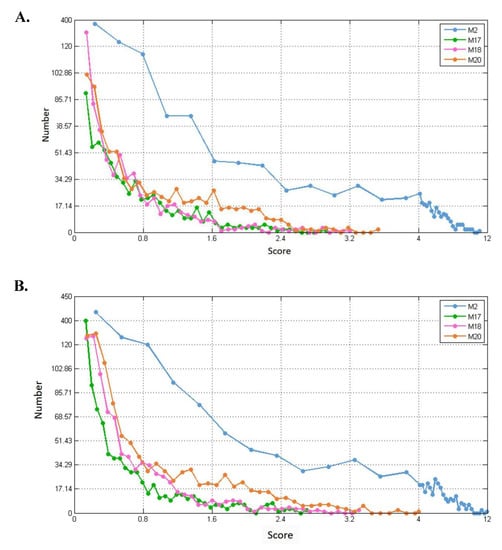
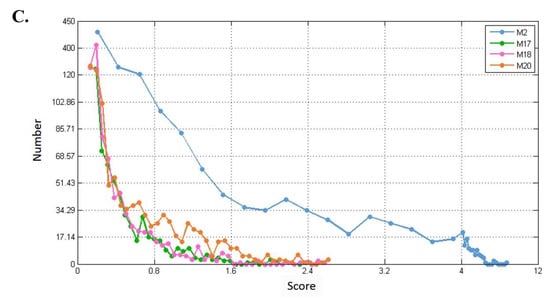
Figure 11.
Distribution of connection strengths between four modules and their corresponding first-order genes in three tissue-specific networks. The X axis represents the connection strength. The Y axis indicates the number of first-order genes of modules. (A–C) show blood, breast, and prostate TSPPI networks, respectively.
In different networks, the distribution of first-order neighbor nodes of the same module was similar. When there was a different number of nodes in each module, the number of first-order neighbors differed. Thus, the four modules had different first-order neighbors in the same network. We used the following method to filter the first-order neighbors for each module. First, we selected 1,000,000 genes randomly from the first-order genes of a module and determined their connection strength scores (see Formula (5)). We sorted all the scores in descending order and selected the 50th value as the threshold. Finally, genes whose scores were greater than this threshold were retained. For each of the four modules, we performed KEGG pathway enrichment analysis for the modules and their preserved first-order neighbors. The results for blood, breast, and prostate tissue-specific networks are shown in Table 2, Table 3 and Table 4. For example, in Table 2, for module M2, the threshold 7.0 was used to filter the first-order genes. Forty-six first-order genes were conserved and enriched in 12 KEGG pathways.
Table 2.
KEGG pathway enrichment of conserved first-order genes of modules in the blood TSPPI network.
Table 3.
KEGG pathway enrichment of conserved first-order genes of modules in the breast TSPPI network.
Table 4.
KEGG pathway enrichment of conserved first-order genes of modules in the prostate TSPPI network.
Drugs can treat the target diseases by affecting first-order neighbors of the module. The more the KEGG pathways overlapped between the first-order genes of the module and TSA targets, the better the therapeutic effect. Table 5 shows the number of KEGG pathways that overlapped between the first-order genes of the module and the TSA targets. Finally, two modules (M17 and M18) were selected.
Table 5.
The number of KEGG pathways that overlapped between the first-order genes of the module and the TSA targets in three TSPPI networks.
In addition, we also analyzed the KEGG pathways that overlapped between the first-order genes of M17 and M18 and genes that caused leukemia, breast cancer, and prostate cancer. We found that overlap was enhanced. Table 6 shows the number of overlapping KEGG pathways. The results verified that TSA could be used to treat these three diseases and that the two identified modules, M17 and M18, were likely to indicate the TSA treatment pattern.
Table 6.
The number of overlapping KEGG pathways enriched by first-order genes of M17 and M18 and disease-causing genes for leukemia, breast cancer, and prostate cancer.
3.5. Validating and Analyzing the Significance of M17 and M18
3.5.1. Statistical Significance
To verify that modules M17 and M18 were biologically significant, we performed the following five-step analysis using the blood, breast, and prostate TSPPI networks: (1) the sum of the weights of the inner edges of module ( = M17 or M18) in the TSPPI network was calculated and saved as ; (2) the TSPPI network used in step 1 was randomly disturbed, the network connections were unchanged, and the weights of the edges were randomly disrupted; (3) in the randomized network obtained in step 2, the sum of the weights of the inner edges of module was calculated again; (4) steps 2 and 3 were repeated 106 times, and the results were saved as ; and (5) the result obtained in step 4 was compared with the result obtained in step 1 using the following formula:
where denotes the value of the drug-target module . If , ; otherwise,. Smaller values were associated with more meaningful modules. Based on the above analysis, we obtained the values of M17 and M18. The results are shown in Table 7.
Table 7.
Significance of target modules M17 and M18 for TSA in the three TSPPI networks.
From Table 7, we found that the values of M17 and M18 were both less than 0.05. The results demonstrated that the target modules M17 and M18 for TSA were highly statistically significant and that their internal genes had strong interactions.
3.5.2. Significance of Other TSA-Related TSPPI Networks
To further verify the close correlations of modules M17 and M18 with TSA, we also analyzed the performance of M17 and M18 in TSPPI networks related to other diseases treated with TSA. We obtained five other TSA-treated cancers marked as “T” in the CTD [32], i.e., lung cancer, colon cancer, ovarian cancer, pancreatic cancer, and myeloma. Their TSPPI networks were all downloaded from GIANT, and edges with low weights were deleted. The network preprocessing procedures were the same as those described in Section 3.1. For the five processed networks, we also calculated the p values of module targets M17 and M18. The results are shown in Table 8.
Table 8.
Significance of target modules for TSA in five other TSA-related PPI networks.
As shown in Table 8, the p values were all less than 0.05. These findings indicated the importance of M17 and M18 in these TSPPI networks, suggesting that TSA may be used to treat other diseases by acting on M17 and M18. Therefore, these results were strong evidence supporting M17 and M18 as a treatment pattern for TSA.
3.6. Differential Analysis of Internal Connections in M17 and M18 for Co-Expression Networks
Perturbations in network characteristics induced by genetic variation cause phenotypic changes, such as disease [57]. Next, we investigated the differential connections within modules of M17 and M18 in co-expression networks under disease and normal conditions. We used Pearson correlation coefficients to establish co-expression network connections for genes in M17 and M18 in disease and control samples. We found that the connections differed substantially. Figure 12 and Figure 13 showed differences in the co-expression network connections of M17 and M18. For example, in the control (normal) and case (tumor) samples for leukemia (Figure 12(A1,A2)), none of the gene pairs in M17 shared similar relationships in the two co-expression networks. For module M18, the connection differences between genes in case and control samples were very large, e.g., in leukemia (Figure 13(A1,A2)). These results indicated that leukemia, breast cancer, and prostate cancer were closely related to modules M17 and M18 and that these modules may cause different diseases owing to changes in connectivity under different conditions. However, these findings also suggested that the modules M17 and M18 were likely potential treatment patterns for TSA.
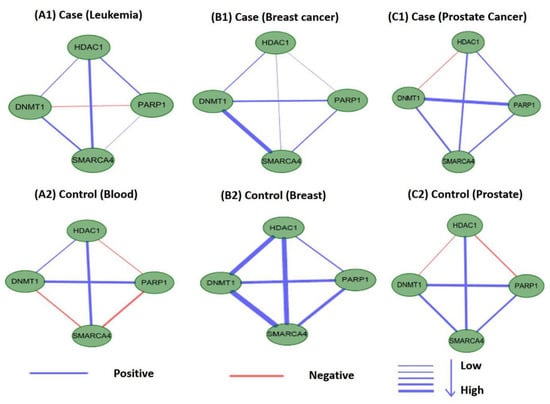
Figure 12.
Differences in the co-expression network connections of M17 in normal and tumor-based states under three different conditions (leukemia, breast cancer, and prostate cancer).
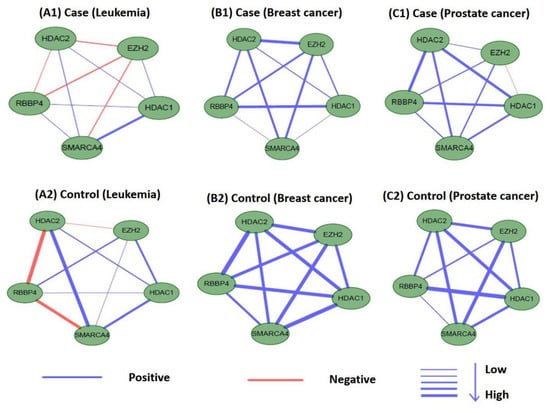
Figure 13.
Differences in the co-expression network connections of M18 in normal and tumor-based states under three different conditions (leukemia, breast cancer, and prostate cancer).
3.7. PubMed Literature Validation of Genes in Modules M17 and M18
M17 contained four genes: histone deacetylase 1 (HDAC1), poly-ADP ribose polymerase 1 (PARP1), DNA methyltransferase 1 (DNMT1), and SWI/SNF related, matrix associated, actin dependent regulator of chromatin, subfamily A, member 4 (SMARCA4), whereas M18 contained five genes: HDAC2, HDAC1, RB binding protein 4 (RBBP4), enhancer of Zeste homolog 2, and SMARCA4. Among these genes, HDAC1 and HDAC2 are targets of TSA, which is a potent inhibitor of HDACs [37,58]. In M17 and M18, HDAC1 and HDAC2 linked to other genes to perform different functions. For example, DNMT1 in module M17 can be translated into a homodimer and form a stable complex with HDAC1 protein, inhibiting the transcription of the E2F-responsive promoter [59]. The combination of HDAC2, HDAC1, and RBBP4 genes in module M18 can form part of the core HDAC complex, and TSA chelates zinc ions in the recesses of the active site through the hydroxamic acid group of HDAC. In turn, this interaction prevents the catalytic action of HDAC [60]. The transcriptional translation of SMARCA4 in modules M17 and M18 is followed by part of the CREST-BRG1 complex, and the activity-dependent induction of N-methyl d-aspartate receptor subtype 2B (NR2B) expression involves the release of the HDAC1 gene. However, the CREST-BRG1 complex binds to the NR2B promoter and participates in transcriptional activation and selection of the gene’s inhibitory process, thereby affecting the release of the HDAC1 gene [61].
We further performed literature analysis to verify the relationship of the genes in M17 and M18 with TSA. SMARCA4 (also known as BRG1) has been shown to be involved in various developmental processes, transcriptional regulation, DNA repair, cell cycle regulation, and cancer [62]. SMARCA4 is an ATPase subunit essential for the SWI/SNF chromatin remodeling complex in mammals and is also involved in expression of the tumor-suppressor gene SNF2β [63]. Moreover, SMARCA4 can destroy the target region’s nucleosomes by using the energy generated by ATPase hydrolysis [63]. Mackmull et al. [64] found that SMARCA4 is affected at the protein level after 12h of TSA treatment, and its abundance at the protein level is regulated by a combination of transcriptional and post-transcriptional mechanisms. Using gene silencing techniques, they demonstrated that a decrease in SMARCA4 richness is sufficient to regulate transcriptional changes induced by TSA [64].
PARP1 modifies various nuclear proteins by encoding a chromatin-associated poly ADP-ribosyltransferase, which is dependent on DNA and participates in a variety of important cellular processes that regulate molecular activity associated with cellular recovery from DNA damage [65]. Nonhomologous end joining (NHEJ) is one of the major mechanisms through which DNA double-strand breaks (DSBs) are repaired. TSA significantly increases the probability of PARP1 binding to chromatin DSBs and the likelihood that poly ADP-ribose will colocalized with DSBs in TSA-treated patients with leukemia [62]. In addition, knockout of PARP1 inhibits the effects of TSA on NHEJ. Thus, these results indicated that administration of TSA can reduce the cytotoxicity of NHEJ in leukemia cells [66].
4. Conclusions
In biological networks, a drug’s therapeutic action disturbs the network. Drugs typically show therapeutic activity in many diseases. Thus, drug therapy exhibits certain types of patterns, such as unique modules related to the drug. In this report, we attempted to identify the treatment patterns, i.e., target modules in multilayer networks, of TSA using a new framework. Drugs affect different diseases by acting on gene sets with similar network structures. Because diseases are typically tissue specific, there are common and distinct relationships among the same gene sets in different protein-protein interaction networks. Therefore, we used TSA as an example to establish a three-layer TSPPI network with a tensor-based multilayer network mining algorithm [43] to identify the TSA treatment pattern. Using the multilayer network mining algorithm, it was possible to extract the structure of the same gene set with different connections in different layers. Finally, we identified modules M17 and M18 as potential treatment patterns for TSA. We verified the results from multiple perspectives, including difference and functional enrichment comparisons, co-expression network analysis, and literature verification. For example, if a disease-related protein module has a similar structure as M17 or M18, then the drug TSA is likely to be a potential drug for the treatment of the disease.
There are still some limitations to our method. First, the TSPPI networks were incomplete and had false-positive connections. Second, despite our extensive analysis, more studies are required for biological validation of the data. In future studies, we will attempt to overcome these shortcomings and further improve the framework to make the results more reliable.
Author Contributions
Conceptualization, methodology, and formal analysis, L.Y. and Y.S.; software, Y.S.; validation, Q.Z., S.W., and L.Z.; investigation, L.G.; resources, L.Y.; data curation, Y.S.; writing—original draft preparation, Y.L.; writing—review and editing, L.G.; visualization, Q.Z.; supervision, L.Y.; project administration and funding acquisition, Y.L. and L.G. All authors have read and agreed to the published version of the manuscript.
Funding
This work was supported in part by the National Key Research and Development Program of China (grant no. 2018YFC0910403), and National Natural Science Foundation of China (grant nos. 61672406 and 61532014).
Acknowledgments
Thanks to all those who maintain excellent databases and to all experimentalists who enabled this work by making their data publicly available.
Conflicts of Interest
The authors declare no conflict of interest. The funders had no role in the design of the study; in the collection, analyses, or interpretation of data; in the writing of the manuscript, or in the decision to publish the results.
References
- Isik, Z.; Baldow, C.; Cannistraci, C.V.; Schroeder, M. Drug target prioritization by perturbed gene expression and network information. Sci. Rep. 2015, 5, 17417. [Google Scholar] [CrossRef] [PubMed]
- Zhao, S.; Iyengar, R. Systems pharmacology: Network analysis to identify multiscale mechanisms of drug action. Annu. Rev. Pharmacol. Toxicol. 2012, 52, 505–521. [Google Scholar] [CrossRef] [PubMed]
- Rahmoune, H.; Guest, P.C. Application of Multiplex Biomarker Approaches to Accelerate Drug Discovery and Development. Methods Mol. Biol. 2017, 1546, 3–17. [Google Scholar] [PubMed]
- Suhara, T.; Chaki, S.; Kimura, H.; Furusawa, M.; Matsumoto, M.; Ogura, H.; Negishi, T.; Saijo, T.; Higuchi, M.; Omura, T.; et al. Strategies for Utilizing Neuroimaging Biomarkers in CNS Drug Discovery and Development: CINP/JSNP Working Group Report. Int. J. Neuropsychopharmacol. 2017, 20, 285–294. [Google Scholar] [CrossRef]
- Yu, L.; Huang, J.; Ma, Z.; Zhang, J.; Zou, Y.; Gao, L. Inferring drug-disease associations based on known protein complexes. BMC Med Genom. 2015, 8, 13. [Google Scholar] [CrossRef]
- Yu, L.; Wang, B.; Ma, X.; Gao, L. The extraction of drug-disease correlations based on module distance in incomplete human interactome. BMC Syst. Biol. 2016, 10, 111. [Google Scholar] [CrossRef]
- Koch, L. Pathogen genetics: Evolutionary dynamics driving drug resistance. Nat. Rev. Genet. 2017, 18, 578–579. [Google Scholar] [CrossRef]
- Gopinath, K.; Karthikeyan, M. Understanding the Evolutionary Relationship of M2 Channel Protein of Influenza A Virus and its Structural Variation and Drug Resistance. Curr. Bioinform. 2017, 12, 265–274. [Google Scholar] [CrossRef]
- Wong, Y.H.; Lin, C.L.; Chen, T.S.; Chen, C.A.; Jiang, P.S.; Lai, Y.H.; Chu, L.J.; Li, C.W.; Chen, J.J.W.; Chen, B.S. Multiple target drug cocktail design for attacking the core network markers of four cancers using ligand-based and structure-based virtual screening methods. BMC Med. Genomics 2015, 8, S4. [Google Scholar] [CrossRef]
- Vilar, S.; Quezada, E.; Uriarte, E.; Costanzi, S.; Borges, F.; Vina, D.; Hripcsak, G. Computational Drug Target Screening through Protein Interaction Profiles. Sci. Rep. 2016, 6. [Google Scholar] [CrossRef]
- McCormick, F. K-Ras protein as a drug target. J. Mol. Med. 2016, 94, 253–258. [Google Scholar] [CrossRef]
- Kaltdorf, M.; Srivastava, M.; Gupta, S.K.; Liang, C.; Binder, J.; Dietl, A.M.; Meir, Z.; Haas, H.; Osherov, N.; Krappmann, S.; et al. Systematic Identification of Anti-Fungal Drug Targets by a Metabolic Network Approach. Front. Mol. Biosci. 2016, 3, 22. [Google Scholar] [CrossRef] [PubMed]
- Shen, C.; Ding, Y.; Tang, J.; Xu, X.; Guo, F. An Ameliorated Prediction of Drug–Target Interactions Based on Multi-Scale Discrete Wavelet Transform and Network Features. Int. J. Mol. Sci. 2017, 18, 1781. [Google Scholar] [CrossRef] [PubMed]
- Ding, Y.; Tang, J.; Guo, F. Identification of Protein–Ligand Binding Sites by Sequence Information and Ensemble Classifier. J. Chem. Inf. Modeling 2017, 57, 3149–3161. [Google Scholar] [CrossRef]
- Ding, Y.; Tang, J.; Guo, F. Identification of drug-target interactions via multiple information integration. Inf. Sci. 2017, 418, 546–560. [Google Scholar] [CrossRef]
- Huang, L.; Li, F.H.; Sheng, J.T.; Xia, X.F.; Ma, J.W.; Zhan, M.; Wong, S.T.C. DrugComboRanker: Drug combination discovery based on target network analysis. Bioinformatics 2014, 30, 228–236. [Google Scholar] [CrossRef]
- Yue, Z.L.; Arora, I.; Zhang, E.Y.; Laufer, V.; Bridges, S.L.; Chen, J.Y. Repositioning drugs by targeting network modules: A Parkinson’s disease case study. BMC Bioinform. 2017, 18, 532. [Google Scholar] [CrossRef] [PubMed]
- Yu, L.; Zhao, J.; Gao, L. Predicting Potential Drugs for Breast Cancer based on miRNA and Tissue Specificity. Int. J. Biol. Sci. 2018, 14, 971–980. [Google Scholar] [CrossRef] [PubMed]
- Sun, P.; Guo, J.; Winnenburg, R.; Baumbach, J. Drug repurposing by integrated literature mining and drug-gene-disease triangulation. Drug Discov. Today 2017, 22, 615–619. [Google Scholar] [CrossRef]
- Magger, O.; Waldman, Y.Y.; Ruppin, E.; Sharan, R. Enhancing the Prioritization of Disease-Causing Genes through Tissue Specific Protein Interaction Networks. PLoS Comput. Biol. 2012, 8, e1002690. [Google Scholar] [CrossRef]
- Guan, Y.F.; Gorenshteyn, D.; Burmeister, M.; Wong, A.K.; Schimenti, J.C.; Handel, M.A.; Bult, C.J.; Hibbs, M.A.; Troyanskaya, O.G. Tissue-Specific Functional Networks for Prioritizing Phenotype and Disease Genes. PLoS Comput. Biol. 2012, 8, e1002694. [Google Scholar] [CrossRef] [PubMed]
- Yu, L.; Zhao, J.; Gao, L. Drug repositioning based on triangularly balanced structure for tissue-specific diseases in incomplete interactome. Artif. Intell. Med. 2017, 77, 53–63. [Google Scholar] [CrossRef] [PubMed]
- Nishimura, S.; Takami, T.; Murakami, Y. Porous PLGA microparticles formed by "one-step" emulsification for pulmonary drug delivery: The surface morphology and the aerodynamic properties. Colloid Surf. B 2017, 159, 318–326. [Google Scholar] [CrossRef] [PubMed]
- Chen, L.; Chu, C.; Zhang, Y.H.; Zheng, M.Y.; Zhu, L.C.; Kong, X.Y.; Huang, T. Identification of Drug-Drug Interactions Using Chemical Interactions. Curr. Bioinform. 2017, 12, 526–534. [Google Scholar] [CrossRef]
- Yu, L.; Ma, X.; Zhang, L.; Zhang, J.; Gao, L. Prediction of new drug indications based on clinical data and network modularity. Sci. Rep. 2016, 6. [Google Scholar] [CrossRef] [PubMed]
- Cichonska, A.; Ravikumar, B.; Parri, E.; Timonen, S.; Pahikkala, T.; Airola, A.; Wennerberg, K.; Rousu, J.; Aittokallio, T. Computational-experimental approach to drug-target interaction mapping: A case study on kinase inhibitors. PLoS Comput. Biol. 2017, 13, e1005678. [Google Scholar] [CrossRef]
- Greene, C.S.; Krishnan, A.; Wong, A.K.; Ricciotti, E.; Zelaya, R.A.; Himmelstein, D.S.; Zhang, R.; Hartmann, B.M.; Zaslavsky, E.; Sealfon, S.C.; et al. Understanding multicellular function and disease with human tissue-specific networks. Nat. Genet. 2015, 47, 569–576. [Google Scholar] [CrossRef]
- Liu, X.; Hong, Z.; Liu, J.; Lin, Y.; Alfonso, R.-P.; Zou, Q.; Zeng, X. Computational methods for identifying the critical nodes in biological networks. Brief. Bioinform. 2019, 21, 486–497. [Google Scholar] [CrossRef]
- Yu, L.; Su, R.; Wang, B.; Zhang, L.; Zou, Y.; Zhang, J.; Gao, L. Prediction of Novel Drugs for Hepatocellular Carcinoma Based on Multi-Source Random Walk. IEEE/ACM Trans. Comput. Biol. Bioinform. 2017, 14, 966–977. [Google Scholar] [CrossRef]
- Boccaletti, S.; Bianconi, G.; Criado, R.; del Genio, C.I.; Gomez-Gardenes, J.; Romance, M.; Sendina-Nadal, I.; Wang, Z.; Zanin, M. The structure and dynamics of multilayer networks. Phys. Rep. 2014, 544, 1–122. [Google Scholar] [CrossRef]
- Edgar, R.; Domrachev, M.; Lash, A.E. Gene Expression Omnibus: NCBI gene expression and hybridization array data repository. Nucleic Acids Res. 2002, 30, 207–210. [Google Scholar] [CrossRef] [PubMed]
- Davis, A.P.; Grondin, C.J.; Johnson, R.J.; Sciaky, D.; King, B.L.; McMorran, R.; Wiegers, J.; Wiegers, T.C.; Mattingly, C.J. The Comparative Toxicogenomics Database: Update 2017. Nucleic Acids Res. 2017, 45, D972–D978. [Google Scholar] [CrossRef] [PubMed]
- Lamb, J. Innovation—The Connectivity Map: A new tool for biomedical research. Nat. Rev. Cancer 2007, 7, 54–60. [Google Scholar] [CrossRef] [PubMed]
- Lamb, J.; Crawford, E.D.; Peck, D.; Modell, J.W.; Blat, I.C.; Wrobel, M.J.; Lerner, J.; Brunet, J.P.; Subramanian, A.; Ross, K.N.; et al. The connectivity map: Using gene-expression signatures to connect small molecules, genes, and disease. Science 2006, 313, 1929–1935. [Google Scholar] [CrossRef]
- Piao, J.J.; Chen, L.Y.; Quan, T.H.; Li, L.S.; Quan, C.J.; Piao, Y.S.; Jin, T.F.; Lin, Z.H. Superior efficacy of co-treatment with the dual PI3K/mTOR inhibitor BEZ235 and histone deacetylase inhibitor Trichostatin A against NSCLC. Oncotarget 2016, 7, 60169–60180. [Google Scholar] [CrossRef]
- Makishima, H.; Yoshizato, T.; Yoshida, K.; Sekeres, M.A.; Radivoyevitch, T.; Suzuki, H.; Przychodzen, B.; Nagata, Y.; Meggendorfer, M.; Sanada, M.; et al. Dynamics of clonal evolution in myelodysplastic syndromes. Nat. Genet. 2017, 49, 204–212. [Google Scholar] [CrossRef]
- Vigushin, D.M.; Ali, S.; Pace, P.E.; Mirsaidi, N.; Ito, K.; Adcock, I.; Coombes, R.C. Trichostatin A is a histone deacetylase inhibitor with potent antitumor activity against breast cancer in vivo. Clin. Cancer Res. 2001, 7, 971–976. [Google Scholar]
- Keil, K.P.; Altmann, H.M.; Abler, L.L.; Hernandez, L.L.; Vezina, C.M. Histone acetylation regulates prostate ductal morphogenesis through a bone morphogenetic protein-dependent mechanism. Dev. Dynam. 2015, 244, 1404–1414. [Google Scholar] [CrossRef]
- Liao, Z.J.; Li, D.P.; Wang, X.R.; Li, L.S.; Zou, Q. Cancer Diagnosis Through IsomiR Expression with Machine Learning Method. Curr. Bioinform. 2018, 13, 57–63. [Google Scholar] [CrossRef]
- Tang, W.; Wan, S.; Yang, Z.; Teschendorff, A.E.; Zou, Q. Tumor origin detection with tissue-specific miRNA and DNA methylation markers. Bioinformatics 2018, 34, 398–406. [Google Scholar] [CrossRef]
- Weinstein, J.N.; Collisson, E.A.; Mills, G.B.; Shaw, K.R.M.; Ozenberger, B.A.; Ellrott, K.; Shmulevich, I.; Sander, C.; Stuart, J.M.; Network, C.G.A.R. The Cancer Genome Atlas Pan-Cancer analysis project. Nat. Genet. 2013, 45, 1113–1120. [Google Scholar] [CrossRef] [PubMed]
- Smyth, G.K. Linear models and empirical bayes methods for assessing differential expression in microarray experiments. Stat. Appl. Genet. Mol. Biol. 2004, 3, 3. [Google Scholar] [CrossRef]
- Li, W.Y.; Liu, C.C.; Zhang, T.; Li, H.F.; Waterman, M.S.; Zhou, X.H.J. Integrative Analysis of Many Weighted Co-Expression Networks Using Tensor Computation. PLoS Comput. Biol. 2011, 7, e1001106. [Google Scholar] [CrossRef] [PubMed]
- Barshir, R.; Shwartz, O.; Smoly, I.Y.; Yeger-Lotem, E. Comparative Analysis of Human Tissue Interactomes Reveals Factors Leading to Tissue-Specific Manifestation of Hereditary Diseases. PLoS Comput. Biol. 2014, 10, e1003632. [Google Scholar] [CrossRef] [PubMed]
- Barabasi, A.L.; Albert, R. Emergence of scaling in random networks. Science 1999, 286, 509–512. [Google Scholar] [CrossRef]
- Nicosia, V.; Bianconi, G.; Latora, V.; Barthelemy, M. Growing Multiplex Networks. Phys. Rev. Lett. 2013, 111, 058701. [Google Scholar] [CrossRef] [PubMed]
- Mucha, P.J.; Richardson, T.; Macon, K.; Porter, M.A.; Onnela, J.P. Community Structure in Time-Dependent, Multiscale, and Multiplex Networks. Science 2010, 328, 876–878. [Google Scholar] [CrossRef]
- Berardini, T.Z.; Li, D.H.; Huala, E.; Bridges, S.; Burgess, S.; McCarthy, F.; Carbon, S.; Lewis, S.E.; Mungall, C.J.; Abdulla, A.; et al. The Gene Ontology in 2010: Extensions and refinements The Gene Ontology Consortium. Nucleic Acids Res. 2010, 38, D331–D335. [Google Scholar]
- Kanehisa, M.; Sato, Y.; Kawashima, M.; Furumichi, M.; Tanabe, M. KEGG as a reference resource for gene and protein annotation. Nucleic Acids Res. 2016, 44, D457–D462. [Google Scholar] [CrossRef]
- Hecker, N.; Ahmed, J.; Eichborn, J.; Dunkel, M.; Macha, K.; Eckert, A.; Gilson, M.K.; Bourne, P.E.; Preissner, R. SuperTarget goes quantitative: Update on drug-target interactions. Nucleic Acids Res. 2012, 40, D1113–D1117. [Google Scholar] [CrossRef]
- Wishart, D.S.; Knox, C.; Guo, A.C.; Shrivastava, S.; Hassanali, M.; Stothard, P.; Chang, Z.; Woolsey, J. DrugBank: A comprehensive resource for in silico drug discovery and exploration. Nucleic Acids Res. 2006, 34, D668–D672. [Google Scholar] [CrossRef]
- Huang, D.W.; Sherman, B.T.; Lempicki, R.A. Systematic and integrative analysis of large gene lists using DAVID bioinformatics resources. Nat. Protoc. 2009, 4, 44–57. [Google Scholar] [CrossRef] [PubMed]
- Huang, D.W.; Sherman, B.T.; Lempicki, R.A. Bioinformatics enrichment tools: Paths toward the comprehensive functional analysis of large gene lists. Nucleic Acids Res. 2009, 37, 1–13. [Google Scholar] [CrossRef] [PubMed]
- Hamosh, A.; Scott, A.F.; Amberger, J.S.; Bocchini, C.A.; McKusick, V.A. Online Mendelian Inheritance in Man (OMIM), a knowledgebase of human genes and genetic disorders. Nucleic Acids Res. 2005, 33, D514–D517. [Google Scholar] [CrossRef]
- Mottaz, A.; Yip, Y.L.; Ruch, P.; Veuthey, A.L. Mapping proteins to disease terminologies: From UniProt to MeSH. BMC Bioinform. 2008, 9, S3. [Google Scholar] [CrossRef]
- Ramos, E.M.; Hoffman, D.; Junkins, H.A.; Maglott, D.; Phan, L.; Sherry, S.T.; Feolo, M.; Hindorff, L.A. Phenotype-Genotype Integrator (PheGenI): Synthesizing genome- wide association study (GWAS) data with existing genomic resources. Eur. J. Hum. Genet. 2014, 22, 144–147. [Google Scholar] [CrossRef] [PubMed]
- van Dam, S.; Vosa, U.; van der Graaf, A.; Franke, L.; de Magalhaes, J.P. Gene co-expression analysis for functional classification and gene-disease predictions. Brief Bioinform 2018, 19, 575–592. [Google Scholar] [CrossRef] [PubMed]
- Kang, Y.; Marischuk, K.; Castelvecchi, G.D.; Bashirullah, A. HDAC Inhibitors Disrupt Programmed Resistance to Apoptosis During Drosophila Development. G3 (Bethesda) 2017, 7, 1985–1993. [Google Scholar] [CrossRef]
- Robertson, K.D.; Ait-Si-Ali, S.; Yokochi, T.; Wade, P.A.; Jones, P.L.; Wolffe, A.P. DNMT1 forms a complex with Rb, E2F1 and HDAC1 and represses transcription from E2F-responsive promoters. Nat. Genet. 2000, 25, 338–342. [Google Scholar] [CrossRef]
- Furumai, R.; Komatsu, Y.; Nishino, N.; Khochbin, S.; Yoshida, M.; Horinouchi, S. Potent histone deacetylase inhibitors built from trichostatin A and cyclic tetrapeptide antibiotics including trapoxin. Proc. Natl. Acad. Sci. USA 2001, 98, 87–92. [Google Scholar] [CrossRef]
- Qiu, Z.; Ghosh, A. A calcium-dependent switch in a CREST-BRG1 complex regulates activity-dependent gene expression. Neuron 2008, 60, 775–787. [Google Scholar] [CrossRef]
- King, H.A.; Trotter, K.W.; Archer, T.K. Chromatin remodeling during glucocorticoid receptor regulated transactivation. BBA 2012, 1819, 716–726. [Google Scholar] [CrossRef] [PubMed]
- Barutcu, A.R.; Lajoie, B.R.; Fritz, A.J.; McCord, R.P.; Nickerson, J.A.; van Wijnen, A.J.; Lian, J.B.; Stein, J.L.; Dekker, J.; Stein, G.S.; et al. SMARCA4 regulates gene expression and higher order chromatin structure in proliferating mammary epithelial cells. Genome Res. 2016, 26, 1188–1201. [Google Scholar] [CrossRef] [PubMed]
- Mackmull, M.T.; Iskar, M.; Parca, L.; Singer, S.; Bork, P.; Ori, A.; Beck, M. Histone Deacetylase Inhibitors (HDACi) Cause the Selective Depletion of Bromodomain Containing Proteins (BCPs). Mol. Cell Proteom. 2015, 14, 1350–1360. [Google Scholar] [CrossRef] [PubMed]
- Ogino, H.; Nakayama, R.; Sakamoto, H.; Yoshida, T.; Sugimura, T.; Masutani, M. Analysis of poly(ADP-ribose) polymerase-1 (PARP1) gene alteration in human germ cell tumor cell lines. Cancer Genet. Cytogen. 2010, 197, 8–15. [Google Scholar] [CrossRef] [PubMed]
- Robert, C.; Nagaria, P.K.; Pawar, N.; Adewuyi, A.; Gojo, I.; Meyers, D.J.; Cole, P.A.; Rassool, F.V. Histone deacetylase inhibitors decrease NHEJ both by acetylation of repair factors and trapping of PARP1 at DNA double-strand breaks in chromatin. Leuk. Res. 2016, 45, 14–23. [Google Scholar] [CrossRef]


© 2020 by the authors. Licensee MDPI, Basel, Switzerland. This article is an open access article distributed under the terms and conditions of the Creative Commons Attribution (CC BY) license (http://creativecommons.org/licenses/by/4.0/).