Abstract
Phosphate transporter (PHT) is responsible for plant phosphorus (P) absorption and transport. PHT1 is a component of the high-affinity phosphate transporter system and plays pivotal roles in P absorption under P starvation conditions. However, in cotton, the number and identity of PHT1 genes that are crucial for P absorption from soil remain unclear. Here, genome-wide identification detected twelve PHT1 genes in Gossypium hirsutum and seven and eight PHT1 genes in two close relatives of the G. hirsutum genome—G. arboreum and G. raimondii, respectively. In addition, under low-phosphate treatment, the expressions of GaPHT1;3, GaPHT1;4, and GaPHT1;5 in roots were upregulated after 3 h of induction, and GhPHT1;3-At, GhPHT1;4-At, GhPHT1;5-At, GhPHT1;3-Dt, GhPHT1;4-Dt, and GhPHT1;5-Dt in the roots began to respond after 1 h of induction. Homologous pairs—GaPHT1;4 and GhPHT1;4-At; GaPHT1;5 and GhPHT1;5-At; GrPHT1;4 and GhPHT1;4-Dt, with GhPHT1;5-Dt and GhPHT1;5-At being syntenic—were all highly expressed in the roots under normal conditions. Among the genes highly expressed in the roots, GhPHT1;4-At, GhPHT1;5-At, GhPHT1;4-Dt and GhPHT1;5-Dt were continuously upregulated by P starvation. Therefore, it is concluded that these four genes might be key genes for P uptake in cotton roots. The results of this study provide insights into the mechanisms of P absorption and transport in cotton.
1. Introduction
Phosphorus (P) is an essential macroelement for plant growth and development, playing important roles in plasma membrane maintenance, nucleic acid synthesis, energy metabolism and enzyme regulation [1]. P deficiency strongly affects physiological and biochemical reactions during the growth and development of plants [2,3]. In cotton, P can promote cotton plant growth from the vegetative to reproductive stages, promote cottonseed maturation and boll opening, and increase boll weight [4]. However, under P starvation, the cotton plant exhibits dwarfism, a greatly decreased boll number per plant and stunted development of cotton bolls and cottonseeds [5].
P is plentiful in soil; however, there is very little P available to crops for absorption [1] because most soil P is solidified in an inactive state and cannot be used by plants [6,7]. In China, soil P content is very low and cannot meet the requirements of cotton growth. Therefore, phosphate (Pi) fertilizer must be applied at regular intervals to achieve normal cotton growth [8]. However, excessive use of Pi fertilizer often occurs, which not only depletes Pi resources but also causes water eutrophication and ecological collapse. Therefore, to achieve a balance between environmental protection and the P demand for cotton production, new cotton varieties with high P use efficiency need to be developed.
PHT (phosphate transporter), a member of the major facilitator superfamily (MFS), is located on the plasma membrane. Based on differences in structure and subcellular localization, all Pi transporters from dicotyledons and monocotyledons are divided into four subfamilies, PHT1, PHT2, PHT3 and PHT4, which are mainly located in cell membrane, chloroplast, mitochondria and Golgi apparatus, respectively [9]. PHTs can also be divided into high-affinity (ion concentrations at the micromole level) and low-affinity (ion concentrations at the millimole level) PHT systems. The expression of high-affinity transporters is induced or enhanced in a low-Pi environment. PHT1 belongs to the high-affinity PHT system [10], which is responsible for P absorption by plants under P deficiency conditions [10]. PHT1 consists of 12 hydrophobic transmembrane helical domains. Generally, members of the PHT1 family are highly conserved among species, and their amino acid sequences are highly similar to each other [11].
To date, nine PHT1 genes have been identified in Arabidopsis thaliana; these genes have been found to be expressed in P starvation environments. Studies have shown that PHT1 members are expressed in different tissues and organs [12]. AtPHT1;1 and AtPHT1;4 play important roles in P absorption at low or high P concentrations [8]. AtPHT1;5 is very important for Pi distribution from source to sink [13]. AtPHT1;6 is mainly expressed in floral organs. AtPHT1;8 and AtPHT1;9 are strongly induced and expressed in the roots in P deficiency environments and participate in P transport from root to shoot [14]. Thirteen high-affinity Pi transporters have been identified in rice (Oryza sativa) [15]. In rice, OsPT1 is a key participant in P uptake and transport under a high P background [16]. OsPT2 is a low-affinity P transporter [17]. OsPT4 is mainly responsible for transporting P from sink to source [18]. OsPT6 plays extensive roles in P uptake and transport throughout the plant [17]. OsPT8 is a constitutive transporter [19]. Overexpressing OsPT9 and OsPT10 can significantly enhance P uptake [20]. A total of 14 PHT1 genes have been found in soybean [21,22]. In soybean, GmPT1 and GmPT2 are expressed in the roots and shoots of seedlings [23]. The expression of GmPT5 is related to root and nodulation [24]. GmPT7 is mainly expressed in mature arbuscular mycorrhiza (AM) in the roots [25]. In tomato, five P transporter genes have been identified that belong to the PHT1 family and are mainly expressed in the root hair and root epidermis [26]. In addition, four PHT1 family members have been found in maize [27]. In addition to being studied in the above taxa, the PHT1 family has been studied in alfalfa [28], wheat [29], potato [30], sorghum [31], chrysanthemum [32] and oat [33].
Cotton (Gossypium spp.) is one of the most important economic crops, providing the most important natural textile raw material in the world. At present, more than 90% of cultivated cotton is allotetraploid, which arose through the merging of two ancestral genomes 1 or 2 million years ago. G. arboreum is a diploid cultivated cotton species, which is a close relative of the A subgenome in cultivated cotton, and G. raimondii is the possible donor of the D subgenome [34,35]. Over thousands of years, humans have domesticated wild cotton into cultivated forms that produce fine, spinnable fibers [36]. During domestication, many agriculturally important traits, such as early maturity, seed dormancy, fiber quality (fiber length, fiber strength, and fiber fineness) and yield traits (boll number, boll weight and lint percentage), have been gradually improved. Cotton is one of the most nutrient-demanding crops. However, the phenotypes of human-domesticated cotton do not have a strong ability to absorb nutrient elements; thus, most cultivated cotton species are sensitive to nutrient stress involving P limitation.
To the best of our knowledge, there are few studies on the molecular mechanisms underlying the responses to low-Pi stress in cotton, and the expression pattern of PHT1 under P starvation has not been fully analyzed [37]. In this study, the most recent genomic and transcriptome data for G. hirsutum and genomic and transcriptome data for G. raimondii and G. arboreum were used to perform genome-wide identification, evolutionary analysis and gene expression analysis of PHT1 family genes. The results provide a basis for the development of P starvation-tolerant cotton.
2. Results
2.1. PHT1 Genes in G. arboreum, G. raimondii and G. hirsutum
PHT1 is a member of the major facilitator superfamily (MFS). Its main function in plants is to absorb Pi outside the protoplast and maintain the P concentration in the cell. Previous reports have shown that the structure of PHT1 protein in plants is highly conserved and that the protein is localized on the cytomembrane [9]. PHT1 protein contains a conserved domain PF00083 (belonging to the sugar transporter superfamily [38]), and PHT1 genes contain a complete A0109 domain. Based on the conserved domain of PHT1 genes in A. thaliana, putative genes of PHT1 in G. hirsutum, G. arboreum and G. raimondii were identified genome-wide (Supplementary Figure S1). Twelve PHT1 genes were identified in G. hirsutum (including two sets of tandem duplication genes), seven in G. arboreum (including one set of tandem duplication genes), and eight in G. raimondii.
The identified PHT1 genes were named according to their homologous relationship, of which PHT1;1 to PHT1;6 were homologous genes among the three cotton species, and the remaining without homologous genes were PHT1;7 PHT1;8, or PHT1;9. Close-linked, tandem duplicate genes were considered a single gene of the gene family. The PHT1 genes in G. arboreum were named GaPHT1;1 to GaPHT1;7 (Figure 1A); those in G. raimondii were named GrPHT1;1 to GrPHT1;6, GrPHT1;8 and GrPHT1;9 (Figure 1B); those in G. hirsutum were named GhPHT1;1-At to GhPHT1;6-At and GhPHT1;1-Dt to GhPHT1;6-Dt (Figure 1C). The PHT1 gene distribution on the chromosomes is shown in Figure 1. The PHT1 genes were distributed on several chromosomes in Gossypium. In Table 1, the amino acid (aa) numbers, molecular weights and isoelectric points (pIs) of the PHT1 genes in Gossypium are listed. The number of amino acids encoded by PHT1 genes ranged from 513 to 540. The molecular weights ranged from 56.74 to 59.23 kDa, and the pIs ranged from 8.07 to 9.29.
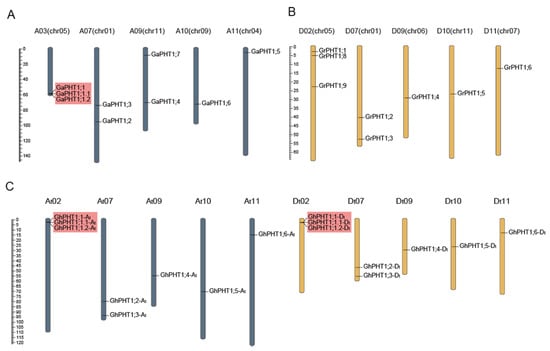
Figure 1.
Distribution of phosphate transporter 1(PHT1) genes on chromosomes in Gossypium. Scaffolds of G. arboreum and G. raimondii were reordered. Chromosome codes (A01 to A13, D01 to D13) were assigned based on the collinearity of the interspecific genetic map of allotetraploid cultivated cotton species and the scaffolds (chr01 to chr13) of the G. arboreum and G. raimondii genomic data. PHT1 genes were named according to the homologous relationship among Gossypium, of which PHT1;1 to PHT1;6 were homologous genes in the three cotton species, and the remaining without homologous genes were PHT1;7, PHT1;8 or PHT1;9; genes with tandem duplication are marked with red boxes. (A) G. arboreum. (B) G. raimondii. (C) G. hirsutum.

Table 1.
PHT1 family genes in G. arboreum, G. raimondii and G. hirsutum.
To investigate the phylogenetic relationships among PHT1 genes in Gossypium, we employed the maximum likelihood (ML) method to construct a phylogenetic tree based on the PHT1 protein sequences of G. arboreum, G. raimondii and G. hirsutum. The PHT1 genes were clustered into three subgroups—Group I, Group II and Group III (Figure 2). Group I contained four genes from G. arboreum, five from G. raimondii and eight from G. hirsutum. Group II contained two genes from each of G. arboreum and G. raimondii and four genes from G. hirsutum. Group III contained only one gene from each of G. arboreum and G. raimondii and no gene from G. hirsutum. The phylogenetic tree demonstrated that each gene from G. arboreum was mostly closely related to one from G. hirsutum, yielding the following pairs: GaPHT1;1 and GhPHT1;1-At; GaPHT1;1.1 and GhPHT1;1.1-At; GaPHT1;1.2 and GhPHT1;1.2-At; GaPHT1;2 and GhPHT1;2-At; GaPHT1;3 and GhPHT1;3-At; GaPHT1;4 and GhPHT1;4-At; GaPHT1;5 and GhPHT1;5-At; GaPHT1;6 and GhPHT1;6-At. Similarly, genes from G. raimondii were most closely related to ones in G. hirsutum, yielding the following pairs: GrPHT1;1 and GhPHT1;1-Dt; GrPHT1;2 and GhPHT1;2-Dt; GrPHT1;3 and GhPHT1;3-Dt; GrPHT1;4 and GhPHT1;4-Dt; GrPHT1;5 and GhPHT1;5-Dt; GrPHT1;6 and GhPHT1;6-Dt. The members of each of the above pairs of genes were grouped in the same branch. The results revealed homologous relationships between both GaPHT1 and GhPHT1 of the A subgenome of G. hirsutum and between GrPHT1 and GhPHT1 of the D subgenome of G. hirsutum. In addition, the pair of genes GaPHT1;7 (from G. arboreum) and GrPHT1;9 (from G. raimondii) clustered together on the same branch, implying that their protein sequences were very different from those of G. hirsutum.
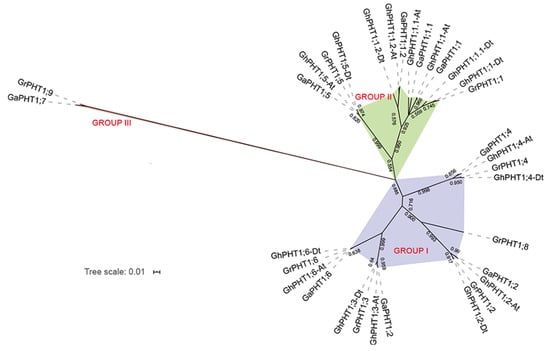
Figure 2.
The phylogenetic tree of PHT1 genes in Gossypium. Ga, Gr and Gh represent PHT1 genes from G. arboreum, G. raimondii and G. hirsutum, respectively. Different subgroups are marked by different colors and are named Group I, Group II, and Group III.
2.2. Structural Analysis of PHT1 Genes
To further understand the gene structure variation of the PHT1 family in cotton, the exons and introns were analyzed by Gene Structure Display Server (GSDS). The results showed that the PHT1 genes in cotton are highly conserved in structure. Genes that were clustered into the same subgroup in the phylogenetic tree were structurally similar. In general, PHT1 genes in cotton contained one or two exons and one or zero introns. There was only one exon in members of Group I and Group II, among which, four genes (GaPHT1;3, GaPHT1;4, GrPHT1;3 and GrPHT1;4) contained one intron and the remaining 20 genes had no introns. Only two genes in Group III contained two exons and one intron (Figure 3A). The PHT1 gene structure of Gossypium was found to be similar to those of A. thaliana and Oryza sativa [15,39]. This finding indicated that the PHT1 family is highly conserved in both monocotyledons and dicotyledons, implying that the PHT1 genes are very important to plants.
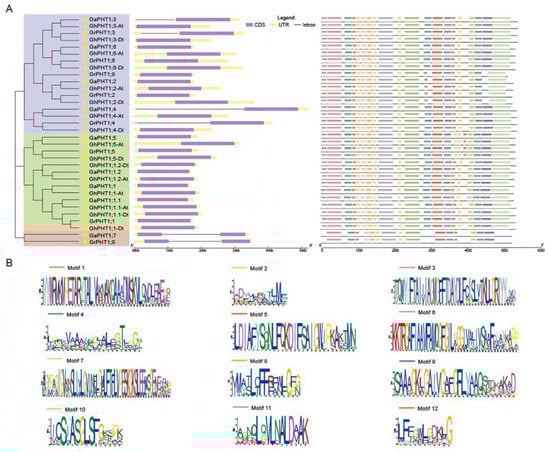
Figure 3.
PHT1 gene structure and conserved motifs in Gossypium. (A) Phylogenetic relationships (left), gene structure (middle), and conserved motifs (right) among PHT1 genes of Gossypium. Pentagrams, triangles and circles represent G. arboreum, G. raimondii, and G. hirsutum, respectively. (B) Conserved motif sequences of Gossypium.
A protein’s motif is closely related to its function. The conserved motifs of PHT1 proteins in cotton were analyzed by MEME software. High similarity in motif structure was observed within a subgroup in the phylogenetic tree. As shown in Figure 3A,B, in genes in both Groups I and II, the protein N-terminal was motif 11, and the protein C-terminal was motif 7. In Group I, five genes (GaPHT1;2, GrPHT1;2, GrPHT1;8, GhPHT1;2-At and GhPHT1;2-Dt) were very similar in motif structure, having no motif 4 or motif 9, but having an extra motif 12; these genes were different in motif structure from the others. In Group II, four genes (GaPHT1;5, GrPHT1;5, GhPHT1;5-At and GhPHT1;5-Dt) had similar structures, with one more motif 2 than the others. Interestingly, the motif structures of genes in Group III differed from those of genes in Groups I and II. For genes in Group III, the protein N-terminal was motif 3 without motif 11. Its C-terminal was motif 9 without motif 7. Compared with other members of the PHT1 family, GaPHT1;7 and GrPHT1;9 are both missing two motif 2s and one motif 4. These different motif components might lead to different gene functions.
The prediction of cis-acting elements in the promoter showed that the CAAT-BOX (GGGTCAATCT) and TATA-BOX (TATAATAAT) elements were present in all gene promoters. Other elements were mostly related to light responses and plant hormone responses. The W-box (TTGACY) element was predicted in the promoters of GaPHT1;4, GaPHT1;5, GhPHT1;4-At, GhPHT1;5-At, GhPHT1;4-Dt, GrPHT1;2 and GrPHT1;4. The PHO-like element (GDHGTGG) was found in GrPHT1;4 and GrPHT1;9. GhPHT1;3-At, GhPHT1;3-Dt and GrPHT1;3 contained the root motif box element (ATATT), which is related to root expression (Supplementary Table S1).
2.3. Expansion of PHT1 Family Genes in Gossypium
The nuclear genome sizes and gene contents vary greatly in higher plants, mostly due to gene duplication. Gene duplication events can be divided into tandem duplication, segmental duplication/WGD (Whole Genome Duplication), and dispersed duplication events [40]. By analyzing the phylogenetic tree of PHT1 genes in Gossypium, A. thaliana and rice, it was found that GaPHT1;1 and GaPHT1;5 (as well as GrPHT1;1 and GrPHT1;5) originated from the same hypothetical ancestor gene, and their duplication events occurred before the divergence of G. arboreum and G. raimondii (Figure S2). GaPHT1;3 and GaPHT1;6 (as well as GrPHT1;3 and GrPHT1;6) had a common origin, and their duplication events occurred in the ancestral species of G. arboreum and G. raimondii. GaPHT1;2 and GrPHT1;2 were homologous genes, which were derived from the same hypothetical ancestral gene. Similarly, GaPHT1;4 and GrPHT1;4 originated from another gene within the ancestor of G. arboreum and G. raimondii. Interestingly, there were two tandem genes of GaPHT1;1 but not in GrPHT1;1; it is inferred that the tandem duplication event of GaPHT1;1 occurred after the divergence of G. arboreum and G. raimondii.
To further investigate the syntenic relationships of cotton PHT1, we used MCScanX to perform synteny analysis within family members. A pair of syntenic genes, GaPHT1;3 and GaPHT1;6, was found in G. arboreum (Figure 4A). Five pairs of syntenic genes (GrPHT1;1 and GrPHT1;5; GrPHT1;3 and GrPHT1;6; GrPHT1;3 and GrPHT1;8; GrPHT1;4 and GrPHT1;9; GrPHT1;6 and GrPHT1;8) were found in G. raimondii (Figure 4B). Twelve pairs of syntenic genes (GhPHT1;1-At and GhPHT1;6-At; GhPHT1;1-At and GhPHT1;1-Dt; GhPHT1;1-At and GhPHT1;5-Dt; GhPHT1;1-At and GhPHT1;6-Dt; GhPHT1;2-At and GhPHT1;1-Dt; GhPHT1;3-At and GhPHT1;3-Dt; GhPHT1;3-At and GhPHT1;6-Dt; GhPHT1;4-At and GhPHT1;4-Dt; GhPHT1;4-At and GhPHT1;6-Dt; GhPHT1;5-At and GhPHT1;1-Dt; GhPHT1;6-At and GhPHT1;3-Dt; GhPHT1;6-At and GhPHT1;6-Dt) were found in G. hirsutum (Figure 4C). The synteny of PHT1 families was analyzed by the python version of MCScan2. The results revealed syntenic relationships both between GaPHT1 and the GhPHT1 of the A subgenome and between GrPHT1 and the GhPHT1 of the D subgenome (Figure 5A), whereas GrPHT1;8 had no syntenic gene in G. hirsutum (score ≥ 0.70). GaPHT1;7 and GrPHT1;9 each exhibited synteny with the same gene, GH_D02G1054, in G. hirsutum, but this gene is not in the PHT1 family. Syntenic analysis showed the GaPHT1;6 had synteny with both GhPHT1;6-At (A subgenome) and GhPHT1;6-Dt (D subgenome) (Figure 5B) and that GrPHT1;6 had synteny with these same two genes (Figure 5C). These findings indicate that GaPHT1;6, GrPHT1;6, GhPHT1;6-At and GhPHT1;6-Dt are the most conserved genes in the PHT1 family of Gossypium. All GhPHT1 genes have their homologous genes found in the two closely related donor species, so it is inferred that GhPHT1 genes were obtained from the two donor species.
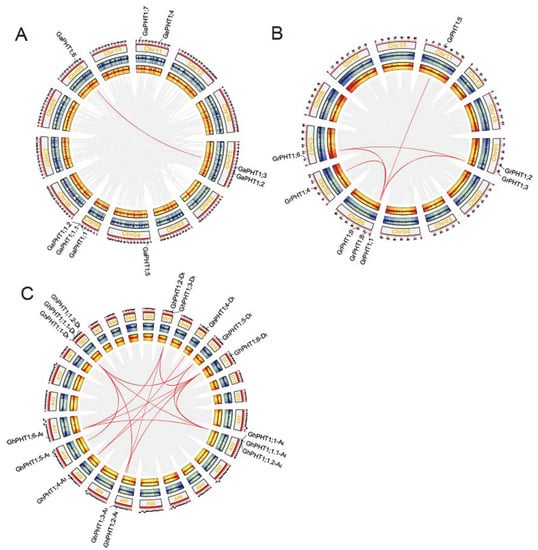
Figure 4.
The syntenic relationships of PHT1 genes based on analysis of genome-wide protein sequences using MCScanX [41]. Syntenic relationships with scores < 250 were filtered out. Circos [42] panels from outside to inside represent the following: chromosome, gene density in sense strand and gene density in antisense strand. (A) G. arboreum. (B) G. raimondii. (C) G. hirsutum.
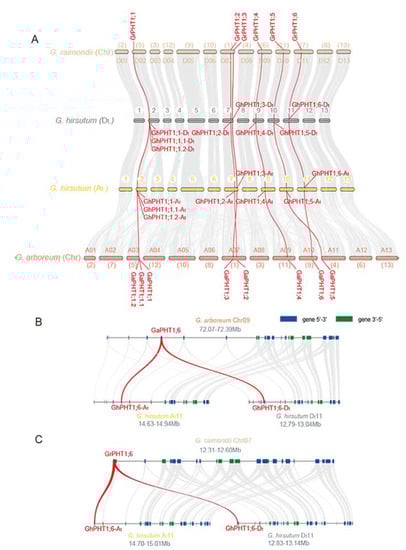
Figure 5.
Syntenic relationships among members of the PHT1 family in Gossypium. (A) Syntenic characterization of G. arboreum, G. raimondii, and G. hirsutum. Scaffolds of G. arboreum and G. raimondii were reordered. The chromosome codes (A01 to A13, D01 to D13) were assigned based on the collinearity of the interspecific genetic map of allotetraploid cultivated cotton species and the scaffolds (chr1 to chr13) of the G. arboreum and G. raimondii genomic data. Macrosynteny connecting blocks with greater than 30 gene pairs are represented by grey links. The red line indicates a syntenic relationship between two PHT1 genes. (B) Microsyntenic relationships of G. arboreum Chr. A11 (chr9), Chr. At11 (A subgenome of allotetraploid cotton) and Chr. Dt11 (D subgenome). (C) Microsyntenic relationships of G. raimondii Chr. D11 (chr7), Chr. At11 (A subgenome of allotetraploid cotton) and Chr. Dt11 (D subgenome). The blue and green boxes indicate the different directions of transcribed genes. Only syntenic relationships with scores ≥ 0.70 are shown.
Therefore, we concluded that most of the PHT1 genes in G. arboreum and G. raimondii had experienced gene duplication events before these two species diverged. The GhPHT1 genes were derived from the donor species of subgenomes A and D.
To explore the selection pressure on PHT1 genes after gene duplication, we calculated and analyzed the ratio of the non-synonymous substitution rate to the synonymous substitution rate (Ka/Ks) of homologous PHT1 genes in Gossypium. Fourteen pairs of PHT1 genes showing homology between G. arboreum and G. hirsutum were obtained by bidirectional Blastp: GaPHT1;1 and GhPHT1;1-At; GaPHT1;1.1 and GhPHT1;1.1-At; GaPHT1;1.2 and GhPHT1;1.2-At; GaPHT1;2 and GhPHT1;2-At; GaPHT1;3 and GhPHT1;3-At; GaPHT1;4 and GhPHT1;4-At; GaPHT1;5 and GhPHT1;5-At; GaPHT1;6 and GhPHT1;6-At. Their Ka/Ks values ranged from 0.0867 to 0.3665, with an average of 0.2884. These values are much less than 1, suggesting these genes underwent purifying selection. Six pairs of genes were identified as homologous between GrPHT1 and GhPHT1, namely, GrPHT1;1 and GhPHT1;1-Dt; GrPHT1;2 and GhPHT1;2-Dt; GrPHT1;3 and GhPHT1;3-Dt; GrPHT1;4 and GhPHT1;4-Dt; GrPHT1;5 and GhPHT1;5-Dt, GrPHT1;6 and GhPHT1;6-Dt. Except for one pair of homologous genes (GrPHT1;4 and GhPHT1;4-Dt), the Ka/Ks values ranged from 0.1149 to 0.8520, with an average of 0.3832, indicating purifying selection. Generally, the Ka/Ks values of homologous GrPHT1 and GhPHT1 genes were higher than those of homologous GaPHT1 and GhPHT1 genes, implying faster evolutionary rates of GhPHT1 genes on Dt than on At in G. hirsutum. The Ka/Ks value of the pair GrPHT1;4 and GhPHT1;4-Dt was greater than 1, which suggested that these genes have undergone positive selection. Their non-synonymous mutations were retained, which might endow new functions. The specific functions of these genes need to be determined (Table 2).
Table 2.
Comparison of PHT1 homologous genes substitution rate in Gossypium.
2.4. Expression Patterns of PHT1 Genes in Gossypium
To explore the temporal and spatial expression patterns of PHT1 genes in different tissues of Gossypium, transcriptome data were analyzed. The results showed that GaPHT1;4 and GaPHT1;5 were strongly expressed in the roots (Figure 6A) and that GaPHT1;3 was expressed at low levels in root, stem, leaf, ovule and fiber tissues. GrPHT1;4 was highly expressed in the roots, and GrPHT1;3 was expressed in the roots at a low level (Figure 6B). In G. hirsutum, GhPHT1;3-At, GhPHT1;4-At, GhPHT1;5-At, GhPHT1;3-Dt, GhPHT1;4-Dt and GhPHT1;5-Dt were highly expressed in the roots and stem (Figure 6C), implying that they play roles in Pi absorption [22] and Pi transport [26,28]. GhPHT1;3-At, GhPHT1;4-At and GhPHT1;3-Dt possibly participate in Pi distribution or metabolism in the leaves [13,43]. The expression of GhPHT1;3-At, GhPHT1;4-At, GhPHT1;2-Dt and GhPHT1;3-Dt was detected in petals, implying that these genes might function in reproductive growth. GhPHT1;6-Dt was expressed in the ovule at 0 and 1 day post anthesis. GhPHT1;3-At and GhPHT1;3-Dt were expressed in almost all the tissues analyzed. According to the transcriptome data, PHT1 genes in Gossypium are mainly expressed in the roots and less in leaf and other tissues; P uptake is mainly dependent on the roots [44].
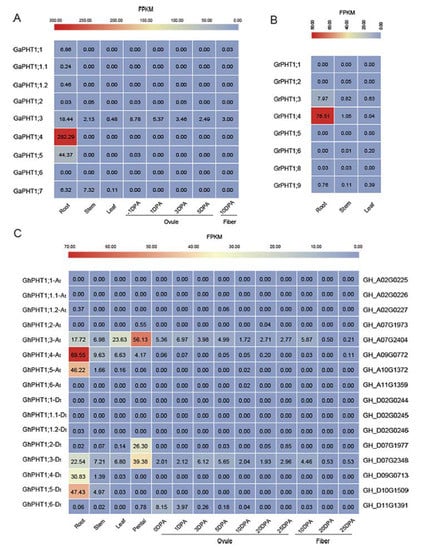
Figure 6.
Expression patterns of PHT1 genes in Gossypium. Comparative analysis of the transcriptome in different tissues. The expression level of all genes is shown as a colored square at the top of Fragments Per Kilobase per Million (FPKM), indicating a gradual change from minimum (blue) to maximum (red). The value in the square is the FPKM. (A) G. arboreum. (B) G. raimondii. (C) G. hirsutum.
2.5. Expression of PHT1 Genes Induced by Low-Pi Treatment
To investigate the potential functions of PHT1 genes under P starvation, seedlings of G. arboreum and G. hirsutum were treated with low P in a hydroponic environment. The expression of PHT1 genes in the roots and leaves was obtained at 0, 1, 3, 6, 12 and 24 h after induction.
The results indicated that three GaPHT1 genes were induced in leaf by low-Pi treatment. Relative to its expression in control plants (at 0 h), the expression of GaPHT1;3 was significantly increased at 3 h and significantly decreased at 6 h. GaPHT1;4 was significantly upregulated at 1 h. GaPHT1;7 was significantly upregulated at 1 and 3 h (Figure 7A). In the roots, GaPHT1;1 was significantly upregulated at 3 h. GaPHT1;3 and GaPHT1;5 were significantly upregulated at 1 and 3 h; their expression gradually decreased after 6 h, remaining higher than that at 0 h. GaPHT1;4 was significantly upregulated at 3 h. GaPHT1;7 was significantly upregulated at 1 to 3 h (Figure 8A). In general, the upregulation of gene expression induced by low P mainly occurred at 1 to 3 h after induction, while the expression at 6 h was lower than that at 3 h. These results indicated that the main response time of PHT1 genes to low-Pi stress in G. arboreum was approximately 1 to 3 h after treatment (Supplementary Table S2).
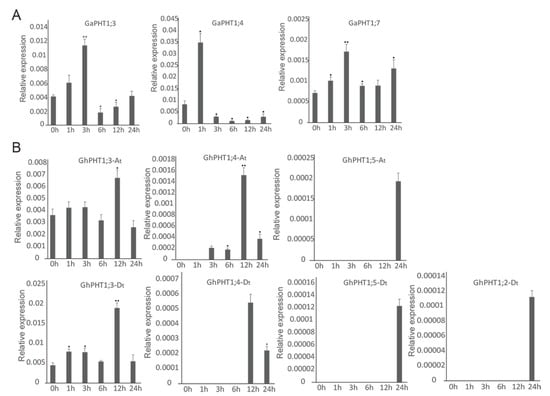
Figure 7.
Expression of PHT1 genes determined by qRT-PCR in leaves under phosphorus starvation stress. In the graphs, 0, 1, 3, 6, 12 and 24 h represent the time of low-Pi treatment. The error bars represent the standard deviations of three biological repeats. Statistical analyses were performed by comparing expression levels to that at 0 h without low-Pi treatment using Student’s t-test (* p < 0.05, ** p < 0.01) [45]. (A) G. arboreum; (B) G. hirsutum.
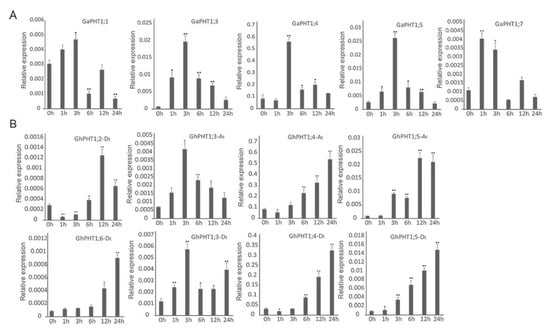
Figure 8.
Expression of PHT1 genes determined by qRT-PCR in roots under phosphorus-starvation stress. In the graphs, 0, 1, 3, 6, 12 and 24 h represent the time of low-Pi treatment. The error bars represent the standard deviations of three biological repeats. Statistical analyses were performed by comparing expression levels to that at 0 h without low-Pi treatment using Student’s t-test (* p < 0.05, ** p < 0.01) [45]. (A) G. arboreum; (B) G. hirsutum.
In G. hirsutum, seven PHT1 genes in the leaves responded to low P. GhPHT1;3-At was significantly upregulated at 12 h. GhPHT1;4-At was expressed at 3 h and significantly upregulated at 12 h. GhPHT1;3-Dt was significantly upregulated at 1, 3 and 12 h. The expression of GhPHT1;4-Dt was detected at 12 and 24 h. Expression of GhPHT1;5-At, GhPHT1;2-Dt and GhPHT1;5-Dt was not detected until 24 h, occurring at very low levels at this time. No expression of the other five PHT1 genes was detected in the leaves (Figure 7B). In the roots, GhPHT1;3-At and GhPHT1;3-Dt were significantly upregulated at 3 h. GhPHT1;4-At and GhPHT1;4-Dt were downregulated at 1 h and significantly upregulated from 6 h after induction. GhPHT1;5-At and GhPHT1;5-Dt were significantly upregulated from 3 to 24 h. GhPHT1;2-Dt was downregulated at 1 h and significantly upregulated at 6 and 12 h. GhPHT1;6-Dt was significantly upregulated at 12 and 24 h (Figure 8B). PHT1 genes in the leaves were significantly upregulated at 12 h, indicating that the response of PHT1 genes in the leaves to low-Pi stress was slow. In contrast, the expression of PHT1 genes in the roots was significantly changed at 1 h after induction, indicating that the PHT1 genes in the roots respond quickly to P starvation (Supplementary Table S3).
3. Discussion
3.1. Homologues PHT1 Genes in G. arboreum, G. raimondii and G. hirsutum
The Pi transporter PHT1 is highly conserved in plants and has conserved domains in both dicotyledons and monocotyledons; thus, it is amenable to phylogenetic analysis. Previous studies have identified nine PHT1 genes in A. thaliana (diploid) [39], 13 in O. sativa (diploid) [15] and 14 in Glycine max (diploid) [22]. Compared with the G. hirsutum genome, the genomes of the above species are smaller but contain similar numbers of PHT1 genes. The phylogenetic analysis revealed the sequence changes of the PHT1 family in Gossypium during domestication. In our study, seven, eight and twelve PHT1 genes were found in G. arboreum, G. raimondii and G. hirsutum, respectively. In G. hirsutum, six genes each were distributed on the A and D subgenomes, and the positions of homologous genes were consistent with their order on the donor genomes (Figure 1). G. hirsutum (AADD) is allotetraploid, and there is a homoeologous relationship between the A and D subgenomes. Numerous studies have shown that G. raimondii is the donor to the D subgenome of allotetraploid cotton such as G. hirsutum [46,47], and G. arboreum is a close relative of A subgenome in G. hirsutum, a finding supported by the homologous relationships among the PHT1 genes in Gossypium. However, the homologous analysis revealed that GaPHT1;7 in G. arboreum and GrPHT1;8 and GrPHT1;9 in G. raimondii had no homologous gene in G. hirsutum. The Blastp analysis based on the bidirectional best hit (BBH) method identified that the identity of GH_D02G1054 in G. hirsutum to GaPHT1;7 was 96.37%, and that to GrPHT1;9 was 98.66%. However, this gene has an incomplete A0109 domain, and thus, cannot be considered a member of the G. hirsutum PHT1 family. The highest identity of GrPHT1;8 to a gene in G. hirsutum was 86.02% (GhPHT1;2-Dt), indicating that GrPHT1;8 does not have homologous genes in G. hirsutum.
Duplicated genes can be retained for long periods of time and develop functional deviations [48]. In the phylogenetic tree, GaPHT1;7 and GrPHT1;9 were the only members of Group III, indicating their difference from other members. Compared with the other members, they had one fewer motif at each N-terminal and C-terminal (Figure 3A). A motif is the secondary structure of a protein molecule and the constituent unit of the domain, and the domain is an important part of protein function. A difference in motif might cause the protein to form a different domain, thus, changing the protein’s function [49]. Protein synthesis begins at the N-terminal. The C-terminal is important in determining the biological function of the protein. Thus, two genes—GaPHT1;7 and GrPHT1;9—may be functionally differentiated from the other members of the PHT1 family.
Promoters known to be related to Pi absorption and transport include W-box elements in BnPHT1;4 of Brassica napus, P1BS-like and PHO-like motifs in barley PHT1 promoters, P1BS elements in A. thaliana, rice and barley PHT1 promoters, and Myc-box in eggplant and tobacco PHT1 promoters [50,51,52]. The elements Myc-box (TTTCTTGT) and P1BS (GNATATNC) were not found in the cotton promoters (Supplementary Table S1). P1BS can interact with PHR1 transcription factors, but it is not a specific element that encodes a PHT1 gene. It has been reported that all dicotyledonous PHT1 promoters induced by arbuscular mycorrhizal fungi (AMF) contain Myc-box and P1BS elements. AMF help plants obtain nutrients, especially P.
3.2. PHT1 Gene Responses to P Deficiency in Cotton
PHT1 is a high-affinity P transporter in plants and is responsible for maintaining P concentrations in plants in low-Pi environments. Accumulating evidence has revealed that the expression of PHT1 genes changes under low-Pi stress. In A. thaliana, AtPHT1;8 and AtPHT1;9 have been shown to be strongly induced in roots by P deficiency and to be involved in P transport from the roots to the aerial parts [14]. In rice, the expression of OsPT2, OsPT4, OsPT8, OsPT9 and OsPT10 was found to increase significantly under low-Pi induction [17,18,19,20]. In soybean, P deficiency alters the expression of GmPT1, GmPT2 and GmPT5 [23,24]. In Solanaceae, low-Pi stress has been shown to induce strong expression of LePT1 and LePT2 in tomato [26,53], and enhance the expression of StPHT1;1 in potato leaf and root [54].
In our study, transcriptome data analysis showed that GhPHT1;3-At and GhPHT1;3-Dt in G. hirsutum were expressed in roots, stems, leaves and petals; these genes may be involved in long-distance Pi transport (Figure 6C). Studies have shown that P plays a vital role in cotton reproductive growth [5]. During reproductive growth, the proportion of P allocated to reproductive organs, such as flower buds, increases. At the boll-opening stage, the amount of P allocated to the reproductive organs peaks. The expression of GhPHT1;4-At, GhPHT1;2-Dt and GhPHT1;6-Dt predominantly occurs in reproductive organs, indicating that these genes might be involved in reproductive growth.
In G. arboreum treated with low P, root expression of GaPHT1;1, GaPHT1;3, GaPHT1;4, GaPHT1;5 and GaPHT1;7 was significantly increased at 3 h relative to at 0 h (Figure 8A). Genes that were significantly upregulated by P starvation induction might be crucial genes. In G. hirsutum under low-Pi stress, the expression of GhPHT1;3-At and GhPHT1;3-Dt began to change early (within 1 to 3 h), and GhPHT1;4-At, GhPHT1;5-At, GhPHT1;2-Dt, GhPHT1;4-Dt, GhPHT1;5-Dt, and GhPHT1;6-Dt exhibited changes in expression after 6 h of stress (Figure 8B).
RNA-seq analysis of G. arboreum revealed that GaPHT1;4 and GaPHT1;5 were highly expressed in the roots (Figure 6A); their homologous genes GhPHT1;4-At and GhPHT1;5-At in G. hirsutum were also highly expressed in the roots (Figure 6C). In G. raimondii, GrPHT1;4 was highly expressed in the roots (Figure 6B); similarly, its homologous gene GhPHT1;4-Dt in G. hirsutum was highly expressed in the roots. In G. hirsutum, GhPHT1;5-Dt (D subgenome), homologous to GhPHT1;5-At (A subgenome), was highly expressed in the roots (Figure 6C). The qRT-PCR analysis showed that the expression of GhPHT1;4-At, GhPHT1;5-At, GhPHT1;4-Dt and GhPHT1;5-Dt in the roots was upregulated continuously under P starvation (Figure 8B). In summary, the above results suggest that the members of two pairs of homologous genes (GhPHT1;4-At, GhPHT1;5-At, GhPHT1;4-Dt and GhPHT1;5-Dt) are crucial genes for P uptake by roots in P starvation conditions. The findings of this study will accelerate the elucidation of the mechanisms of P absorption, transport and distribution and the development of cotton varieties with high P use efficiency.
4. Materials and Methods
4.1. Genome-Wide Identification of PHT1 Genes in Three Gossypium Species
The whole genome [55] and protein [46] sequences of G. arboreum, G. raimondii and G. hirsutum were downloaded from Cotton Database Resources (https://www.cottongen.org/, accessed on 22 January 2019), and the PHT1 protein sequence of A. thaliana was downloaded from The Arabidopsis Information Resource (TAIR: http://www.arabidopsis.org/, accessed on 18 February 2019). The conserved domain of the PHT1 protein was analyzed by Pfam (http://pfam.xfam.org/, accessed on 8 June 2019). Then, the domain was searched in the whole cotton genome by HMMER3.3 (hmmer.org, accessed on 8 June 2019), and the possible PHT1 genes were extracted. Using ClustalW2 software, multiple sequences of the putative genes were aligned [56] to construct an accurate Hidden Markov Model (HMM) of PHT1 in cotton. Using HMM, possible PHT1 family genes were re-extracted from the cotton genome database. The extracted results were subjected to phylogenetic analysis with A. thaliana PHT1 genes, and the genes with similar sequences were subjected to a NCBI Conserved Domain search to determine the integrity of the domain.
4.2. Location and Structural Analysis of PHT1 Genes
MapChart [57] was used to locate PHT1 genes on chromosomes. The positions of exons and introns were predicted by GSDS2.0 software [58]. Conservative motif prediction was performed by MEME software [59], and the maximum number of motifs was set to 12. The maximum width of the logo was 50, and the minimum was 6. TBtools [60] was employed to produce the figures on gene structure, motif structure and the phylogenetic tree. PlantCARE [61] was for promoter analysis.
4.3. Sequence Alignment and Phylogenetic Tree Construction
ClustalW2 [56] was used to compare the amino acid (aa) sequences of PHT1 family members. For pairwise parameters, the gap opening was set at 10.00, and the gap extension was set at 0.10; for multiple parameters, Gap Opening Penalty was set at 10.00, and Gap Extension Penalty was set at 0.20. MEGA X [62] software was applied to construct the phylogenetic tree by ML with the bootstrap method (number of bootstrap replications = 1000) and the Poisson model. The tree was visualized using iTOL [63].
4.4. Analysis of Synteny and Duplication Types
MCScanX [41] was used for synteny analysis with the following parameters—match score: 50; gap penalty: −1; match size: 5; e value: 1e-05; max gaps: 25. Duplication event analysis was performed with the results of the synteny analysis. The results were visualized by Circos [42]. The KaKs_Calculator [64] was used to calculate Ka and Ks. The syntenic data of PHT1 genes in G. arboreum, G. raimondii and G. hirsutum were extracted using Perl script. Blastp (2.7.1+), based on the BBH method, was used to identify homologous gene relationships among the three cotton species. The synteny among the three cotton species was calculated by MCScan (python version) software, and the running platform was jcvi.
4.5. P starvation Treatment
G. hirsutum acc. TM-1 and G. arboreum acc. Shixiya 1 were used for gene expression analysis. Cotton plants were hydroponically grown in Hoagland nutrient solution (with the Pi concentration set to 1 × 10⁻³ mol/L). For P deficiency treatment, the Pi concentration was set to 1 × 10⁻⁵ mol/L, with the remaining ingredients added according to the levels in Hoagland nutrient solution. The missing K+ was supplemented in the form of KCl. Pi-deficiency treatment was initiated at the first-true-leaf stage. Samples of leaves and roots were collected at 0, 1, 3, 6, 12 and 24 h after low-Pi treatment, frozen in liquid nitrogen and stored at −70 °C for later use. G. hirsutum acc. TM-1 high-throughput RNA-sequencing data from Zhang et al. [47] were analyzed for the expression patterns of the PHT1 genes in different tissues. Transcriptome data of G. arboreum were downloaded from NCBI BioProject PRJNA349094 [65], and transcriptome data of G. raimondii were downloaded from NCBI BioProject PRJNA507768 [66]. Gene expression was expressed as Fragments Per Kilobase per Million (FPKM), and heat maps were constructed using the R package pheatmap.
4.6. RNA Extraction and qRT-PCR
Total RNA was extracted by the Cetyltrimethylammonium bromide (CTAB) -acidic phenolic method described by Jiang and Zhang [67]. HiScript qRT SuperMix for qPCR (+gDNAwiper) (Vazyme Biotech Co., Ltd., Nanjing, China) was used to remove genomic DNA and reverse transcribe the RNA to synthesize first-strand cDNA. The primers (Supplementary Table S4) for qRT-PCR were designed by Primer 5.0 (http://www.premierbiosoft.com/, accessed on 20 July 2019). The amplified product size was between 100 and 300 bp, and the annealing temperature was between 58 and 60 °C. The specificity of the primers was detected using the primer-blast tool (https://www.ncbi.nlm.nih.gov/tools/primer-blast/, accessed on 21 July 2019) of NCBI. The Histone3 (AF024716) gene (forward primer and reverse primer sequences 5’GAAGCCTCATCGATACCGTC-3’ and 5’-CTACCACTACCATCATGG-3’, respectively) was used as an internal reference gene. qRT-PCR amplification was performed with a LightCycler ®480 Instrument II (Roche). The cycling conditions were as follows: 95 °C for 30 s, followed by 40 cycles of 95 °C for 10 s and 60 °C for 30 s. The melting curve was analyzed using LightCycler® 480 software 1.5. Each experiment was performed with three biological replicates and three technical replicates. SYBR Green I was utilized in qRT-PCR procedure [68]. A delta-delta Ct method was used for the estimation of relative transcription levels according to Livak and Schmittgen [69]. Analysis of variance [45] was performed with SPSS (https://www.ibm.com/support/ pages/node/417815, accessed on 3 August 2019).
Supplementary Materials
Supplementary materials can be found at https://www.mdpi.com/1422-0067/21/14/4905/s1. Figure S1. Phylogenetic tree based on A. thaliana PHT1 protein sequences and cotton PHT1 candidate protein sequences. Figure S2. The phylogenetic tree of PHT1 genes in Gossypium, O. sativa and A. thaliana. Table S1. Cis-acting element of known Pi transporter predicted in Gossypium. Table S2. Results of 2^(-∆Ct) in qRT-PCR of GaPHT1 and GhPHT1 (in leaf). Table S3. Results of 2^(-∆Ct) in qRT-PCR of GaPHT1 and GhPHT1 (in root). Table S4. Primer sequences used for relative expression analysis of Pi transporter genes from cotton.
Author Contributions
B.Z. and S.C. conceived and designed the experiments; S.C. conducted the experiments; S.C. and F.L. collected and analyzed the data; S.C visualized the data and wrote the first draft; B.Z. reviewed, modified and edited the manuscript. All authors have read and agreed to the published version of the manuscript.
Acknowledgments
This work was supported by the National Key Research and Development Program of China (2016YFD0100203), the Fundamental Research Funds for the Central Universities and Jiangsu Collaborative Innovation Center for Modern Crop Production. The funding body has had no role in the design of the study and collection, analysis, and interpretation of data, or in writing the manuscript.
Conflicts of Interest
The authors declare no competing interest.
Abbreviations
| P | phosphorus |
| Pi | phosphate |
| PHT | phosphate transporter |
| MFS | Major Facilitator Superfamily |
| aa | amino acid |
| pIs | isoelectric points |
| ML | Maximum Likelihood |
| GSDS | Gene Structure Display Server |
| BBH | Bidirectional Best Hit |
| AMF | arbuscular mycorrhizal fungi |
| HMM | Hidden Markov Model |
| qRT-PCR | quantitative real time PCR |
| MEME | Multiple Em for Motif Elicitation |
| Ka | Non-synonymous substitution |
| Ks | Synonymous substitution |
References
- Bieleski, R.L. Phosphate Pools, Phosphate Transport, and Phosphate Availability. Annu. Rev. Plant Physiol. 1973, 24, 225–252. [Google Scholar] [CrossRef]
- Vance, C.P.; Uhde-Stone, C.; Allan, D.L. Phosphorus acquisition and use: Critical adaptations by plants for securing a nonrenewable resource. New Phytol. 2003, 157, 423–447. [Google Scholar] [CrossRef]
- Schachtman, D. Phosphorus Uptake by Plants: From Soil to Cell. Plant Physiol. 1998, 116, 447–453. [Google Scholar] [CrossRef] [PubMed]
- Wang, X.; Tang, C.; Guppy, C.; Sale, P.W.G. Phosphorus acquisition characteristics of cotton (Gossypium hirsutum L.), wheat (Triticum aestivum L.) and white lupin (Lupinus albus L.) under P deficient conditions. Plant Soil 2008, 312, 117–128. [Google Scholar] [CrossRef]
- Girma, K.; Teal, R.; Freeman, K.; Boman, R.; Raun, W. Cotton lint yield and quality as affected by applications of N, P, and K fertilizers. J. Cotton Sci. 2006, 11, 12–19. [Google Scholar]
- Nussaume, L.; Kanno, S.; Javot, H.; Marin, E.; Pochon, N.; Ayadi, A.; Nakanishi, T.M.; Thibaud, M.-C. Phosphate Import in Plants: Focus on the PHT1 Transporters. Front. Plant Sci. 2011, 2, 83. [Google Scholar] [CrossRef] [PubMed]
- Arredondo, D.L.; González, M.A.L.; González-Morales, S.I.; López-Bucio, J.; Herrera-Estrella, L. Phosphate Nutrition: Improving Low-Phosphate Tolerance in Crops. Annu. Rev. Plant Boil. 2014, 65, 95–123. [Google Scholar] [CrossRef]
- Shin, H.; Shin, H.-S.; Dewbre, G.R.; Harrison, M.J. Phosphate transport inArabidopsis: Pht1;1 and Pht1;4 play a major role in phosphate acquisition from both low- and high-phosphate environments. Plant J. 2004, 39, 629–642. [Google Scholar] [CrossRef]
- Rausch, C.; Bucher, M. Molecular mechanisms of phosphate transport in plants. Planta 2002, 216, 23–37. [Google Scholar] [CrossRef]
- Raghothama, K.G. Phosphate Acquisition. Annu. Rev. Plant Boil. 1999, 50, 665–693. [Google Scholar] [CrossRef]
- Raghothama, K. Phosphate transport and signaling. Curr. Opin. Plant Boil. 2000, 3, 182–187. [Google Scholar] [CrossRef]
- Ayadi, A.; David, P.; Arrighi, J.-F.; Chiarenza, S.; Thibaud, M.-C.; Nussaume, L.; Marín, E. Reducing the genetic redundancy of Arabidopsis PHOSPHATE TRANSPORTER1 transporters to study phosphate uptake and signaling. Plant Physiol. 2015, 167, 1511–1526. [Google Scholar] [CrossRef]
- Nagarajan, V.K.; Jain, A.; Poling, M.D.; Lewis, A.J.; Raghothama, K.G.; Smith, A.P. Arabidopsis Pht1;5 mobilizes phosphate between source and sink organs and influences the interaction between phosphate homeostasis and ethylene signaling. Plant Physiol. 2011, 156, 1149–1163. [Google Scholar] [CrossRef] [PubMed]
- Remy, E.; Cabrito, T.R.; A Batista, R.; Teixeira, M.; Sá-Correia, I.; Duque, P. The Pht1;9 and Pht1;8 transporters mediate inorganic phosphate acquisition by the Arabidopsis thaliana root during phosphorus starvation. New Phytol. 2012, 195, 356–371. [Google Scholar] [CrossRef] [PubMed]
- Paszkowski, U.; Kroken, S.; Roux, C.; Briggs, S.P. Rice phosphate transporters include an evolutionarily divergent gene specifically activated in arbuscular mycorrhizal symbiosis. Proc. Natl. Acad. Sci. USA 2002, 99, 13324–13329. [Google Scholar] [CrossRef] [PubMed]
- Sun, S.; Gu, M.; Cao, Y.; Huang, X.; Zhang, X.; Ai, P.; Zhao, J.; Fan, X.; Xu, G. A constitutive expressed phosphate transporter, OsPht1;1, modulates phosphate uptake and translocation in phosphate-replete rice. Plant Physiol. 2012, 159, 1571–1581. [Google Scholar] [CrossRef] [PubMed]
- Ai, P.; Sun, S.; Zhao, J.; Fan, X.; Xin, W.; Guo, Q.; Yu, L.; Shen, Q.; Wu, P.; Miller, A.J.; et al. Two rice phosphate transporters, OsPht1;2 and OsPht1;6, have different functions and kinetic properties in uptake and translocation. Plant J. 2009, 57, 798–809. [Google Scholar] [CrossRef] [PubMed]
- Ye, Y.; Yuan, J.; Chang, X.; Yang, M.; Zhang, L.; Lü, K.; Lian, X. The Phosphate Transporter Gene OsPht1;4 Is Involved in Phosphate Homeostasis in Rice. PLoS ONE 2015, 10, e0126186. [Google Scholar] [CrossRef] [PubMed]
- Li, Y.; Zhang, J.; Zhang, X.; Fan, H.; Gu, M.; Qu, H.; Xu, G. Phosphate transporter OsPht1;8 in rice plays an important role in phosphorus redistribution from source to sink organs and allocation between embryo and endosperm of seeds. Plant Sci. 2015, 230, 23–32. [Google Scholar] [CrossRef]
- Wang, X.; Wang, Y.; Piñeros, M.A.; Wang, Z.; Wang, W.; Li, C.; Wu, Z.; Kochian, L.; Wu, P. Phosphate transporters OsPHT1;9 and OsPHT1;10 are involved in phosphate uptake in rice. Plant Cell Environ. 2013, 37, 1159–1170. [Google Scholar] [CrossRef]
- Tamura, Y.; Kobae, Y.; Mizuno, T.; Hata, S. Identification and Expression Analysis of Arbuscular Mycorrhiza-Inducible Phosphate Transporter Genes of Soybean. Biosci. Biotechnol. Biochem. 2012, 76, 309–313. [Google Scholar] [CrossRef] [PubMed][Green Version]
- Qin, L.; Guo, Y.; Chen, L.; Liang, R.; Gu, M.; Xu, G.; Zhao, J.; Walk, T.; Liao, H. Functional Characterization of 14 Pht1 Family Genes in Yeast and Their Expressions in Response to Nutrient Starvation in Soybean. PLoS ONE 2012, 7, e47726. [Google Scholar] [CrossRef]
- Wu, Z.; Zhao, J.; Gao, R.; Hu, G.; Gai, J.; Xu, G.; Xing, H. Molecular Cloning, Characterization and Expression Analysis of Two Members of the Pht1 Family of Phosphate Transporters in Glycine max. PLoS ONE 2011, 6, e19752. [Google Scholar] [CrossRef] [PubMed]
- Qin, L.; Zhao, J.; Tian, J.; Chen, L.; Sun, Z.; Guo, Y.; Lu, X.; Gu, M.; Xu, G.; Liao, H. The high-affinity phosphate transporter GmPT5 regulates phosphate transport to nodules and nodulation in soybean. Plant Physiol. 2012, 159, 1634–1643. [Google Scholar] [CrossRef] [PubMed]
- Inoue, Y.; Kobae, Y.; Omoto, E.; Tanaka, A.; Banba, M.; Takai, S.; Tamura, Y.; Hirose, A.; Komatsu, K.; Otagaki, S.; et al. The Soybean Mycorrhiza-Inducible Phosphate Transporter Gene, GmPT7, also Shows Localized Expression at the Tips of Vein Endings of Senescent Leaves. Plant Cell Physiol. 2014, 55, 2102–2111. [Google Scholar] [CrossRef] [PubMed]
- Chen, A.; Chen, X.; Wang, H.; Liao, D.; Gu, M.; Qu, H.; Sun, S.; Xu, G. Genome-wide investigation and expression analysis suggest diverse roles and genetic redundancy of Pht1 family genes in response to Pi deficiency in tomato. BMC Plant Boil. 2014, 14, 61. [Google Scholar] [CrossRef]
- Nagy, R.; Vasconcelos, M.J.V.; Zhao, S.; McElver, J.; Bruce, W.; Amrhein, N.; Raghothama, K.G.; Bucher, M. Differential Regulation of Five Pht1 Phosphate Transporters from Maize (Zea mays L.). Plant Boil. 2006, 8, 186–197. [Google Scholar] [CrossRef]
- Liu, J.; Versaw, W.K.; Pumplin, N.; Gomez, S.K.; Blaylock, L.A.; Harrison, M.J. Closely related members of the Medicago truncatula PHT1 phosphate transporter gene family encode phosphate transporters with distinct biochemical activities. J. Boil. Chem. 2008, 283, 24673–24681. [Google Scholar] [CrossRef] [PubMed]
- Guo, C.; Guo, L.; Li, X.; Gu, J.; Zhao, M.; Duan, W.; Ma, C.; Lu, W.; Xiao, K. TaPT2, a high-affinity phosphate transporter gene in wheat (Triticum aestivum L.), is crucial in plant Pi uptake under phosphorus deprivation. Acta Physiol. Plant. 2014, 36, 1373–1384. [Google Scholar] [CrossRef]
- Liu, B.; Zhao, S.; Wu, X.; Wang, X.; Nan, Y.; Wang, N.; Chen, Q. Identification and characterization of phosphate transporter genes in potato. J. Biotechnol. 2017, 264, 17–28. [Google Scholar] [CrossRef]
- Walder, F.; Brulé, D.; Koegel, S.; Wiemken, A.; Boller, T.; Courty, P.-E. Plant phosphorus acquisition in a common mycorrhizal network: Regulation of phosphate transporter genes of the Pht1 family in sorghum and flax. New Phytol. 2015, 205, 1632–1645. [Google Scholar] [CrossRef] [PubMed]
- Liu, P.; Chen, S.; Song, A.; Zhao, S.; Fang, W.; Guan, Z.; Liao, Y.; Jiang, J.; Chen, F. A putative high affinity phosphate transporter, CmPT1, enhances tolerance to Pi deficiency of chrysanthemum. BMC Plant Boil. 2014, 14, 18. [Google Scholar] [CrossRef]
- Parra-Almuna, L.; Pontigo, S.; Larama, G.; Cumming, J.R.; Pérez-Tienda, J.; Ferrol, N.; Mora, M.D.L.L. Expression analysis and functional characterization of two PHT1 family phosphate transporters in ryegrass. Planta 2019, 251, 6. [Google Scholar] [CrossRef] [PubMed]
- Wendel, J.F.; Flagel, L.; Adams, K.L. Jeans, Genes, and Genomes: Cotton as a Model for Studying Polyploidy. Polyploidy Genome Evolut. 2012, 10, 181–207. [Google Scholar] [CrossRef]
- Wendel, J.F.; Cronn, R.C. Polyploidy and the evolutionary history of cotton. Adv. Agron. 2003, 78, 139–186. [Google Scholar] [CrossRef]
- Wang, M.; Tu, L.; Lin, M.; Lin, Z.; Wang, P.; Yang, Q.; Ye, Z.; Shen, C.; Li, J.; Zhang, L.; et al. Asymmetric subgenome selection and cis-regulatory divergence during cotton domestication. Nat. Genet. 2017, 49, 579–587. [Google Scholar] [CrossRef]
- Chao, M.; Zhang, Z.; Song, H.; Li, C.; Zhang, X.; Hu, G.; Zhang, J.; Wang, Q. Genome-Wide Identification and Expression Analysis of Pht1 Family Genes in Cotton (Gossypium hirsutum L.). J. Cotton Sci. 2017, 29, 59–69. [Google Scholar]
- Mueckler, M.; Caruso, C.; Baldwin, S.; Panico, M.; Blench, I.; Morris, H.; Allard, W.; Lienhard, G.; Lodish, H. Sequence and structure of a human glucose transporter. Science 1985, 229, 941–945. [Google Scholar] [CrossRef] [PubMed]
- Poirier, Y.; Bucher, M. Phosphate Transport and Homeostasis in Arabidopsis. Arab. Book 2002, 1, e0024. [Google Scholar] [CrossRef]
- Rizzon, C.; Ponger, L.; Gaut, B.S. Striking Similarities in the Genomic Distribution of Tandemly Arrayed Genes in Arabidopsis and Rice. PLoS Comput. Boil. 2006, 2, e115. [Google Scholar] [CrossRef]
- Wang, Y.; Tang, H.; DeBarry, J.D.; Tan, X.; Li, J.; Wang, X.; Lee, T.-H.; Jin, H.; Marler, B.; Guo, H.; et al. MCScanX: A toolkit for detection and evolutionary analysis of gene synteny and collinearity. Nucleic Acids Res. 2012, 40, e49. [Google Scholar] [CrossRef] [PubMed]
- Krzywinski, M.; Schein, J.; Birol, I.; Connors, J.; Gascoyne, R.; Horsman, D.; Jones, S.J.M.; Marra, M.A. Circos: An information aesthetic for comparative genomics. Genome Res. 2009, 19, 1639–1645. [Google Scholar] [CrossRef] [PubMed]
- Van Der Graaff, E.; Schwacke, R.; Schneider, A.; DeSimone, M.; Flügge, U.-I.; Kunze, R. Transcription Analysis of Arabidopsis Membrane Transporters and Hormone Pathways during Developmental and Induced Leaf Senescence. Plant Physiol. 2006, 141, 776–792. [Google Scholar] [CrossRef] [PubMed]
- Al-Ghazi, Y.; Muller, B.; Pinloche, S.; Tranbarger, T.J.; Nacry, P.; Rossignol, M.; Tardieu, F.; Doumas, P. Temporal responses of Arabidopsis root architecture to phosphate starvation: Evidence for the involvement of auxin signalling. Plant Cell Environ. 2003, 26, 1053–1066. [Google Scholar] [CrossRef]
- Student. The Probable Error of a Mean; Biometrika: Oxford, UK, 1908; Volume 6, pp. 1–25. [Google Scholar]
- Hu, Y.; Chen, J.-D.; Fang, L.; Zhang, Z.; Ma, W.; Niu, Y.; Ju, L.; Deng, J.; Zhao, T.; Lian, J.; et al. Gossypium barbadense and Gossypium hirsutum genomes provide insights into the origin and evolution of allotetraploid cotton. Nat. Genet. 2019, 51, 739–748. [Google Scholar] [CrossRef] [PubMed]
- Zhang, T.; Hu, Y.; Jiang, W.-K.; Fang, L.; Guan, X.; Chen, J.-D.; Zhang, J.; A Saski, C.; Scheffler, B.E.; Stelly, D.M.; et al. Sequencing of allotetraploid cotton (Gossypium hirsutum L. acc. TM-1) provides a resource for fiber improvement. Nat. Biotechnol. 2015, 33, 531–537. [Google Scholar] [CrossRef]
- Hanada, K.; Zou, C.; Lehti-Shiu, M.D.; Shinozaki, K.; Shiu, S.-H. Importance of Lineage-Specific Expansion of Plant Tandem Duplicates in the Adaptive Response to Environmental Stimuli1[W][OA]. Plant Physiol. 2008, 148, 993–1003. [Google Scholar] [CrossRef]
- Krishna, S.S.; Majumdar, I.; Grishin, N.V. Structural classification of zinc fingers: Survey and Summary. Nucleic Acids Res. 2003, 31, 532–550. [Google Scholar] [CrossRef]
- Schünmann, P.H.D.; Richardson, A.E.; Smith, F.W.; Delhaize, E. Characterization of promoter expression patterns derived from the Pht1 phosphate transporter genes of barley (Hordeum vulgare L.). J. Exp. Bot. 2004, 55, 855–865. [Google Scholar] [CrossRef]
- Ren, F.; Zhao, C.-Z.; Liu, C.-S.; Huang, K.-L.; Guo, Q.-Q.; Chang, L.-L.; Xiong, H.; Li, X. A Brassica napus PHT1 phosphate transporter, BnPht1;4, promotes phosphate uptake and affects roots architecture of transgenic Arabidopsis. Plant Mol. Boil. 2014, 86, 595–607. [Google Scholar] [CrossRef]
- Chen, A.; Gu, M.; Sun, S.; Hong, S.; Zhu, L.; Xu, G. Identification of two conserved cis-acting elements, MYCS and P1BS, involved in the regulation of mycorrhiza-activated phosphate transporters in eudicot species. New Phytol. 2010, 189, 1157–1169. [Google Scholar] [CrossRef]
- Poulsen, K.H.; Nagy, R.; Gao, L.-L.; Smith, S.E.; Bucher, M.; Smith, F.A.; Jakobsen, I. Physiological and molecular evidence for Pi uptake via the symbiotic pathway in a reduced mycorrhizal colonization mutant in tomato associated with a compatible fungus. New Phytol. 2005, 168, 445–454. [Google Scholar] [CrossRef] [PubMed]
- Chen, A.; Hu, J.; Sun, S.; Xu, G. Conservation and divergence of both phosphate- and mycorrhiza-regulated physiological responses and expression patterns of phosphate transporters in solanaceous species. New Phytol. 2007, 173, 817–831. [Google Scholar] [CrossRef] [PubMed]
- Wang, K.; Wang, Z.; Li, F.; Ye, W.; Wang, J.; Song, G.; Yue, Z.; Cong, L.; Shang, H.; Zhu, S.; et al. The draft genome of a diploid cotton Gossypium raimondii. Nat. Genet. 2012, 44, 1098–1103. [Google Scholar] [CrossRef] [PubMed]
- Thompson, J.D.; Gibson, T.J.; Higgins, D.G. Multiple Sequence Alignment Using ClustalW and ClustalX. Curr. Protoc. Bioinform. 2002, 2, 2.3.1–2.3.22. [Google Scholar] [CrossRef] [PubMed]
- Voorrips, R.E. MapChart: Software for the graphical presentation of linkage maps and QTLs. J. Hered. 2002, 93, 77–78. [Google Scholar] [CrossRef]
- Hu, B.; Jin, J.; Guo, A.-Y.; Zhang, H.; Luo, J.; Gao, G. GSDS 2.0: An upgraded gene feature visualization server. Bioinformtics 2014, 31, 1296–1297. [Google Scholar] [CrossRef]
- Bailey, T.L.; Bodén, M.; Buske, F.A.; Frith, M.; Grant, C.E.; Clementi, L.; Ren, J.; Li, W.W.; Noble, W.S. MEME SUITE: Tools for motif discovery and searching. Nucleic Acids Res. 2009, 37, W202–W208. [Google Scholar] [CrossRef]
- Chen, C.; Xia, R.; Chen, H.; He, Y. TBtools, a Toolkit for Biologists integrating various HTS-data handling tools with a user-friendly interface. bioRxiv 2018, 10, 289660. [Google Scholar] [CrossRef]
- Lescot, M. PlantCARE, a database of plant cis-acting regulatory elements and a portal to tools for in silico analysis of promoter sequences. Nucleic Acids Res. 2002, 30, 325–327. [Google Scholar] [CrossRef]
- Kumar, S.; Stecher, G.; Li, M.; Knyaz, C.; Tamura, K. MEGA X: Molecular Evolutionary Genetics Analysis across Computing Platforms. Mol. Boil. Evol. 2018, 35, 1547–1549. [Google Scholar] [CrossRef] [PubMed]
- Letunic, I.; Bork, P. Interactive Tree Of Life (iTOL) v4: Recent updates and new developments. Nucleic Acids Res. 2019, 47, W256–W259. [Google Scholar] [CrossRef] [PubMed]
- Wang, D.; Zhang, Y.; Zhang, Z.; Zhu, J.; Yu, J. KaKs_Calculator 2.0: A Toolkit Incorporating Gamma-Series Methods and Sliding Window Strategies. Genom. Proteom. Bioinform. 2010, 8, 77–80. [Google Scholar] [CrossRef]
- Du, X.; Huang, G.; He, S.; Yang, Z.; Sun, G.; Ma, X.; Li, N.; Zhang, X.; Sun, J.; Liu, M.; et al. Resequencing of 243 diploid cotton accessions based on an updated A genome identifies the genetic basis of key agronomic traits. Nat. Genet. 2018, 50, 796–802. [Google Scholar] [CrossRef]
- Dong, Q.; Zhou, Z.; Cai, X.; Lu, P.; Kirungu, J.N.; Zhou, Z.; Wang, X.; Wang, X.; Xu, Y.; Hou, Y.; et al. RNA-Sequencing, Physiological and RNAi Analyses Provide Insights into the Response Mechanism of the ABC-Mediated Resistance to Verticillium dahliae Infection in Cotton. Genes 2019, 10, 110. [Google Scholar] [CrossRef]
- Jiang, J.X.; Zhang, T. Extraction of Total RNA in Cotton Tissues with CTAB-acidic Phenolic Method. Cotton Sci. 2003, 15, 166–167. [Google Scholar]
- Wittwer, C.T.; Herrmann, M.G.; Moss, A.A.; Rasmussen, R.P. Continuous Fluorescence Monitoring of Rapid Cycle DNA Amplification. Biotechniques 1997, 22, 130–138. [Google Scholar] [CrossRef]
- Livak, K.J.; Schmittgen, T.D. Analysis of Relative Gene Expression Data Using Real-Time Quantitative PCR and the 2−ΔΔCT. Methods 2001, 25, 402–408. [Google Scholar] [CrossRef]


© 2020 by the authors. Licensee MDPI, Basel, Switzerland. This article is an open access article distributed under the terms and conditions of the Creative Commons Attribution (CC BY) license (http://creativecommons.org/licenses/by/4.0/).