Identification of Brain-Specific Treatment Effects in NPC1 Disease by Focusing on Cellular and Molecular Changes of Sphingosine-1-Phosphate Metabolism


 , ,
, ,  , and
, and 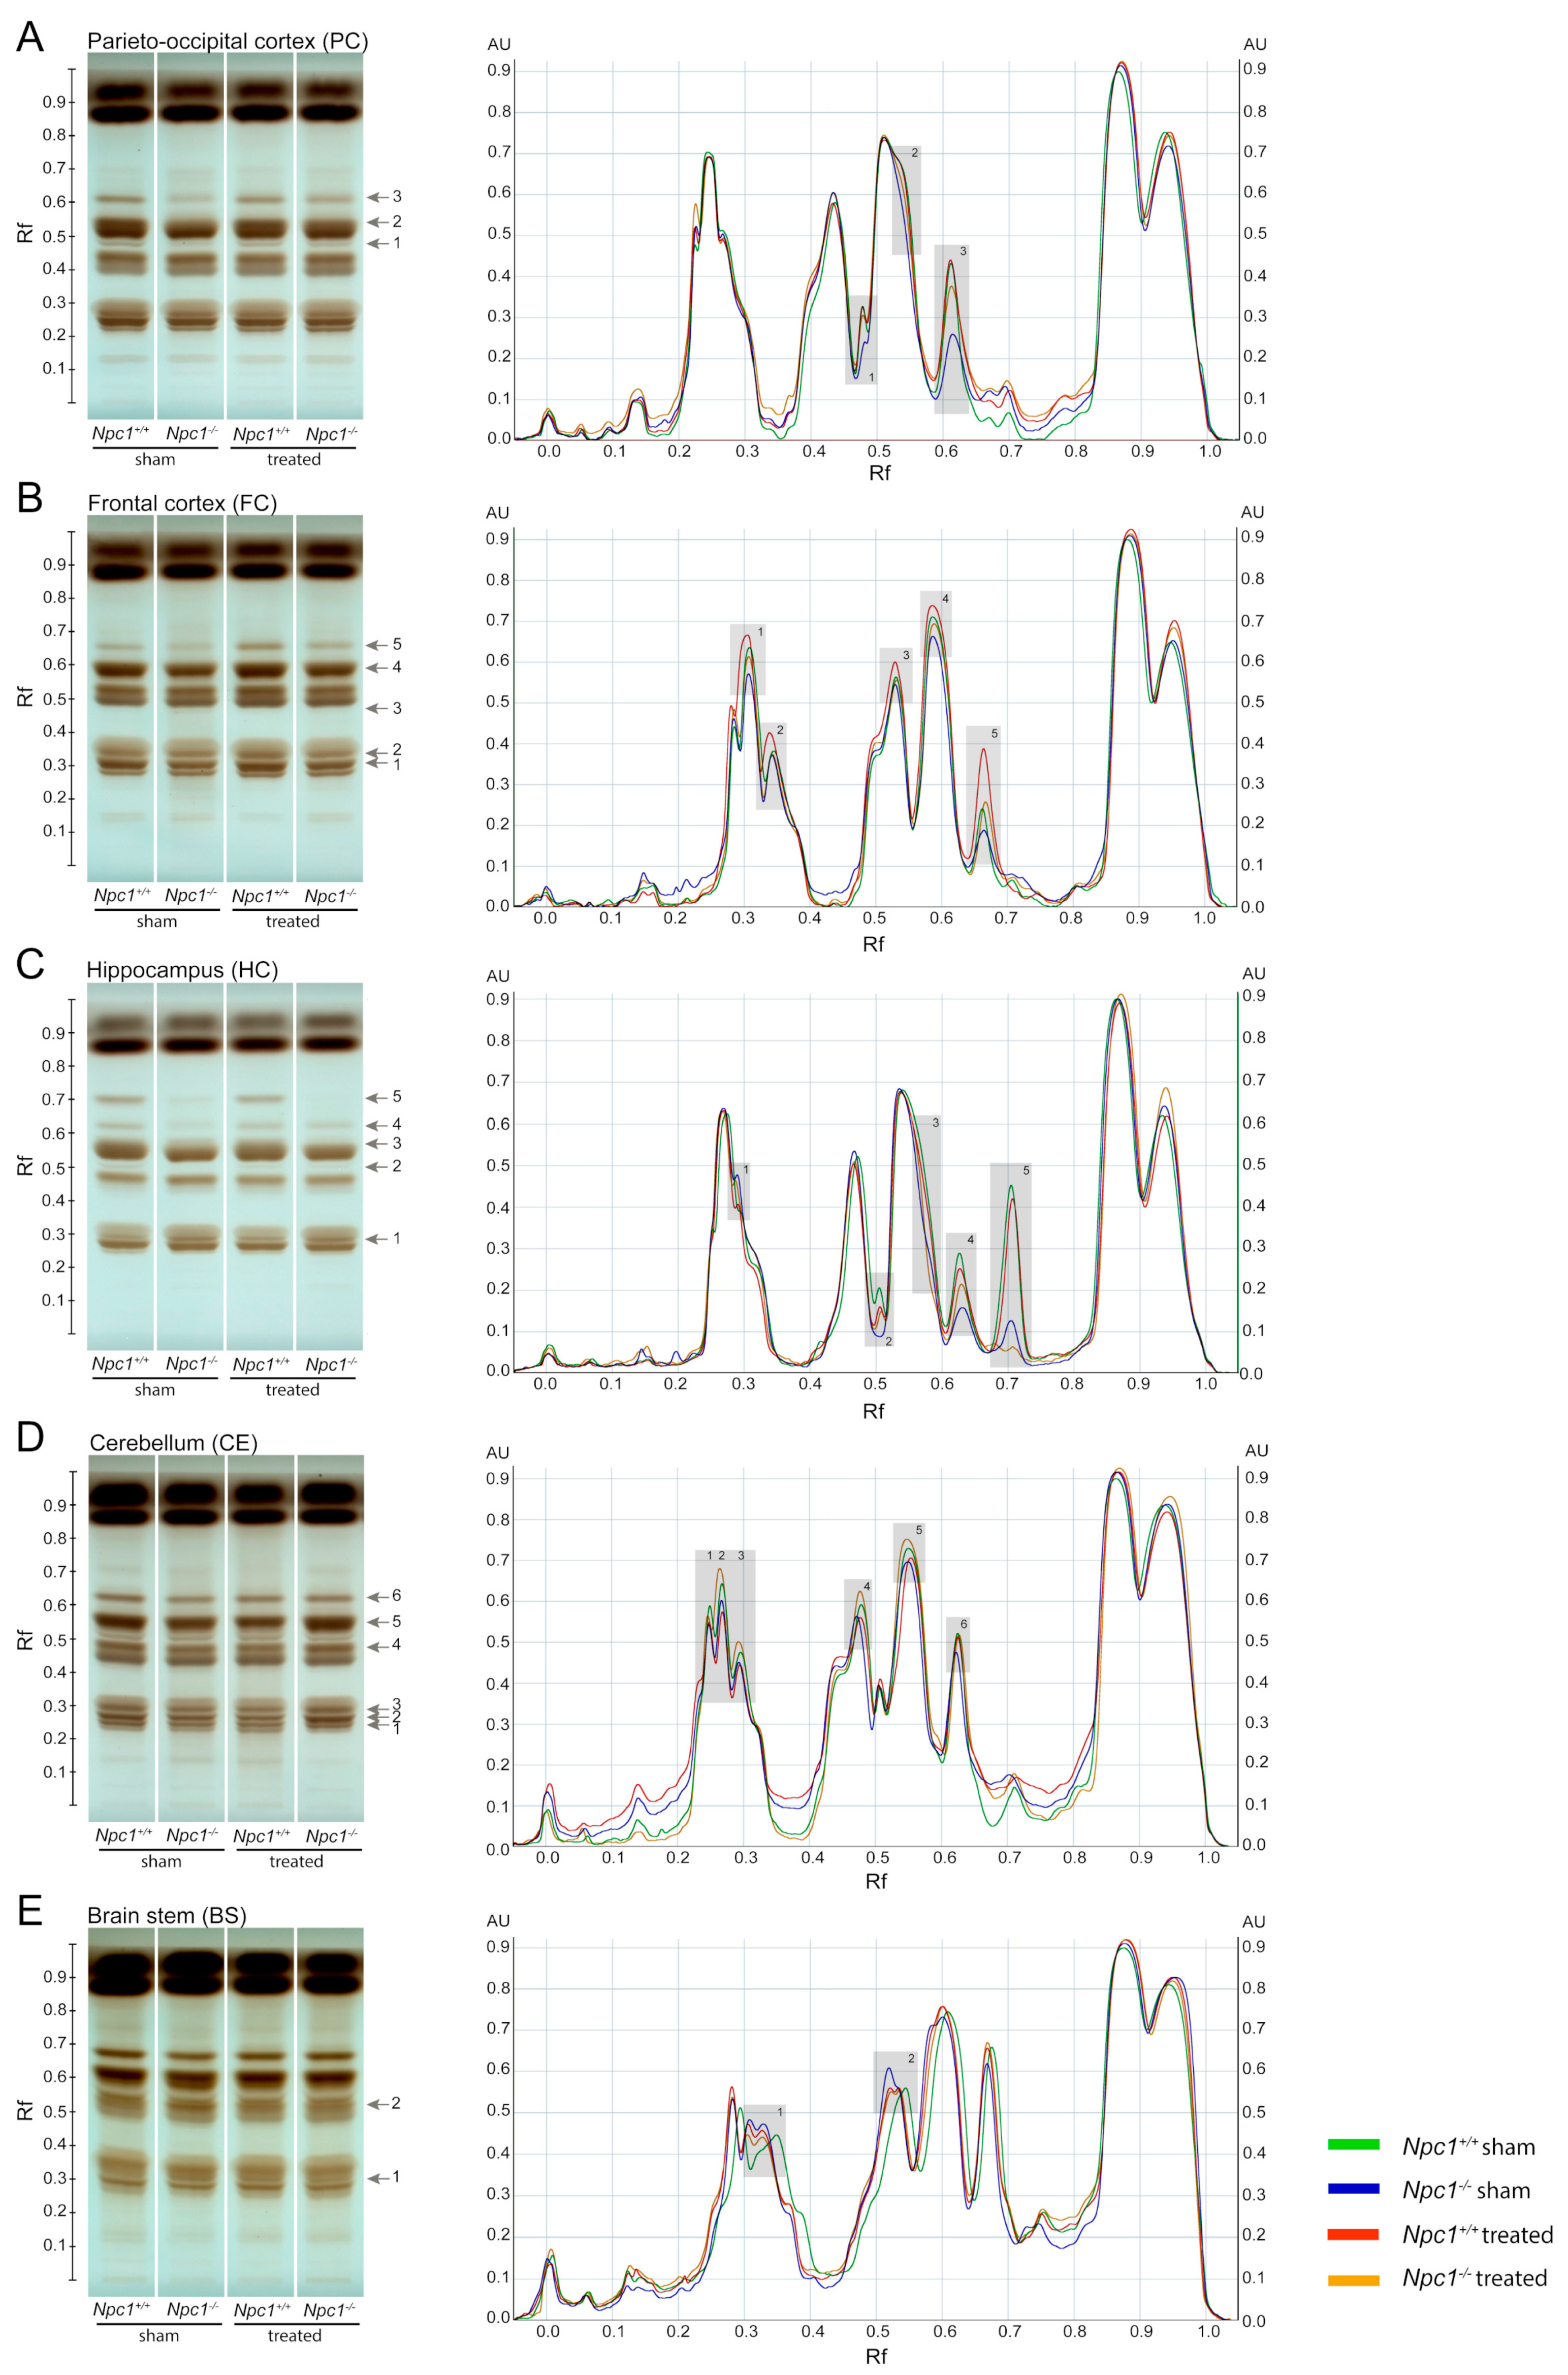
Abstract
1. Introduction
2. Results
2.1. Disruption of Lipid Homeostasis in Different Brain Regions under Treatment
2.1.1. Parieto-Occipital Cortex (PC)
2.1.2. Frontal Cortex (FC)
2.1.3. Hippocampus (HC)
2.1.4. Cerebellum (CE)
2.1.5. Brain Stem (BS)
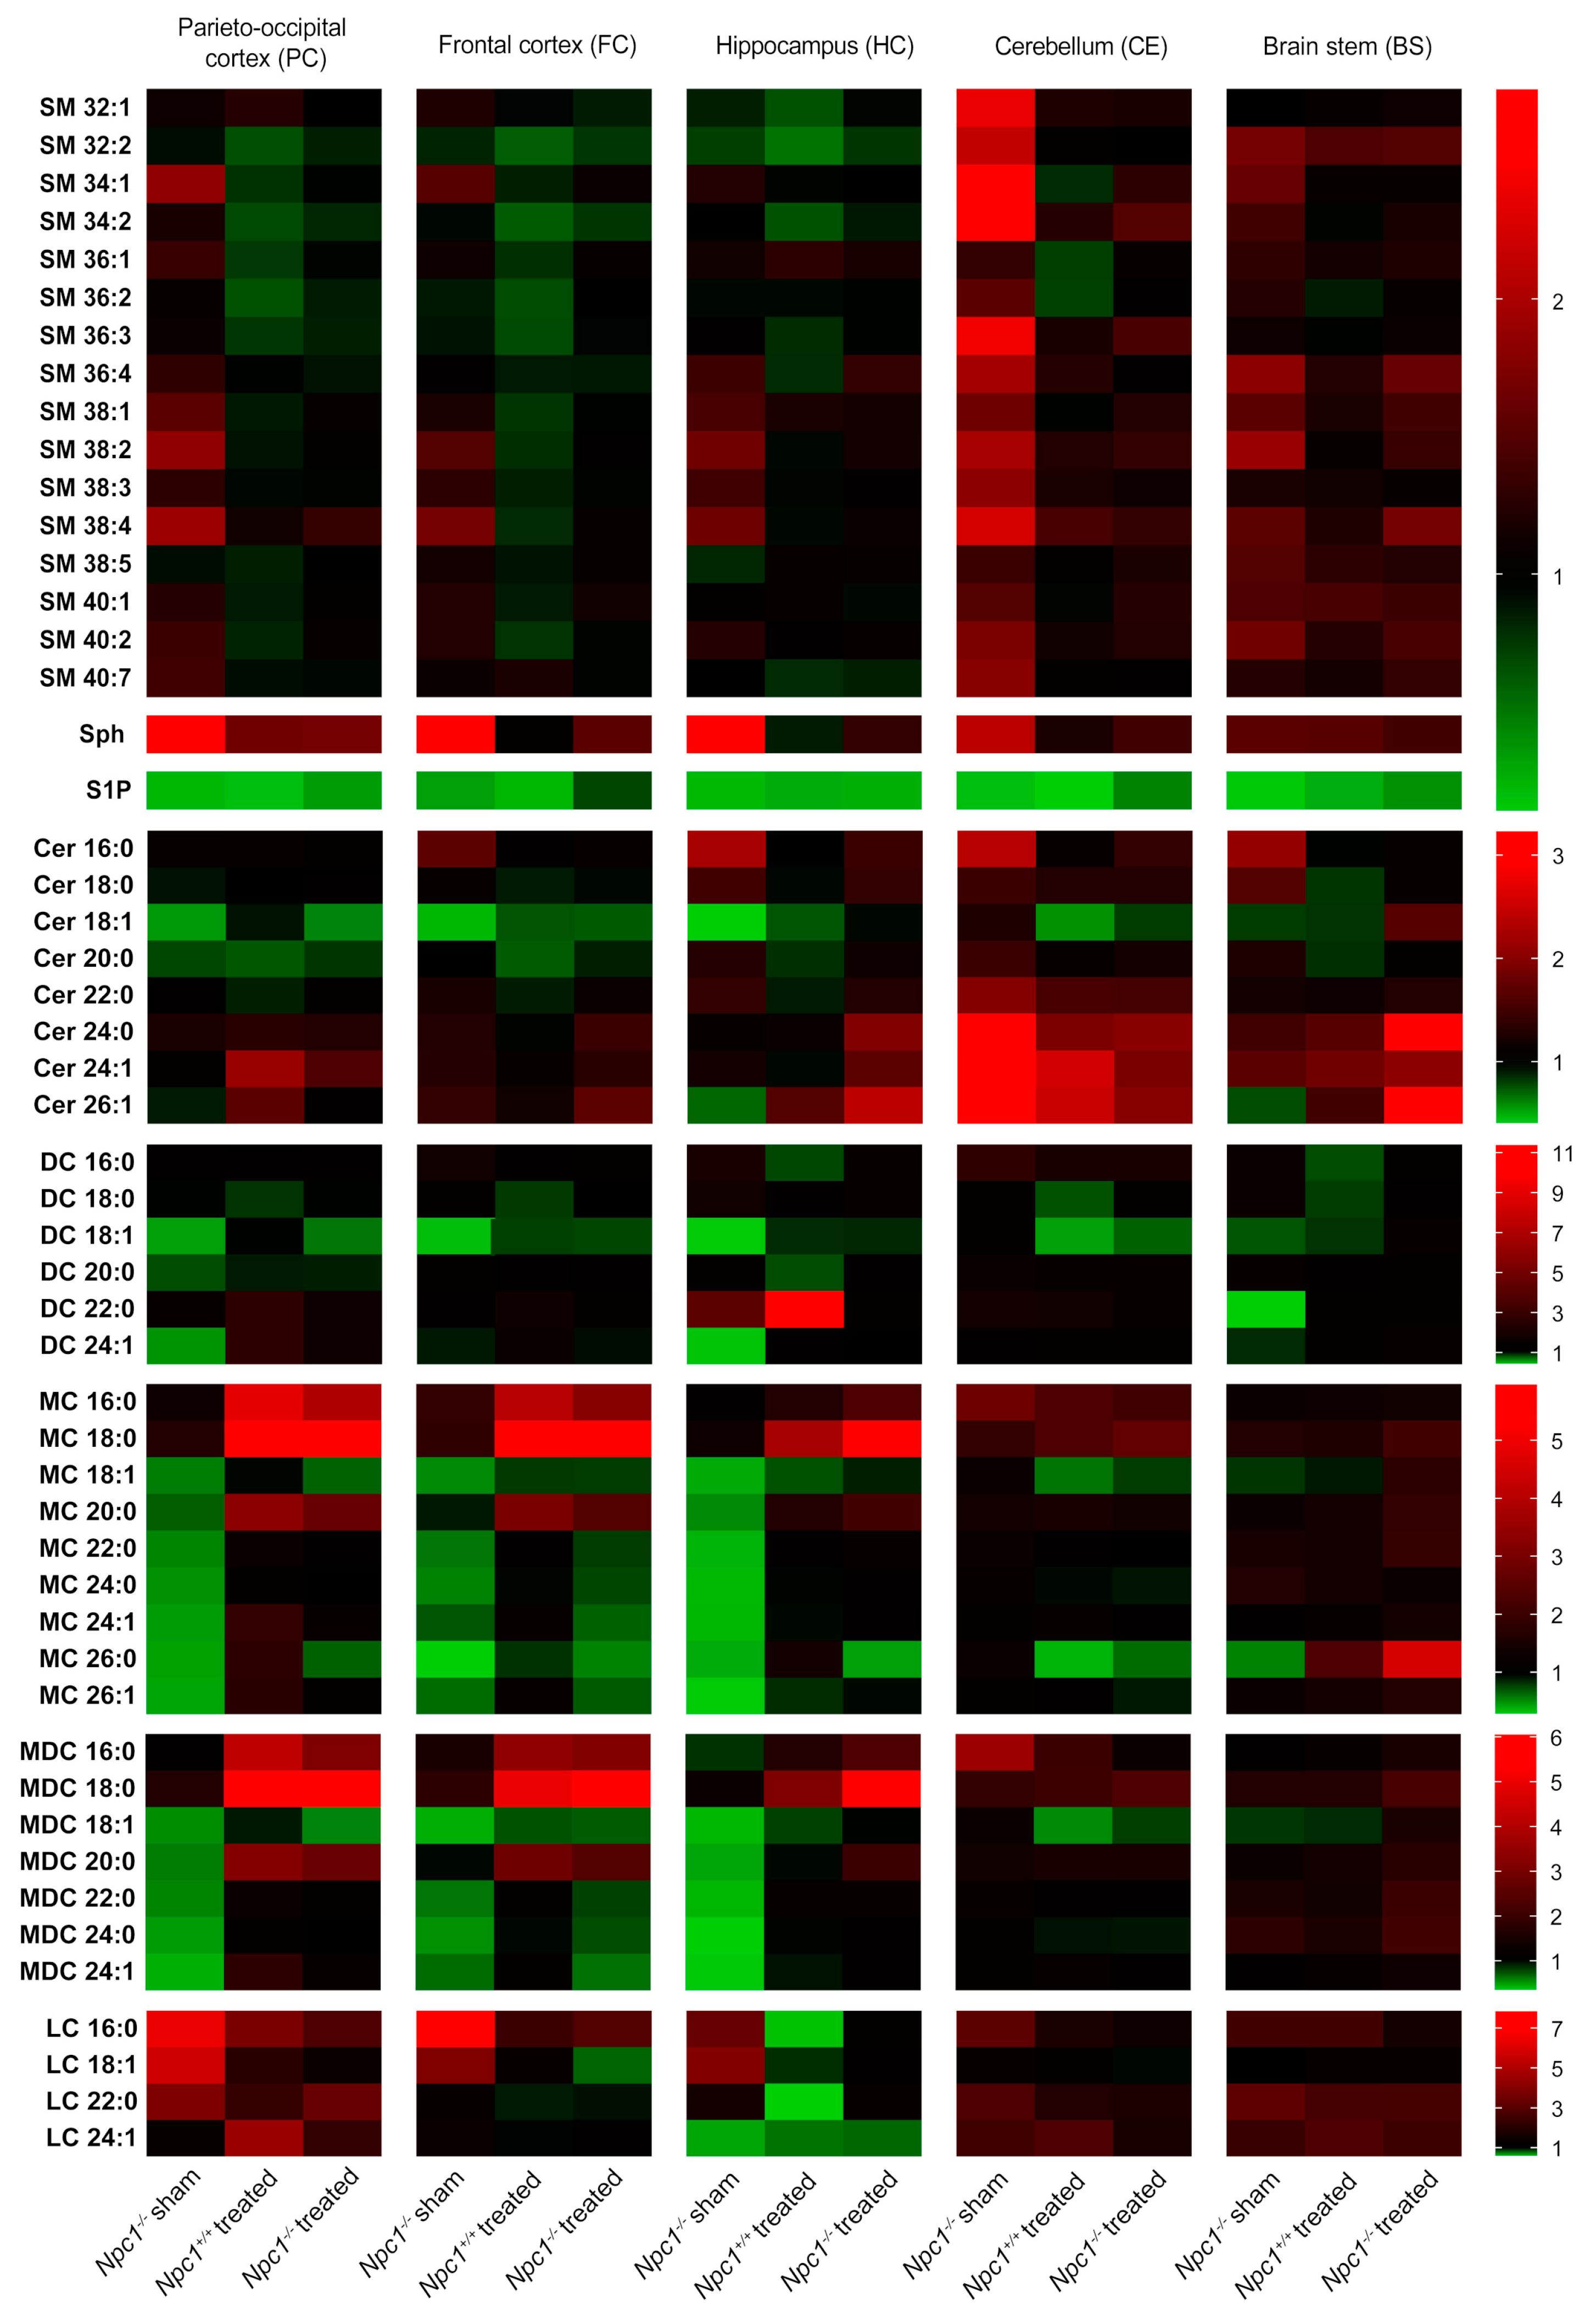
2.2. Characterization of Lipid Changes in Sham-Treated and Treated Npc1−/− Mice
2.2.1. Sphingomyelins (SM)
2.2.2. Sphingosine (Sph)
2.2.3. Sphingosine-1-Phosphate (S1P)
2.2.4. Ceramides (Cer)
2.2.5. Dihydro Ceramides (DC)
2.2.6. Monohexosyl Ceramides (MC)
2.2.7. Monohexosyl Dihydroceramides (MDC)
2.2.8. Lactosylceramides (LC)
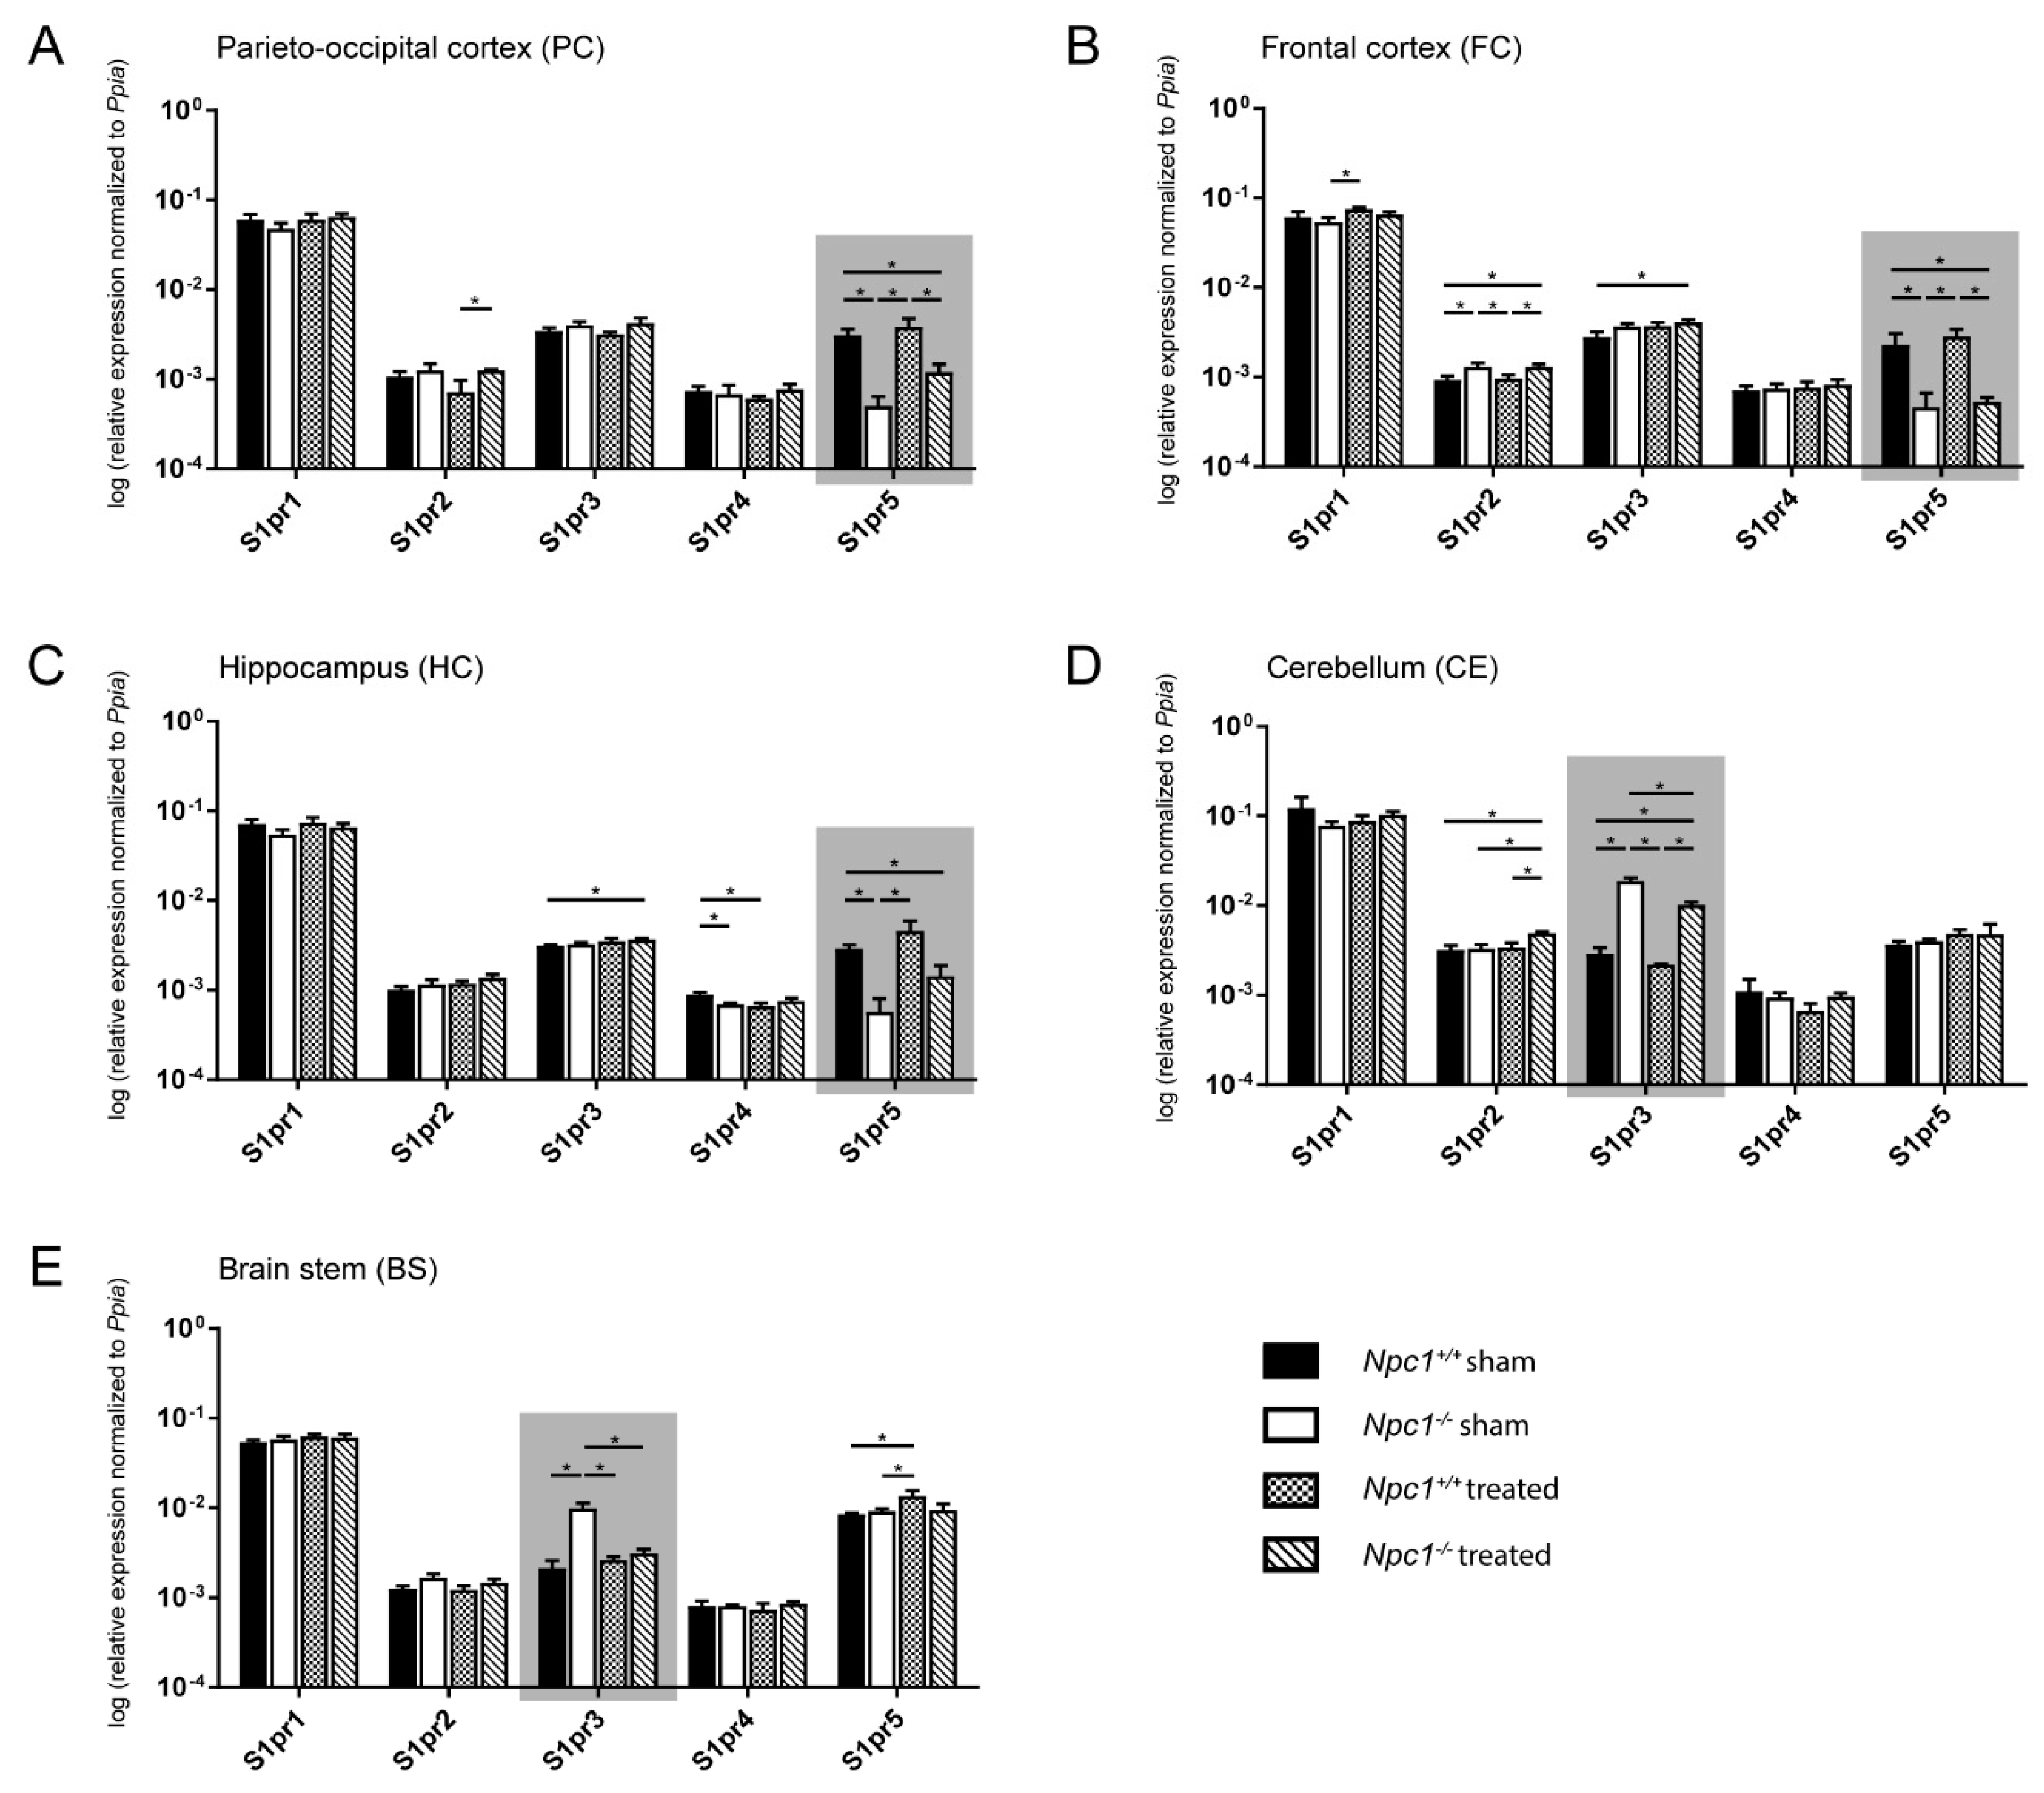
2.3. Distinct Changes of S1pr3 and S1pr5 mRNA Expression in Npc1−/− Mice
2.3.1. Parieto-Occipital Cortex (PC)
2.3.2. Frontal Cortex (FC)
2.3.3. Hippocampus (HC)
2.3.4. Cerebellum (CE)
2.3.5. Brain stem (BS)
2.4. Changes of S1PR3/5 Protein Expression in Treated Npc1-/- Mice
2.5. Cell-Type-Specific mRNA Expression of S1PRs
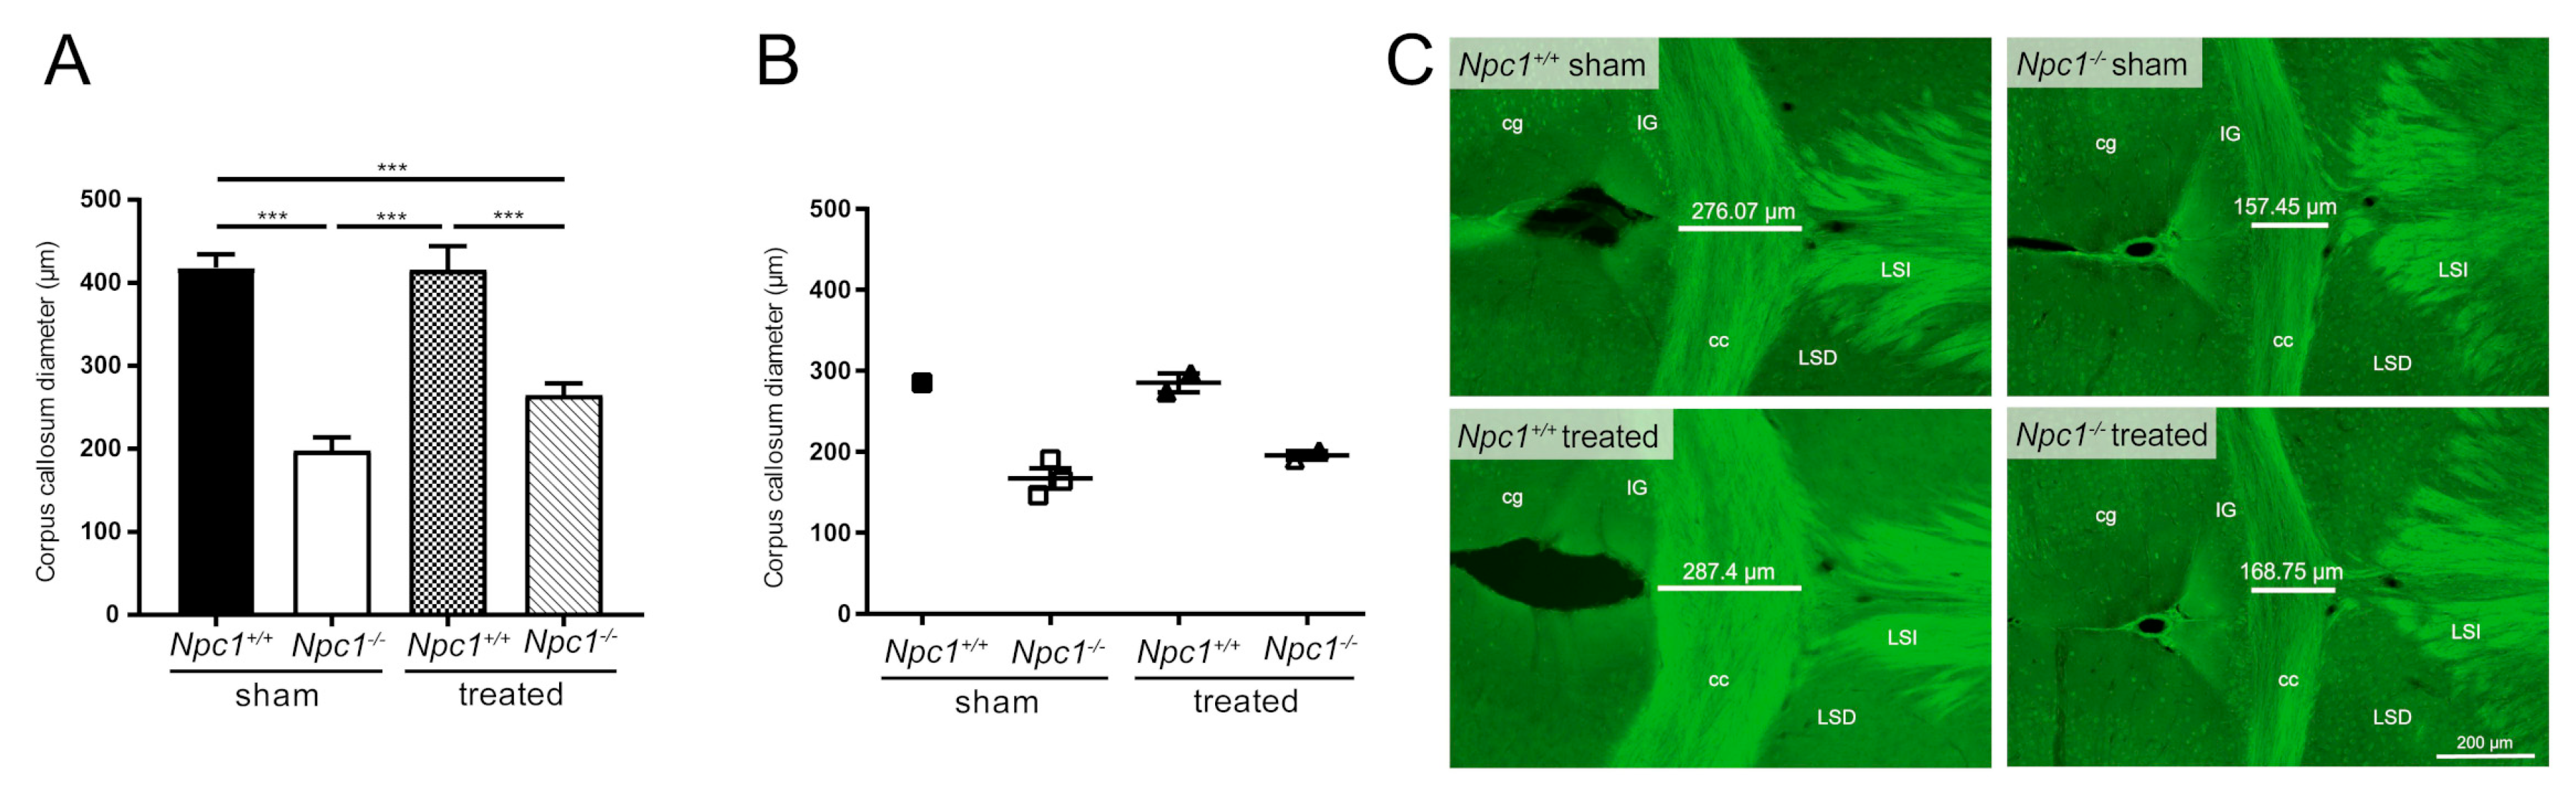
2.6. Treatment Did Not Prevent Reduction of the Diameter of the Corpus Callosum
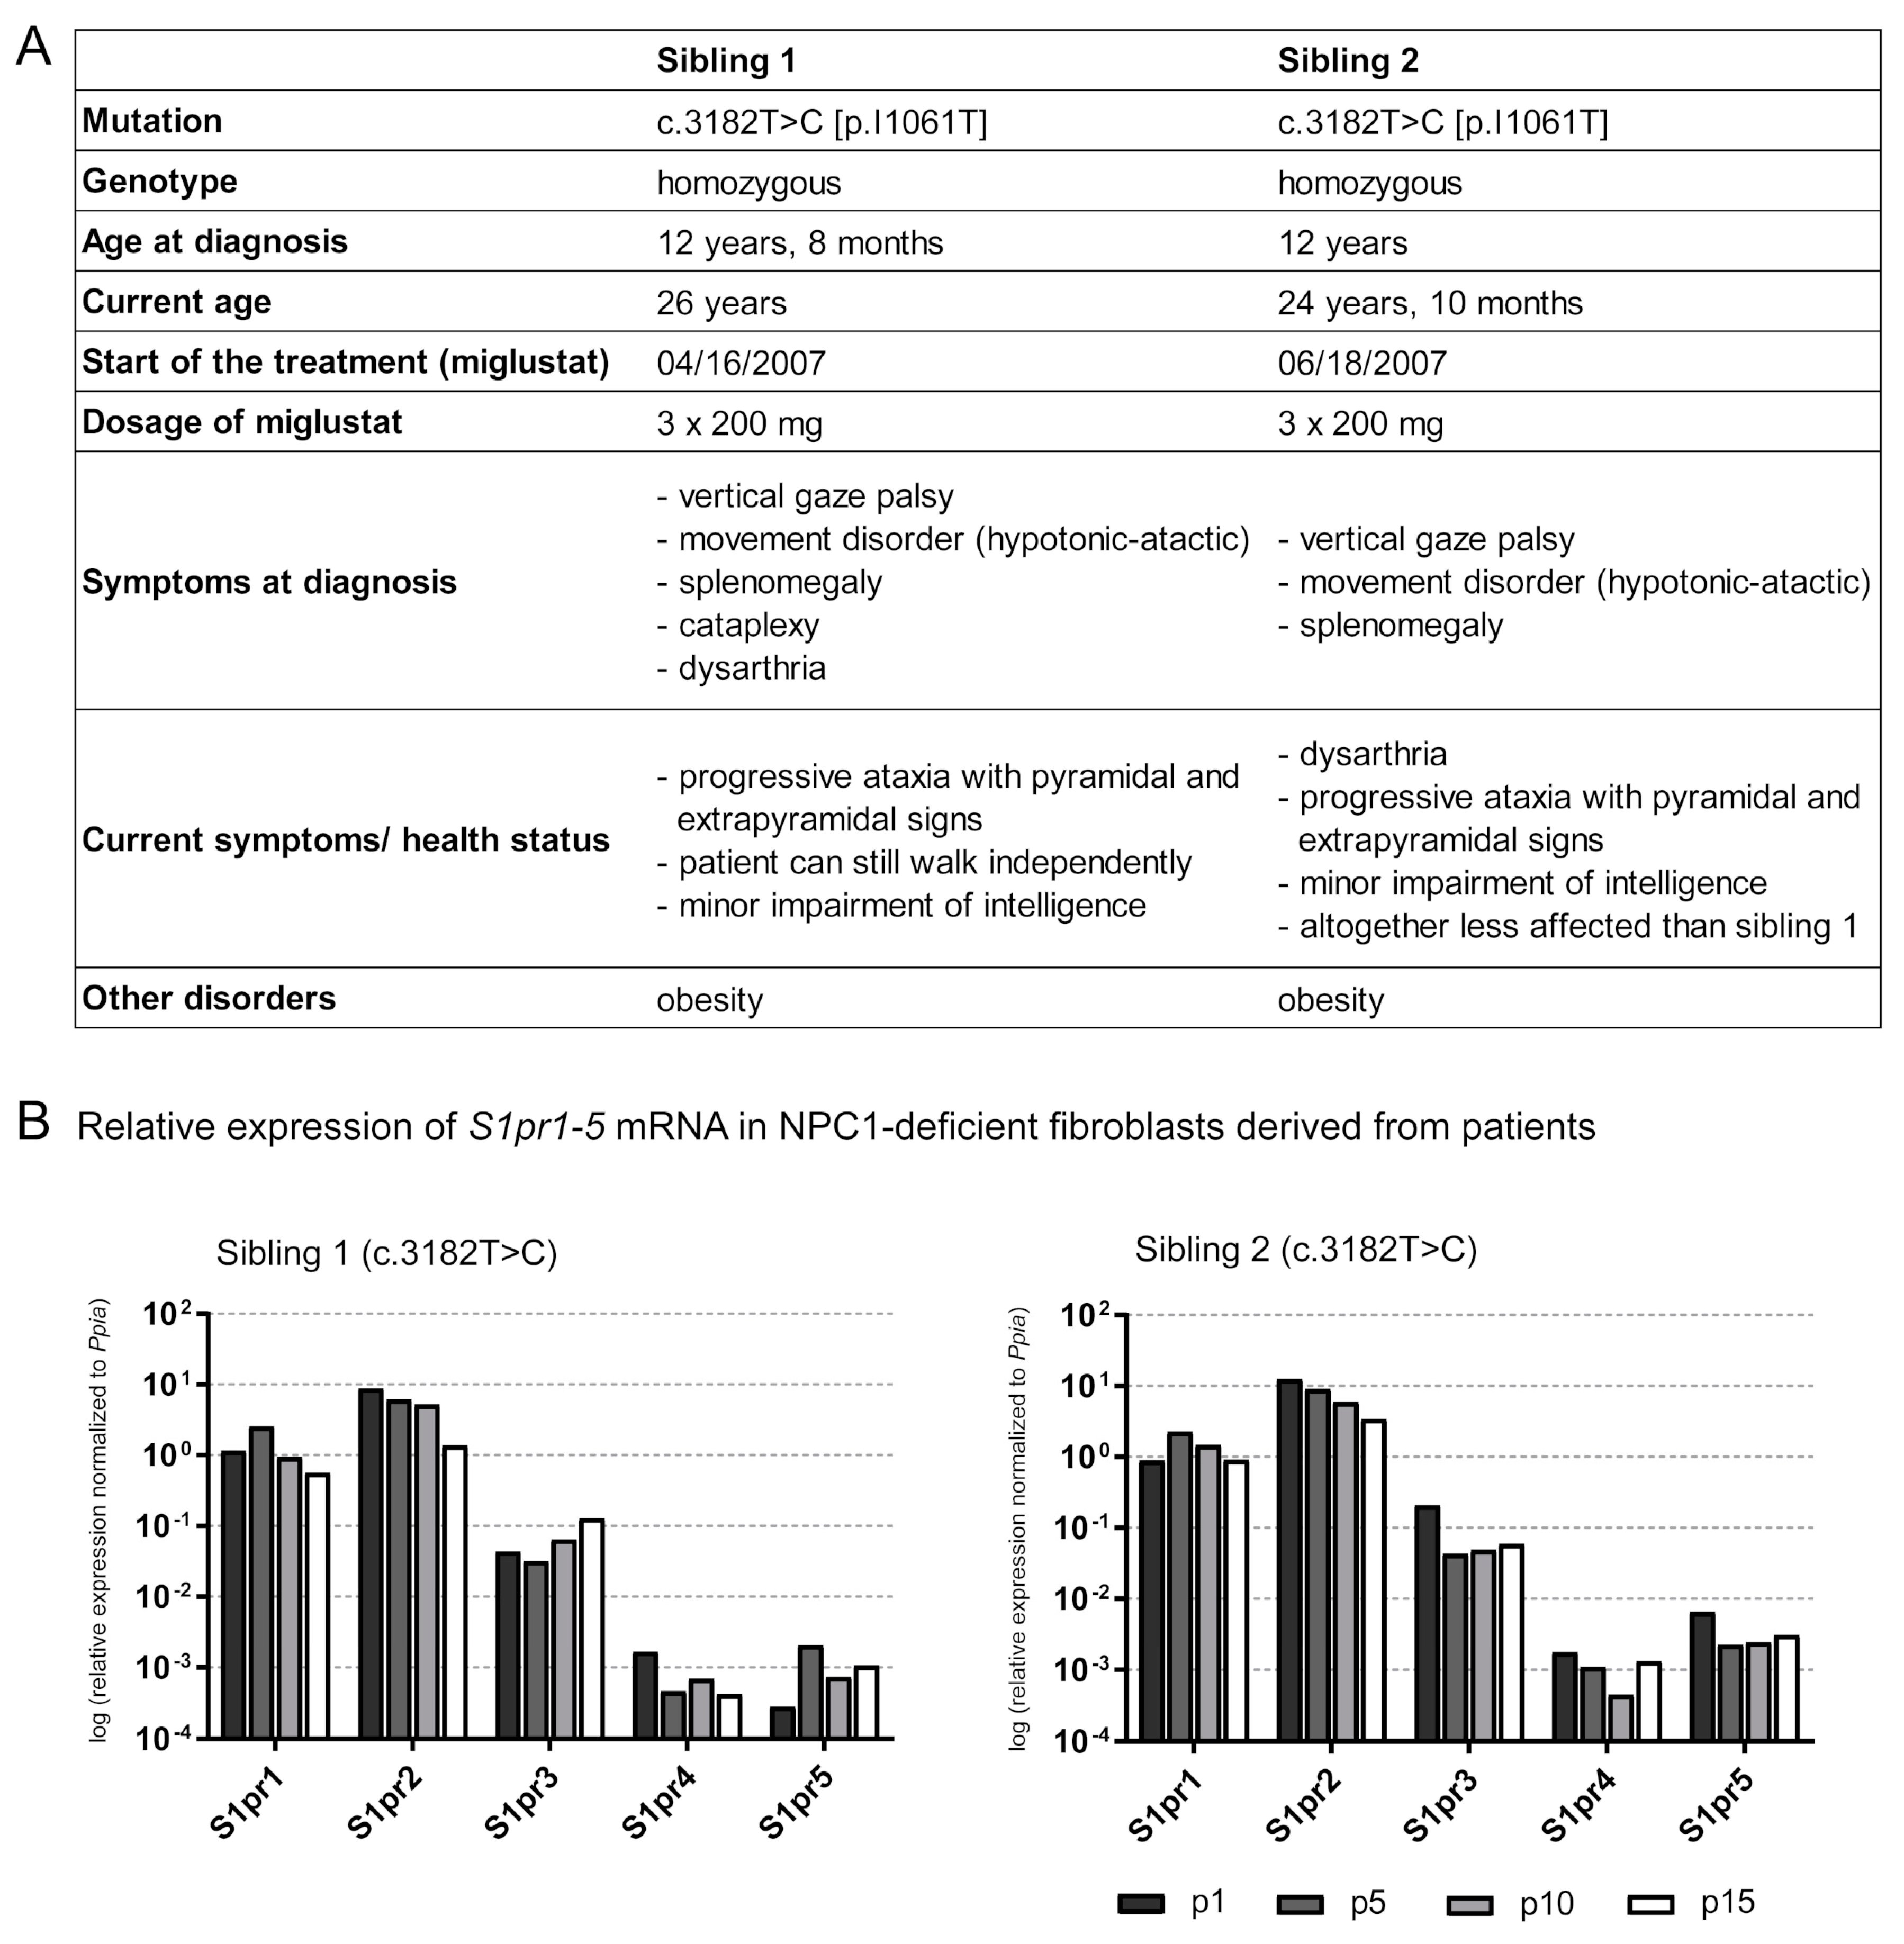
2.7. Is the S1pr1–5 Expression Affected in Human NPC1 Mutant Fibroblasts?
2.8. Altered S1pr5 Expression in Human Cells Derived from Induced Pluripotent Stem Cells (iPSCs)
3. Discussion
3.1. Weak Improvement of the S1P Metabolism in Treated Npc1-/- Mice
3.2. Weak Treatment Effects at the Cellular Level in the White Matter
3.3. Side Effects of the Treatment in Npc1+/+ Mice
4. Materials and Methods
4.1. Animals
4.2. Genotyping
4.3. Pharmacologic Treatment
4.4. Tissue Sampling
4.5. Lipid Extraction
4.6. Separation and Analysis of Lipid Classes by High-Performance Thin-Layer Chromatography (HPTLC)
4.7. Mass Spectrometry
4.8. Preparation of Mouse Primary Cells
4.9. Preparation and Cultivation of NPC1-Deficient Skin Fibroblasts Derived from Patients
4.10. Derivation of Neuronal Cells from Human Induced Pluripotent Stem Cells (iPSCs)
4.11. RNA Extraction and cDNA Synthesis
4.12. Quantitative Real-Time PCR (qRT-PCR)
4.13. Cloning of EGFP-Coupled mS1pr1-5 Constructs
4.14. Cell Culture and Transfection of HEK293H Cells
4.15. Immunocytochemistry
4.16. Lysate Preparation
4.17. Western Blot Analysis
4.18. Filipin Staining
4.19. Immunohistochemical Analysis of the Corpus Callosum Diameter
4.20. Morphometric Analysis of the Diameter of the Corpus Callosum
4.21. Statistical Analysis
5. Conclusions
Supplementary Materials
Author Contributions
Funding
Acknowledgments
Conflicts of Interest
Abbreviations
| Actb | β-Actin |
| AU | Arbitrary units |
| BS | Brain stem |
| CE | Cerebellum |
| Cer | Ceramides |
| CTL | Cytotoxic T lymphocytes |
| DC | Dihydro ceramides |
| FC | Frontal cortex |
| FTY720 | Fingolimod |
| Gapdh | Glyceraldehyde-3-phosphate dehydrogenase |
| HC | Hippocampus |
| HPTLC | High-performance thin-layer chromatography |
| HPβCD | 2-hydroxypropyl-β-cyclodextrin |
| iPSC | Induced pluripotent stem cell |
| LC | Lactosylceramides |
| LPA | Lysophosphatidic acid |
| LPC | Lysophosphatidylcholine |
| MC | Monohexosyl ceramides |
| MDC | Monohexosyl dihydroceramides |
| NDCs | Neuronal differentiated cells |
| NPC1 | Niemann–Pick type C1 |
| NPCs | Neural progenitor cells |
| P | Postnatal |
| p | Passage |
| PC | Parieto-occipital cortex |
| PCR | Polymerase chain reaction |
| Ppia | Peptidylprolyl isomerase A |
| qRT-PCR | Quantitative real-time polymerase chain reaction |
| Rf | Retention factor |
| S1P | Sphingosine-1-phosphate |
| S1pr | Sphingosine-1-phosphate receptor |
| SM | Sphingomyelin |
| Sph | Sphingosine |
References
- Millat, G.; Bailo, N.; Molinero, S.; Rodriguez, C.; Chikh, K.; Vanier, M.T. Niemann-Pick C disease: Use of denaturing high performance liquid chromatography for the detection of NPC1 and NPC2 genetic variations and impact on management of patients and families. Mol. Genet. Metab. 2005, 86, 220–232. [Google Scholar] [CrossRef] [PubMed]
- Vanier, M.T. Niemann-Pick disease type C. Orphanet J. Rare Dis. 2010, 5, 16. [Google Scholar] [CrossRef] [PubMed]
- Scott, C.; Ioannou, Y.A. The NPC1 protein: Structure implies function. Biochim. Biophys. Acta 2004, 1685, 8–13. [Google Scholar] [CrossRef] [PubMed]
- Yu, X.H.; Jiang, N.; Yao, P.B.; Zheng, X.L.; Cayabyab, F.S.; Tang, C.K. NPC1, intracellular cholesterol trafficking and atherosclerosis. Clin. Chim. Acta 2014, 429, 69–75. [Google Scholar] [CrossRef]
- Vanier, M.T. Niemann-Pick C disease: History, current research topics, biological and molecular diagnosis. Arch. Pediatr. 2010, 17 (Suppl. 2), S41–S44. [Google Scholar] [CrossRef]
- Lloyd-Evans, E.; Platt, F.M. Lipids on trial: The search for the offending metabolite in Niemann-Pick type C disease. Traffic 2010, 11, 419–428. [Google Scholar] [CrossRef]
- Carstea, E.D.; Morris, J.A.; Coleman, K.G.; Loftus, S.K.; Zhang, D.; Cummings, C.; Gu, J.; Rosenfeld, M.A.; Pavan, W.J.; Krizman, D.B.; et al. Niemann-Pick C1 disease gene: Homology to mediators of cholesterol homeostasis. Science 1997, 277, 228–231. [Google Scholar] [CrossRef]
- Garver, W.S.; Francis, G.A.; Jelinek, D.; Shepherd, G.; Flynn, J.; Castro, G.; Walsh Vockley, C.; Coppock, D.L.; Pettit, K.M.; Heidenreich, R.A.; et al. The National Niemann-Pick C1 disease database: Report of clinical features and health problems. Am. J. Med. Genet. A 2007, 143a, 1204–1211. [Google Scholar] [CrossRef]
- Spiegel, R.; Raas-Rothschild, A.; Reish, O.; Regev, M.; Meiner, V.; Bargal, R.; Sury, V.; Meir, K.; Nadjari, M.; Hermann, G.; et al. The clinical spectrum of fetal Niemann-Pick type C. Am. J. Med. Genet. A 2009, 149a, 446–450. [Google Scholar] [CrossRef]
- Vanier, M.T.; Millat, G. Niemann-Pick disease type C. Clin. Genet. 2003, 64, 269–281. [Google Scholar] [CrossRef]
- Sarna, J.R.; Larouche, M.; Marzban, H.; Sillitoe, R.V.; Rancourt, D.E.; Hawkes, R. Patterned Purkinje cell degeneration in mouse models of Niemann-Pick type C disease. J. Comp. Neurol. 2003, 456, 279–291. [Google Scholar] [CrossRef] [PubMed]
- Maass, F.; Petersen, J.; Hovakimyan, M.; Schmitt, O.; Witt, M.; Hawlitschka, A.; Lukas, J.; Rolfs, A.; Wree, A. Reduced cerebellar neurodegeneration after combined therapy with cyclodextrin/allopregnanolone and miglustat in NPC1: A mouse model of Niemann-Pick type C1 disease. J. Neurosci. Res. 2015, 93, 433–442. [Google Scholar] [CrossRef] [PubMed]
- Tanaka, J.; Nakamura, H.; Miyawaki, S. Cerebellar involvement in murine sphingomyelinosis: A new model of Niemann-Pick disease. J. Neuropathol. Exp. Neurol. 1988, 47, 291–300. [Google Scholar] [CrossRef] [PubMed]
- Elleder, M.; Jirasek, A.; Smid, F.; Ledvinova, J.; Besley, G.T. Niemann-Pick disease type C. Study on the nature of the cerebral storage process. Acta Neuropathol. 1985, 66, 325–336. [Google Scholar] [CrossRef]
- Patterson, M.C.; Mengel, E.; Wijburg, F.A.; Muller, A.; Schwierin, B.; Drevon, H.; Vanier, M.T.; Pineda, M. Disease and patient characteristics in NP-C patients: Findings from an international disease registry. Orphanet J. Rare Dis. 2013, 8, 12. [Google Scholar] [CrossRef]
- Piroth, T.; Boelmans, K.; Amtage, F.; Rijntjes, M.; Wierciochin, A.; Musacchio, T.; Weiller, C.; Volkmann, J.; Klebe, S. Adult-Onset Niemann-Pick Disease Type C: Rapid Treatment Initiation Advised but Early Diagnosis Remains Difficult. Front. Neurol. 2017, 8, 108. [Google Scholar] [CrossRef]
- Feng, X.; Cozma, C.; Pantoom, S.; Hund, C.; Iwanov, K.; Petters, J.; Volkner, C.; Bauer, C.; Vogel, F.; Bauer, P.; et al. Detrmination of the Pathological Features of NPC1 Variants in a Cellular Complementation Teste. Int. J. Mol. Sci. 2019, 20, 5185. [Google Scholar] [CrossRef]
- Bountouvi, E.; Papadopoulou, A.; Vanier, M.T.; Nyktari, G.; Kanellakis, S.; Michelakakis, H.; Dinopoulos, A. Novel NPC1 mutations with different segregation in two related Greek patients with Niemann-Pick type C disease: Molecular study in the extended pedigree and clinical correlations. BMC Med. Genet. 2017, 18, 51. [Google Scholar] [CrossRef]
- Jahnova, H.; Dvorakova, L.; Vlaskova, H.; Hulkova, H.; Poupetova, H.; Hrebicek, M.; Jesina, P. Observational, retrospective study of a large cohort of patients with Niemann-Pick disease type C in the Czech Republic: A surprisingly stable diagnostic rate spanning almost 40 years. Orphanet J. Rare Dis. 2014, 9, 140. [Google Scholar] [CrossRef]
- Park, W.D.; O'Brien, J.F.; Lundquist, P.A.; Kraft, D.L.; Vockley, C.W.; Karnes, P.S.; Patterson, M.C.; Snow, K. Identification of 58 novel mutations in Niemann-Pick disease type C: Correlation with biochemical phenotype and importance of PTC1-like domains in NPC1. Hum. Mutat. 2003, 22, 313–325. [Google Scholar] [CrossRef]
- Millat, G.; Marcais, C.; Rafi, M.A.; Yamamoto, T.; Morris, J.A.; Pentchev, P.G.; Ohno, K.; Wenger, D.A.; Vanier, M.T. Niemann-Pick C1 disease: The I1061T substitution is a frequent mutant allele in patients of Western European descent and correlates with a classic juvenile phenotype. Am. J. Hum. Genet. 1999, 65, 1321–1329. [Google Scholar] [CrossRef] [PubMed]
- Gelsthorpe, M.E.; Baumann, N.; Millard, E.; Gale, S.E.; Langmade, S.J.; Schaffer, J.E.; Ory, D.S. Niemann-Pick type C1 I1061T mutant encodes a functional protein that is selected for endoplasmic reticulum-associated degradation due to protein misfolding. J. Biol. Chem. 2008, 283, 8229–8236. [Google Scholar] [CrossRef] [PubMed]
- Patterson, M.C.; Vecchio, D.; Prady, H.; Abel, L.; Wraith, J.E. Miglustat for treatment of Niemann-Pick C disease: A randomised controlled study. Lancet Neurol. 2007, 6, 765–772. [Google Scholar] [CrossRef]
- Treiber, A.; Morand, O.; Clozel, M. The pharmacokinetics and tissue distribution of the glucosylceramide synthase inhibitor miglustat in the rat. Xenobiotica 2007, 37, 298–314. [Google Scholar] [CrossRef] [PubMed]
- Pineda, M.; Walterfang, M.; Patterson, M.C. Miglustat in Niemann-Pick disease type C patients: A review. Orphanet J. Rare Dis. 2018, 13, 140. [Google Scholar] [CrossRef]
- Platt, F.M.; Neises, G.R.; Dwek, R.A.; Butters, T.D. N-butyldeoxynojirimycin is a novel inhibitor of glycolipid biosynthesis. J. Biol. Chem. 1994, 269, 8362–8365. [Google Scholar] [PubMed]
- Zervas, M.; Somers, K.L.; Thrall, M.A.; Walkley, S.U. Critical role for glycosphingolipids in Niemann-Pick disease type C. Curr. Biol. 2001, 11, 1283–1287. [Google Scholar] [CrossRef]
- Platt, F.M.; Jeyakumar, M. Substrate reduction therapy. Acta Paediatr. 2008, 97, 88–93. [Google Scholar] [CrossRef]
- Liu, B.; Ramirez, C.M.; Miller, A.M.; Repa, J.J.; Turley, S.D.; Dietschy, J.M. Cyclodextrin overcomes the transport defect in nearly every organ of NPC1 mice leading to excretion of sequestered cholesterol as bile acid. J. Lipid Res. 2010, 51, 933–944. [Google Scholar] [CrossRef]
- Davidson, C.D.; Ali, N.F.; Micsenyi, M.C.; Stephney, G.; Renault, S.; Dobrenis, K.; Ory, D.S.; Vanier, M.T.; Walkley, S.U. Chronic cyclodextrin treatment of murine Niemann-Pick C disease ameliorates neuronal cholesterol and glycosphingolipid storage and disease progression. PLoS ONE 2009, 4, e6951. [Google Scholar] [CrossRef]
- Matsuo, M.; Togawa, M.; Hirabaru, K.; Mochinaga, S.; Narita, A.; Adachi, M.; Egashira, M.; Irie, T.; Ohno, K. Effects of cyclodextrin in two patients with Niemann-Pick Type C disease. Mol. Genet. Metab. 2013, 108, 76–81. [Google Scholar] [CrossRef] [PubMed]
- Ramirez, C.M.; Liu, B.; Taylor, A.M.; Repa, J.J.; Burns, D.K.; Weinberg, A.G.; Turley, S.D.; Dietschy, J.M. Weekly cyclodextrin administration normalizes cholesterol metabolism in nearly every organ of the Niemann-Pick type C1 mouse and markedly prolongs life. Pediatr. Res. 2010, 68, 309–315. [Google Scholar] [CrossRef]
- Crumling, M.A.; Liu, L.; Thomas, P.V.; Benson, J.; Kanicki, A.; Kabara, L.; Halsey, K.; Dolan, D.; Duncan, R.K. Hearing loss and hair cell death in mice given the cholesterol-chelating agent hydroxypropyl-beta-cyclodextrin. PLoS ONE 2012, 7, e53280. [Google Scholar] [CrossRef] [PubMed]
- Bräuer, A.U.; Kuhla, A.; Holzmann, C.; Wree, A.; Witt, M. Current Challenges in Understanding the Cellular and Molecular Mechanisms in Niemann-Pick Disease Type C1. Int. J. Mol. Sci. 2019, 20, 4392. [Google Scholar] [CrossRef] [PubMed]
- Meyer, A.; Gläser, A.; Bräuer, A.U.; Wree, A.; Strotmann, J.; Rolfs, A.; Witt, M. Olfactory Performance as an Indicator for Protective Treatment Effects in an Animal Model of Neurodegeneration. Front. Integr. Neurosci. 2018, 12, 35. [Google Scholar] [CrossRef] [PubMed]
- Ebner, L.; Gläser, A.; Bräuer, A.; Witt, M.; Wree, A.; Rolfs, A.; Frank, M.; Vollmar, B.; Kuhla, A. Evaluation of Two Liver Treatment Strategies in a Mouse Model of Niemann-Pick-Disease Type C1. Int. J. Mol. Sci. 2018, 19, 972. [Google Scholar] [CrossRef]
- Hovakimyan, M.; Maass, F.; Petersen, J.; Holzmann, C.; Witt, M.; Lukas, J.; Frech, M.J.; Hubner, R.; Rolfs, A.; Wree, A. Combined therapy with cyclodextrin/allopregnanolone and miglustat improves motor but not cognitive functions in Niemann-Pick Type C1 mice. Neuroscience 2013, 252, 201–211. [Google Scholar] [CrossRef] [PubMed]
- Higashi, Y.; Murayama, S.; Pentchev, P.G.; Suzuki, K. Cerebellar degeneration in the Niemann-Pick type C mouse. Acta Neuropathol. 1993, 85, 175–184. [Google Scholar] [CrossRef]
- Pentchev, P.G.; Gal, A.E.; Booth, A.D.; Omodeo-Sale, F.; Fouks, J.; Neumeyer, B.A.; Quirk, J.M.; Dawson, G.; Brady, R.O. A lysosomal storage disorder in mice characterized by a dual deficiency of sphingomyelinase and glucocerebrosidase. Biochim. Biophys. Acta 1980, 619, 669–679. [Google Scholar] [CrossRef]
- Neßlauer, A.M.; Gläser, A.; Gräler, M.; Engelmann, R.; Müller-Hilke, B.; Frank, M.; Burstein, C.; Rolfs, A.; Neidhardt, J.; Wree, A.; et al. A therapy with miglustat, 2-hydroxypropyl-β-cyclodextrin and allopregnanolone restores splenic cholesterol homeostasis in Niemann-pick disease type C1. Lipids Health Dis. 2019, 18, 146. [Google Scholar] [CrossRef]
- Meyer, A.; Wree, A.; Gunther, R.; Holzmann, C.; Schmitt, O.; Rolfs, A.; Witt, M. Increased Regenerative Capacity of the Olfactory Epithelium in Niemann-Pick Disease Type C1. Int. J. Mol. Sci. 2017, 18, 777. [Google Scholar] [CrossRef] [PubMed]
- Lloyd-Evans, E.; Morgan, A.J.; He, X.; Smith, D.A.; Elliot-Smith, E.; Sillence, D.J.; Churchill, G.C.; Schuchman, E.H.; Galione, A.; Platt, F.M. Niemann-Pick disease type C1 is a sphingosine storage disease that causes deregulation of lysosomal calcium. Nat. Med. 2008, 14, 1247–1255. [Google Scholar] [CrossRef] [PubMed]
- Speak, A.O.; Te Vruchte, D.; Davis, L.C.; Morgan, A.J.; Smith, D.A.; Yanjanin, N.M.; Simmons, L.; Hartung, R.; Runz, H.; Mengel, E.; et al. Altered distribution and function of natural killer cells in murine and human Niemann-Pick disease type C1. Blood 2014, 123, 51–60. [Google Scholar] [CrossRef] [PubMed]
- Spiegel, S.; Milstien, S. The outs and the ins of sphingosine-1-phosphate in immunity. Nat. Rev. Immunol. 2011, 11, 403–415. [Google Scholar] [CrossRef]
- Kluk, M.J.; Hla, T. Signaling of sphingosine-1-phosphate via the S1P/EDG-family of G-protein-coupled receptors. Biochim. Biophys. Acta 2002, 1582, 72–80. [Google Scholar] [CrossRef]
- Fan, M.; Sidhu, R.; Fujiwara, H.; Tortelli, B.; Zhang, J.; Davidson, C.; Walkley, S.U.; Bagel, J.H.; Vite, C.; Yanjanin, N.M.; et al. Identification of Niemann-Pick C1 disease biomarkers through sphingolipid profiling. J. Lipid Res. 2013, 54, 2800–2814. [Google Scholar] [CrossRef]
- Chen, F.W.; Gordon, R.E.; Ioannou, Y.A. NPC1 late endosomes contain elevated levels of non-esterified (‘free’) fatty acids and an abnormally glycosylated form of the NPC2 protein. Biochem. J. 2005, 390 Pt 2, 549–561. [Google Scholar] [CrossRef]
- Weintraub, H.; Abramovici, A.; Sandbank, U.; Pentchev, P.G.; Brady, R.O.; Sekine, M.; Suzuki, A.; Sela, B. Neurological mutation characterized by dysmyelination in NCTR-Balb/C mouse with lysosomal lipid storage disease. J. Neurochem. 1985, 45, 665–672. [Google Scholar] [CrossRef]
- Palmeri, S.; Battisti, C.; Federico, A.; Guazzi, G.C. Hypoplasia of the corpus callosum in Niemann-Pick type C disease. Neuroradiology 1994, 36, 20–22. [Google Scholar] [CrossRef]
- Dusaban, S.S.; Chun, J.; Rosen, H.; Purcell, N.H.; Brown, J.H. Sphingosine 1-phosphate receptor 3 and RhoA signaling mediate inflammatory gene expression in astrocytes. J. Neuroinflamm. 2017, 14, 111. [Google Scholar] [CrossRef]
- German, D.C.; Liang, C.L.; Song, T.; Yazdani, U.; Xie, C.; Dietschy, J.M. Neurodegeneration in the Niemann-Pick C mouse: Glial involvement. Neuroscience 2002, 109, 437–450. [Google Scholar] [CrossRef]
- Park, M.H.; Lee, J.Y.; Jeong, M.S.; Jang, H.S.; Endo, S.; Bae, J.S.; Jin, H.K. The role of Purkinje cell-derived VEGF in cerebellar astrogliosis in Niemann-Pick type C mice. BMB Rep. 2018, 51, 79–84. [Google Scholar] [CrossRef] [PubMed]
- Jaillard, C.; Harrison, S.; Stankoff, B.; Aigrot, M.S.; Calver, A.R.; Duddy, G.; Walsh, F.S.; Pangalos, M.N.; Arimura, N.; Kaibuchi, K.; et al. Edg8/S1P5: An oligodendroglial receptor with dual function on process retraction and cell survival. J. Neurosci. 2005, 25, 1459–1469. [Google Scholar] [CrossRef] [PubMed]
- Novgorodov, A.S.; El-Alwani, M.; Bielawski, J.; Obeid, L.M.; Gudz, T.I. Activation of sphingosine-1-phosphate receptor S1P5 inhibits oligodendrocyte progenitor migration. Faseb J. 2007, 21, 1503–1514. [Google Scholar] [CrossRef] [PubMed]
- Cumings, J.N.; Goodwin, H. Sphingolopids and phospholipids of myelin in multiple sclerosis. Lancet 1968, 2, 664–665. [Google Scholar] [CrossRef]
- Halmer, R.; Walter, S.; Fassbender, K. Sphingolipids: Important players in multiple sclerosis. Cell. Physiol. Biochem. 2014, 34, 111–118. [Google Scholar] [CrossRef]
- Olsen, A.S.B.; Faergeman, N.J. Sphingolipids: Membrane microdomains in brain development, function and neurological diseases. Open Biol. 2017, 7, 170069. [Google Scholar] [CrossRef]
- Karunakaran, I.; van Echten-Deckert, G. Sphingosine 1-phosphate—A double edged sword in the brain. Biochim. Biophys. Acta Biomembr. 2017, 1859 Pt B, 1573–1582. [Google Scholar] [CrossRef]
- Newton, J.; Palladino, E.N.D.; Weigel, C.; Maceyka, M.; Gräler, M.H.; Senkal, C.E.; Enriz, R.D.; Marvanova, P.; Jampilek, J.; Lima, S.; et al. Targeting defective sphingosine kinase 1 in Niemann-Pick type C disease with an activator mitigates cholesterol accumulation. J. Biol. Chem. 2020. [Google Scholar] [CrossRef]
- Martin, R.; Sospedra, M. Sphingosine-1 phosphate and central nervous system. Curr. Top. Microbiol. Immunol. 2014, 378, 149–170. [Google Scholar]
- Fischer, I.; Alliod, C.; Martinier, N.; Newcombe, J.; Brana, C.; Pouly, S. Sphingosine kinase 1 and sphingosine 1-phosphate receptor 3 are functionally upregulated on astrocytes under pro-inflammatory conditions. PLoS ONE 2011, 6, e23905. [Google Scholar] [CrossRef]
- Foster, C.A.; Mechtcheriakova, D.; Storch, M.K.; Balatoni, B.; Howard, L.M.; Bornancin, F.; Wlachos, A.; Sobanov, J.; Kinnunen, A.; Baumruker, T. FTY720 rescue therapy in the dark agouti rat model of experimental autoimmune encephalomyelitis: Expression of central nervous system genes and reversal of blood-brain-barrier damage. Brain Pathol. 2009, 19, 254–266. [Google Scholar] [CrossRef] [PubMed]
- Edsall, L.C.; Spiegel, S. Enzymatic measurement of sphingosine 1-phosphate. Anal. Biochem. 1999, 272, 80–86. [Google Scholar] [CrossRef] [PubMed]
- Wu, Y.P.; Mizugishi, K.; Bektas, M.; Sandhoff, R.; Proia, R.L. Sphingosine kinase 1/S1P receptor signaling axis controls glial proliferation in mice with Sandhoff disease. Hum. Mol. Genet. 2008, 17, 2257–2264. [Google Scholar] [CrossRef] [PubMed]
- Ory, D.S.; Ottinger, E.A.; Farhat, N.Y.; King, K.A.; Jiang, X.; Weissfeld, L.; Berry-Kravis, E.; Davidson, C.D.; Bianconi, S.; Keener, L.A.; et al. Intrathecal 2-hydroxypropyl-beta-cyclodextrin decreases neurological disease progression in Niemann-Pick disease, type C1: A non-randomised, open-label, phase 1-2 trial. Lancet 2017, 390, 1758–1768. [Google Scholar] [CrossRef]
- Wraith, J.E.; Vecchio, D.; Jacklin, E.; Abel, L.; Chadha-Boreham, H.; Luzy, C.; Giorgino, R.; Patterson, M.C. Miglustat in adult and juvenile patients with Niemann-Pick disease type C: Long-term data from a clinical trial. Mol. Genet. Metab. 2010, 99, 351–357. [Google Scholar] [CrossRef] [PubMed]
- Hait, N.C.; Allegood, J.; Maceyka, M.; Strub, G.M.; Harikumar, K.B.; Singh, S.K.; Luo, C.; Marmorstein, R.; Kordula, T.; Milstien, S.; et al. Regulation of histone acetylation in the nucleus by sphingosine-1-phosphate. Science 2009, 325, 1254–1257. [Google Scholar] [CrossRef] [PubMed]
- Hait, N.C.; Wise, L.E.; Allegood, J.C.; O'Brien, M.; Avni, D.; Reeves, T.M.; Knapp, P.E.; Lu, J.; Luo, C.; Miles, M.F.; et al. Active, phosphorylated fingolimod inhibits histone deacetylases and facilitates fear extinction memory. Nat. Neurosci. 2014, 17, 971–980. [Google Scholar] [CrossRef]
- Newton, J.; Hait, N.C.; Maceyka, M.; Colaco, A.; Maczis, M.; Wassif, C.A.; Cougnoux, A.; Porter, F.D.; Milstien, S.; Platt, N.; et al. FTY720/fingolimod increases NPC1 and NPC2 expression and reduces cholesterol and sphingolipid accumulation in Niemann-Pick type C mutant fibroblasts. Faseb J. 2017, 31, 1719–1730. [Google Scholar] [CrossRef]
- Bligh, E.G.; Dyer, W.J. A rapid method of total lipid extraction and purification. Can. J. Biochem. Physiol. 1959, 37, 911–917. [Google Scholar] [CrossRef]
- Moldoveanu, S.C. Solutions and challenges in sample preparation for chromatography. J. Chromatogr. Sci. 2004, 42, 1–14. [Google Scholar] [CrossRef] [PubMed]
- Fewster, M.E.; Burns, B.J.; Mead, J.F. Quantitative densitometric thin-layer chromatography of lipids using copper acetate reagent. J. Chromatogr. 1969, 43, 120–126. [Google Scholar] [CrossRef]
- Churchward, M.A.; Brandman, D.M.; Rogasevskaia, T.; Coorssen, J.R. Copper (II) sulfate charring for high sensitivity on-plate fluorescent detection of lipids and sterols: Quantitative analyses of the composition of functional secretory vesicles. J. Chem. Biol. 2008, 1, 79–87. [Google Scholar] [CrossRef] [PubMed]
- Bode, C.; Gräler, M.H. Quantification of sphingosine-1-phosphate and related sphingolipids by liquid chromatography coupled to tandem mass spectrometry. Methods Mol. Biol. 2012, 874, 33–44. [Google Scholar] [PubMed]
- Klar, M.; Fenske, P.; Vega, F.R.; Dame, C.; Bräuer, A.U. Transcription factor Yin-Yang 2 alters neuronal outgrowth in vitro. Cell Tissue Res. 2015, 362, 453–460. [Google Scholar] [CrossRef] [PubMed]
- Brewer, G.J.; Torricelli, J.R.; Evege, E.K.; Price, P.J. Optimized survival of hippocampal neurons in B27-supplemented Neurobasal, a new serum-free medium combination. J. Neurosci. Res. 1993, 35, 567–576. [Google Scholar] [CrossRef]
- Chen, Y.; Balasubramaniyan, V.; Peng, J.; Hurlock, E.C.; Tallquist, M.; Li, J.; Lu, Q.R. Isolation and culture of rat and mouse oligodendrocyte precursor cells. Nat. Protoc. 2007, 2, 1044–1051. [Google Scholar] [CrossRef]
- Suckau, O.; Gross, I.; Schrotter, S.; Yang, F.; Luo, J.; Wree, A.; Chun, J.; Baska, D.; Baumgart, J.; Kano, K.; et al. LPA1, LPA2, LPA4, and LPA6 receptor expression during mouse brain development. Dev. Dyn. 2019, 248, 375–395. [Google Scholar] [CrossRef]
- Yamamoto, T.; Nanba, E.; Ninomiya, H.; Higaki, K.; Taniguchi, M.; Zhang, H.; Akaboshi, S.; Watanabe, Y.; Takeshima, T.; Inui, K.; et al. NPC1 gene mutations in Japanese patients with Niemann-Pick disease type C. Hum. Genet. 1999, 105, 10–16. [Google Scholar]
- Villegas, J.; McPhaul, M. Establishment and culture of human skin fibroblasts. Curr. Protoc. Mol. Biol. 2005, 71, 28–33. [Google Scholar] [CrossRef]
- Glaus, E.; Schmid, F.; Da Costa, R.; Berger, W.; Neidhardt, J. Gene therapeutic approach using mutation-adapted U1 snRNA to correct a RPGR splice defect in patient-derived cells. Mol. Ther. 2011, 19, 936–941. [Google Scholar] [CrossRef] [PubMed]
- Peter, F.; Trilck, M.; Rabenstein, M.; Rolfs, A.; Frech, M.J. Dataset in support of the generation of Niemann-Pick disease Type C1 patient-specific iPS cell lines carrying the novel NPC1 mutation c.1180T>C or the prevalent c.3182T>C mutation—Analysis of pluripotency and neuronal differentiation. Data Brief. 2017, 12, 123–131. [Google Scholar] [CrossRef] [PubMed]
- Trilck, M.; Hubner, R.; Seibler, P.; Klein, C.; Rolfs, A.; Frech, M.J. Niemann-Pick type C1 patient-specific induced pluripotent stem cells display disease specific hallmarks. Orphanet J. Rare Dis. 2013, 8, 144. [Google Scholar] [CrossRef] [PubMed]
- Kennedy, B.E.; LeBlanc, V.G.; Mailman, T.M.; Fice, D.; Burton, I.; Karakach, T.K.; Karten, B. Pre-symptomatic activation of antioxidant responses and alterations in glucose and pyruvate metabolism in Niemann-Pick Type C1-deficient murine brain. PLoS ONE 2013, 8, e82685. [Google Scholar] [CrossRef]
- Maulik, M.; Thinakaran, G.; Kar, S. Alterations in gene expression in mutant amyloid precursor protein transgenic mice lacking Niemann-Pick type C1 protein. PLoS ONE 2013, 8, e54605. [Google Scholar] [CrossRef]
- Zampieri, S.; Bembi, B.; Rosso, N.; Filocamo, M.; Dardis, A. Treatment of Human Fibroblasts Carrying NPC1 Missense Mutations with MG132 Leads to an Improvement of Intracellular Cholesterol Trafficking. JIMD Rep. 2012, 2, 59–69. [Google Scholar]
- Livak, K.J.; Schmittgen, T.D. Analysis of relative gene expression data using real-time quantitative PCR and the 2(-Delta Delta C(T)) Method. Methods 2001, 25, 402–408. [Google Scholar] [CrossRef]
- Velmans, T.; Battefeld, A.; Geist, B.; Farres, A.S.; Strauss, U.; Bräuer, A.U. Plasticity-related gene 3 promotes neurite shaft protrusion. BMC Neurosci. 2013, 14, 36. [Google Scholar] [CrossRef]
- Vierk, R.; Glassmeier, G.; Zhou, L.; Brandt, N.; Fester, L.; Dudzinski, D.; Wilkars, W.; Bender, R.A.; Lewerenz, M.; Gloger, S.; et al. Aromatase inhibition abolishes LTP generation in female but not in male mice. J. Neurosci. 2012, 32, 8116–8126. [Google Scholar] [CrossRef]


© 2020 by the authors. Licensee MDPI, Basel, Switzerland. This article is an open access article distributed under the terms and conditions of the Creative Commons Attribution (CC BY) license (http://creativecommons.org/licenses/by/4.0/).
Share and Cite
Gläser, A.; Hammerl, F.; Gräler, M.H.; Coldewey, S.M.; Völkner, C.; Frech, M.J.; Yang, F.; Luo, J.; Tönnies, E.; von Bohlen und Halbach, O.; et al. Identification of Brain-Specific Treatment Effects in NPC1 Disease by Focusing on Cellular and Molecular Changes of Sphingosine-1-Phosphate Metabolism. Int. J. Mol. Sci. 2020, 21, 4502. https://doi.org/10.3390/ijms21124502
Gläser A, Hammerl F, Gräler MH, Coldewey SM, Völkner C, Frech MJ, Yang F, Luo J, Tönnies E, von Bohlen und Halbach O, et al. Identification of Brain-Specific Treatment Effects in NPC1 Disease by Focusing on Cellular and Molecular Changes of Sphingosine-1-Phosphate Metabolism. International Journal of Molecular Sciences. 2020; 21(12):4502. https://doi.org/10.3390/ijms21124502
Chicago/Turabian StyleGläser, Anne, Franziska Hammerl, Markus H. Gräler, Sina M. Coldewey, Christin Völkner, Moritz J. Frech, Fan Yang, Jiankai Luo, Eric Tönnies, Oliver von Bohlen und Halbach, and et al. 2020. "Identification of Brain-Specific Treatment Effects in NPC1 Disease by Focusing on Cellular and Molecular Changes of Sphingosine-1-Phosphate Metabolism" International Journal of Molecular Sciences 21, no. 12: 4502. https://doi.org/10.3390/ijms21124502
APA StyleGläser, A., Hammerl, F., Gräler, M. H., Coldewey, S. M., Völkner, C., Frech, M. J., Yang, F., Luo, J., Tönnies, E., von Bohlen und Halbach, O., Brandt, N., Heimes, D., Neßlauer, A.-M., Korenke, G. C., Owczarek-Lipska, M., Neidhardt, J., Rolfs, A., Wree, A., Witt, M., & Bräuer, A. U. (2020). Identification of Brain-Specific Treatment Effects in NPC1 Disease by Focusing on Cellular and Molecular Changes of Sphingosine-1-Phosphate Metabolism. International Journal of Molecular Sciences, 21(12), 4502. https://doi.org/10.3390/ijms21124502