Article

Proteome Analysis Reveals Syndecan 1 Regulates Porcine Sapelovirus Replication

1
Shanghai Key Laboratory of Veterinary Biotechnology, School of Agriculture and Biology, Shanghai Jiao Tong University, Shanghai 200240, China
2
Shanghai Pudong New Area Center for Animal Disease Control and Prevention, Shanghai 200136, China
3
Shanghai Animal Disease Control Center, Shanghai 201103, China
*
Author to whom correspondence should be addressed.
Int. J. Mol. Sci. 2020, 21(12), 4386; https://doi.org/10.3390/ijms21124386
Submission received: 27 March 2020 / Revised: 3 June 2020 / Accepted: 11 June 2020 / Published: 19 June 2020
(This article belongs to the Section Molecular Biology)

Abstract

:
Porcine sapelovirus A (PSV) is a single stranded, positive-sense, non-enveloped RNA virus that causes enteritis, pneumonia, polioencephalomyelitis, and reproductive disorders in pigs. Research on PSV infection and interaction with host cells is unclear. In this study, we applied tandem mass tag proteomics analysis to investigate the differentially expressed proteins (DEPs) in PSV-infected pig kidney (PK)-15 cells and explored the interactions between PSV and host cells. Here we mapped 181 DEPs, including 59 up-regulated and 122 down-regulated DEPs. Among them, osteopontin (SPP1), induced protein with tetratricopeptide repeats 5 (IFIT5), ISG15 ubiquitin-like modifier (ISG15), vinculin (VCL), and syndecan-1 (SDC1) were verified significantly changed using RT-qPCR. Additionally, overexpression of SDC1 promoted PSV viral protein (VP)1 synthesis and virus titer, and silencing of SDC1 revealed the opposite results. Our findings show that SDC1 is a novel host protein and plays crucial roles in regulating PSV replication.

1. Introduction

Porcine sapelovirus A (PSV), a member of the genus sapelovirus in the family Picornaviridae, is a single-stranded, positive-sense, non-enveloped RNA virus with a full-length genome of 7.5–8.3 nucleotide (nt) that contains a 3′ poly (A) tail with a variable length from 65 to 100 nt. Four structural proteins (viral protein (VP)1, VP2, VP3, and VP4) constitute the virus capsid which mediates the initiation of infection by binding to a receptor on the host membrane, and seven non-structural proteins (2B–2D, 3A–3D) participate in virus replication [1]. Diseases caused by PSV are characterized mainly by acute diarrhea, polioencephalomyelitis, reproductive disorders, and even fatality in pigs [2,3,4]. The virus can be amplified and secreted in pig kidney (PK)-15 cells, IBRS-2 and LLC-PK [4,5] and human hepatocarcinoma cells PLC/PRF/5 and HepG2/C3a [6]. A previous study reported that PSV can use α-2,3-linked sialic acid on GD1a ganglioside as a receptor entry into LLC-PK1 cells [5] and PSV enters its host cells via caveolae-dependent endocytosis independent of clathrin-coated vesicle [7]. However, research on PSV is mainly focused on epidemiological investigations and the mechanism of PSV replication and pathogenesis has not been fully understood.
Gaining more information about PSV biology to find potential targets in its replicative cycle might provide help in the development of appropriate strategies to control PSV infection. Therefore, identification of host proteins, which viruses use during their replicative cycle, is essential. Recently, many researchers have successfully utilized proteomic to identify host proteins and explore the complex host cellular responses to viral infection [8,9]. Additionally, investigation of the changed genes or proteins using the proteomics upon virus infection host cells has become an effective instrument for several viral pathogens, including duck hepatitis A virus type 1 [10], Bombyx mori nucleopolyhedrovirus [11], caprine parainfluenza virus type 3 [12], influenza virus [13], and Dengue virus [14]. Mass spectrometry (MS)/MS-based method, isotopomer label, and tandem mass tag (TMT) have been widely used for detecting the interaction between hosts’ protein and virus infection [15]. However, proteomic analysis of PSV-infected cells has never been reported and host proteins involved in PSV replication are largely unknown.
In this study, to monitor the cellular proteins differentially expressed after PSV infection and identify host proteins associated with virus replication, we profiled host proteome changes in PSV-infected PK-15 cells using TMT-coupled MS analysis. As a result, a total of 181 proteins were differentially expressed after PSV infection. Quantitative PCR (RT-qPCR) and parallel reaction monitoring (PRM) were applied to verify proteomic analysis. We found that syndecan-1 (SDC1) is involved in PSV replication. Our studies may provide an opportunity to reveal the relationships of pathogenesis and the interactions between PSV and PK-15 cells.

2. Results

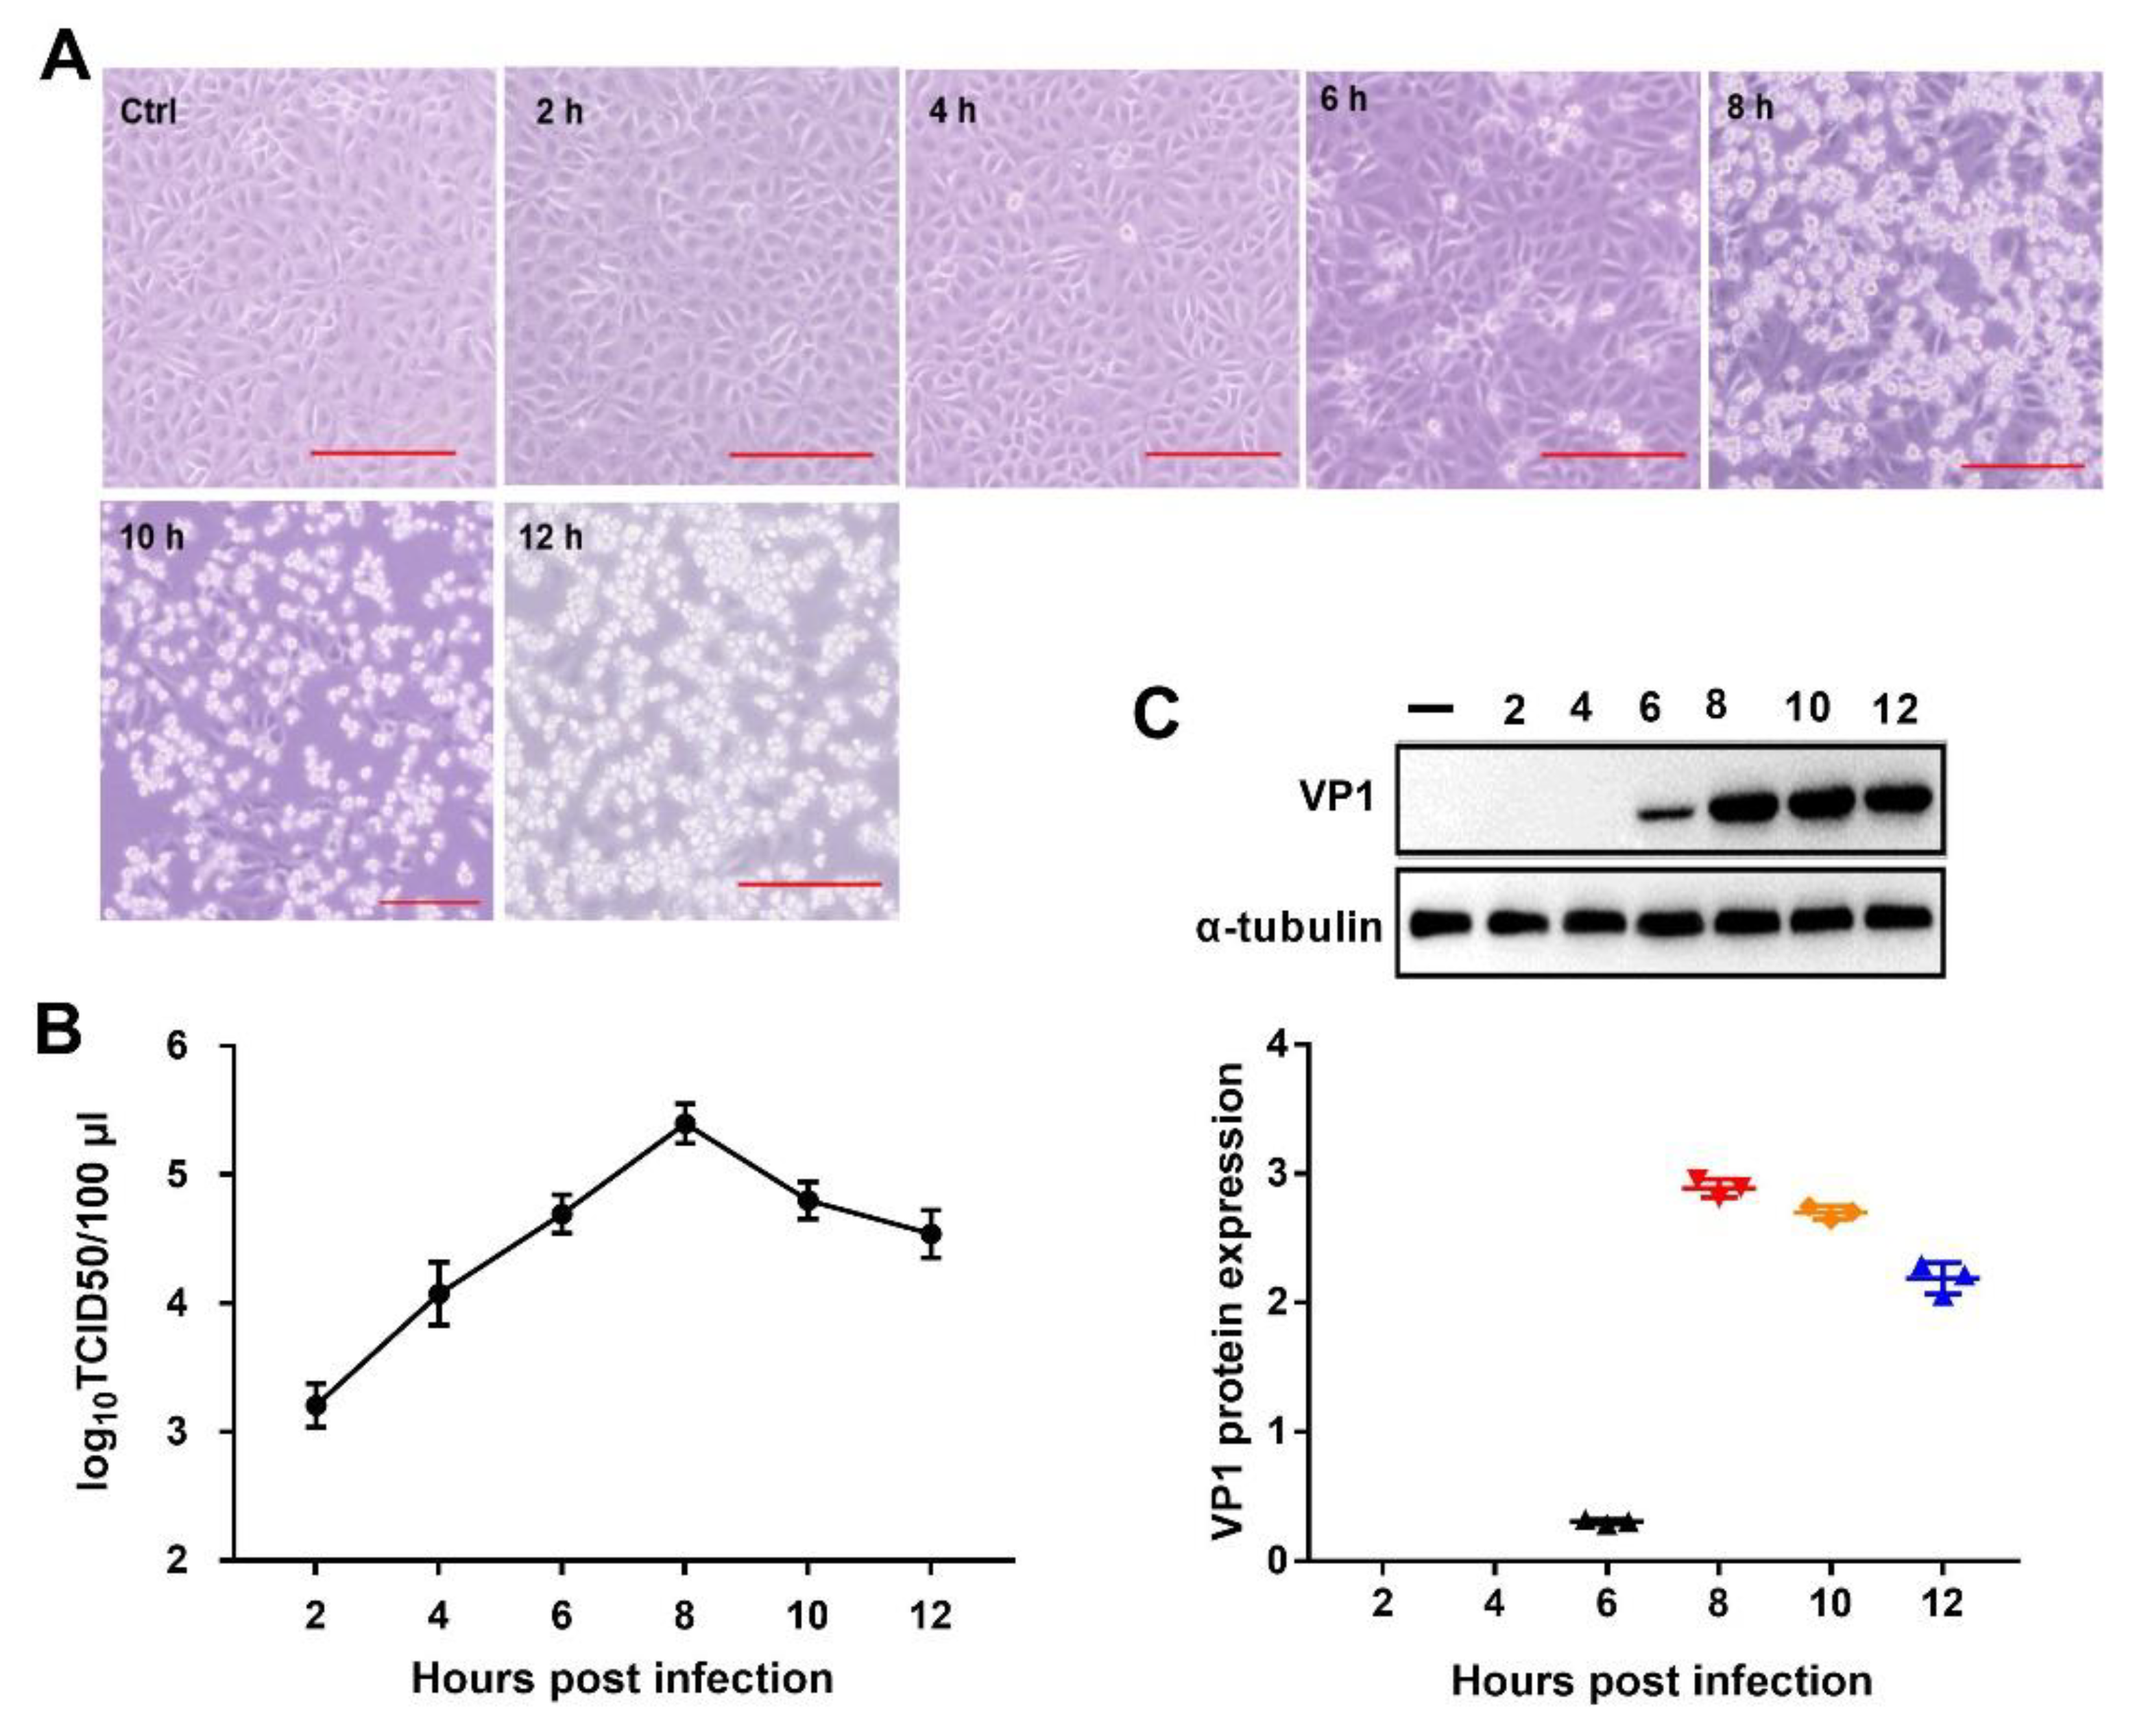
2.1. PSV Infection in PK-15 Cells

To determine the better time for PSV infection in PK-15 cells, cytopathogenic effects (CPEs) and viral titers were monitored at different time points after virus infection. CPEs became visible at 6 hours post infection (hpi). At 8 hpi, an obvious CPE was observed and over 50% of cells fell off at 10 hpi (Figure 1A). The one-step growth curve showed that the viral titer reached 4.59 × log10 50% tissue culture infective doses (TCID50)/100 μL at 6 hpi, peaked at 5.289 × log10TCID50/100 μL at 8 hpi, and then declined (Figure 1B). Additional data obtained from Western blot analysis revealed that the virus protein (VP)1 expression level was high at 8 hpi (Figure 1C). Therefore, to better understand protein change of PSV-infected PK-15 cells, we chose 8 hpi as the time points for further proteomic analysis.

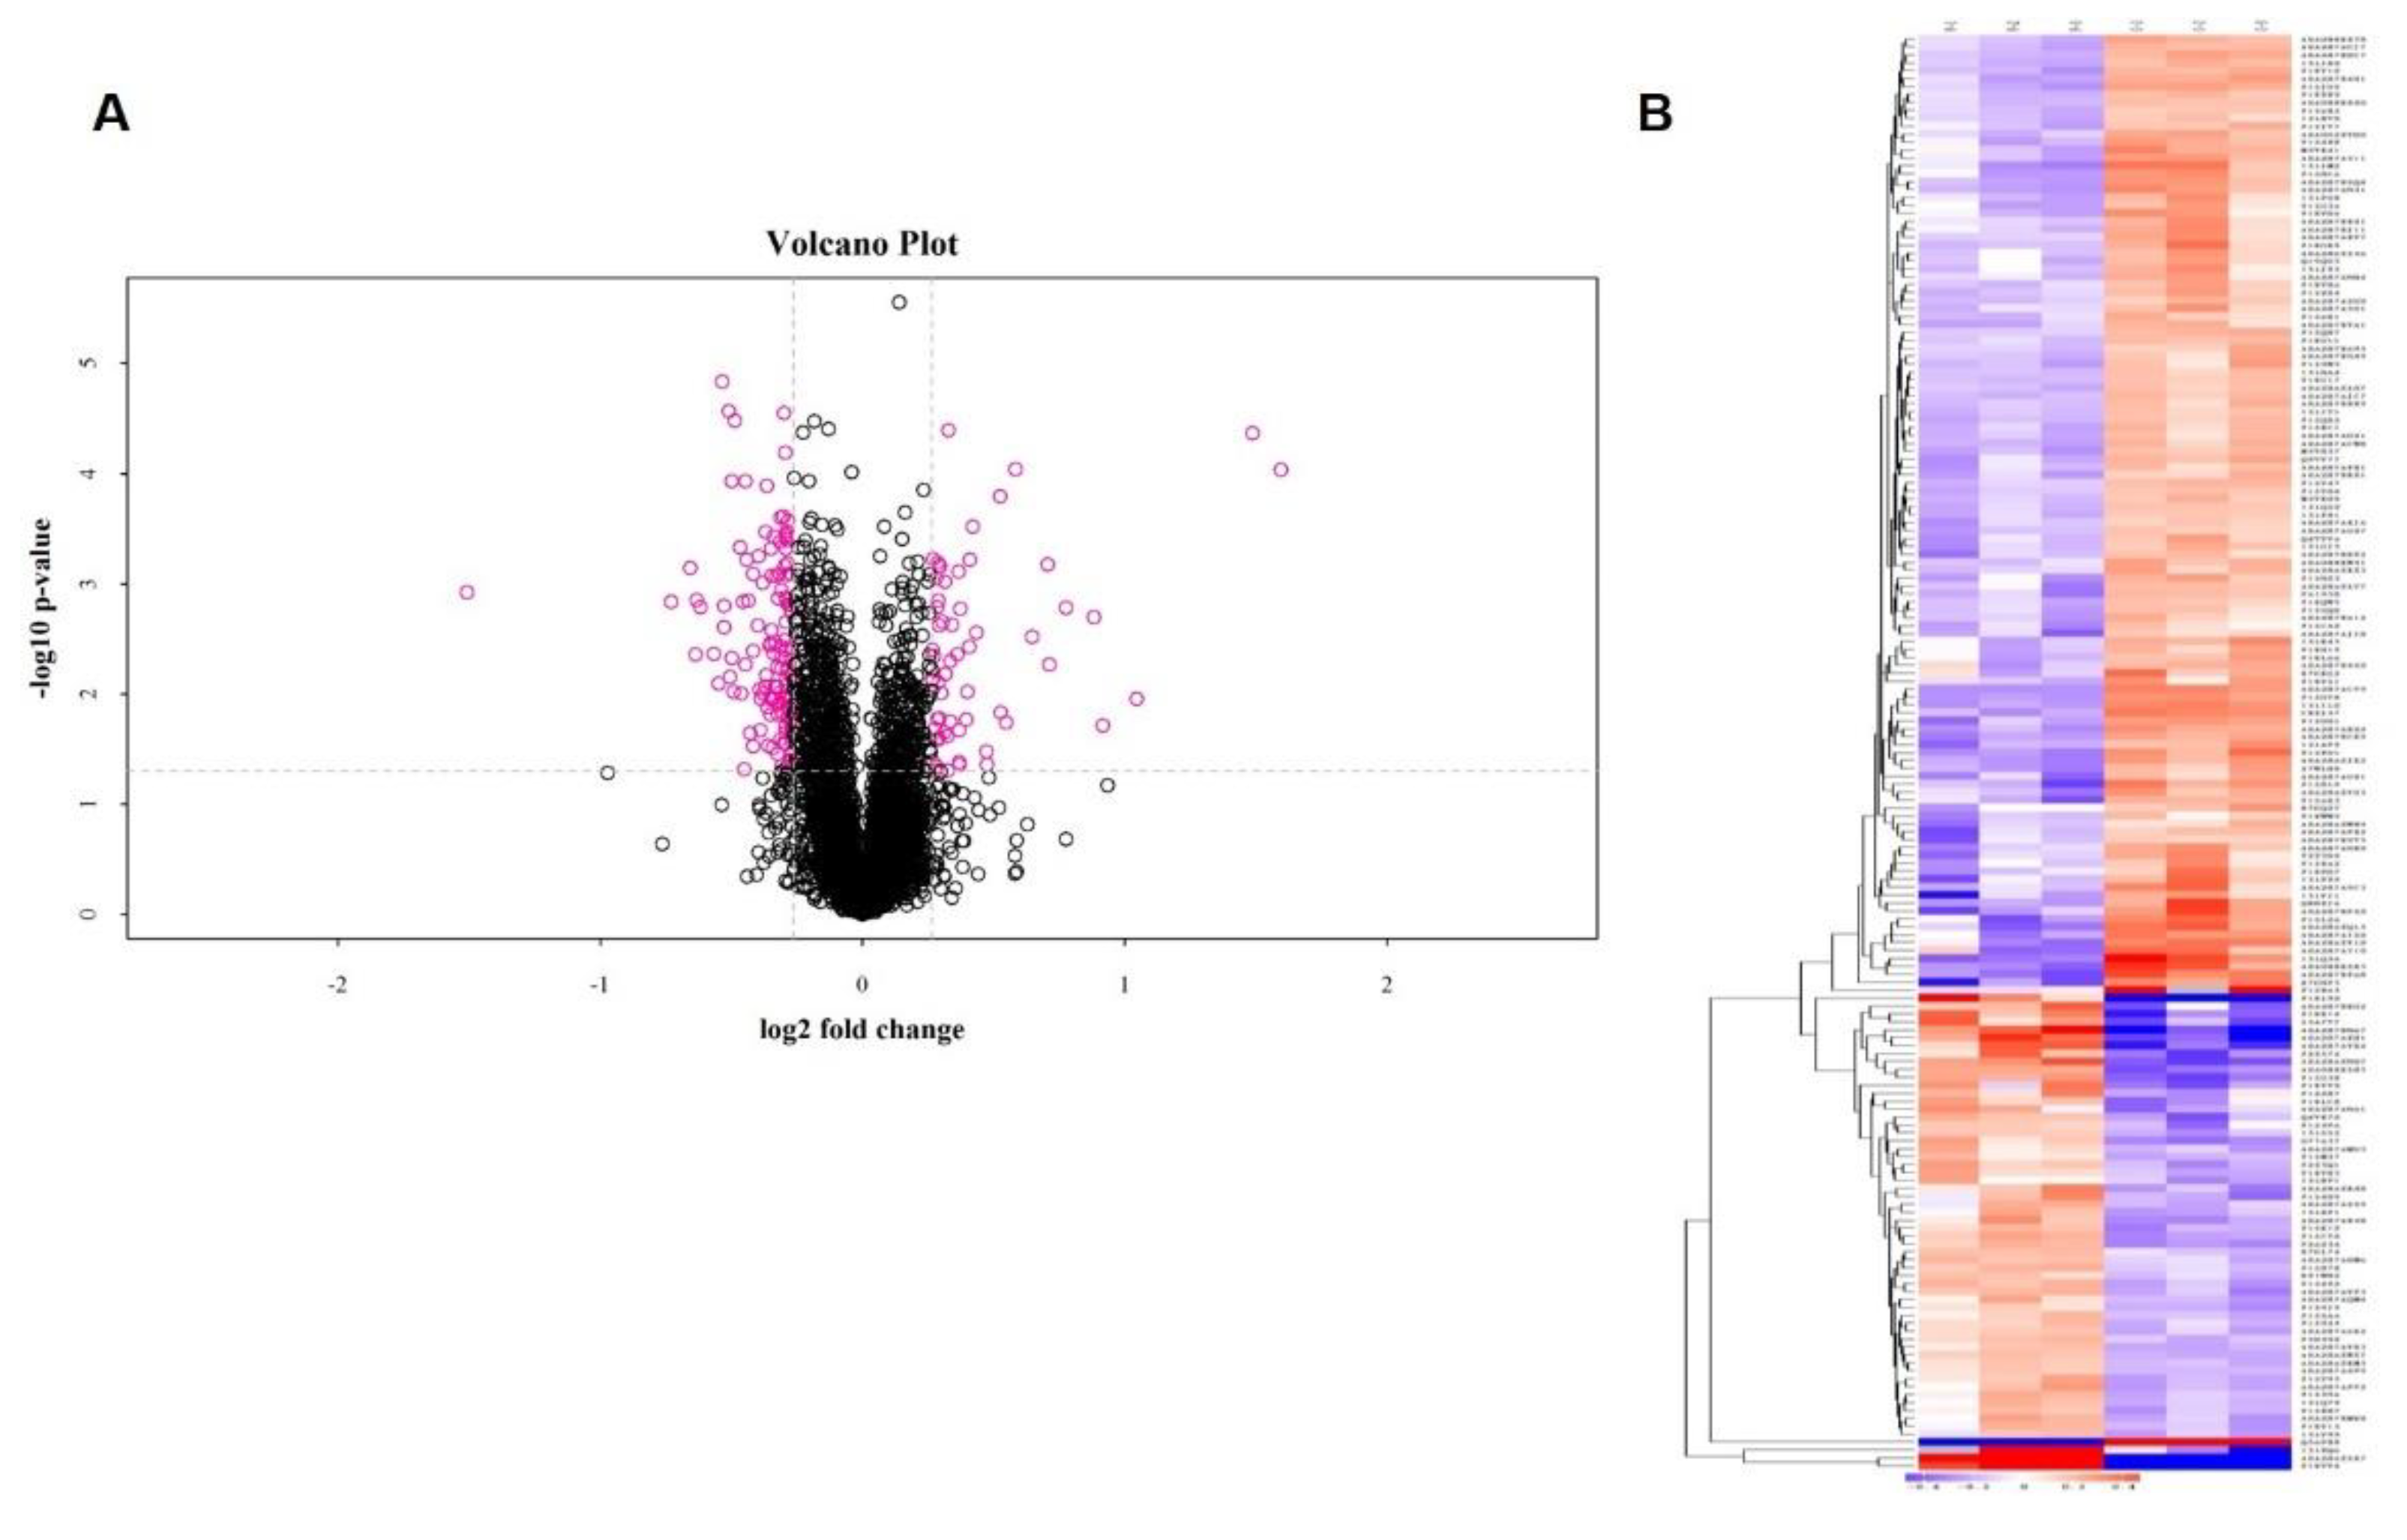
2.2. Identification of Differentially Expressed Proteins (DEPs)

Protein extracts from mock-infected and PSV-infected samples were subjected to TMT-coupled LC–MS/MS analysis and a total of 5690 proteins were identified (Supplementary Table S1). Additionally, we obtained 122,204 spectra and 45,938 identified peptides (38,917 unique peptides) (Table S2). Based on the following criteria, fold-change ratios ≥ 1.2 or ≤0.833 and a p < 0.05, we found 181 DEPs including 59 up-regulated and 122 down-regulated DEPs (Figure 2A, Table S3). Among them, the top 20 DEPs are shown in Table 1. Additionally, a heatmap based on the UniProt database was constructed with red representing up-regulated DEPs and green indicating down-regulated DEPs (Figure 2B). The hierarchical clustering classified the DEPs into two categories with opposite directional variation, suggesting the screening rationality of DEPs.

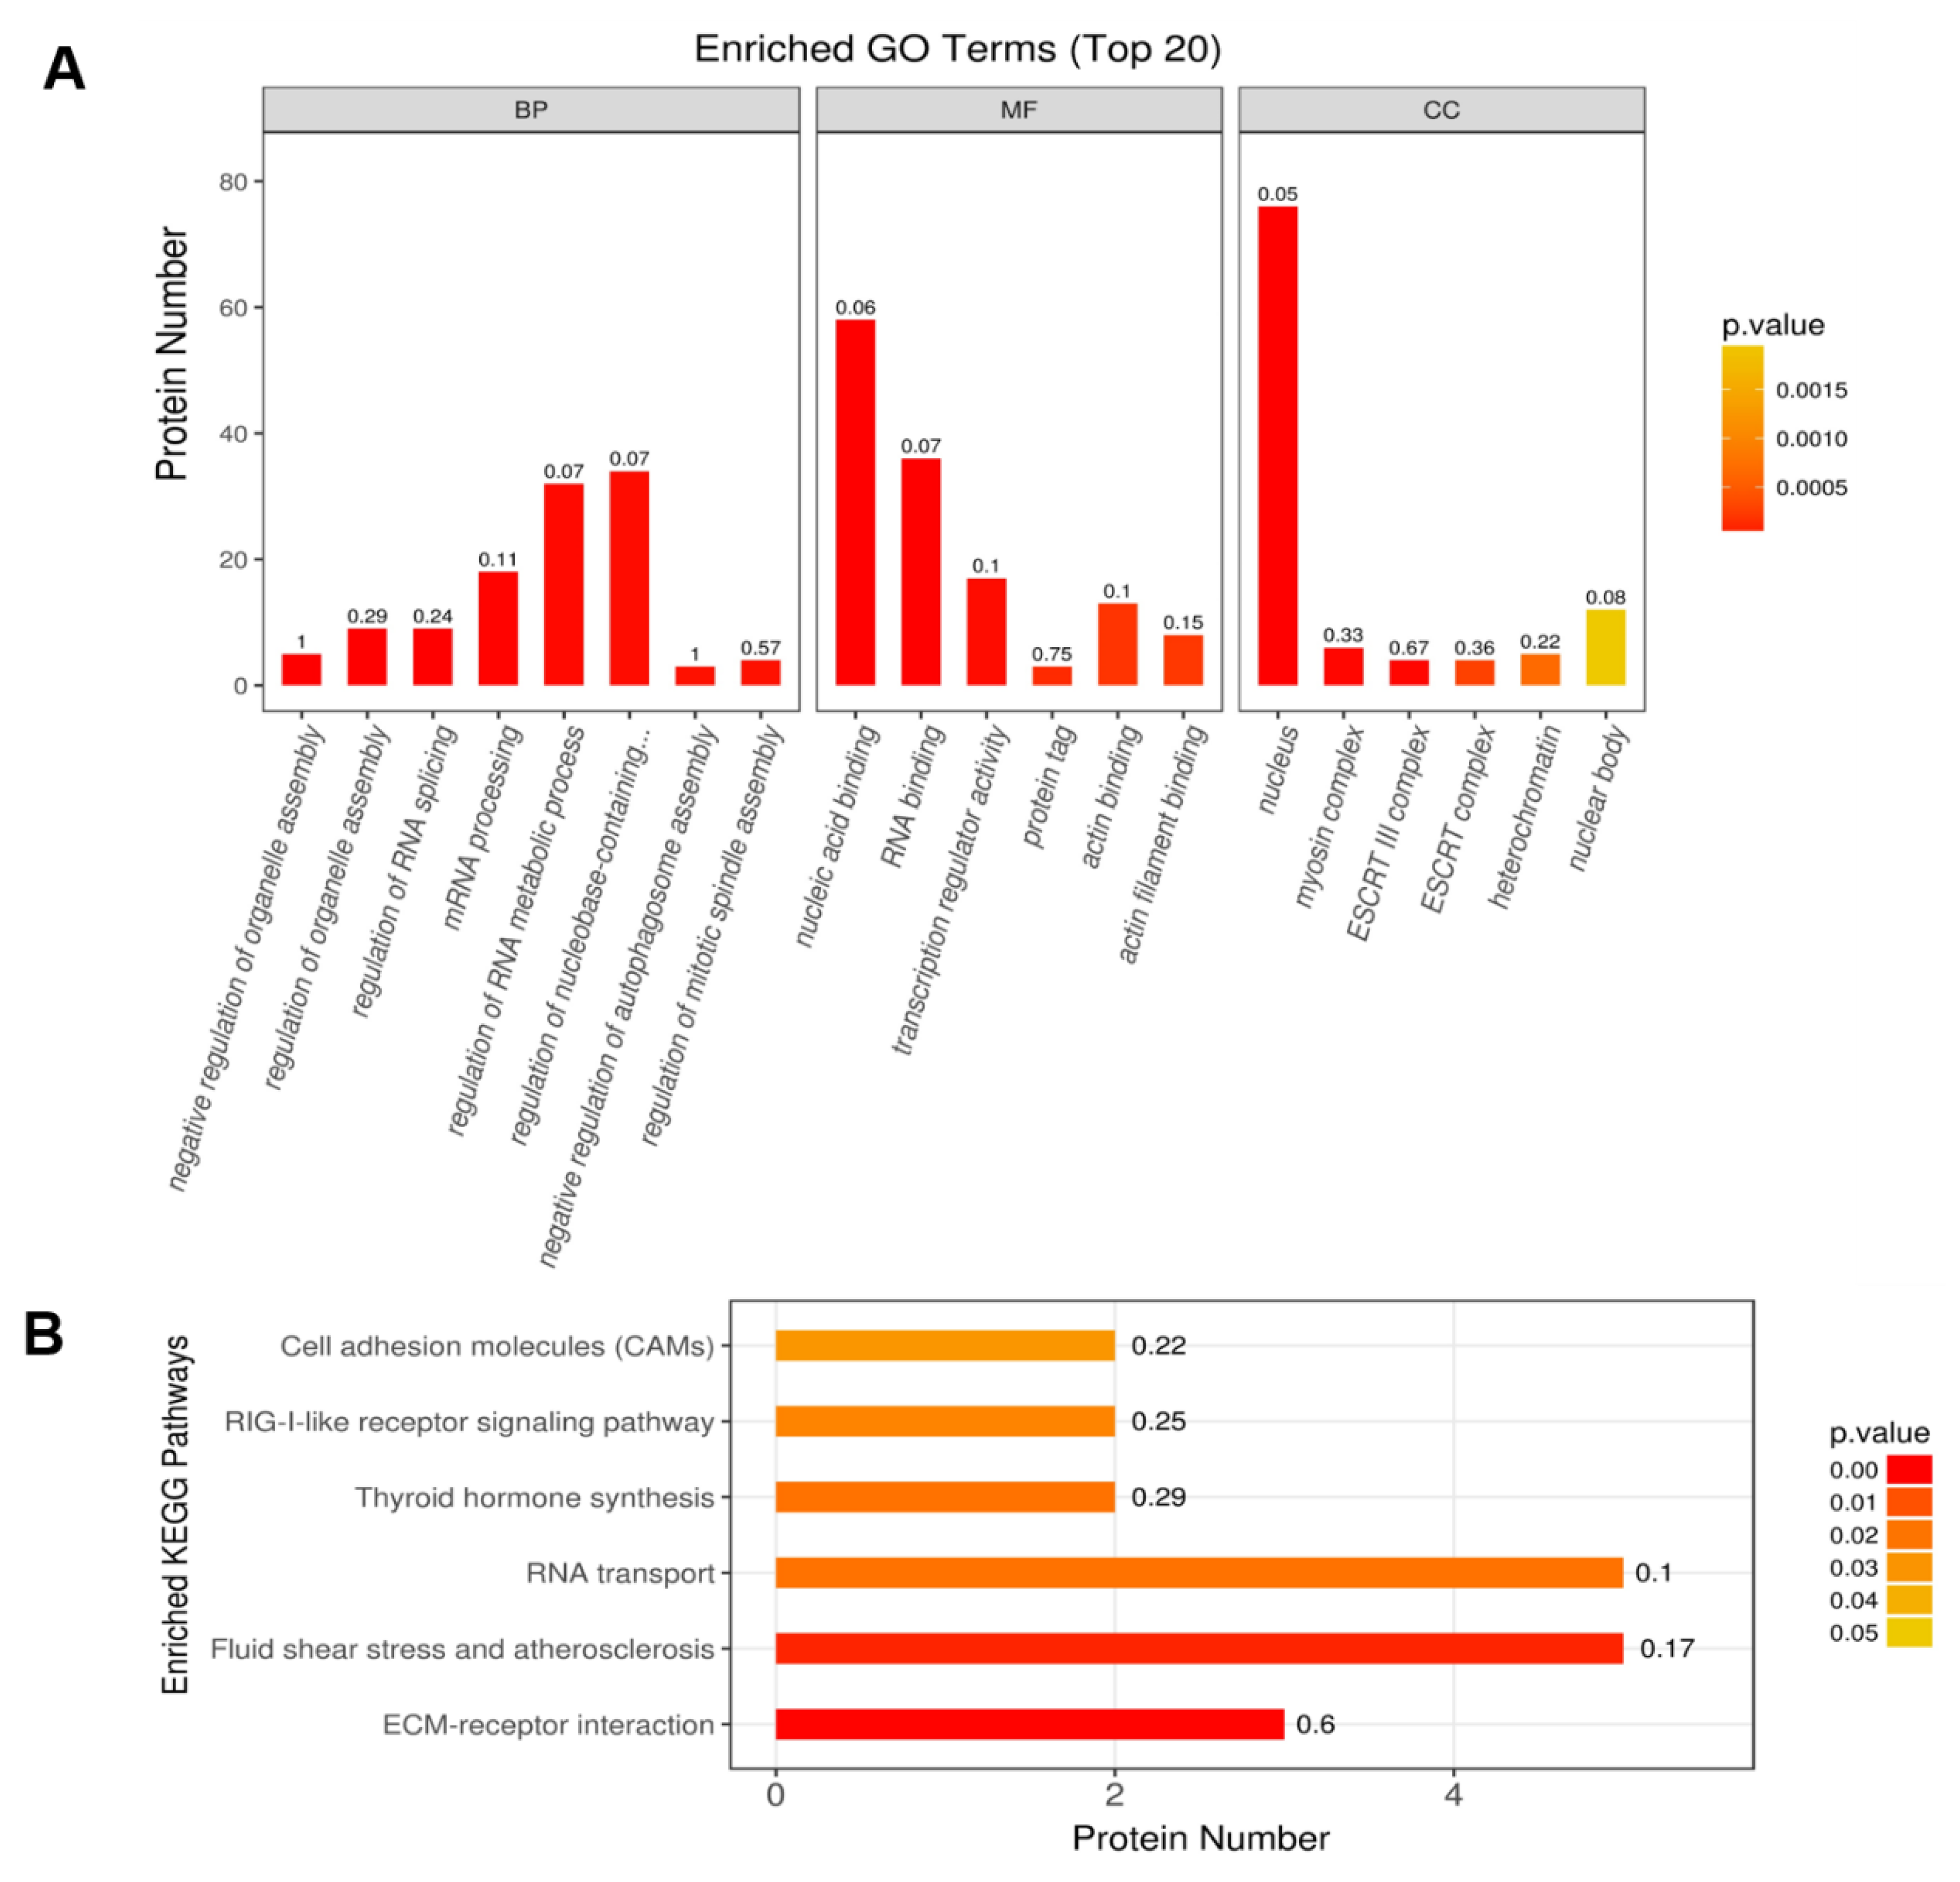
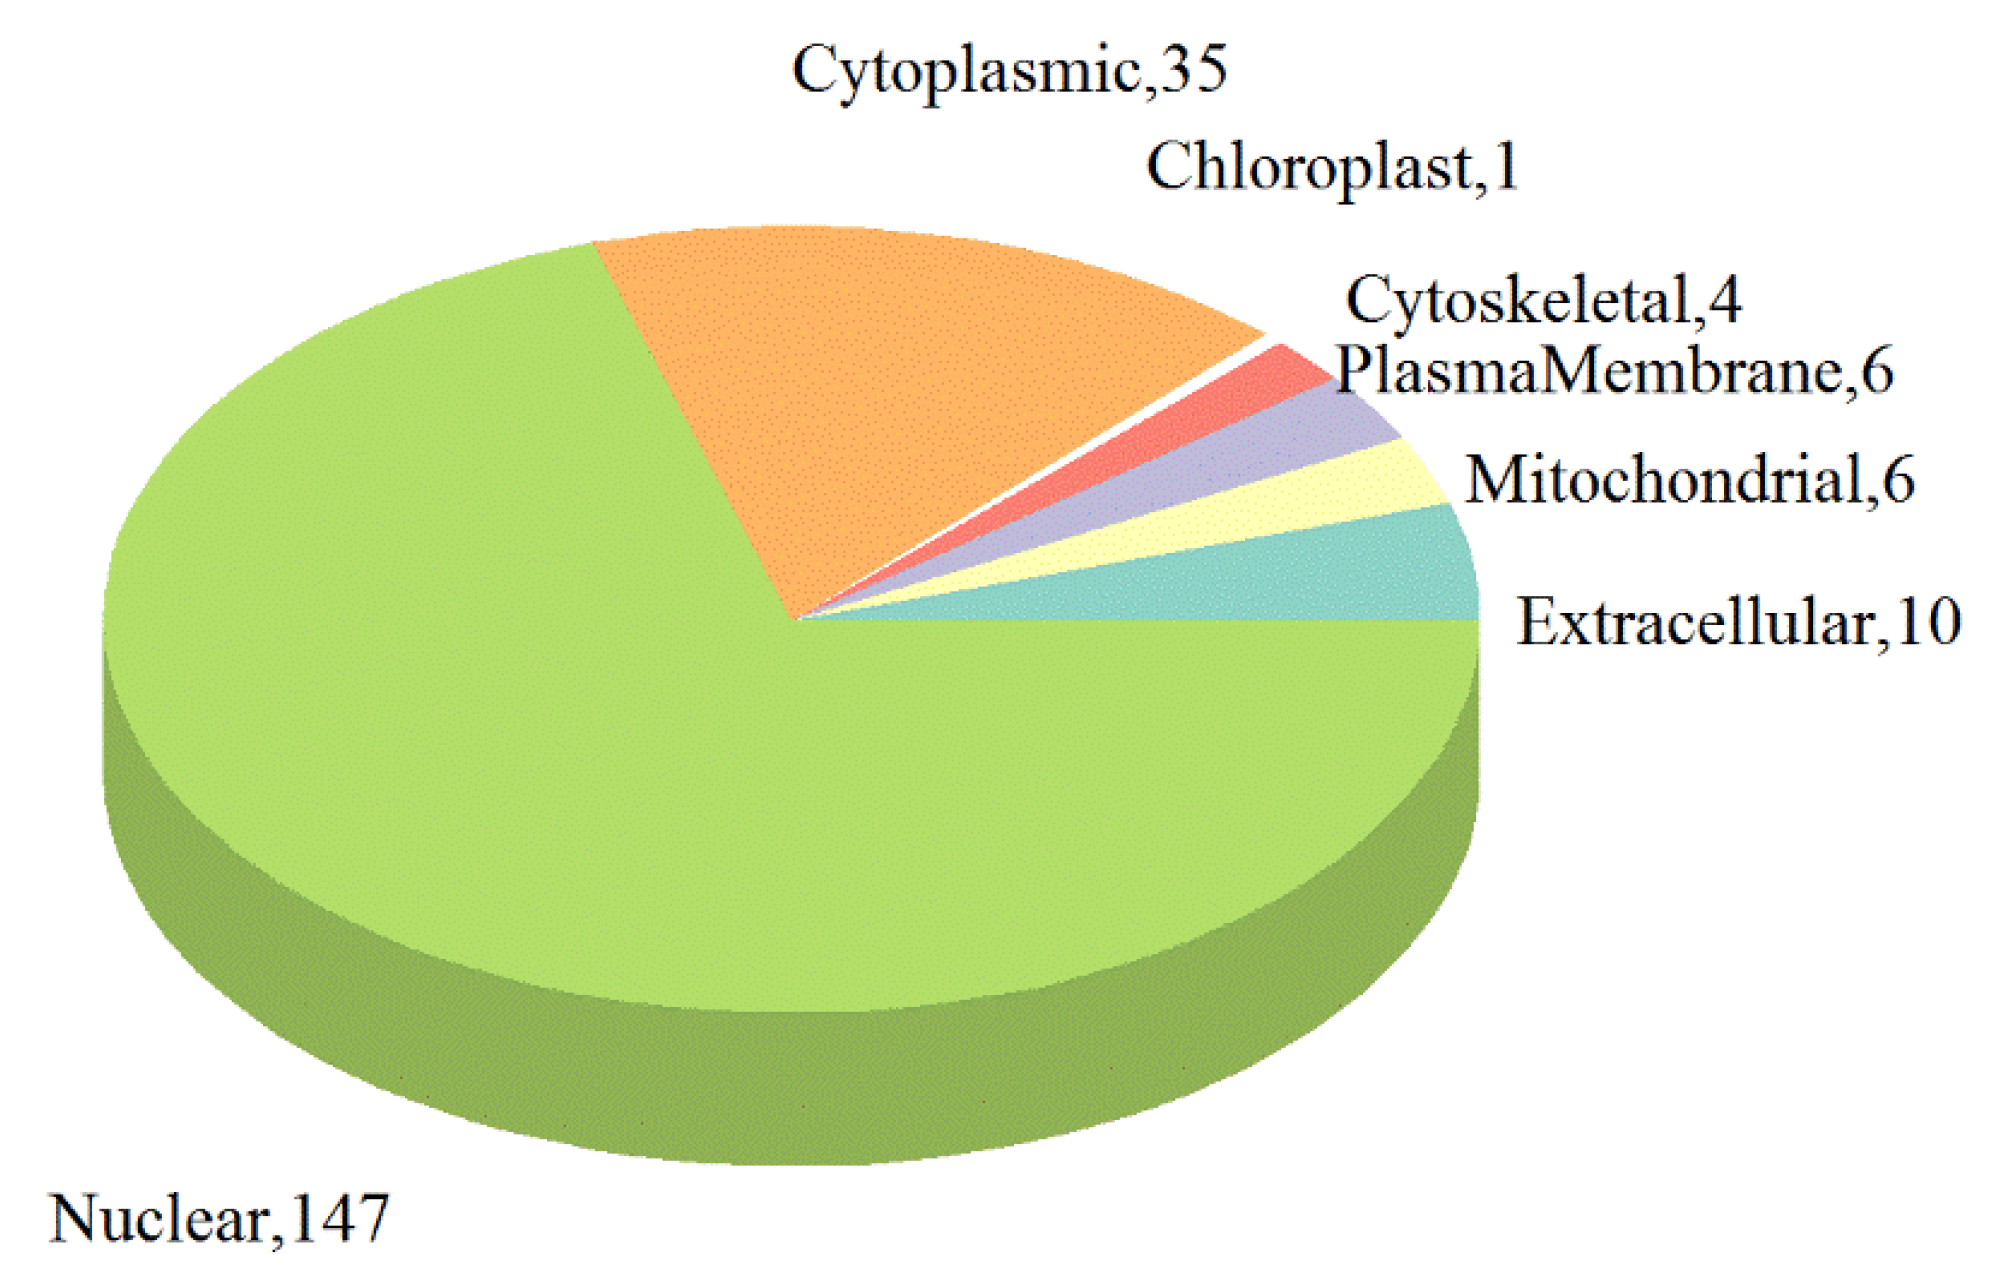
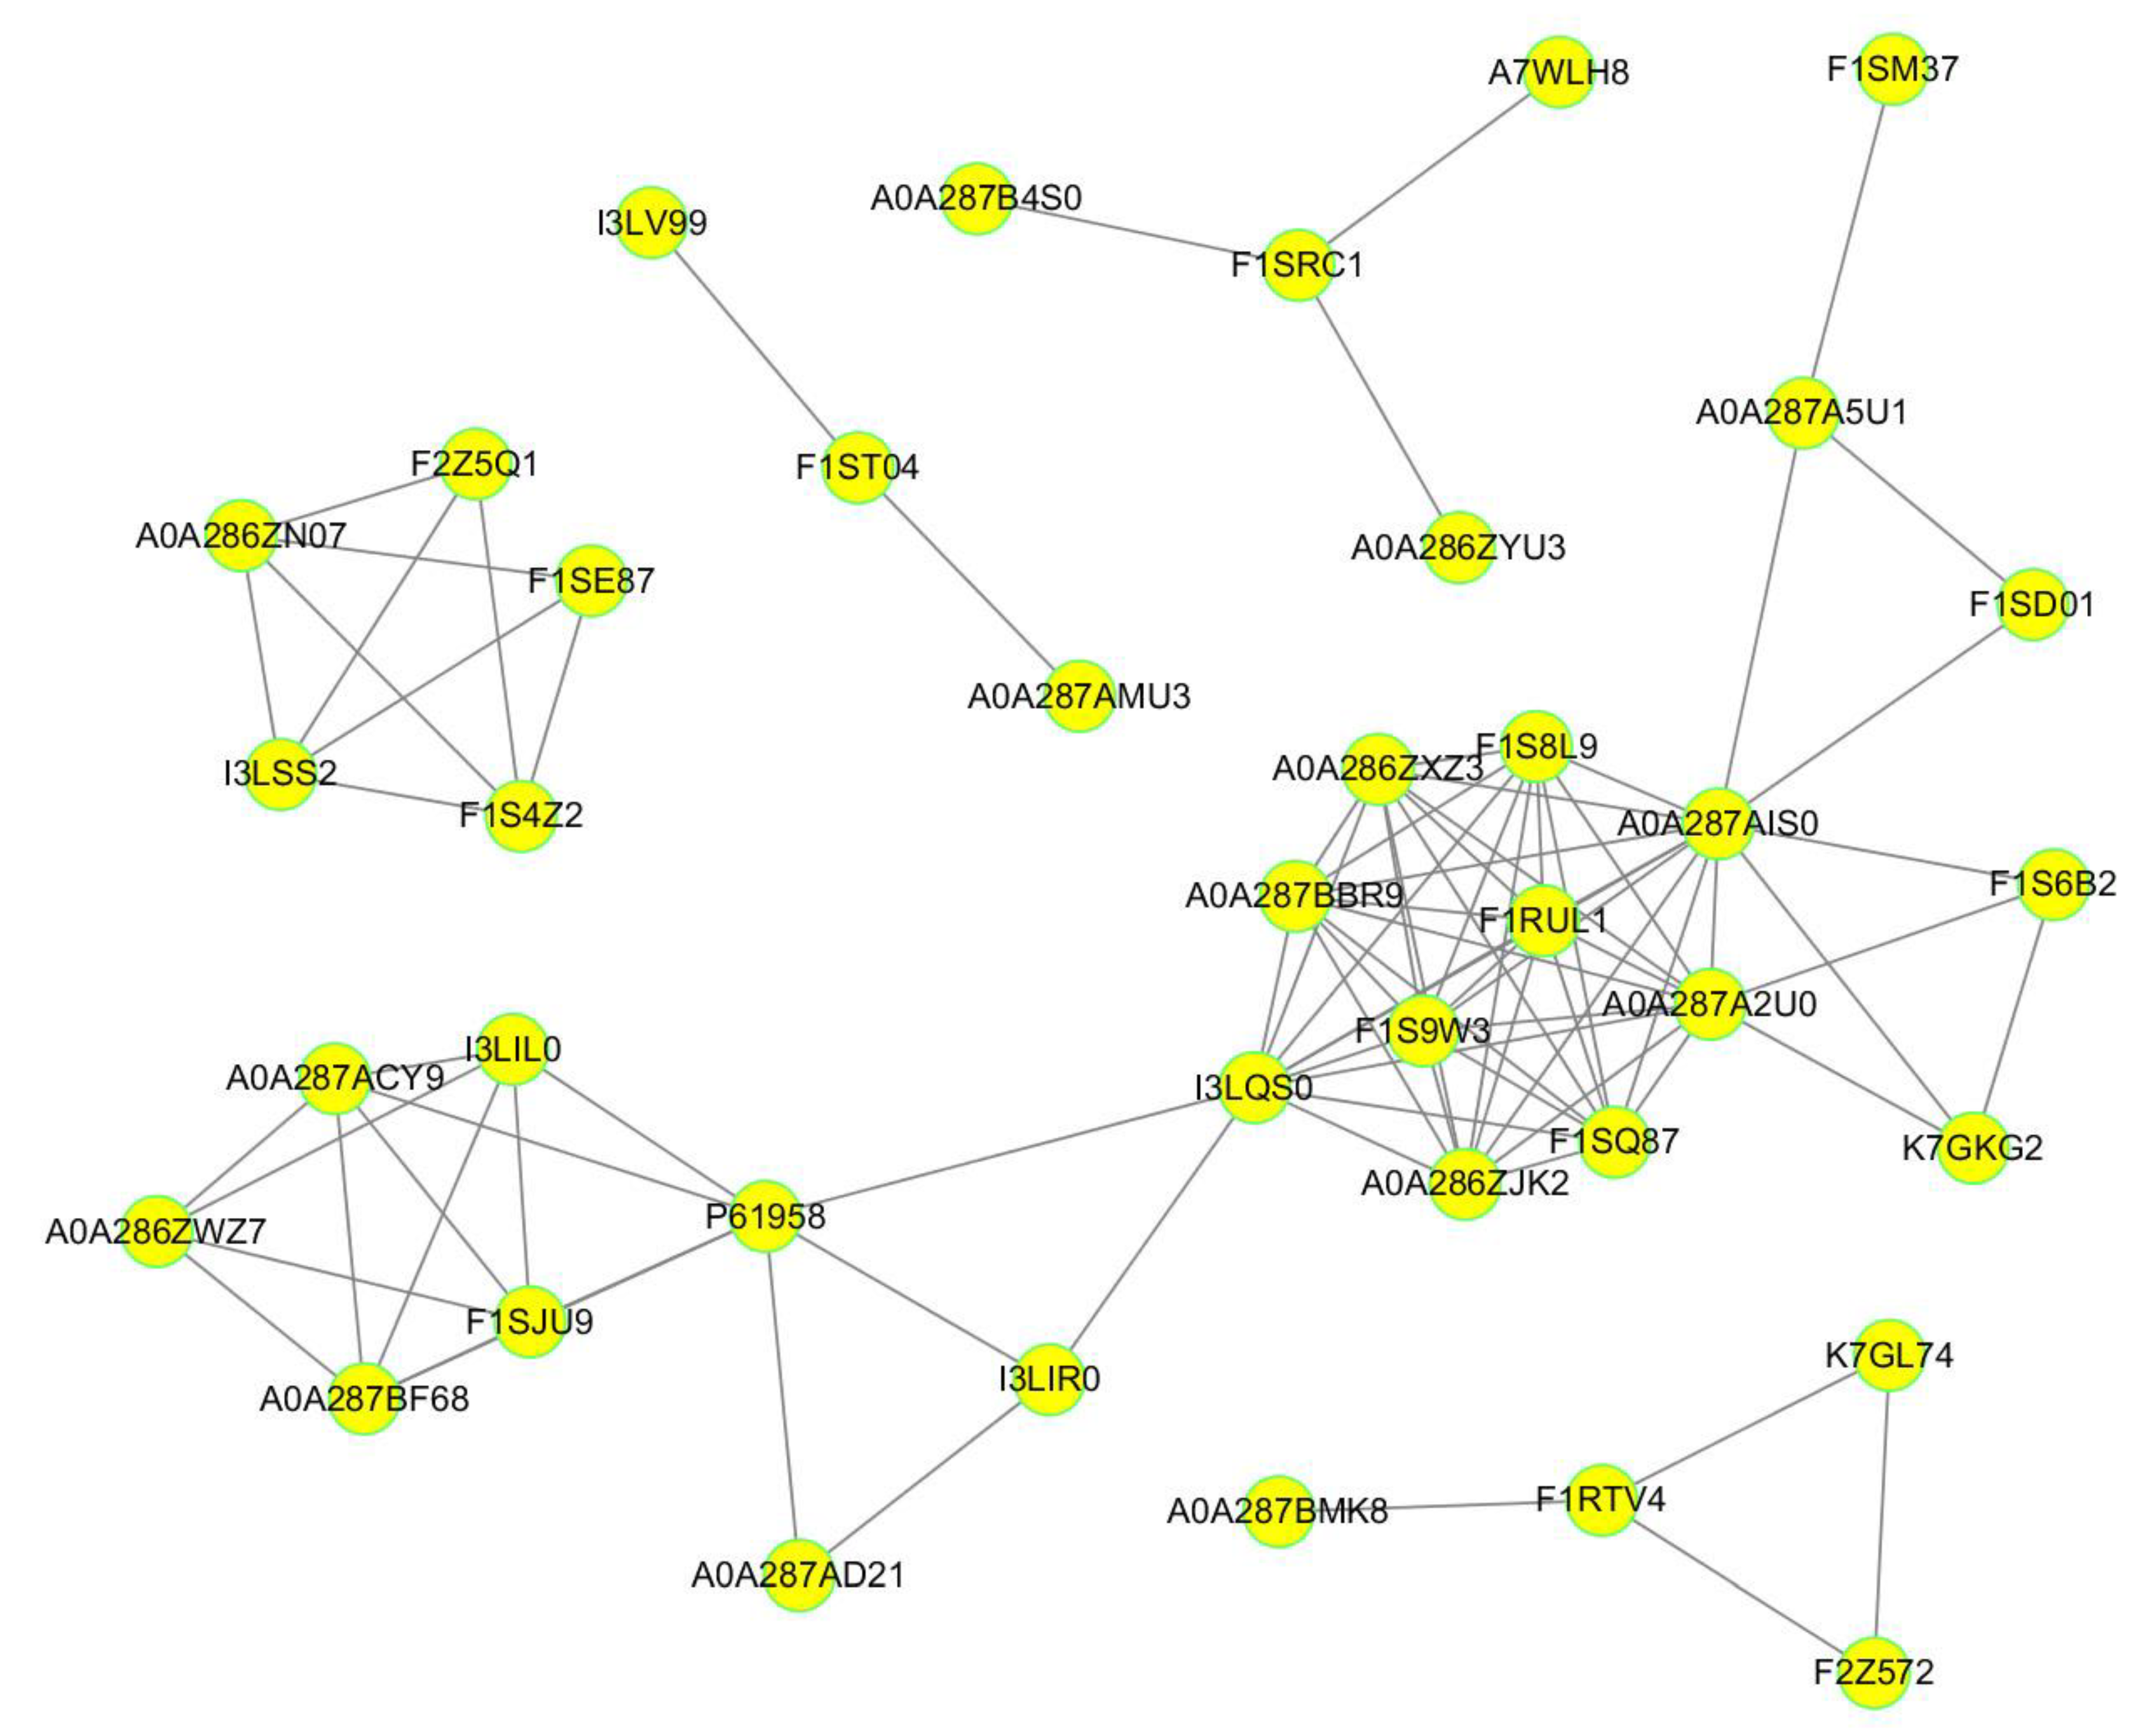
2.3. Functional Classification and Enrichment Analysis of the Identified DEPs

To further study the impact of DEPs in cell physiological process, all 181 DEPs underwent gene ontology (GO) enrichment analysis (Table S4). Based on p value in the highest level, the top 20 enriched GO terms are shown in Figure 3A. In the category of biological process (BP), the DEPs were associated with various biological processes, including negative regulation of organelle assembly (5 proteins), regulation of organelle assembly (9 proteins), and regulation of RNA splicing (9 proteins). In the category of molecular function (MF), three dominant enriched functions including nucleic acid binding (58 proteins), RNA binding (36 proteins), and transcription regulator activity (17 proteins) were identified. In cellular component (CC) classification, nucleus (76 proteins), myosin complex (6 proteins), and endosomal sorting complex required for transport (ESCRT III) complex (4 proteins) were the major components of the identified proteins.
We then performed Kyoto Encyclopedia of Genes and Genomes (KEGG) pathway analysis to further investigate the pathways of the identified DEPs. We found that DEPs were mainly involved in 6 signaling pathways, including extracellular matrix (ECM)-receptor interaction (P14287, Q8HZJ6, K7GNF5), fluid shear stress and atherosclerosis (A0A287AD21, P61958, A7WLH8, Q8HZJ6, K7GNF5), RNA transport (A0A286ZWZ7, A0A287AD21, P61958, A7WLH8, A0A287BF68), thyroid hormone synthesis (P50390 and F1RZR0), retinoic acid–inducible gene I (RIG-I)-like receptor signaling pathway (A0A287AB58, F1S8C6), and cell adhesion molecules signaling pathway (Q8HZJ6 and K7GNF5) (Figure 3B, Table S5).
After analyzing the subcellular localizations of the DEPs, the DEPs were mainly distributed in the nucleus (70.33%) and cytoplasm (16.75%), followed by extracellular space (4.78%), mitochondria (2.87%), and plasma membrane (2.87%). Cytoskeleton (1.91%) and a smaller portion were localized in the chloroplast (0.48%) (Figure 4, Table S6). More detailed information for subcellular localizations of the DEPs can be obtained in Table S6.
Based on the DEPs, we constructed a protein–protein interaction network and found that 39 DEPs were mapped to five protein–protein interaction networks (Figure 5, Table S8). In all these protein–protein interaction networks, the top three DEPs with the highest node degree were A0A287AIS0 (13), A0A287A2U0 (11), and I3LQS0 (11), suggesting that these proteins may be the important candidate proteins for research on PSV infection in PK-15 cells.

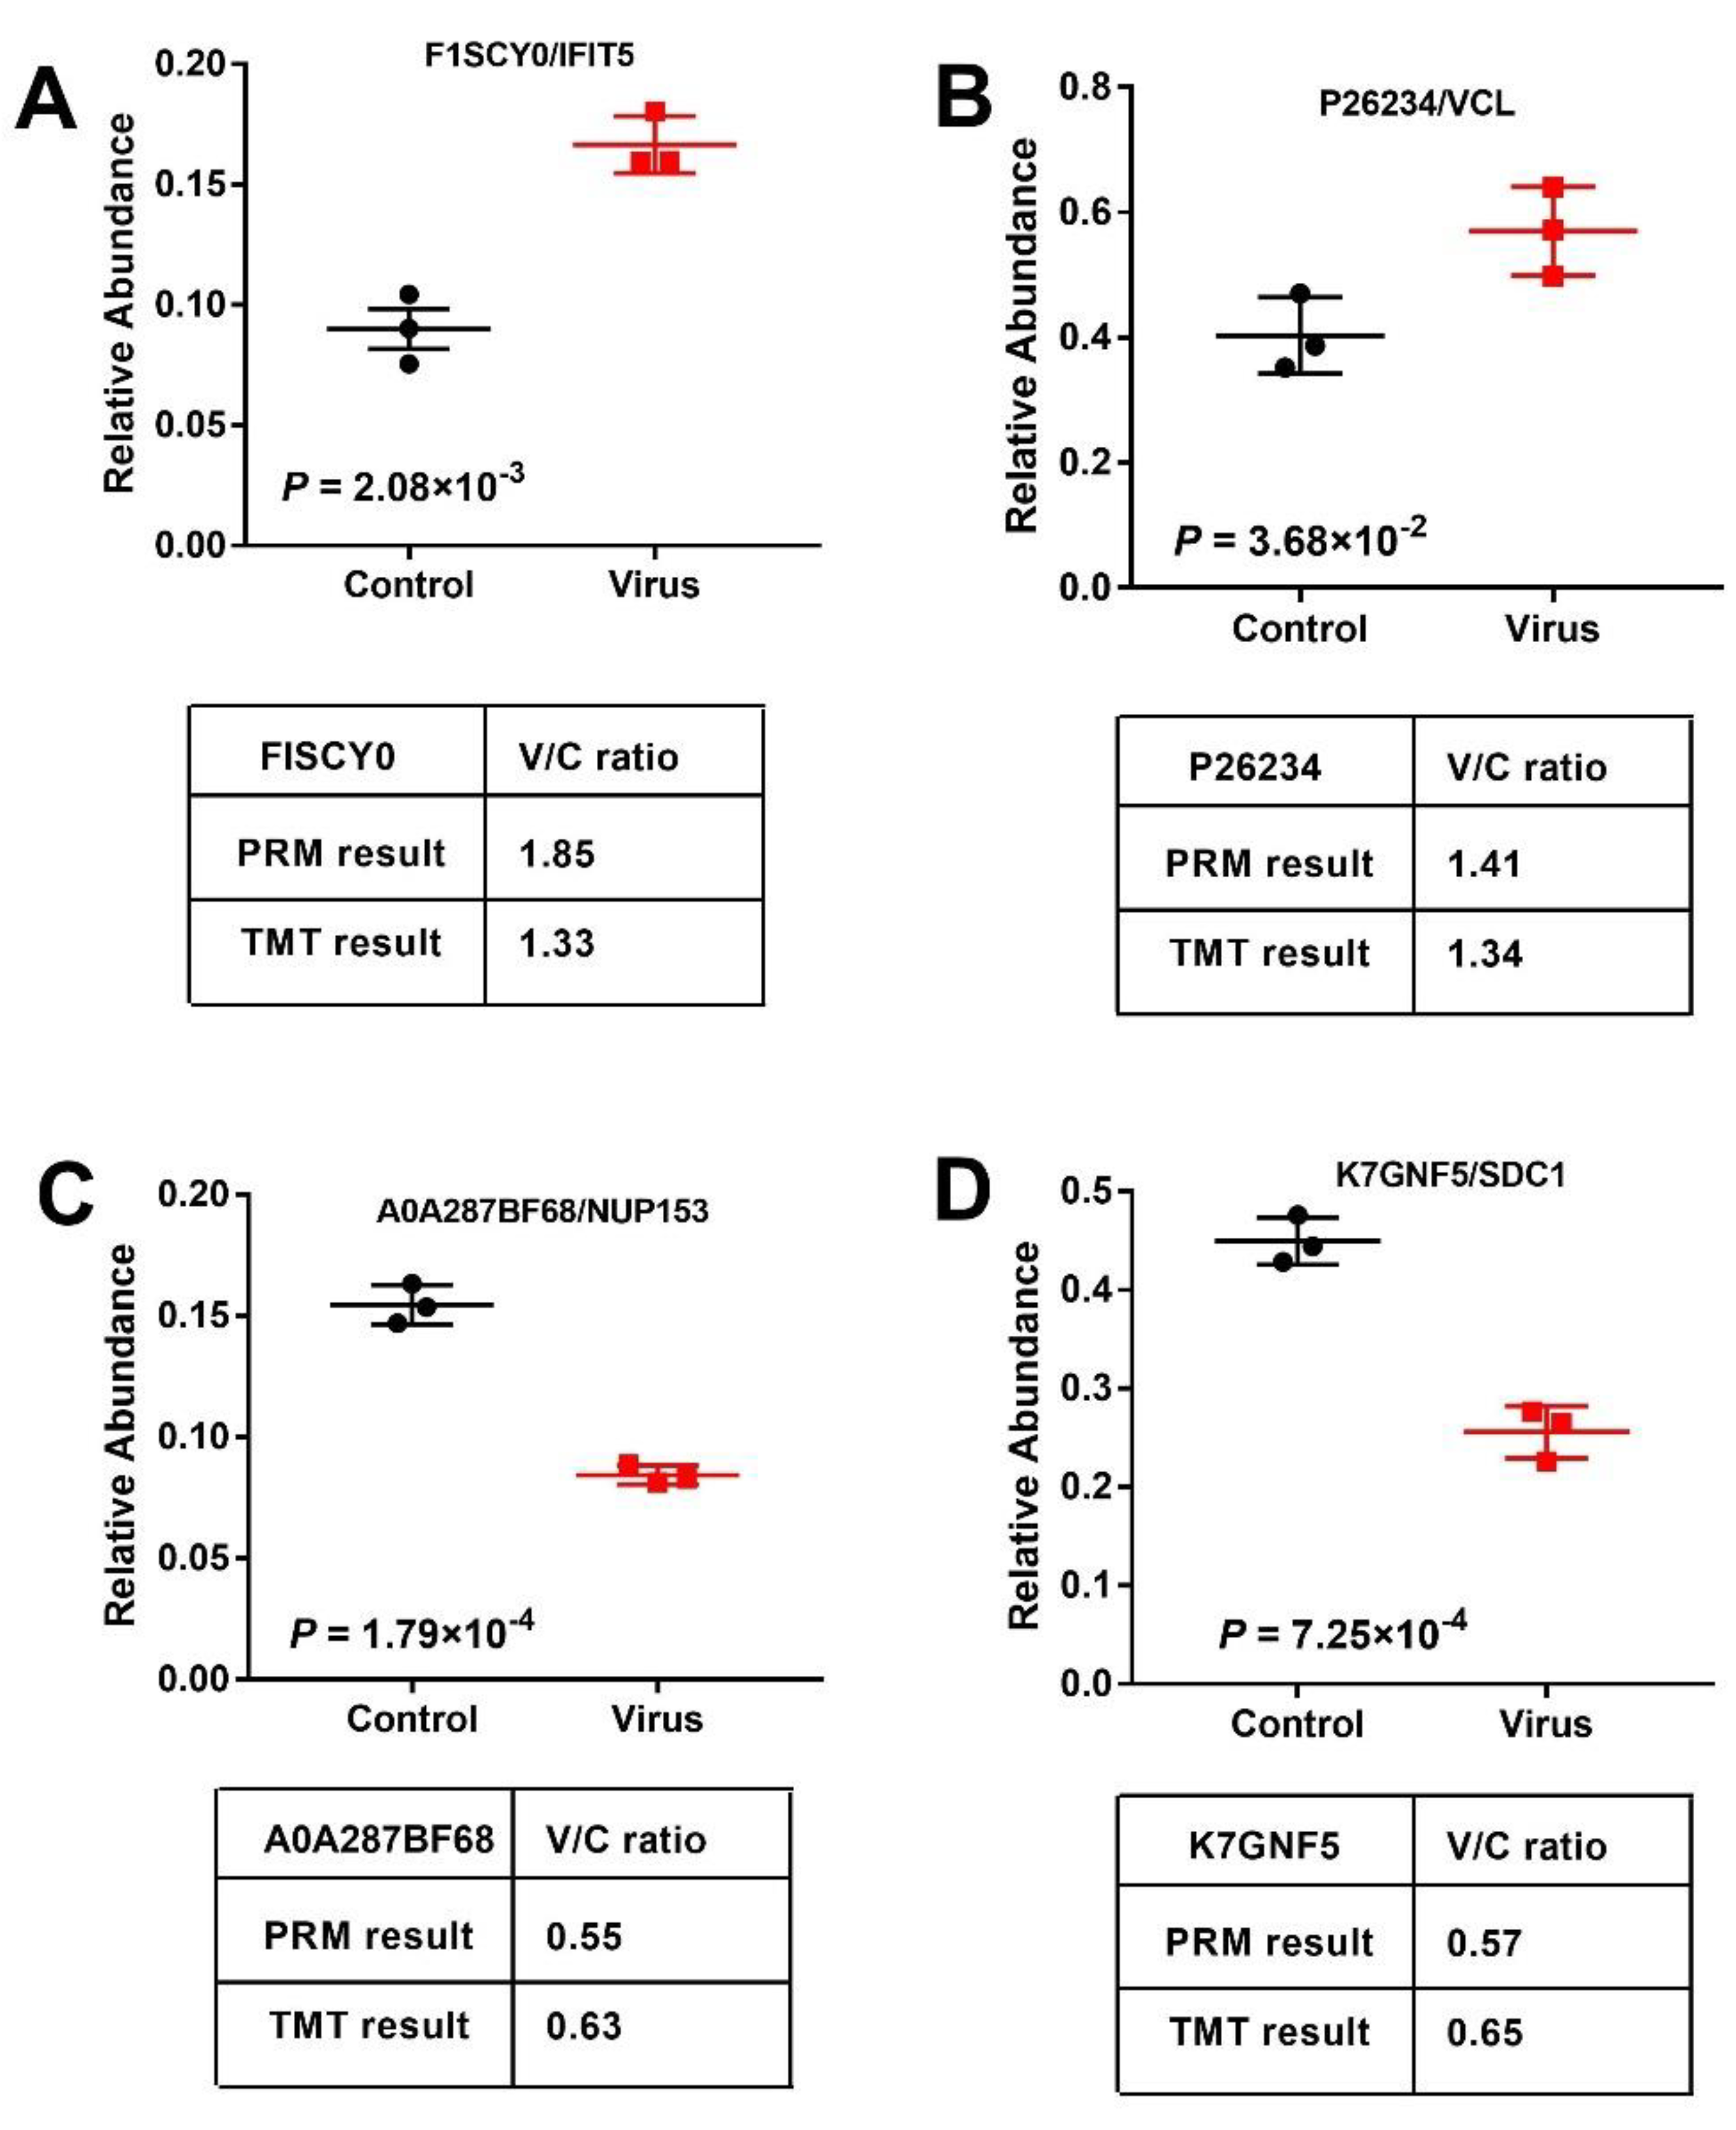
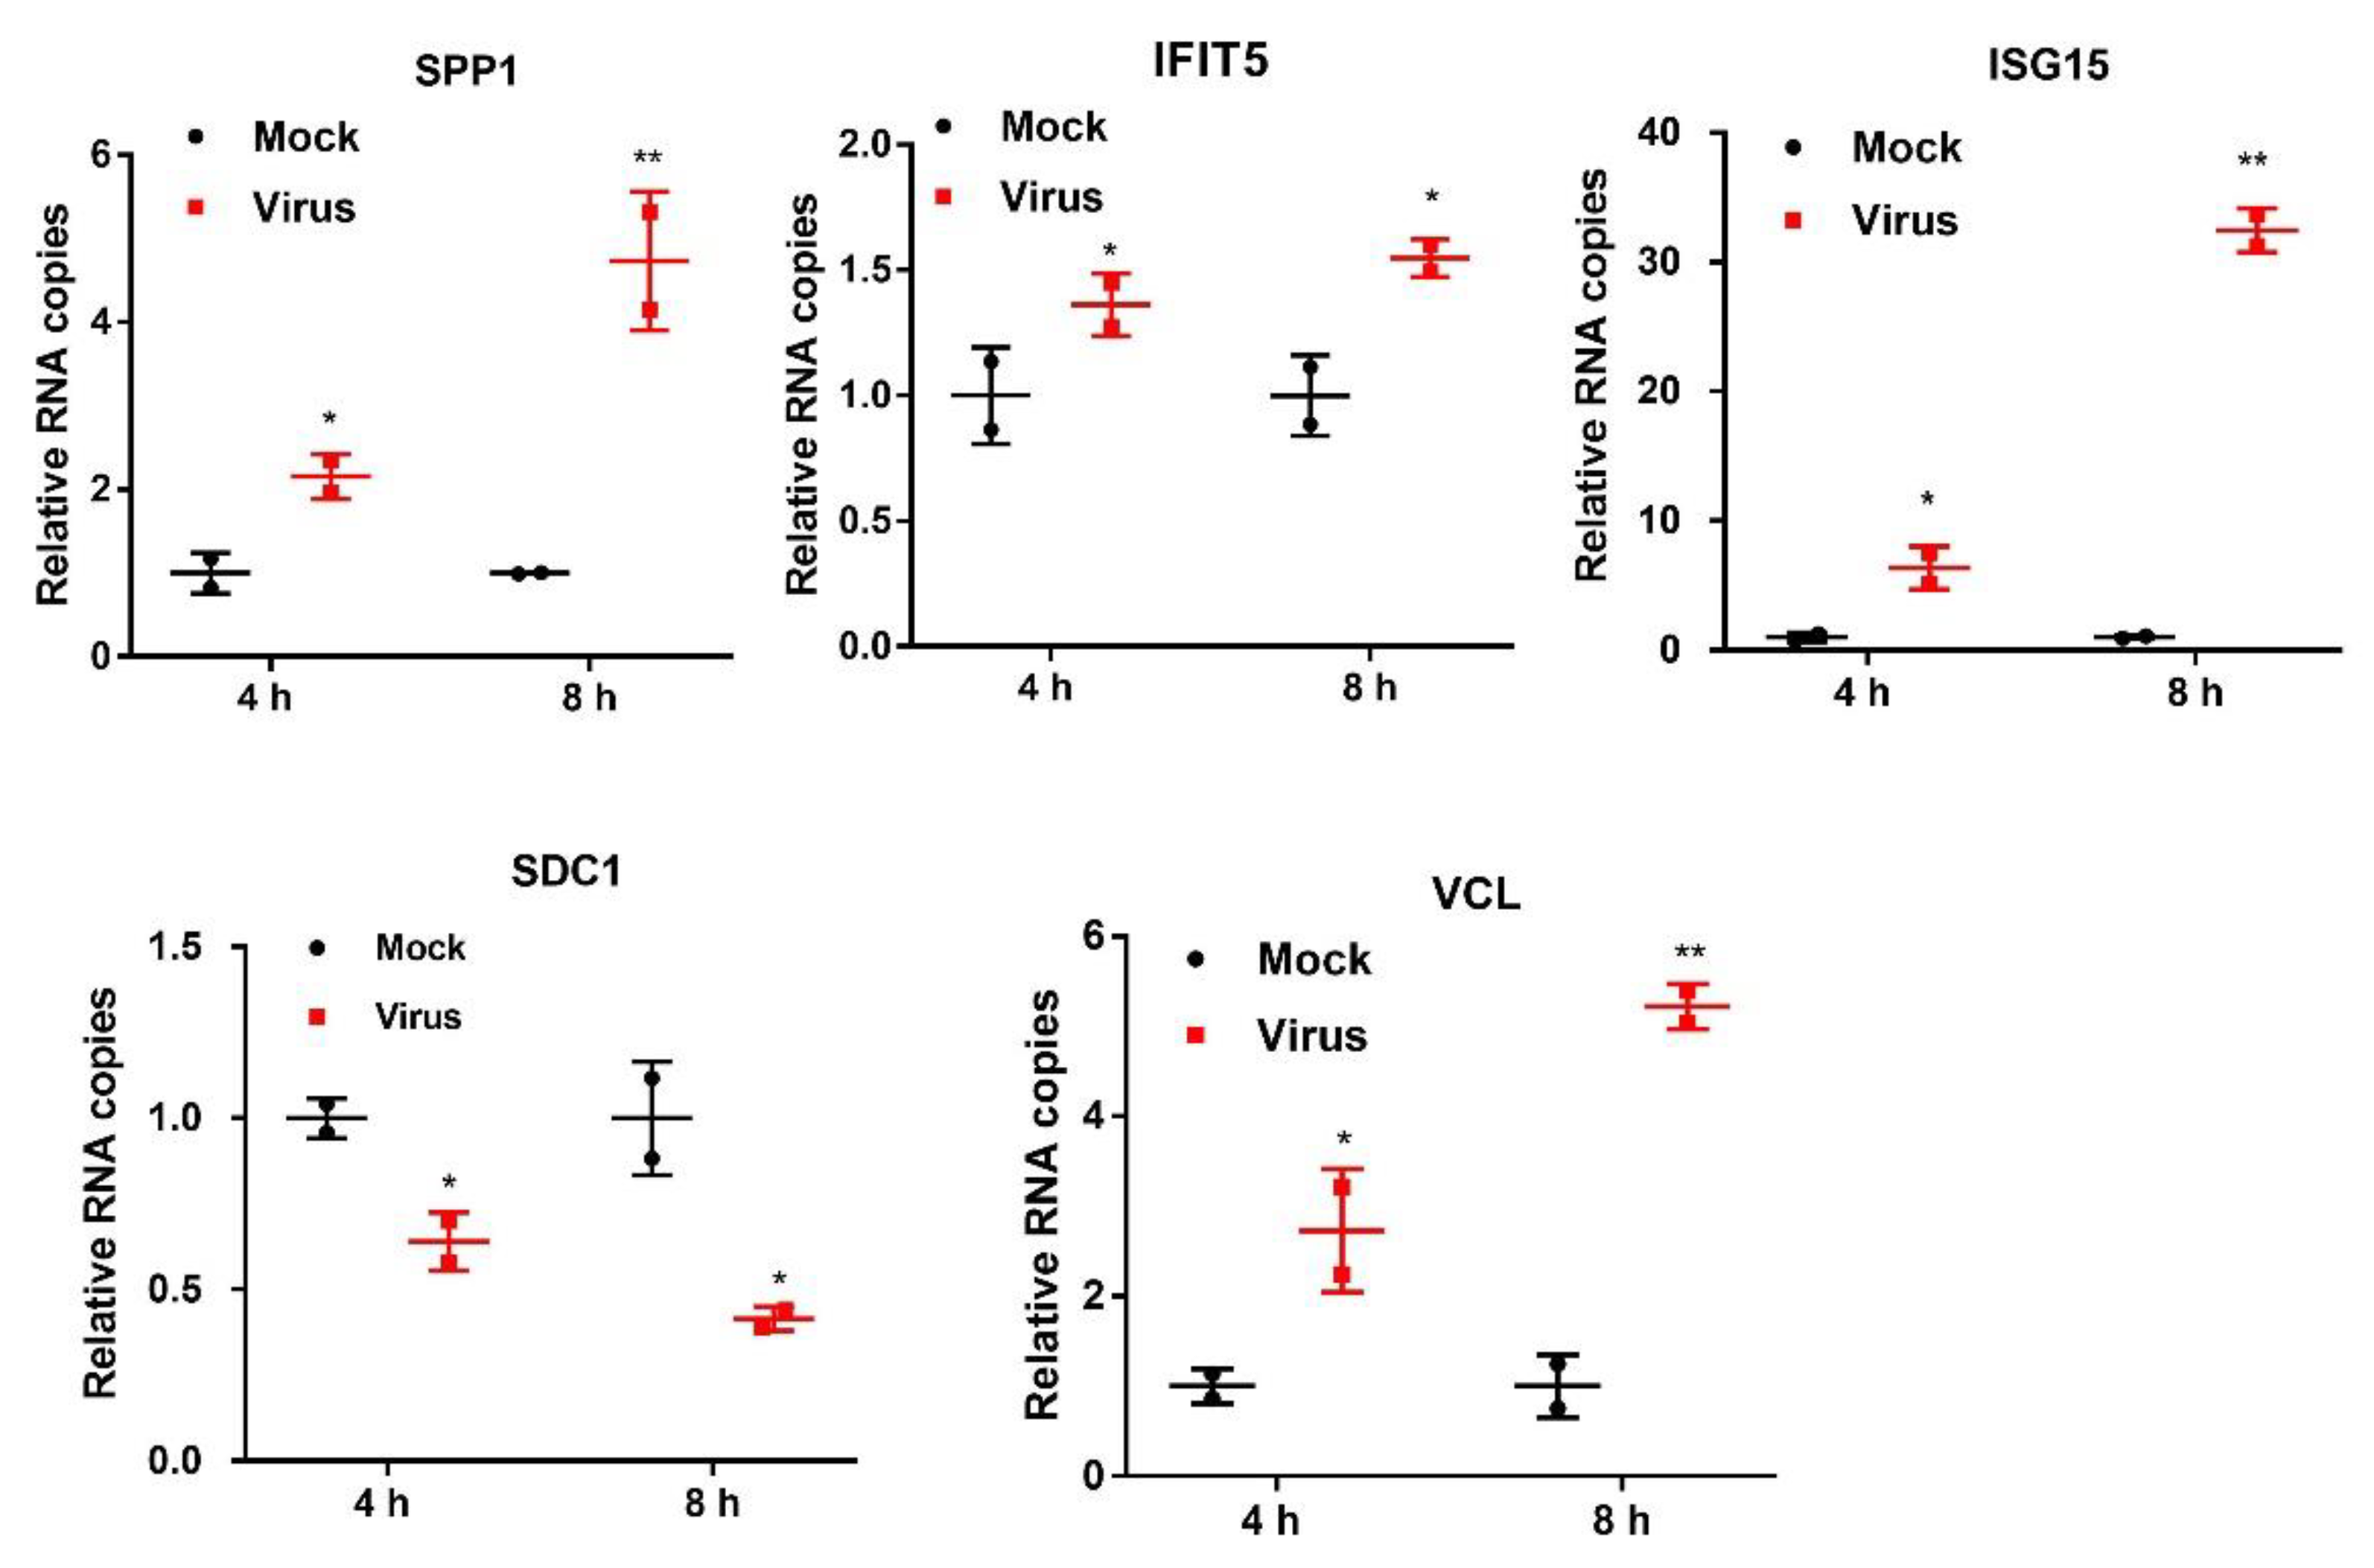
2.4. Validation of DEPs by PRM and qRT-PCR

To confirm the DEPs via LC- mass spectrometry (MS)/MS data, we first performed parallel reaction monitoring (PRM) analysis for four selected DEPs (two up-regulated and two down-regulated proteins). As shown in Figure 6, the relative abundance of DEPs is presented as a box plot, with identical expression level to the proteomic data. Moreover, no noticeable differences were found of the virus/control ratio between PRM and tandem mass tag (TMT)/MS. All these results suggested that our TMT/MS analysis was reliable.
Additionally, we selected 5 representative proteins osteopontin (SPP1), induced protein with tetratricopeptide repeats 5 (IFIT5), ISG15 ubiquitin-like modifier (ISG15), vinculin (VCL), and syndecan-1 (SDC1) to confirm the proteome analysis and study the kinetics by qRT-PCR. These proteins were chosen in the light of interest and for their different ratios. As shown in Figure 7, increased transcript levels of SPP1, IFIT5, ISG15, and VCL and decreased transcript level of SDC1 were found after PSV infection of 4 h and 8 h, which were consistent with the results of LC-MS/MS data.

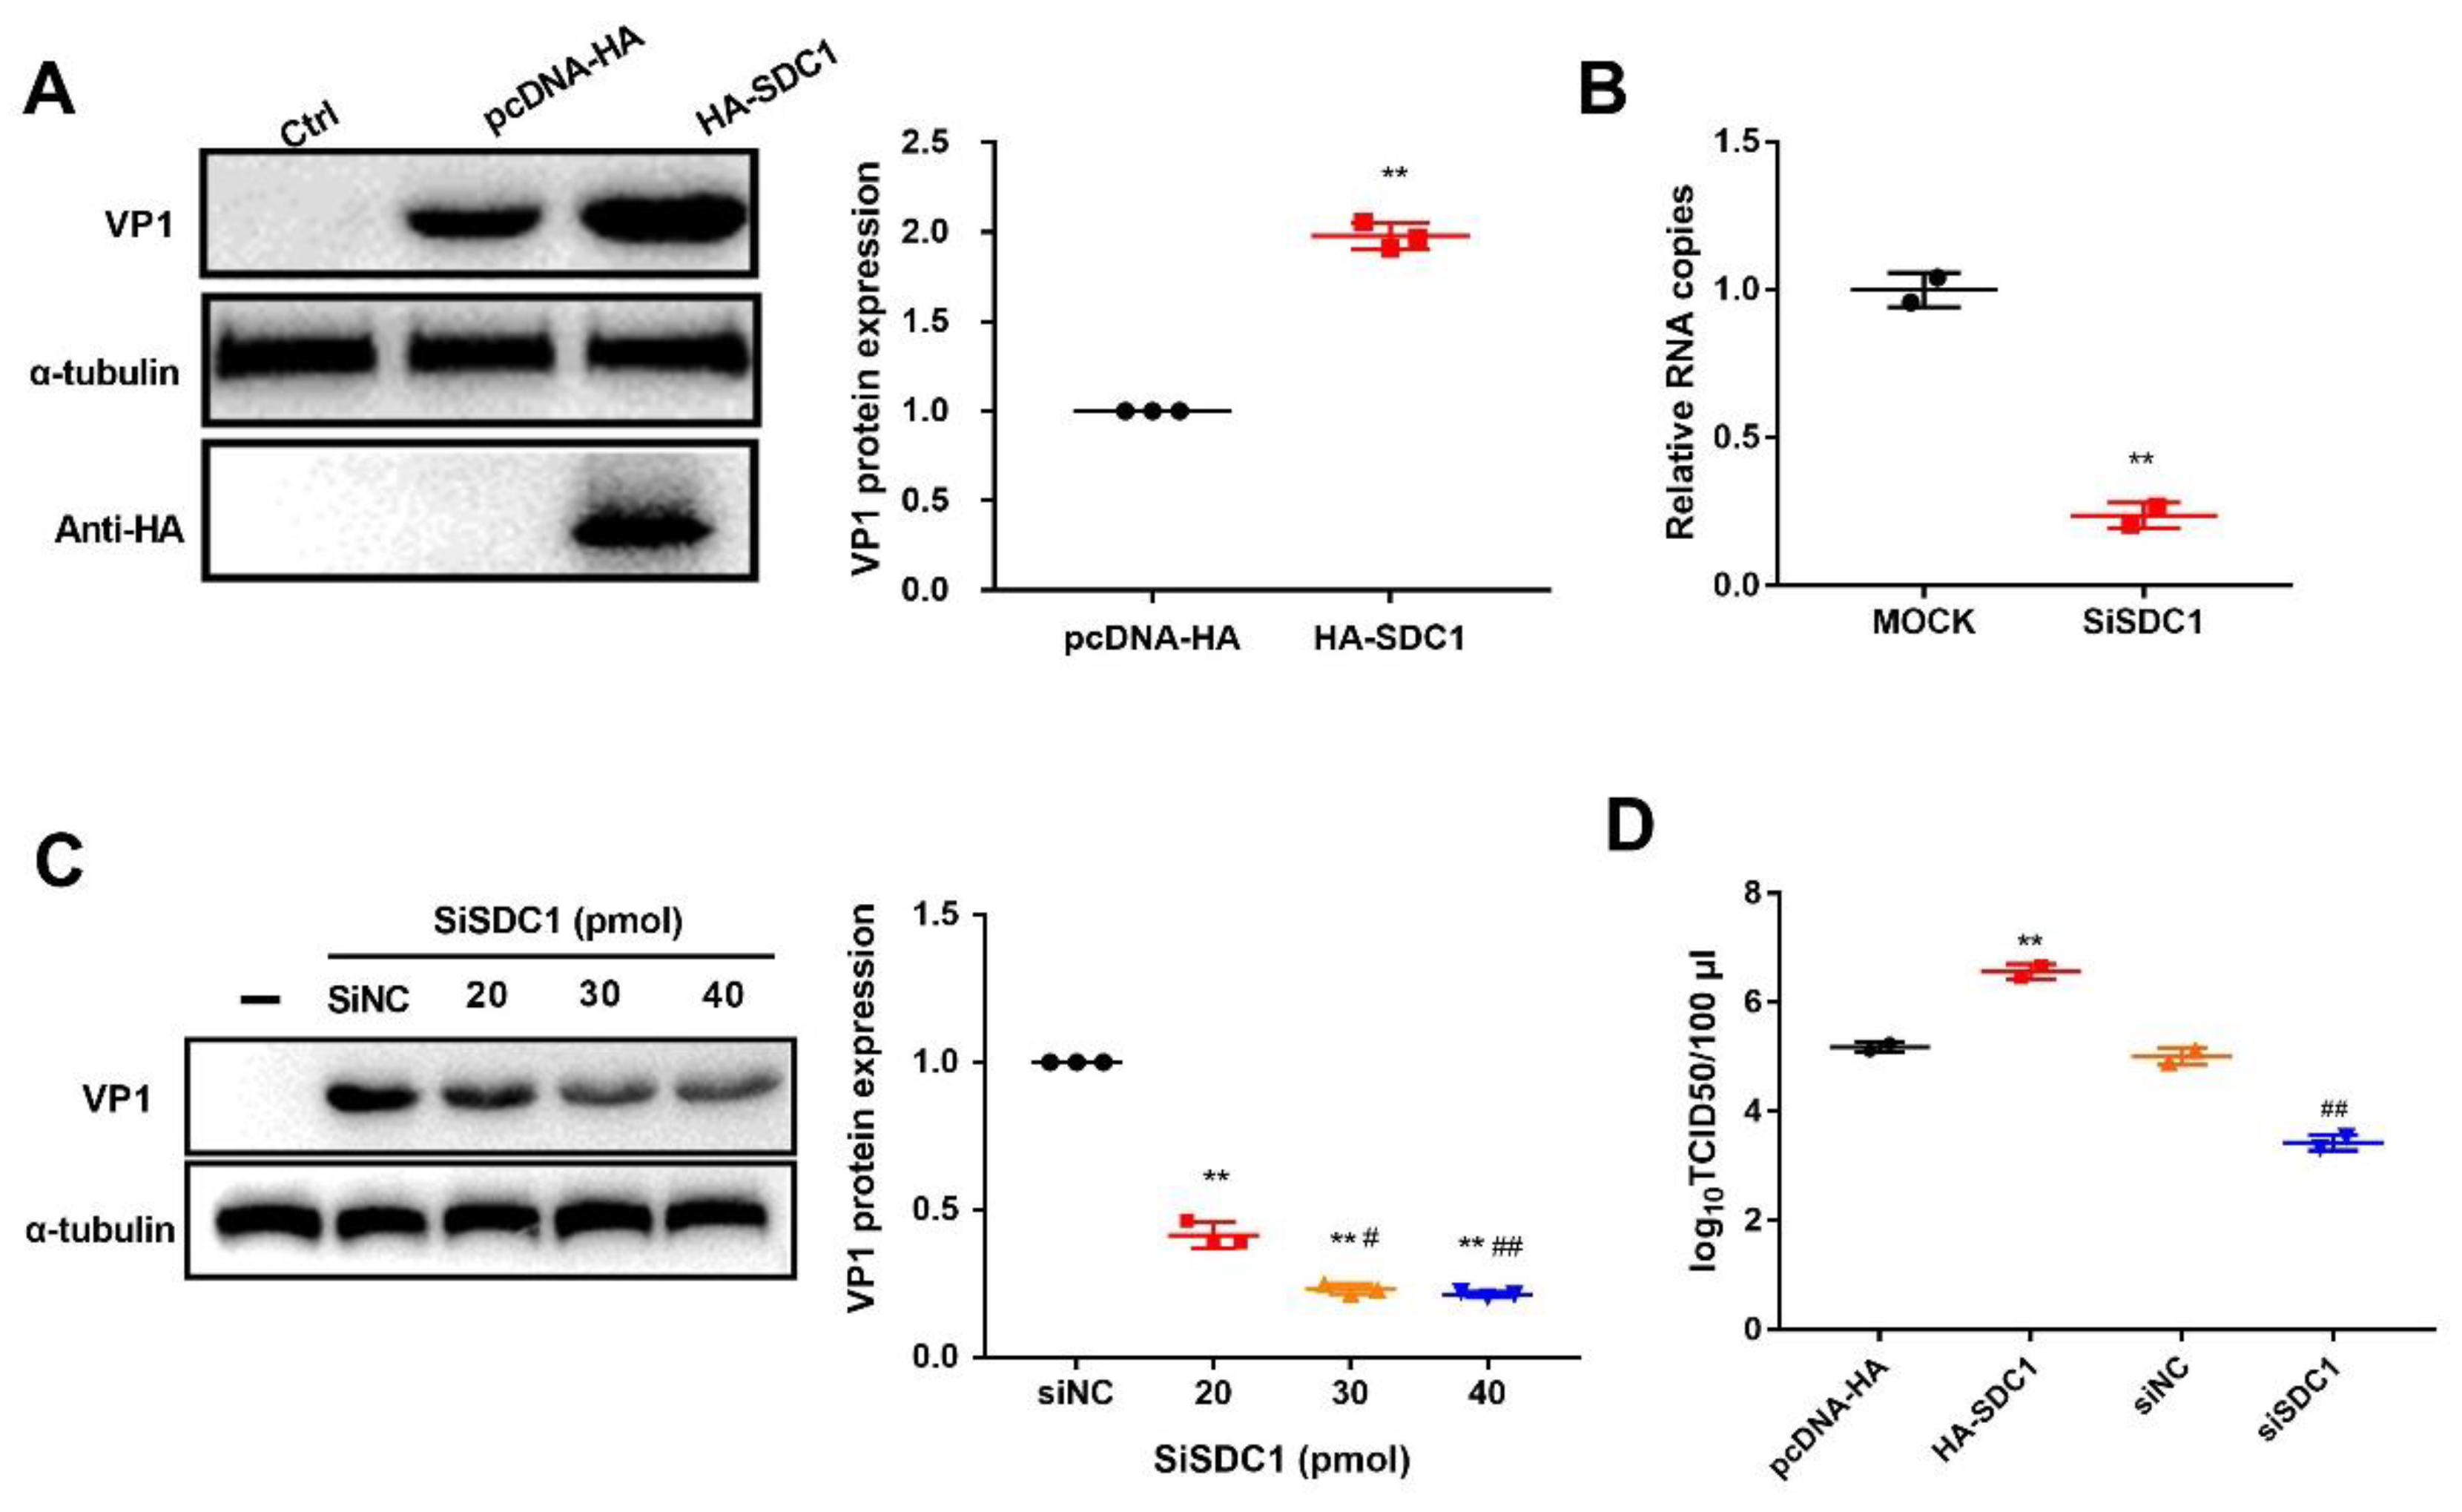
2.5. SDC1 Promotes PSV Replication

SDC1 is a cell surface proteoglycan and can mediate host defense mechanisms, angiogenesis, and virus attachment and entry [16]. During porcine hemagglutinating encephalomyelitis virus infection, SDC1 acts as a target gene of miR-10a-5p and short interfering RNA (siRNA)-mediated knockdown of SDC1 reduces viral replication [17]. To examine the effect of the differentially expressed proteins on PSV infection, we transfected HA-tagged SDC1 into PK-15 cells. At 24 h post-transfection, cells were infected with PSV and VP1 protein expression level was analyzed using western blot. We found that VP1 protein level was significantly increased by SDC1 over-expression in PK-15 cells compared with the transfected pcDNA-HA group (Figure 8A). To further confirm our results, siRNAs against SDC1 were transfected into PK-15 cells for 24 h, then cells were harvested, and the knockdown efficiency was tested by qRT-PCR. As shown in Figure 8B, siRNAs could decrease intracellular mRNA levels of targeted SDC1. PK-15 cells were then transfected with siSDC1 or siNC, followed by a virus entry assay. As expected, reduction of SDC1 expression by RNA interference could significantly decrease VP1 protein synthesis compared to siNC-treated cells and in a dosage-dependent form (Figure 8C). As a complementary approach, viral titer assays indicated that the virus titer of PK-15 cells transfected with HA-SDC1 (6.564 × log10TCID50/100 μL) was significantly increased compared to that of pcDNA-HA transfected cells (5.184 × log10TCID50/100 μL, Figure 8D). Knockdown of SDC1 significantly increased PSV titer compared to that in siNC-treated cells (p < 0.01, Figure 8D). All together, these findings indicate that SDC1 could promote PSV replication.

3. Discussion

PSV has been regarded as a causative agent of neurological, diarrheal, and fertility disorders in pig. Although the PSV receptor and entry pathway have been reported [5,18], the information of target proteins related to virus infection is largely unknown. Comparative proteomic analysis involving TMT has been widely used to explore host responses of various viral and fungal infections [9,19,20]. Proteomic methods in virology play important roles in revealing virus replication, antiviral responses, and virus–host protein interactions at the protein level [19,21,22]. In this study, we identified that the host proteins, IFIT5, ISG15, SPP1, and VCL, were up-regulated and SDC1 was down-regulated during PSV infection using RT-qPCR.
IFIT proteins contain repetitive sequences of the regulatory tetratricopeptide repeat domain, which mediates protein–protein interactions, including translation initiation, viral replication, and double-stranded RNA signaling [23,24]. IFIT1 can combine with human papillomavirus protein E1, preventing viral replication in the nucleus [25]. Knockout of chicken IFIT5 fibroblasts using CRISPR/Cas9 increases Newcastle disease virus and vesiculitis virus replication [26]. ISG15 plays important roles in antiviral response and is involved in the regulation of various viruses, including influenza virus, vaccinia virus, and human respiratory syncytial virus [27,28,29]. In the early stages of pseudorabies virus (PRV) infection, pig ISG15 mRNA and protein expression levels are increased, and play important roles in antiviral effect and regulating PRV replication [30]. Additionally, ISG15 levels are significantly elevated in patients with chronic hepatitis C virus and hepatitis E virus infection [31,32]. In the current study, using proteomics analysis we found significant increases of IFIT5 and ISG15 in PSV-exposed cells, indicating that IFIT5 and ISG15 may be pivotal regulatory factors in PSV infection.
As a fibrogenic cytokine, SPP1 is significantly up-regulated in the process of tissue damage and repair [33]. In the primate models of HIV infection, viral infection causes a significant increase of SPP1 expression in the brain and cerebrospinal fluid [34]. In addition, activation of SPP1 promotes the replication of hepatitis C virus [35] and the neural invasion of West Nile virus [36]. VCL, a 116- kDa cytoskeletal protein, is involved in the connection between integrin adhesion molecules and actin cytoskeleton [37]. VCL levels are increased in lymphoid cells and peripheral blood mononuclear cells of human immunodeficiency virus type 1 (HIV-1)-infected patients [38]. Overexpression of VCL reduces the susceptibility of human cells to HIV-1 and Moloney mouse leukemia virus infection [39]. In this study, we found that SPP1 and VCL were up-regulated in PSV-infected cells, suggesting that SPP1 and VCL appear to play an important role in the process of PSV infection.
Syndecan is a family of transmembrane heparan sulfate (HS) during the maturation of B cells [40]. SDC1 is considered to be an important marker for the diagnosis and prognosis of AIDS-related lymphoma [41]. SDC1 represents the dominant HS expressed on the surface of multiple myeloma cells and regulates cell growth and survival [42]. The function of SDC1 is regulated by intracellular transport, and Rab5 can bind to SDC1 in the cytoplasmic domain and mediate its internalization [43]. SDC1 is also the major receptor for herpes simplex virus type-1 attaching to cells [44]. Changes in SDC1 expression levels could be observed during infection with Pneumocystis and Neisseria gonorrhoeae [45,46]. Additionally, Anastasiadou et al. [47] found that Epstein-Barr virus infection causes down-regulation of SDC1. RNA interference silencing SDC1 can reduce the entry of herpes simplex virus type 1 into HeLa cells, inhibit the formation of viral plaques, and promote cell survival [44]. Similar to these studies, we also found that SDC1 expression can be significantly down-regulated during PSV infection. Overexpression of SDC1 can increase the expression of PSV VP1 protein and viral titer, while knockout of SDC1 has the opposite results.
SDC1 is a cell surface HS proteoglycan that is mainly expressed in epithelia [48]. SDC1 ectodomain includes polysulfated HS chains that facilitate interactions with many proteins, including viruses, growth factors, and chemokines [49]. A previous study showed that classical swine fever virus (CSFV) infects swine kidney cells using cellular membrane-associated HS to facilitate viral entry [50], and viral glycoprotein Erns interacts with HS, causing CSFV infection in a HS-dependent mechanism [51]. At early stages of hepatitis C virus infection, SDC1 and virions colocalize at the plasma membrane and are internalized in endosomes of hepatocyte, and knocking down SDC1 inhibits HCV infection [52]. However, as a cell surface proteoglycan being extensively glycanated with HS, whether SDC1 regulates PSV replication caused by HS and how SDC1 affects the PSV life cycle need to be further investigated.
In conclusion, using proteomic analysis we found that the DEPs SPP1, IFIT5, ISG15, VCL, and SDC1 are significantly changed in PSV-infected PK-15 cells, suggesting that these proteins may be closely related to viral infection. Findings of these studies may provide a new reference for the prevention and control of PSV.

4. Materials and Methods

4.1. Cell Culture and Virus

PK-15 cells were cultured in Dulbecco’s minimal essential medium (DMEM) supplemented with 10% FBS (Gibco, Grand Island, NY, USA) at 37 °C. The PSV strain csh was isolated and preserved by our laboratory [4]. Virus stock was propagated in PK-15 cells and the virus titer was determined by the Reed–Muench method.

4.2. Virus Titration

PSV was added to PK-15 cells at a multiplicity of infection (MOI) = 2, and after 1.5 h of adsorption, culture medium was removed. Then the cells were washed twice with PBS, and fresh medium was added. For growth kinetics, at the indicated time post-infection, cytopathic effect was recorded and virus titers were calculated using the Reed–Muench method and recorded as TCID50/100 μL. For virus titration detection, PK-15 cells were transfected with SDC1 overexpression, SDC1 knockdown (30 pmol), or negative controls (pcDNA-NC or siNC). After transfection for 24 h, cells were infected with PSV (MOI = 2). At the indicated time, cells were harvested and cell lysates were collected for TCID50 analysis.

4.3. Protein Extraction

For quantitative proteomic analysis, PK-15 cells cultured in 150-mm cell culture dishes were infected with PSV (MOI = 2) or mock treated. At 8 h post-infection (hpi), cells were washed with prechilled PBS, collected with cell scrapers, resuspended in 500 μL of lysis buffer containing 1 mM protease inhibitor cocktail, incubated for 10 min on ice with gentle agitation, and centrifuged at 4000× g for 5 min at 4 °C.

4.4. Tandem Mass Tag (TMT) Labeling

For TMT labeling, the high-abundance proteins in the cell samples were removed using ProteoSeek™ Albumin/IgG removal kit (Thermo Fisher Scientific, Rockford, IL, USA) according to the manufacturer’s instructions. The cell samples were then extracted using SDT lysis buffer (4% SDS, 100 mM Tris/HCl pH = 7.6, 0.1 M DTT) [53]. Protein concentration in extracts was measured with the Bradford assay (Bio-Rad, Hercules, CA, USA), followed by filter-aided sample preparation digestion for peptide extraction with trypsin, as previously reported [53]. Peptides were then quantified spectrophotometrically at OD280, and 100 μg of each peptide sample was labeled with unique isobaric TMT reagents using TMT Mass Tagging kit (Thermo Fisher Scientific). Peptides of the mock-treated group for three biological repeats were labeled as TMT-126, TMT-127, and TMT-128, respectively, and three biological repeats of the virus group were labeled as TMT-129, TMT-130, and TMT-131, respectively.

4.5. High pH Reversed-Phase Fractionation

The labeled peptides of each group were equivalently mixed and then fractionated using high pH reversed-phase peptide fractionation kit (Thermo Fisher Scientific), as previously reported [54]. Briefly, the reversed-phase fractionation spin columns were first equilibrated with acetonitrile and 0.1% trifluoroacetic acid, followed by loading the labeled peptides into the columns. After adding ultrapure water into the columns, low-speed centrifugation was carried out for desalination. For desalination treatment, ultrapure water was added into the columns, followed by low-speed centrifugation. Then, gradient acetonitrile was used for fractions’ elution. The labeled peptides were finally collected, dried with a vacuum concentrator, and dissolved with 12 μL 0.1% formic acid. The concentration of each fractionation sample was quantified at an absorbance of OD280.

4.6. Liquid Chromatography–Mass Spectrometry (LC–MS/MS) Analysis

Reverse-phase separation was performed on a HPLC system (Easy nLC 1200, Thermo Scientific). The peptide mixture was loaded onto a reverse phase trap column (Thermo Scientific Acclaim PepMap100, 100 μm × 2 cm, nanoViper C18) connected to the C18-reversed phase analytical column (Thermo scientific EASY column, 10 cm, ID75 μm, 3 μm, C18-A2) in buffer A (0.1% formic acid) and separated with a linear gradient of buffer B (84% acetonitrile and 0.1% formic acid) at a flow rate of 300 nL/min by Intelli Flow technology.
The separated samples were analyzed using Q-Exactive mass spectrometry and Easy nLC (Proxeon Biosystems, now Thermo Fisher Scientific) for 1 h with positive ion mode as the mass spectrometer. Full MS scans were acquired in the mass range of 300–1800 m/z with a mass resolution of 70,000 at 200 m/z, an automatic gain control target value of 106, a maximum inject time of 50 ms, and dynamic exclusion duration of 60 s. Survey scans were acquired at a resolution of 70,000 at 200 m/z and resolution for higher energy collisional dissociation (HCD) spectra was set to 17,500 at 200 m/z, and the isolation width was 2 m/z. Normalized collision energy was 30 eV and the underfill ratio, which specifies the minimum percentage of the target value likely to be reached at maximum fill time, was defined as 0.1%.

4.7. Protein Identification and Quantitation

All MS raw data files were analyzed by Proteome Discoverer software 1.4 (Thermo Fisher Scientific) using the Mascot 2.2 search engine against a database of Mustela putorius furo protein sequences (NCBInr, released on 23 March 2017, containing 38,992 sequences). For protein identification, a fragment mass tolerance of 0.1 Da and with permission of two missed cleavages in the digests were allowed. Carbamidomethylation (C), TMT 6/10 plex (N-terminal), and TMT 6/10 plex (lysine, K) were set as the fixed modifications. The oxidation (methionine, M) and TMT 6/10 plex (tyrosine, Y) were set as the variable modifications, with peptide mass tolerances at ± 20 ppm for all MS1 spectra acquired and the value of false discovery rate was ≤ 0.01 [55]. A protein ratio was expressed as a median value of only unique peptides of the protein. All peptide ratios were normalized by the median protein ratio, and the median protein ratio should be “1” after the normalization.

4.8. Bioinformatics Analyses

Hierarchical clustering analysis of the differentially expressed proteins was performed based on Cluster 3.0 (http://bonsai.hgc.jp/~mdehoon/software/cluster/software.htm) and Java Treeview software (http://jtreeview.sourceforge.net) [56]. Euclidean distance algorithm for similarity measures and a clustering algorithm for averaged linkage (the centroids of the observations are necessary for clustering) were chosen during the process of hierarchical clustering. Gene ontology (GO) enrichment on three ontologies (biological process (BP), molecular function (MF), and cellular component (CC)) was applied based on Blast2GO (http://www.blast2go.de) [57]. Kyoto Encyclopedia of Genes and Genomes (KEGG) pathway annotation was extracted from the KEGG Automatic Annotation Server software [58]. The enrichment analyses for GO and KEGG annotations were performed using the Fisher’s exact test. Based on STRING (http://string-db.org/) database [59], the protein–protein interaction networks of the altered proteins were constructed and visualized using CytoScape software (version 3.2.1) [59]. The workflow of the LC-MS/MS and bioinformatics analyses is listed in Figure S1.

4.9. PRM Analysis

Based on the proteome results, four proteins (two up-regulated and two down-regulated) were selected for PRM validation. After the peptide samples were prepared, they were analyzed using Q-Exactive HF Plus (Thermo Fisher Scientific). A full mass spectrum was detected using the Orbitrap at a resolution of 60,000 (scan range: 300–1800 m/z), followed by 200 MS/MS scans using the Orbitrap at a resolution of 30,000 (200 m/z, automatic gain control target of 3 × 10⁶, maximum injection time of 120 ms, normalized collision energy of 27) in a data-independent procedure. The raw data of PRM were analyzed using Skyline 3.5.0 software.

4.10. The qRT-PCR

Total cellular RNA was extracted using TRIzol (Thermo Fisher Scientific) according to the manufacturer’s instructions. The cDNA was reverse-transcribed from 1 μg of total RNA using oligo(dT) primers (Vazyme Biotech Co., Nanjing, China). The qRT-PCR was carried out using SYBR Green master mix (Vazyme Biotech Co.) and specific primer (Table S8). Relative transcript levels were calculated using the ΔΔCt method. The relative expression values of the targeted gene were normalized to the expression value of GAPDH.

4.11. Plasmid and RNA Interference Transfection

The porcine SDC1 were amplified from the cDNA obtained from PK-15 cells. Plasmid expressing HA-tagged SDC1 was constructed by our laboratory and sequenced by Sangon (Shanghai, China). Small interfering RNAs (siRNAs) against Sus scrofa SDC1 (siSDC1, 5′-GGAAACCGUGGCCACAAAUTT-3′) and negative control (siNC, 5′-UUCUCCGAACGUGUCACGUTT-3′) were synthesized by GenePharma (Shanghai, China). PK-15 cells were first seeded on 24-well plates, plasmid or siRNA transfection was then performed with lipofectamine 6000 (Beyotime Biotechnology, Shanghai, China) according to the manufacturer’s instructions. The knockdown efficiencies of siSDC1 were quantified by RT-qPCR. At 28 h post-transfection, cells were infected with PSV (MOI = 2) for 8 h, and virus replication was detected by Western blot.

4.12. Western Blotting

Extracted protein mixtures were loaded into SDS gel and electrotransferred onto PVDF membranes. The membrane was blocked with 5% nonfat milk and incubated with mouse anti-PSV VP1 antibody (1:1000) or anti-HA antibody (1:5000) at 4 °C overnight. After washing for three times, the membrane was incubated with secondary antibodies conjugated to HRP (1:10000) for 1 h. The α-tubulin was used as a loading control. Finally, bands were developed with ECL prime Western blot detection reagent (GE Healthcare) and then quantified with Image Pro-Plus software.

4.13. Statistics

Statistical analysis was performed by SPSS version 22.0 (SPSS Inc., Chicago, IL, USA). Data are expressed as mean ± SD for at least two independent experiments. Statistical significance was tested using Student’s t-test to compare two groups and analysis of variance with Tukey’s post hoc test to compare more groups. The p < 0.05 was regarded as significant difference.

Supplementary Materials

Supplementary materials can be found at https://www.mdpi.com/1422-0067/21/12/4386/s1.

Author Contributions

Conceptualization, T.Z. and X.H.; data curation, X.Y.; formal analysis, T.Z. and L.C.; funding acquisition, X.H.; investigation, T.Z. and Z.Z.; methodology, T.Z.; project administration X.H.; resources, Z.Z. and Q.C.; software, Q.C.; supervision, L.C. and X.H.; writing—original draft, T.Z.; writing—review and editing, L.C. and X.H. All authors have read and agreed to the published version of the manuscript.

Funding

This work was supported by grant from the National Key Research and Development Program of China (No.2017YFC1200203) and the National Natural Science Foundation of China (31572525).

Conflicts of Interest

There is no conflict of interest.

Abbreviations

PSVPorcine sapelovirus A
MSMass spectrometry
TMT Tandem mass tag
PRMParallel reaction monitoring
SDC1Syndecan-1
DMEMDulbecco’s minimal essential medium
MOI Multiplicity of infection
hpiHour post-infection
GOGene ontology
BPBiological process
MFMolecular function
CCCellular component
KEGGKyoto Encyclopedia of Genes and Genomes
siRNAsSmall interfering RNAs
NCNegative control
CPEsCytopathogenic effects
DEPsDifferentially expressed proteins
SPP1Osteopontin
IFIT5Induced protein with tetratricopeptide repeats 5
ISG15ISG15 ubiquitin-like modifier
VCLVinculin

References

  1. Stanway, G. Structure, function and evolution of picornaviruses. J. Gen. Virol. 1990, 71, 2483–2501. [Google Scholar] [CrossRef] [PubMed]
  2. Arruda, P.; Arruda, B.; Schwartz, K.; Vannucci, F.; Resende, T.; Rovira, A.; Sundberg, P.; Nietfeld, J.; Hause, B. Detection of a novel sapelovirus in central nervous tissue of pigs with polioencephalomyelitis in the USA. Transbound. Emerg. Dis. 2017, 64, 311–315. [Google Scholar] [CrossRef] [PubMed]
  3. Chen, J.; Chen, F.; Zhou, Q.; Li, W.; Song, Y.; Pan, Y.; Zhang, X.; Xue, C.; Bi, Y.; Cao, Y. Complete genome sequence of a novel porcine Sapelovirus strain YC2011 isolated from piglets with diarrhea. J. Virol. 2012, 86, 10898. [Google Scholar] [CrossRef] [Green Version]
  4. Lan, D.; Ji, W.; Yang, S.; Cui, L.; Yang, Z.; Yuan, C.; Hua, X. Isolation and characterization of the first Chinese porcine sapelovirus strain. Arch. Virol. 2011, 156, 1567–1574. [Google Scholar] [CrossRef]
  5. Kim, D.-S.; Son, K.-Y.; Koo, K.-M.; Kim, J.-Y.; Alfajaro, M.M.; Park, J.-G.; Hosmillo, M.; Soliman, M.; Baek, Y.-B.; Cho, E.-H. Porcine sapelovirus uses α2, 3-linked sialic acid on GD1a ganglioside as a receptor. J. Virol. 2016, 90, 4067–4077. [Google Scholar] [CrossRef] [PubMed] [Green Version]
  6. Bai, H.; Liu, J.; Fang, L.; Kataoka, M.; Takeda, N.; Wakita, T.; Li, T.C. Characterization of porcine sapelovirus isolated from Japanese swine with PLC/PRF/5 cells. Transbound. Emerg. Dis. 2018, 65, 727–734. [Google Scholar] [CrossRef] [PubMed]
  7. Zhao, T.; Cui, L.; Yu, X.; Zhang, Z.; Shen, X.; Hua, X. Entry of sapelovirus into IPEC-J2 cells is dependent on caveolae-mediated endocytosis. Virol. J. 2019, 16, 019–1144. [Google Scholar] [CrossRef] [PubMed]
  8. An, K.; Fang, L.; Luo, R.; Wang, D.; Xie, L.; Yang, J.; Chen, H.; Xiao, S. Quantitative proteomic analysis reveals that transmissible gastroenteritis virus activates the JAK-STAT1 signaling pathway. J. Proteome Res. 2014, 13, 5376–5390. [Google Scholar] [CrossRef]
  9. Xin, Q.-L.; Deng, C.-L.; Chen, X.; Wang, J.; Wang, S.-B.; Wang, W.; Deng, F.; Zhang, B.; Xiao, G.; Zhang, L.-K. Quantitative proteomic analysis of mosquito C6/36 cells reveals host proteins involved in Zika virus infection. J. Virol. 2017, 91, e00554-17. [Google Scholar] [CrossRef] [Green Version]
  10. Lan, J.; Zhang, R.; Yu, H.; Wang, J.; Xue, W.; Chen, J.; Lin, S.; Wang, Y.; Xie, Z.; Jiang, S. Quantitative Proteomic Analysis Uncovers the Mediation of Endoplasmic Reticulum Stress-Induced Autophagy in DHAV-1-Infected DEF Cells. Int. J. Mol. Sci. 2019, 20, 6160. [Google Scholar] [CrossRef] [Green Version]
  11. Zhang, S.; Wang, J.; Zhu, L.; Toufeeq, S.; Xu, X.; You, L.; Li, B.; Hu, P.; Xu, J. Quantitative label-free proteomic analysis reveals differentially expressed proteins in the digestive juice of resistant versus susceptible silkworm strains and their predicted impacts on BmNPV infection. J. Proteom. 2020, 210, 103527. [Google Scholar] [CrossRef] [PubMed]
  12. Zhong, C.; Li, J.; Mao, L.; Liu, M.; Zhu, X.; Li, W.; Sun, M.; Ji, X.; Xiao, F.; Yang, L.; et al. Proteomics analysis reveals heat shock proteins involved in caprine parainfluenza virus type 3 infection. BMC Vet. Res. 2019, 15, 019–1897. [Google Scholar] [CrossRef] [PubMed]
  13. Morrissey, B.; Downard, K.M. A proteomics approach to survey the antigenicity of the influenza virus by mass spectrometry. Proteomics 2010, 6, 2034–2041. [Google Scholar] [CrossRef]
  14. Miao, M.; Yu, F.; Wang, D.; Tong, Y.; Yang, L.; Xu, J.; Qiu, Y.; Zhou, X.; Zhao, X. Proteomics Profiling of Host Cell Response via Protein Expression and Phosphorylation upon Dengue Virus Infection. Virol. Sin. 2019, 34, 549–562. [Google Scholar] [CrossRef]
  15. Hao, J.; Guo, H.; Shi, X.; Wang, Y.; Wan, Q.; Song, Y.-B.; Zhang, L.; Dong, M.; Shen, C. Comparative proteomic analyses of two Taxus species (Taxus× media and Taxus mairei) reveals variations in the metabolisms associated with paclitaxel and other metabolites. Plant. Cell Physiol. 2017, 58, 1878–1890. [Google Scholar] [CrossRef]
  16. Teng, Y.H.; Aquino, R.S.; Park, P.W. Molecular functions of syndecan-1 in disease. Matrix Biol. 2012, 31, 3–16. [Google Scholar] [CrossRef] [Green Version]
  17. Hu, S.; Li, Z.; Lan, Y.; Guan, J.; Zhao, K.; Chu, D.; Fan, G.; Guo, Y.; Gao, F.; He, W. MiR-10a-5p-Mediated Syndecan 1 Suppression Restricts Porcine Hemagglutinating Encephalomyelitis Virus Replication. Front. Microbiol. 2020, 11. [Google Scholar] [CrossRef] [Green Version]
  18. Zhao, T.; Cui, L.; Yu, X.; Zhang, Z.; Shen, X.; Hua, X. Porcine sapelovirus enters PK-15 cells via caveolae-dependent endocytosis and requires Rab7 and Rab11. Virology 2019, 529, 160–168. [Google Scholar] [CrossRef]
  19. Lum, K.K.; Cristea, I.M. Proteomic approaches to uncovering virus–host protein interactions during the progression of viral infection. Expert Rev. Proteom. 2016, 13, 325–340. [Google Scholar] [CrossRef]
  20. Yang, F.; Li, W.; Derbyshire, M.; Larsen, M.R.; Rudd, J.J.; Palmisano, G. Unraveling incompatibility between wheat and the fungal pathogen Zymoseptoria tritici through apoplastic proteomics. BMC Genom. 2015, 16, 362. [Google Scholar] [CrossRef] [Green Version]
  21. Scaturro, P.; Stukalov, A.; Haas, D.A.; Cortese, M.; Draganova, K.; Plaszczyca, A.; Bartenschlager, R.; Gotz, M.; Pichlmair, A. An orthogonal proteomic survey uncovers novel Zika virus host factors. Nature 2018, 561, 253–257. [Google Scholar] [CrossRef]
  22. Liu, R.; Hu, X.; Lu, A.; Song, Y.; Lian, Z.; Sun, J.; Sung, Y.Y. Proteomic Profiling of Zebrafish Challenged by Spring Viremia of Carp Virus Provides Insight into Skin Antiviral Response. Zebrafish 2020, 16. [Google Scholar] [CrossRef] [PubMed]
  23. Fensterl, V.; Sen, G.C. The ISG56/IFIT1 gene family. J. Interferon Cytokine Res. 2011, 31, 71–78. [Google Scholar] [CrossRef] [PubMed]
  24. Jin, B.; Jin, H.; Wang, J. WITHDRAWN: Silencing of Interferon-Induced Transmembrane Protein 1 (IFITM1) Inhibits Proliferation, Migration, and Invasion in Lung Cancer Cells. Oncol Res. 2017, 20. [Google Scholar] [CrossRef]
  25. Terenzi, F.; Saikia, P.; Sen, G.C. Interferon-inducible protein, P56, inhibits HPV DNA replication by binding to the viral protein E1. Embo J. 2008, 27, 3311–3321. [Google Scholar] [CrossRef] [Green Version]
  26. Santhakumar, D.; Rohaim, M.; Hussein, H.A.; Hawes, P.; Ferreira, H.L.; Behboudi, S.; Iqbal, M.; Nair, V.; Arns, C.W.; Munir, M. Chicken Interferon-induced Protein with Tetratricopeptide Repeats 5 Antagonizes Replication of RNA Viruses. Sci. Rep. 2018, 8, 018–24905. [Google Scholar] [CrossRef] [Green Version]
  27. Baldanta, S.; Fernandez-Escobar, M.; Acin-Perez, R.; Albert, M.; Camafeita, E.; Jorge, I.; Vazquez, J.; Enriquez, J.A.; Guerra, S. ISG15 governs mitochondrial function in macrophages following vaccinia virus infection. PLoS Pathog. 2017, 13. [Google Scholar] [CrossRef]
  28. Zhao, C.; Hsiang, T.Y.; Kuo, R.L.; Krug, R.M. ISG15 conjugation system targets the viral NS1 protein in influenza A virus-infected cells. Proc. Natl Acad Sci USA 2010, 107, 2253–2258. [Google Scholar] [CrossRef] [Green Version]
  29. Gonzalez-Sanz, R.; Mata, M.; Bermejo-Martin, J.; Alvarez, A.; Cortijo, J.; Melero, J.A.; Martinez, I. ISG15 Is Upregulated in Respiratory Syncytial Virus Infection and Reduces Virus Growth through Protein ISGylation. J. Virol. 2016, 90, 3428–3438. [Google Scholar] [CrossRef] [Green Version]
  30. Liu, H.; Li, S.; Yang, X.; Wang, X.; Li, Y.; Wang, C.; Chen, L.; Chang, H. Porcine ISG15 modulates the antiviral response during pseudorabies virus replication. Gene 2018, 679, 212–218. [Google Scholar] [CrossRef]
  31. Chen, L.; Sun, J.; Meng, L.; Heathcote, J.; Edwards, A.M.; McGilvray, I.D. ISG15, a ubiquitin-like interferon-stimulated gene, promotes hepatitis C virus production in vitro: Implications for chronic infection and response to treatment. J. Gen. Virol. 2010, 91, 382–388. [Google Scholar] [CrossRef]
  32. Moal, V.; Textoris, J.; Ben Amara, A.; Mehraj, V.; Berland, Y.; Colson, P.; Mege, J.L. Chronic hepatitis E virus infection is specifically associated with an interferon-related transcriptional program. J. Infect. Dis 2013, 207, 125–132. [Google Scholar] [CrossRef] [Green Version]
  33. Syn, W.K.; Choi, S.S.; Liaskou, E.; Karaca, G.F.; Agboola, K.M.; Oo, Y.H.; Mi, Z.; Pereira, T.A.; Zdanowicz, M.; Malladi, P.; et al. Osteopontin is induced by hedgehog pathway activation and promotes fibrosis progression in nonalcoholic steatohepatitis. Hepatology 2011, 53, 106–115. [Google Scholar] [CrossRef] [Green Version]
  34. Brown, A.; Islam, T.; Adams, R.; Nerle, S.; Kamara, M.; Eger, C.; Marder, K.; Cohen, B.; Schifitto, G.; McArthur, J.C.; et al. Osteopontin enhances HIV replication and is increased in the brain and cerebrospinal fluid of HIV-infected individuals. J. Neurovirol. 2011, 17, 382–392. [Google Scholar] [CrossRef] [Green Version]
  35. Choi, S.S.; Claridge, L.C.; Jhaveri, R.; Swiderska-Syn, M.; Clark, P.; Suzuki, A.; Pereira, T.A.; Mi, Z.; Kuo, P.C.; Guy, C.D.; et al. Osteopontin is up-regulated in chronic hepatitis C and is associated with cellular permissiveness for hepatitis C virus replication. Clin. Sci. 2014, 126, 845–855. [Google Scholar] [CrossRef] [Green Version]
  36. Paul, A.M.; Acharya, D.; Duty, L.; Thompson, E.A.; Le, L.; Stokic, D.S.; Leis, A.A.; Bai, F. Osteopontin facilitates West Nile virus neuroinvasion via neutrophil “Trojan horse” transport. Sci. Rep. 2017, 7, 4722. [Google Scholar] [CrossRef]
  37. Ziegler, W.H.; Liddington, R.C.; Critchley, D.R. The structure and regulation of vinculin. Trends Cell Biol. 2006, 16, 453–460. [Google Scholar] [CrossRef] [PubMed]
  38. Zhang, L.; Jia, X.; Zhang, X.; Sun, J.; Lu, H. Proteomic analysis of PBMCs: Characterization of potential HIV-associated proteins. Proteome Sci. 2010, 8, 12. [Google Scholar] [CrossRef] [Green Version]
  39. Brown, C.; Morham, S.; Walsh, D.; Naghavi, M. Focal adhesion proteins talin-1 and vinculin negatively affect paxillin phosphorylation and limit retroviral infection. J. Mol. Biol. 2011, 410, 761–777. [Google Scholar] [CrossRef] [PubMed]
  40. Reijmers, R.M.; Spaargaren, M.; Pals, S.T. Heparan sulfate proteoglycans in the control of B cell development and the pathogenesis of multiple myeloma. Febs J. 2013, 280, 2180–2193. [Google Scholar] [CrossRef]
  41. Hoffmann, C.; Tiemann, M.; Schrader, C.; Janssen, D.; Wolf, E.; Vierbuchen, M.; Parwaresch, R.; Ernestus, K.; Plettenberg, A.; Stoehr, A.; et al. AIDS-related B-cell lymphoma (ARL): Correlation of prognosis with differentiation profiles assessed by immunophenotyping. Blood 2005, 106, 1762–1769. [Google Scholar] [CrossRef] [Green Version]
  42. Dhodapkar, M.V.; Sanderson, R.D. Syndecan-1 (CD 138) in myeloma and lymphoid malignancies: A multifunctional regulator of cell behavior within the tumor microenvironment. Leuk Lymphoma 1999, 34, 35–43. [Google Scholar] [CrossRef]
  43. Hayashida, K.; Stahl, P.D.; Park, P.W. Syndecan-1 ectodomain shedding is regulated by the small GTPase Rab5. J. Biol. Chem. 2008, 283, 35435–35444. [Google Scholar] [CrossRef] [Green Version]
  44. Bacsa, S.; Karasneh, G.; Dosa, S.; Liu, J.; Valyi-Nagy, T.; Shukla, D. Syndecan-1 and syndecan-2 play key roles in herpes simplex virus type-1 infection. J. Gen. Virol. 2011, 92, 733–743. [Google Scholar] [CrossRef]
  45. Freissler, E.; Meyer auf der Heyde, A.; David, G.; Meyer, T.F.; Dehio, C. Syndecan-1 and syndecan-4 can mediate the invasion of OpaHSPG-expressing Neisseria gonorrhoeae into epithelial cells. Cell Microbiol. 2000, 2, 69–82. [Google Scholar] [CrossRef] [Green Version]
  46. Wang, S.H.; Zhang, C.; Liao, C.P.; Lasbury, M.E.; Durant, P.J.; Tschang, D.; Lee, C.H. Syndecan-1 expression in the lung during Pneumocystis infection. J. Eukaryot Microbiol. 2006, 53, 1550–7408. [Google Scholar] [CrossRef]
  47. Anastasiadou, E.; Vaeth, S.; Cuomo, L.; Boccellato, F.; Vincenti, S.; Cirone, M.; Presutti, C.; Junker, S.; Winberg, G.s.; Frati, L. Epstein–Barr virus infection leads to partial phenotypic reversion of terminally differentiated malignant B cells. Cancer lett. 2009, 284, 165–174. [Google Scholar] [CrossRef] [PubMed]
  48. Couchman, J.R. Syndecans: Proteoglycan regulators of cell-surface microdomains? Nat. Rev. Mol. Cell Biol. 2003, 4, 926–937. [Google Scholar] [CrossRef]
  49. Letoha, T.; Kolozsi, C.; Ekes, C.; Keller-pintér, A.; Kusz, E.; Szakonyi, G.; Duda, E.; Szilák, L. Contribution of syndecans to lipoplex-mediated gene delivery. Eur. J. Pharm. Sci. 2013, 49, 550–555. [Google Scholar] [CrossRef]
  50. Hulst, M.M.; van Gennip, H.G.; Moormann, R.J. Passage of classical swine fever virus in cultured swine kidney cells selects virus variants that bind to heparan sulfate due to a single amino acid change in envelope protein E(rns). J. Virol. 2000, 74, 9553–9561. [Google Scholar] [CrossRef] [Green Version]
  51. Hulst, M.M.; van Gennip, H.G.; Vlot, A.C.; Schooten, E.; de Smit, A.J.; Moormann, R.J. Interaction of classical swine fever virus with membrane-associated heparan sulfate: Role for virus replication in vivo and virulence. J. Virol. 2001, 75, 9585–9595. [Google Scholar] [CrossRef] [Green Version]
  52. Grigorov, B.; Reungoat, E.; Gentil Dit Maurin, A.; Varbanov, M.; Blaising, J.; Michelet, M.; Manuel, R.; Parent, R.; Bartosch, B.; Zoulim, F.; et al. Hepatitis C virus infection propagates through interactions between Syndecan-1 and CD81 and impacts the hepatocyte glycocalyx. Cell Microbiol. 2017, 19, 23. [Google Scholar] [CrossRef] [Green Version]
  53. Wiśniewski, J.R.; Zougman, A.; Nagaraj, N.; Mann, M. Universal sample preparation method for proteome analysis. Nat. Methods 2009, 6, 359. [Google Scholar] [CrossRef]
  54. Wei, Y.; Fang, C.-L.; Liu, S.-J.; Yang, W.-Q.; Wei, L.-S.; Lei, X.-J.; Hu, F.; Huang, H.-Y.; Li, W.; Chen, W. Long-term moderate exercise enhances specific proteins that constitute neurotrophin signaling pathway: A TMT-based quantitative proteomic analysis of rat plasma. J. Proteom. 2018, 185, 39–50. [Google Scholar] [CrossRef]
  55. Gluck, F.; Hoogland, C.; Antinori, P.; Robin, X.; Nikitin, F.; Zufferey, A.; Pasquarello, C.; Fétaud, V.; Dayon, L.; Müller, M.; et al. EasyProt--an easy-to-use graphical platform for proteomics data analysis. J. Proteomics 2013, 79, 146–160. [Google Scholar] [CrossRef]
  56. Chiang, D.Y.; Brown, P.O.; Eisen, M.B. Visualizing associations between genome sequences and gene expression data using genome-mean expression profiles. Bioinformatics 2001, 17, S49–S55. [Google Scholar] [CrossRef] [Green Version]
  57. Dennis, G., Jr.; Sherman, B.T.; Hosack, D.A.; Yang, J.; Gao, W.; Lane, H.C.; Lempicki, R.A. DAVID: Database for Annotation, Visualization, and Integrated Discovery. Genome Biol. 2003, 4, 3. [Google Scholar] [CrossRef]
  58. Kanehisa, M.; Sato, Y.; Kawashima, M.; Furumichi, M.; Tanabe, M. KEGG as a reference resource for gene and protein annotation. Nucleic Acids Res. 2016, 44, 17. [Google Scholar] [CrossRef] [Green Version]
  59. Shannon, P.; Markiel, A.; Ozier, O.; Baliga, N.S.; Wang, J.T.; Ramage, D.; Amin, N.; Schwikowski, B.; Ideker, T. Cytoscape: A software environment for integrated models of biomolecular interaction networks. Genome Res. 2003, 13, 2498–2504. [Google Scholar] [CrossRef]
Figure 1. Sapelovirus A (PSV) infection in pig kidney (PK)-15 cells. (A) PK-15 cells were mock-treated or treated with PSV at a multiplicity of infection (MOI) of 2, and the cytopathogenic effects at indicated time were observed. Bars, 50 μm. (B) One-step growth curve of PSV in PK-15 cells. (C) Western blotting assay of PSV virus protein (VP)1 expression in PK-15 cells at the indicated time points (2–12 h). The α-tubulin was used as a sample loading control. Data are expressed as mean ± SD for two independently experiments.
Ijms 21 04386 g001
Figure 2. Volcano plot and the hierarchical clustering involved in the differentially expressed proteins (DEPs). (A) Volcano plot showed the levels of DEPs detected in mock-treated or PSV-infected groups. X axis, mean log2(ratio of fold change); y axis, log10(p-value); red balls, DEPs between the two groups (p < 0.05 and ratio > 2 or <0.5). (B) Hierarchical cluster of 181 DEPs with 1.2-fold up-regulation and 0.85-fold down-regulation. The proteins were classified into two categories with opposite directional variation, suggesting the screening rationality of DEPs. Different color indicated different fold change. Red: Highly expressed, blue: Lowly expressed, and white: No change.
Ijms 21 04386 g002
Figure 3. Top 20 enriched, differentially expressed proteins processed of gene ontology (GO) terms and enriched Kyoto Encyclopedia of Genes and Genomes (KEGG) pathways in PSV-infected PK-15 cells. (A) GO annotation of the DEPs. BP: Biological process; MF: Molecular function; CC: Cellular component. (B) Enriched KEGG pathways. The number on the top of each column represents enrichment factor. The color of the bar chart indicates the p value based on Fisher’s exact test.
Ijms 21 04386 g003
Figure 4. Subcellular locations of the DEPs in PK-15 cells infected with PSV.
Ijms 21 04386 g004
Figure 5. Protein-protein interaction networks were constructed based on the DEPs. The yellow nodes indicate the DEPs, and the lines are protein-protein interactions.
Ijms 21 04386 g005
Figure 6. DEPs including induced protein with tetratricopeptide repeats 5 (A, IFIT5), vinculin (B, VCL), nucleoporin (C, NUP153), and syndecan-1 (D, SDC1) were verified using PRM and the virus/control (V/C) ratio was compared with the TMT result. Data are expressed as mean ± SD for three replicates.
Ijms 21 04386 g006
Figure 7. The expression of the indicated genes and kinetics in PK-15 cells infected with PSV for 4 h and 8 h was measured by RT-qPCR. Data are shown as mean ± SD for two experiments; * p < 0.05, ** p < 0.01.
Ijms 21 04386 g007
Figure 8. The effect of syndecan-1 (SDC1) on PSV replication. (A) After 24 h transfection with pcDNA-HA empty or HA-SDC1, PK-15 cells were infected with PSV (MOI = 2), cells were lysed, and virus VP1 proteins were analyzed by Western blot. (B) The effect of siRNA against SDC1 was determined by RT-qPCR. (C) PK-15 cells were untreated or transfected with siNC, 20 pmol, 30 pmol, or 40 pmol siSDC1. At indicated time after transfection, cells were infected with PSV and processed for Western blot. (D) Virus titers were determined by 50% tissue culture infective doses (TCID50) of samples prepared at 8 h post-infection from PK-15 cells infected with PSV after transfection with pcDNA-HA empty, HA-SDC1, siNC, or 30 pmol siSDC1. Two independent experiments were performed. The ** p < 0.01 compared with siNC or pcDNA-HA group. The # p < 0.05, ## p < 0.01 compared with 20 pmol group.
Ijms 21 04386 g008
Table 1. The significantly up-regulated and down-regulated differentially expressed proteins (top 20) in PK-15 cells infected with Sapelovirus A.
AccessionDescriptionCoverageUnique PeptidesFold-Change Ratiosp-Value
Up-regulated
A0A286ZSR7Olfactory receptor2.5613.029.2167 × 10−5
 F1RTV4Amidophosphoribosyltransferase1.912.804.2788 × 10−5
 I3LEQ6Ral GTPase activating protein catalytic alpha subunit 22.1312.060.0111
 F1RL90PPARG coactivator 1 beta1.5611.880.0194
 A0A287BN67Nucleosome assembly protein 1 like 121.9311.840.0020
 A0A287AZH1Nucleosome assembly protein 1 like 427.7391.710.0017
 A0A287ATX4Wiskott-Aldrich syndrome like1.5811.640.0054
 A0A286ZN07Charged multivesicular body protein 4A10.3621.630.0007
 F1RRI4Sjogren syndrome/scleroderma autoantigen 17.5421.560.0030
 F1SU38Urokinase-type plasminogen activator16.2961.509.07 × 10−5
 S5A7T7SP110 nuclear body protein variant 28.6711.460.0181
 F2Z572Phosphoribosyl pyrophosphate synthetase 118.5521.440.0146
 A0A0B8RSH5Nuclear mitotic apparatus protein 145.0721.440.0002
 F1RYV0Cyclin dependent kinase like 21.2311.390.0438
 A0A287BRG2Required for excision 1-B domain containing4.1511.390.0333
 O77637Transcription factor NFAT (Fragment)15.8321.350.0028
 P26234Vinculin 55.15591.340.0028
 F1SCY0Interferon induced protein with tetratricopeptide repeats 56.0231.330.0006
 Q4VK70Glycogen [starch] synthase (Fragment)3.9121.330.0037
 A0A287AB58Ubiquitin-like modifier19.1631.320.0095
Down-regulated
 Q56PB8RPGR (Fragment)1.3810.350.0012
 I3LQ36Uncharacterized protein7.3810.600.0015
A0A287BF68Nucleoporin 15314.79180.630.0007
A0A0B8RSR5Interleukin enhancer binding factor 336.6110.640.0044
 K7GNF5Syndecan4.8510.650.0014
 F1SB63T-complex protein 1 subunit alpha54.9210.650.0016
A0A286ZQL5NOVA alternative splicing regulator 21.6310.680.0043
A0A287BPS0SET domain containing 21.430.680.0080
A0A287ACY9Uncharacterized protein4.9340.691.4560 × 10−5
 F1SFU1PHD finger protein 233.3110.690.0016
A0A286ZVL0Heterogeneous nuclear ribonucleoprotein U45.2130.690.0025
 I3LIL0Nucleoporin like 24.3110.702.6992 × 10−5
 Q8HZJ6Syndecan-435.6450.700.0070
 C8ZL57Activating transcription factor 6 (Fragment)10.7510.700.0001
 F1S8L9Heterogeneous nuclear ribonucleoprotein U44.6520.700.0047
 F1SL26Tumor necrosis factor receptor superfamily member 1A2.6310.710.0096
 F1SDY8Zinc finger CCCH-type containing 1424.5140.713.3193 × 10−5
 A0A286ZJK2Heterogeneous nuclear ribonucleoprotein M55.86390.720.0005
 I3LLM2Olfactory receptor2.3110.730.0010
 F1SD01Cleavage stimulation factor subunit 2 tau variant11.8730.730.0014

