Article

CCR5-Mediated Signaling is Involved in Invasion of Glioblastoma Cells in Its Microenvironment

1
Department of Genetic Toxicology and Cancer Biology, National Institute of Biology, 1000 Ljubljana, Slovenia
2
Jožef Stefan International Postgraduate School, 1000 Ljubljana, Slovenia
3
Department of Neurosurgery, University Medical Centre Ljubljana, 1000 Ljubljana, Slovenia
4
Institute of Pathology, Faculty of Medicine, University of Ljubljana, 1000 Ljubljana, Slovenia
5
Department of Biotechnology and Systems Biology, National Institute of Biology, 1000 Ljubljana, Slovenia
6
Pennsylvania Cancer and Regenerative Medicine Research Center, Baruch S. Blumberg Institute, Pennsylvania Biotechnology Center, Wynnewood, PA 19096, USA
7
Faculty of Chemistry and Chemical Technology, University of Ljubljana, 1000 Ljubljana, Slovenia
*
Authors to whom correspondence should be addressed.
Int. J. Mol. Sci. 2020, 21(12), 4199; https://doi.org/10.3390/ijms21124199
Submission received: 15 May 2020 / Revised: 1 June 2020 / Accepted: 8 June 2020 / Published: 12 June 2020
(This article belongs to the Special Issue Molecular Biology of Brain Tumors)

Abstract

:
The chemokine CCL5/RANTES is a versatile inflammatory mediator, which interacts with the receptor CCR5, promoting cancer cell interactions within the tumor microenvironment. Glioblastoma is a highly invasive tumor, in which CCL5 expression correlates with shorter patient survival. Using immunohistochemistry, we identified CCL5 and CCR5 in a series of glioblastoma samples and cells, including glioblastoma stem cells. CCL5 and CCR5 gene expression were significantly higher in a cohort of 38 glioblastoma samples, compared to low-grade glioma and non-cancerous tissues. The in vitro invasion of patients-derived primary glioblastoma cells and glioblastoma stem cells was dependent on CCL5-induced CCR5 signaling and is strongly inhibited by the small molecule CCR5 antagonist maraviroc. Invasion of these cells, which was enhanced when co-cultured with mesenchymal stem cells (MSCs), was inhibited by maraviroc, suggesting that MSCs release CCR5 ligands. In support of this model, we detected CCL5 and CCR5 in MSC monocultures and glioblastoma-associated MSC in tissue sections. We also found CCR5 expressing macrophages were in close proximity to glioblastoma cells. In conclusion, autocrine and paracrine cross-talk in glioblastoma and, in particular, glioblastoma stem cells with its stromal microenvironment, involves CCR5 and CCL5, contributing to glioblastoma invasion, suggesting the CCL5/CCR5 axis as a potential therapeutic target that can be targeted with repositioned drug maraviroc.

1. Introduction

Glioblastoma is one of the most aggressive brain tumors and poorly responsive malignancies to treatment with among the shortest survival rates of all cancers [1]. Patients’ 5-year survival rate is less than 5% [2], regardless of novel modalities in surgery, irradiation, and chemotherapy [3,4].
A high rate of relapse is mostly due to the resistance of glioblastoma stem cells (GSCs) and their heterogeneity and plasticity that are contributing to the resistance of recurrent tumors [3,5,6]. Tumor heterogeneity is due to both the variety of glioblastoma subtypes [7,8] and the presence of different types of stromal cells of the tumor microenvironment (TME), both contributing to the inter- and intra-tumor heterogeneity, respectively [9,10]. GSCs have an important role in the development, growth, and aggressiveness of glioblastoma, due to their efficient DNA repair mechanisms, heterogeneity, cell plasticity [5], and cooperation with differentiated glioblastoma cells [11]. In tumor tissues, GSCs are maintained in hypoxic and peri-arteriolar GSC niches [12,13] where the TME contributes to paracrine interactions with endothelial cells [12]. The brain TME is comprised not only of resident astrocytes, neurons, and microglial cells but also infiltrating mesenchymal stem cells (MSCs), hematopoietic stem cells (HSC), and differentiated immune cells, such as macrophages [9], altogether comprising so-called tumor stroma. Understanding these selective interactions between non-cancerous so-called stromal and glioblastoma cells is crucial for the effectiveness of treatment strategies.
These cellular interactions are mediated by proteins, called cytokines, of which a large family of chemokines is mediating chemoattraction between cells [14,15]. For example, the attraction between endothelial and glioblastoma cells is maintained by CXCL12 (SDF-1α) binding to the CXCR4 receptor [12] and cytokines, expressed by tumor or stromal cells, best known for their part in mediating leukocyte trafficking and lymphoid tissue development [16,17]. Outer cell membrane-bound chemokine receptors that all belong to the broader family of G-protein coupled receptors (GPCR), bind usually to a related group of chemokines that have a significant role in in the progression of cancer, in the shaping of the tumor microenvironment and is involved in invasion and metastasis [17]. Moreover, chemokines have an affinity for several chemokine receptors. The chemokine CCL5, originally termed RANTES (regulated on activation, normal T cell expressed, and secreted) is a CC chemokine ligand 5, both known for his role in inflammatory diseases and cancer progression [8,18,19,20]. The chemokine CCL5 also binds to CCR1, CCR3, and CCR5 chemokines receptors (C-C motif receptors 1, 3, and 5) and to the G protein-coupled receptor 75 (GPR75) [21,22]. CCR5/CCL5 signaling has been extensively described by us [8,19,20,22] and others [18,21] and acts via calcium signaling. The role of both CCL5 and CCR5 has been elucidated in many types of cancers, expressed by cancer cells as well as non-cancerous cells in the TME [21,23,24,25]. In glioblastoma high levels of CCR5, CXCR4, CXCR7, CCR7, and CCR10 are linked to poor prognosis [26].
The first evidence that chemokines and receptors, like CCR3 and CCR5 in human glioblastoma, may promote cell growth, was proposed by Kouno et al. [27] in 2004. In 2015, Zhao et al. [28] suggested a potential role of CCR5 receptor in glioblastoma proliferation and invasion as CCR5 was over-expressed during glioma progression to glioblastoma, correlating with reduced progression-free and overall survival [28]. Moogooei et al. [29] reported that CCL5 (and CCL2) were elevated in serum and tissues of glioblastoma patients at both mRNA and protein levels, and proposed these chemokines as predictors for disease severity and response to treatment. However, the authors suggested that the main sources of circulatory and tissue CCL5 were likely activated macrophages and T cells, which may contribute to the tumor expansion. The evidence that interactions between CCL5 and CCR5 guide infiltration of monocytes, macrophages, and MSCs into tumors, has recently been reviewed [8]. Thus CCL5-receptors signaling can favor cancer progression either directly by affecting proliferation, migration, and cell survival of cancer cells, or indirectly, by recruiting pro-tumor and/or anti-inflammatory effector cells. Yet the key relevance of autocrine vs. paracrine CCL5/CCR5 singling axis in glioblastoma progression remains poorly understood and was therefore addressed in this study.
Here, we hypothesized a correlation between CCR5 and CCL5 protein levels in individual patient-derived glioblastoma tissues, with respect to CCR5 vs. CCL5 distribution. We also explored the distribution of CCR5 and CCL5 among gliomas of different stages. Addressing the inter-tumoral heterogeneity of glioblastomas, using gene analyses, we defined four distinct glioblastoma subtypes [7]: the proneural (PN), mesenchymal (MES), neural (N), classical (CL), and mixed GB subtype, where two or more subtypes are present within a single tumor [10]. As these subtypes reportedly differ in survival rate, being the shortest in the MES subtype, and as cancer invasion was found associated with CCL5/CCR5 axis signaling, we hypothesized that CCR5 and/or CCL5 distribution would be significantly different in GB subtypes. As the role of CCL5/CCR5 expression in glioblastoma stem cell expansion had not been investigated, we investigated the role of CCR5 expression in tumor invasiveness. Herein, the synthetic CCR5 small molecule inhibitor maraviroc, currently in clinical trials targeting metastatic breast and colon cancer [22], was tested here for inhibition of glioblastoma invasion. Finally, we addressed glioblastoma intra-tumor heterogeneity, due to stromal cells’ interactions by analyzing CCL5/CCR5 expression in tumor-associated macrophages and tumor-associated MSCs. We show that MSC enhances glioblastoma and stem cell matrix invasion via CCR5.

2. Results

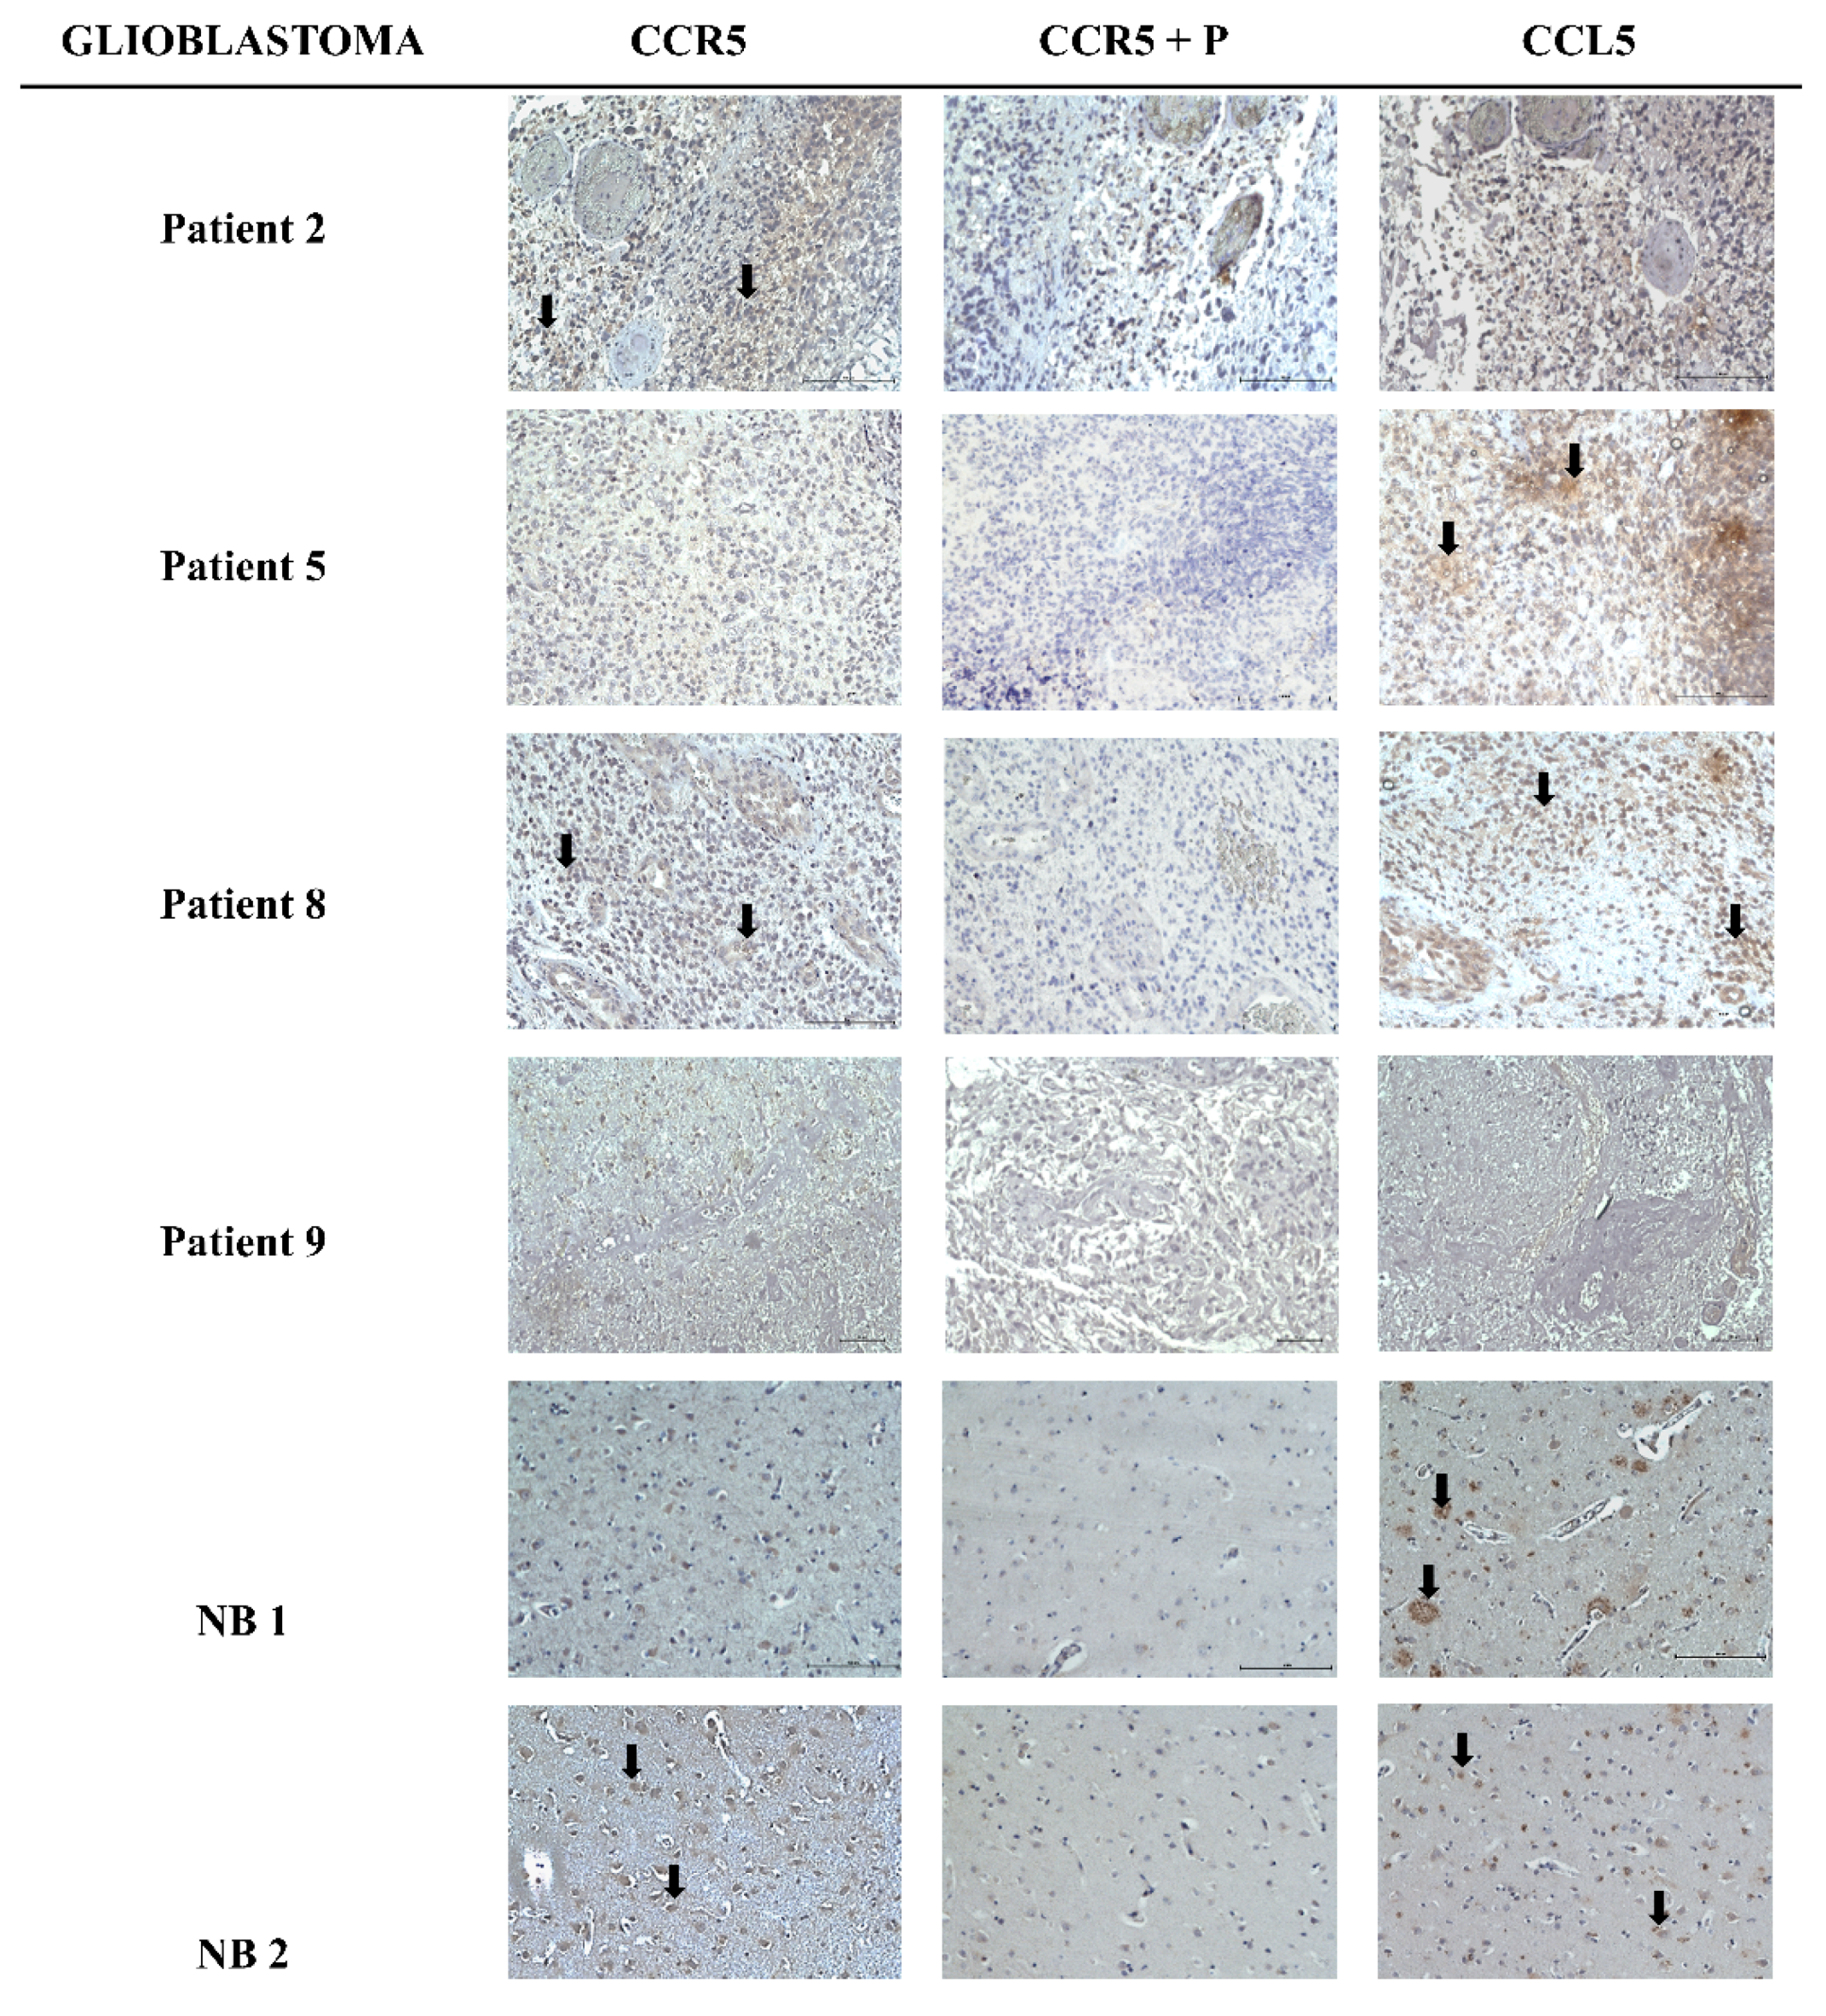
2.1. Heterogeneous Expression of CCL5/CCR5 Axis in Glioblastoma Tissue Sections

Glioblastoma tissue sections were obtained from the Institute of Pathology, Medical Faculty, University of Ljubljana. To confirm the expression of CCL5/CCR5 signaling axis, we performed immunohistochemistry (IHC) on a total of 8 tissue sections of GB patients, of which 4 are shown along with two non-cancer brain sections (NB1 and NB2) in Figure 1. In tissue sections, CCR5 was expressed in 50% of the cases in around 30% of the cells. Non-cancer sample NB2 had a weak expression of CCR5 in more than 33% of the cells, while the other NB1 sample had no expression of CCR5. CCL5 was more abundant, expressed in 50% of brain tissue samples with strong intensity, including NB1 and NB2 samples. The sample patient Nb. 8 had a strong expression of CCL5 and weak expression of CCR5. Sample patient Nb. 9 was negative for both CCR5 and CCL5. Both proteins were localized in the cytoplasm of tumor-associated astrocytes. The quantification of IHC analyses is presented in Table 1. Clinical and histological parameters of glioblastoma patient samples, used in this study, are presented in Table 2.

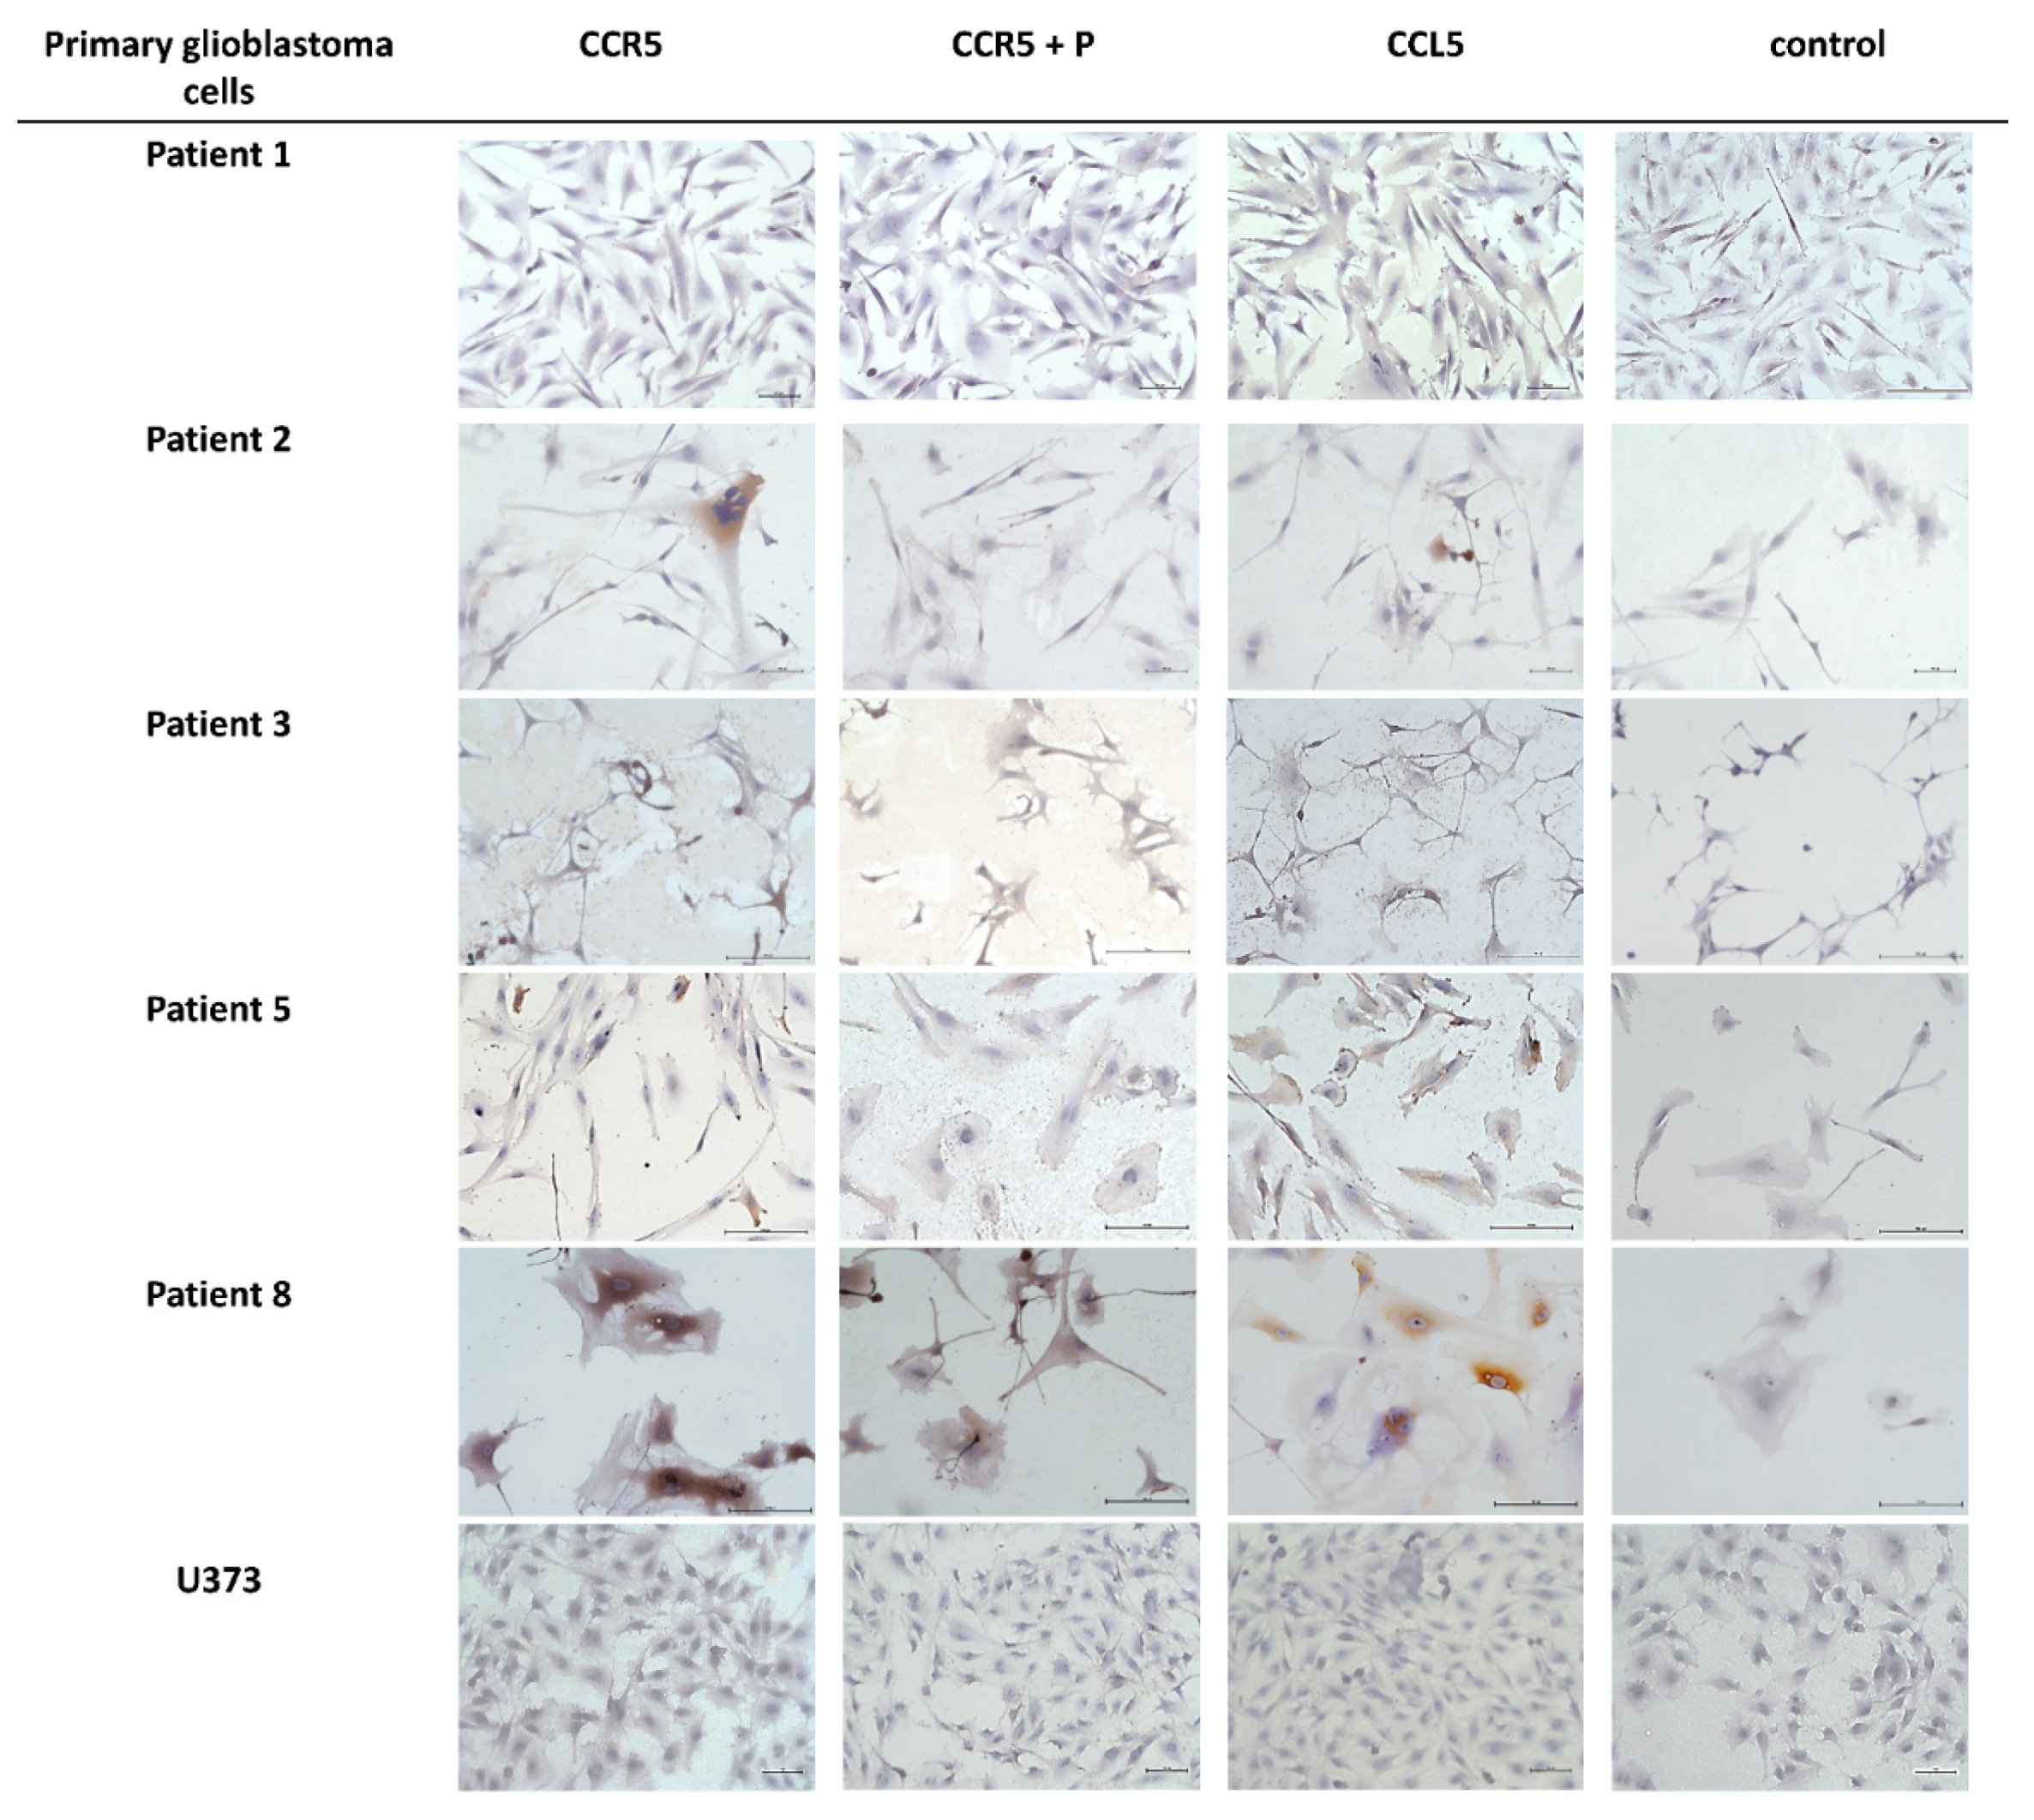
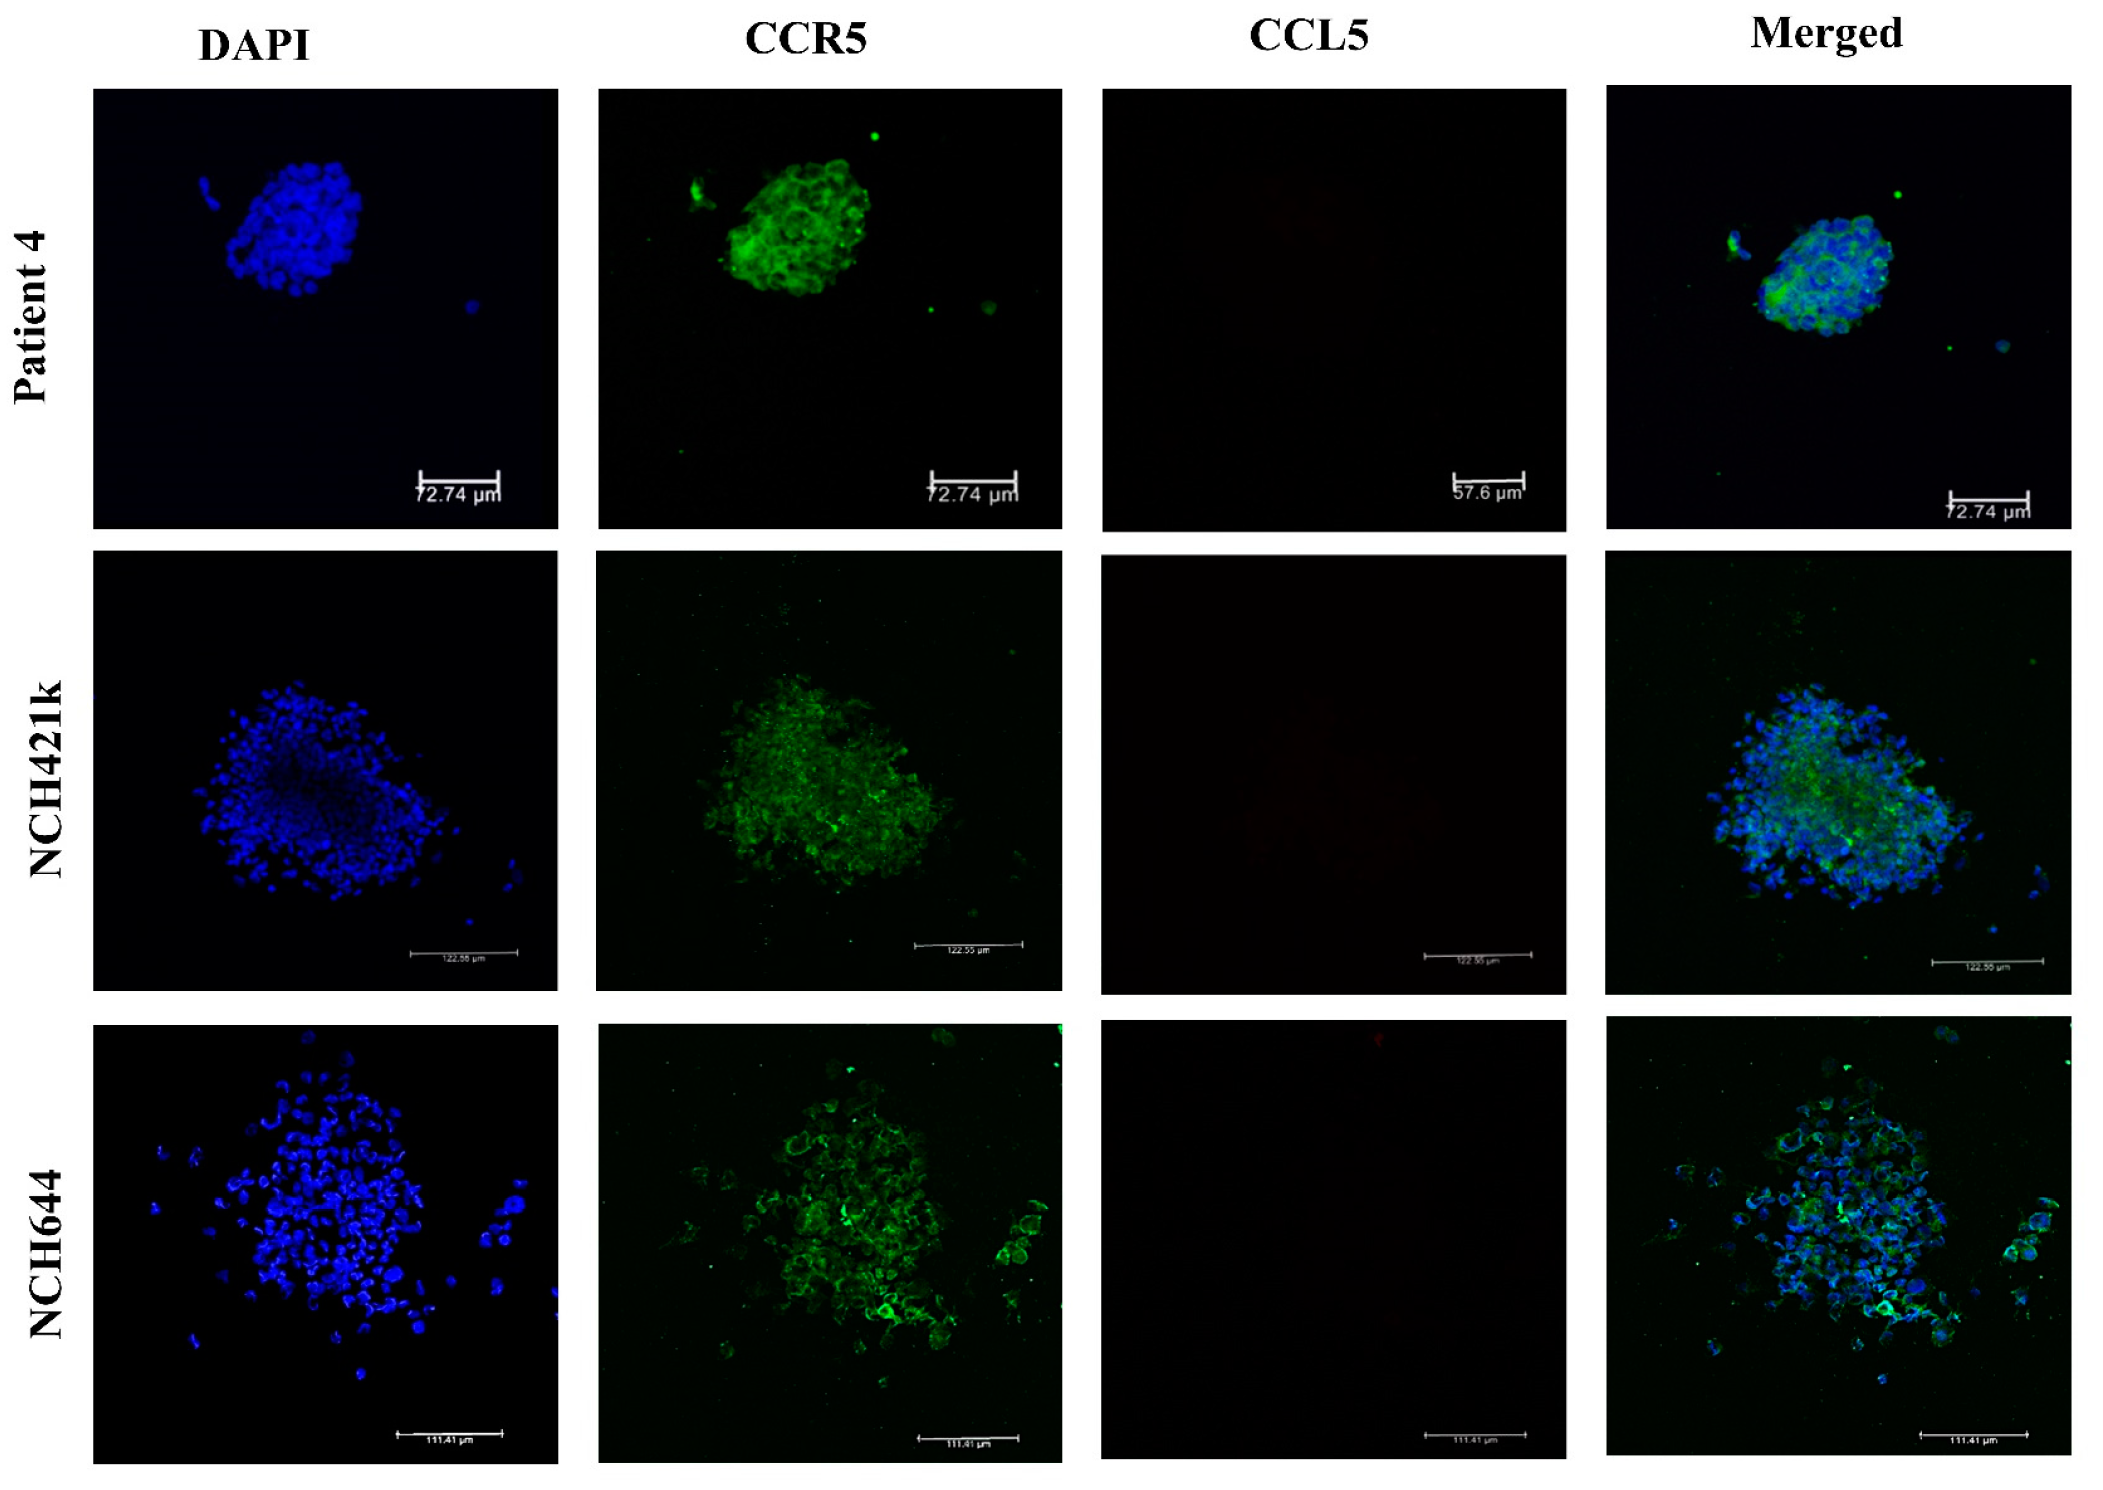
2.2. Expression of CCL5/CCR5 Axis in Primary Glioblastoma Cells and Glioblastoma Stem Cells

To further investigate the cellular origin of CCL5 and CCR5 in glioblastoma tissues, using IHC we screened for the expression of CCL5 and CCR5 in primary differentiated glioblastoma cells and glioblastoma stem cells (GSCs) that were cultured from patients’ tumors. Brain tissue samples from glioblastoma patients were obtained from the Department of Neurosurgery of the University Medical Centre, University of Ljubljana. These tumor samples were either used for the generation of primary glioblastoma cells and GSC or were frozen upon tumor removal for RNA extraction. GSC cells and the two previously established CD133+ GSC lines, NCH644, and NCH421k were grown as spheroid suspensions in serum-free, complete Neurobasal Medium as described by Podergajs [30]. Spheroids were fluorescently labeled for CCL5 and CCR5 expression as described in Materials and Methods. The ICC analyses are shown in Figure 2. The quantification scoring analyses revealed that the chemokine expression seems to be higher compared to the receptor and that very low or no CCL5 nor CCR5 expression was observed in patient Nb. 3 and in the U373 cell line (Table 3). In the three glioblastoma stem cells (GSCs) spheroids, high CCR5 protein expression was seen, but CCL5 could not be detected even using more sensitive detection by immunofluorescence (Figure 3). Normal astrocytes do not express CCL5 nor CCR5 (Figure S2).

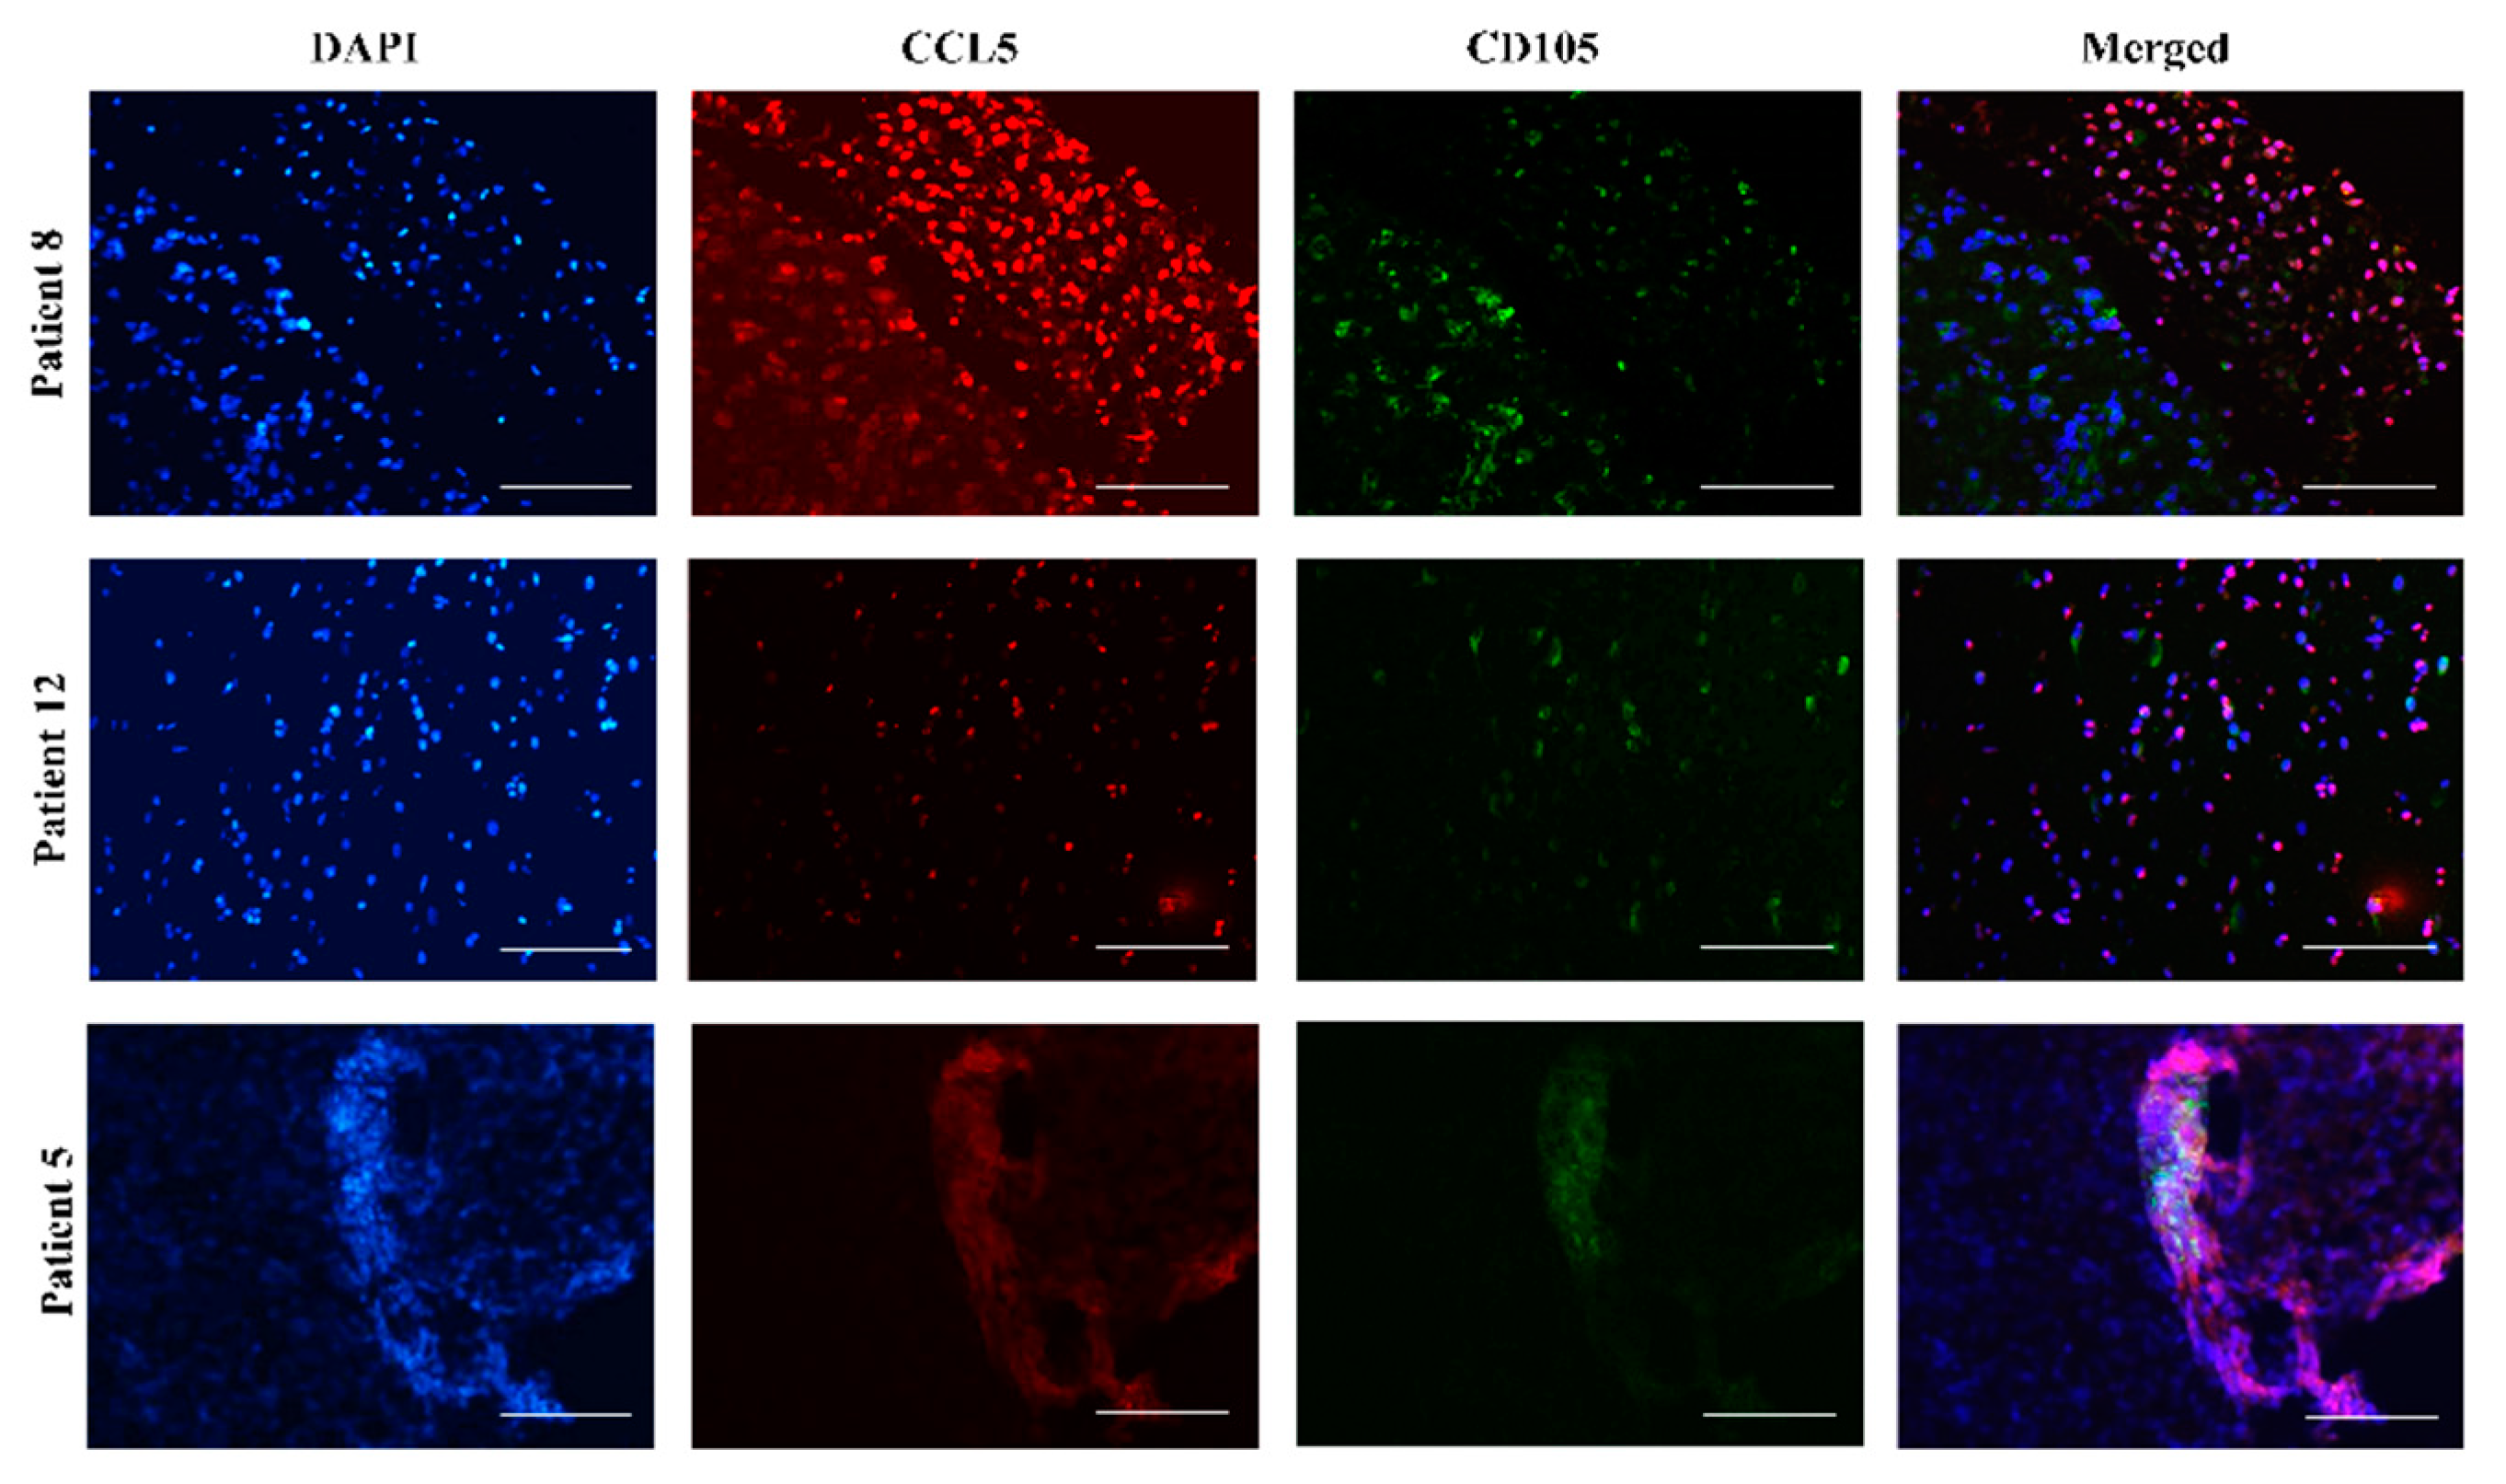
2.3. Mesenchymal Stem Cells In Vitro and In Vivo Tumor Sections Express CCL5

The tumor progression of glioblastoma induces a host response, which is associated with the infiltration of stromal cells, e.g., bone-marrow-derived mesenchymal stem cells (MSC) and hematopoietic stem cells (HSC) and their progenitors, comprising various mature lymphocytes, macrophages [12,31]. Previous studies have shown that MSCs, homing to glioblastoma can de-differentiate to other stromal cells via paracrine effectors, such as immunomodulatory cytokines, or by direct interactions with GB cells [32]. Moreover, we have demonstrated that human MSCs exploit the immune response mediating chemokines to impact the phenotype of glioblastoma [32,33] and later described complex mechanisms of their indirect [14,34] and/or direct cross-talk [35,36]. Here, we were interested if MSC were alone and when in glioblastoma microenvironment express CCL5 and CCR5. Therefore, we have immunolabeled bone marrow-derived MSCs in monocultures by CCL5 and CCR5 antibodies and demonstrated high expression of both antigens in MSCs (Figure S1). Furthermore, labeling these antigens of tissue sections from 3 patients, (Nb. 8, Nb. 12, and Nb. 5), we found that CCL5 expression was co-localized with MSC marker CD105 (Figure 4).

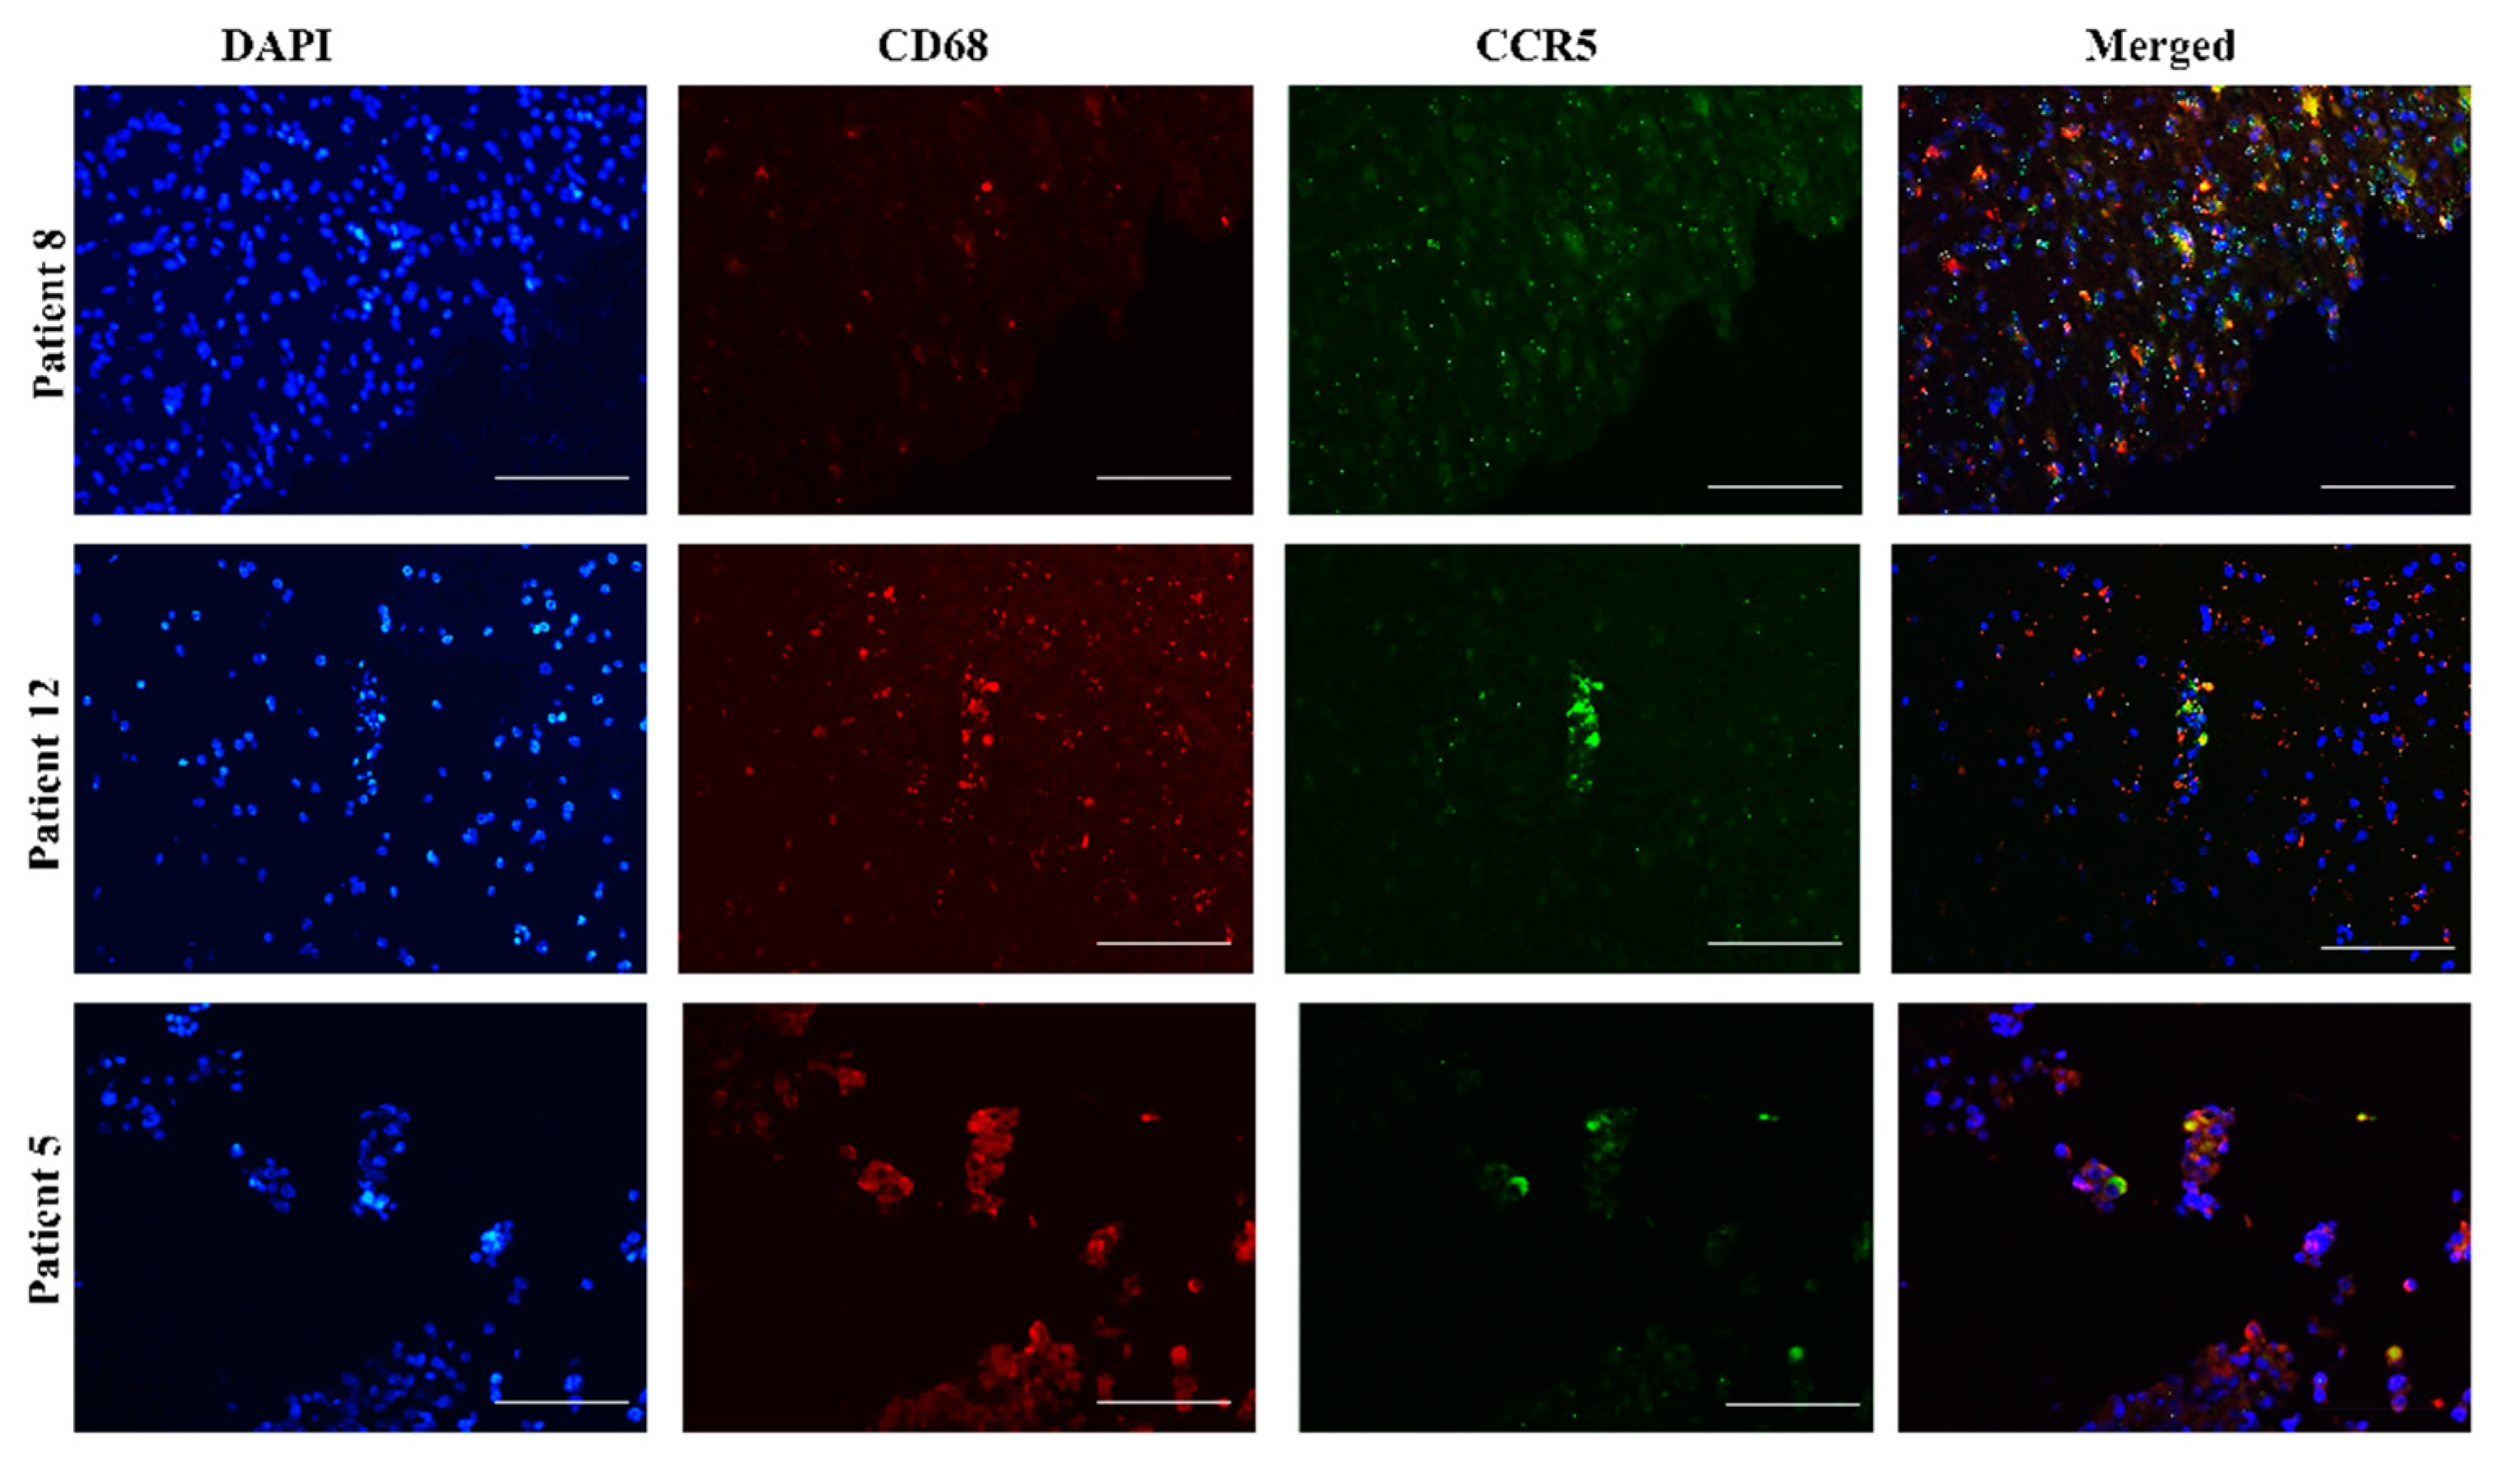
2.4. CCR5 Is Expressed in Glioblastoma-Associated Macrophages in Tumors

Cross-talk of glioblastoma cells with microglia and infiltrating macrophages occurs through the release of cytokines, which promote tumor growth [14,35,37]. Tumor-associated macrophages represent about 40% of all cells in a glioblastoma specimen [38] and microglia-mediated immunosuppression may involve CCL5/CCR5 via CCR5 signaling on macrophages to induce their activation and polarization [39]. Fluorescence immunohistochemical staining of tissue sections of 3 patients (Nb. 8, Nb. 12, and Nb. 5) revealed the expression of CCR5 in glioblastoma-associated macrophages, labeled by the antibody specific marker CD68 (Figure 5).

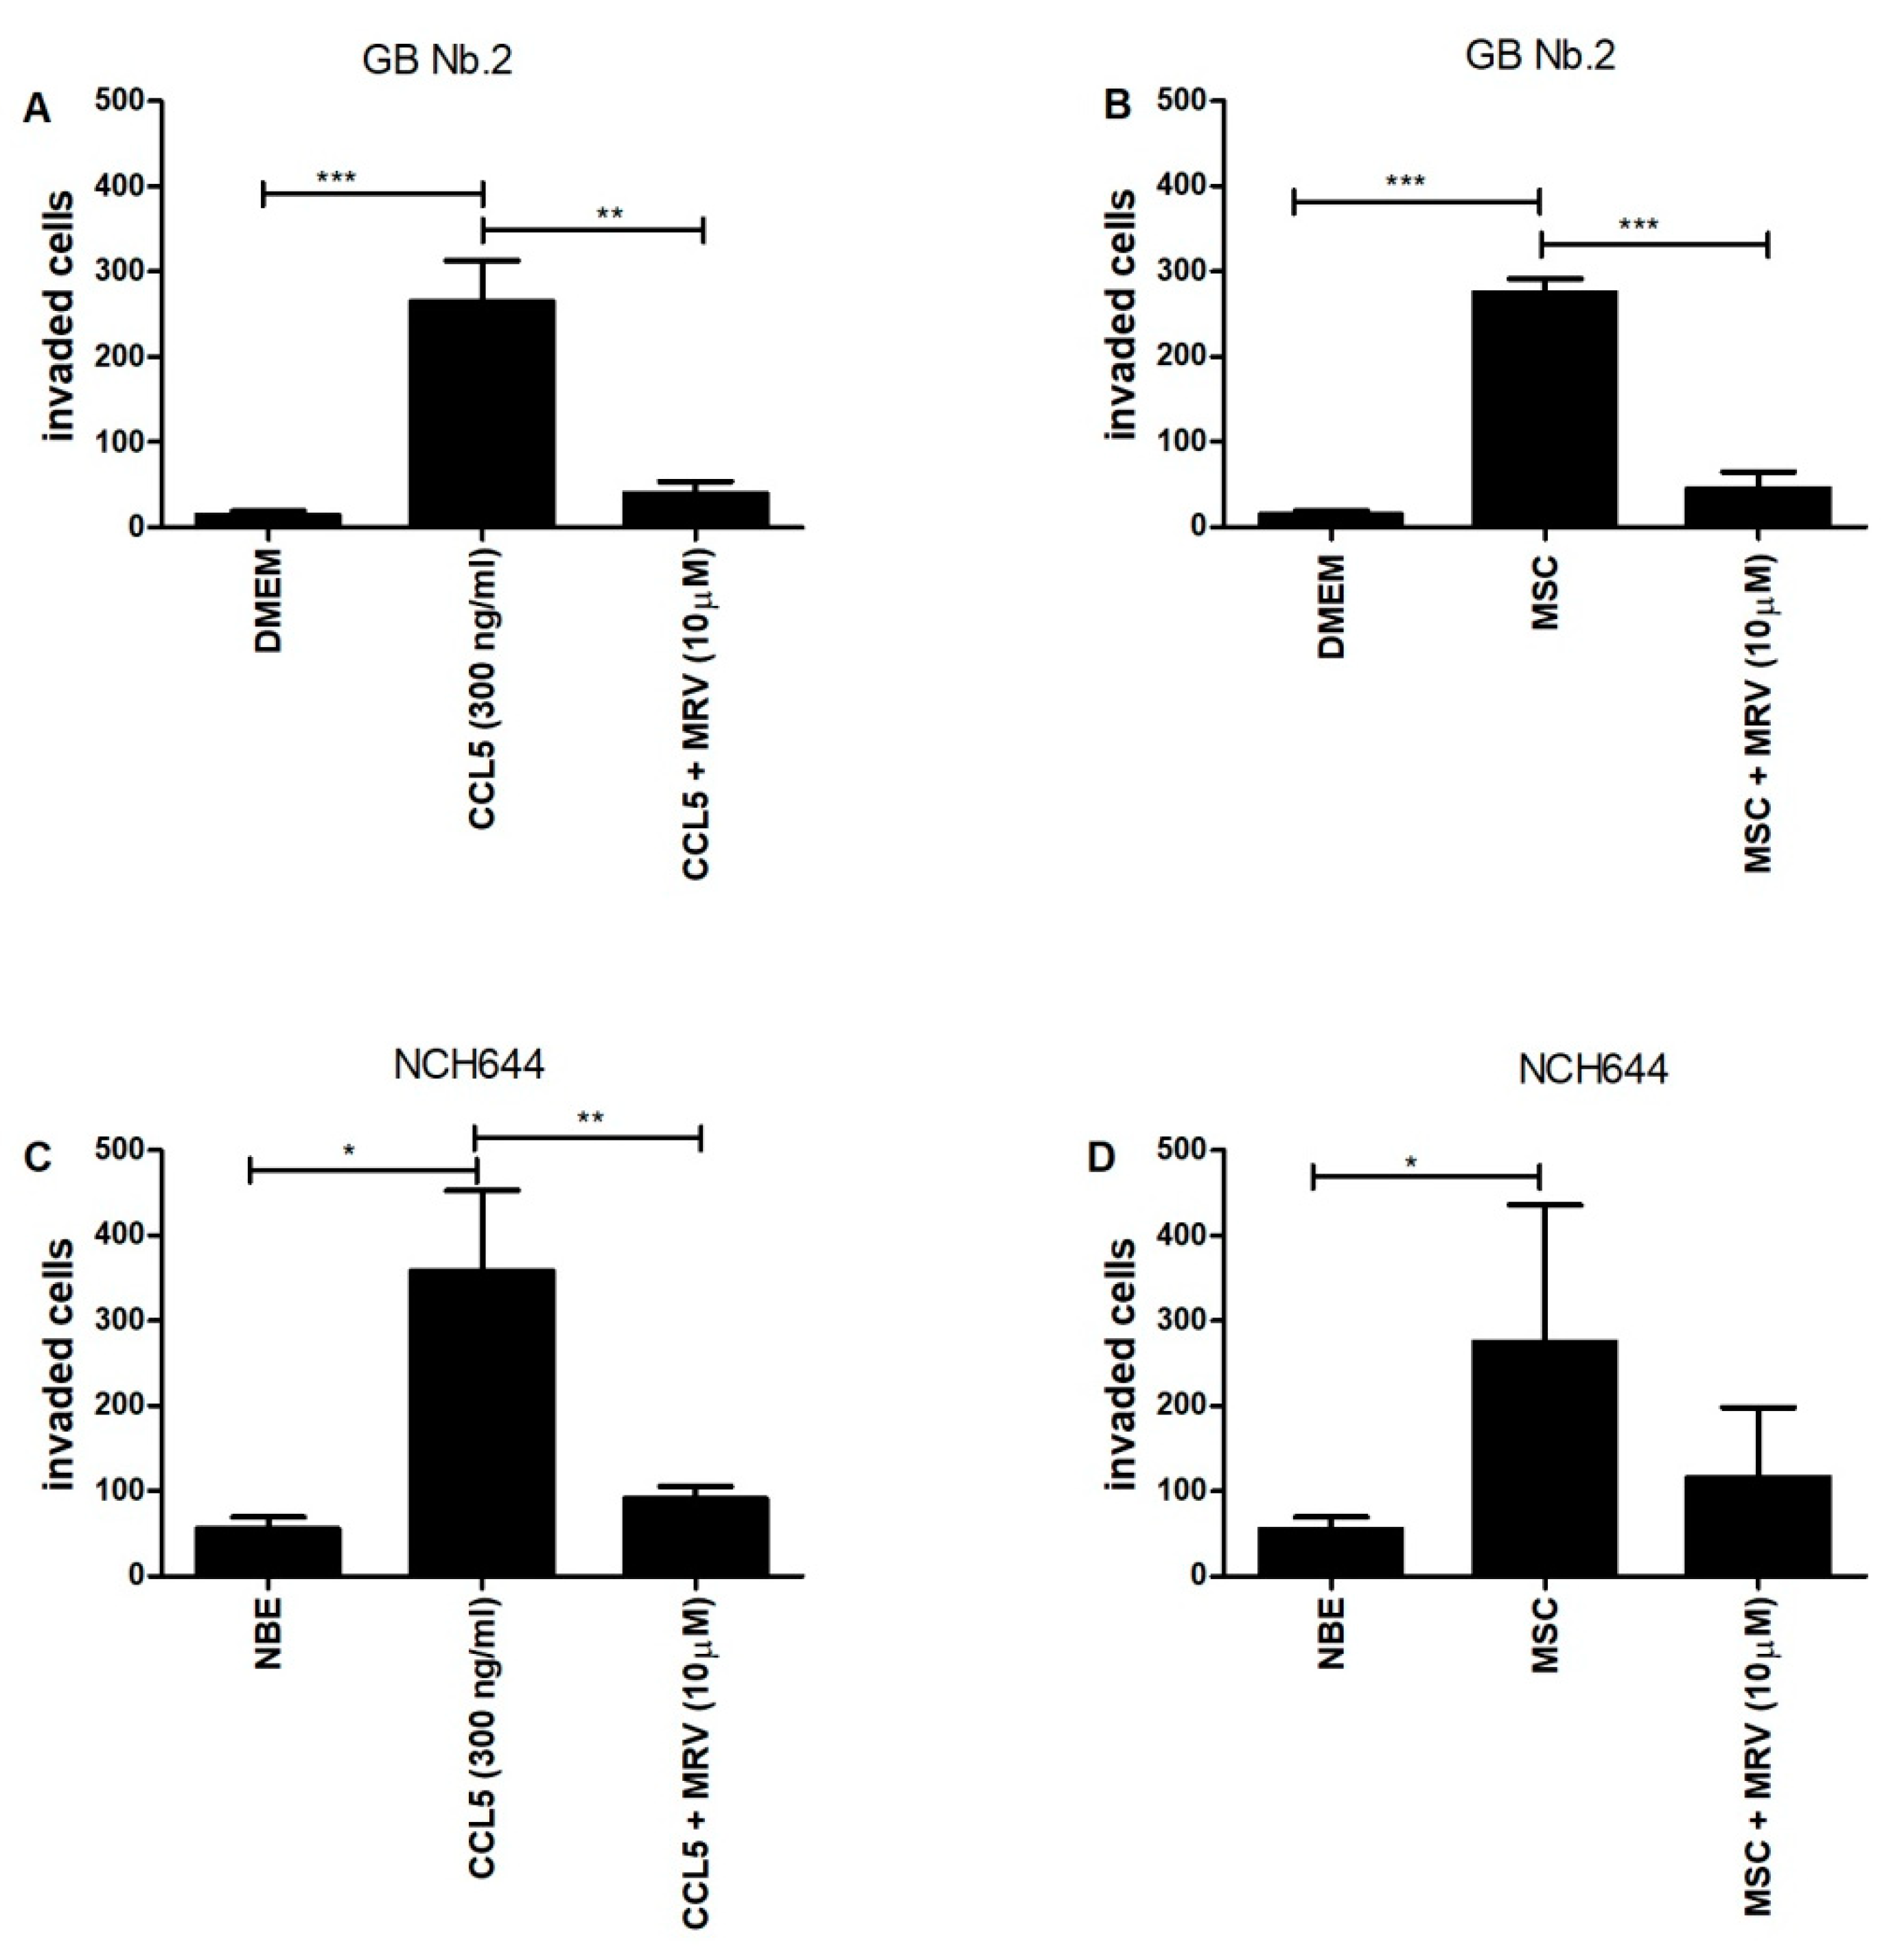
2.5. CCL5 and Mesenchymal Stem Cells Enhance the Invasion of Primary Glioblastoma Cells and Glioblastoma Stem Cells

Glioblastoma cell invasion that has been characterized as a single cell infiltration into the brain parenchyma is crucially supported by its microenvironment comprised of stromal cells. Previously, we have mostly studied mesenchymal stem cells (MSCs), affecting glioblastoma cell phenotype via paracrine interactions, secreting cytokines as demonstrated by Motaln et al. [34] and Breznik et al. [36]. Here, we focused on revealing the functional significance of the CCL5/CCR5 axis in paracrine, i.e., indirect MSC-GB cell interaction, such as invasion. Transwell chambers invasion assays were used to investigate primary GB cells from patient Nb. 2, which expressed high CCR5, but very low CCL5 antigens (Figure 2).
After the cells were stimulated with recombinant human chemokine CCL5, added to the lower chamber, Matrigel invading cells were quantified as described in Methods. The invasion was inhibited by synthetic CCR5 antagonist maraviroc added to the cells in the upper chamber (Figure 6A). When CCL5-expressing MSCs (Figure S1) were added to the lower transwell compartment as a chemoattractant, GB Nb.2 cells’ invasion was significantly enhanced and was also inhibited by maraviroc (Figure 6B). Noteworthy, GB Nb.2 cell viability was not affected by maraviroc even at higher concentrations (Figure S3). Further, we validated the functional role of the CCL5/CCR5 axis in the invasion of established GSC line NCH644, which expresses CCR5 but low or no CCL5 (Figure 3). GSCs were stimulated with recombinant human chemokine CCL5 and their invasion in the presence or absence of maraviroc was quantified as above (Figure 6C). When CCL5-expressing MSCs were used as a chemoattractant in the lower chamber, GSCs invasion was significantly enhanced but was remarkably inhibited by the CCR5 inhibitor maraviroc (Figure 6D). The significance was not reached here, due to the higher variance among biological repetitive experiments.

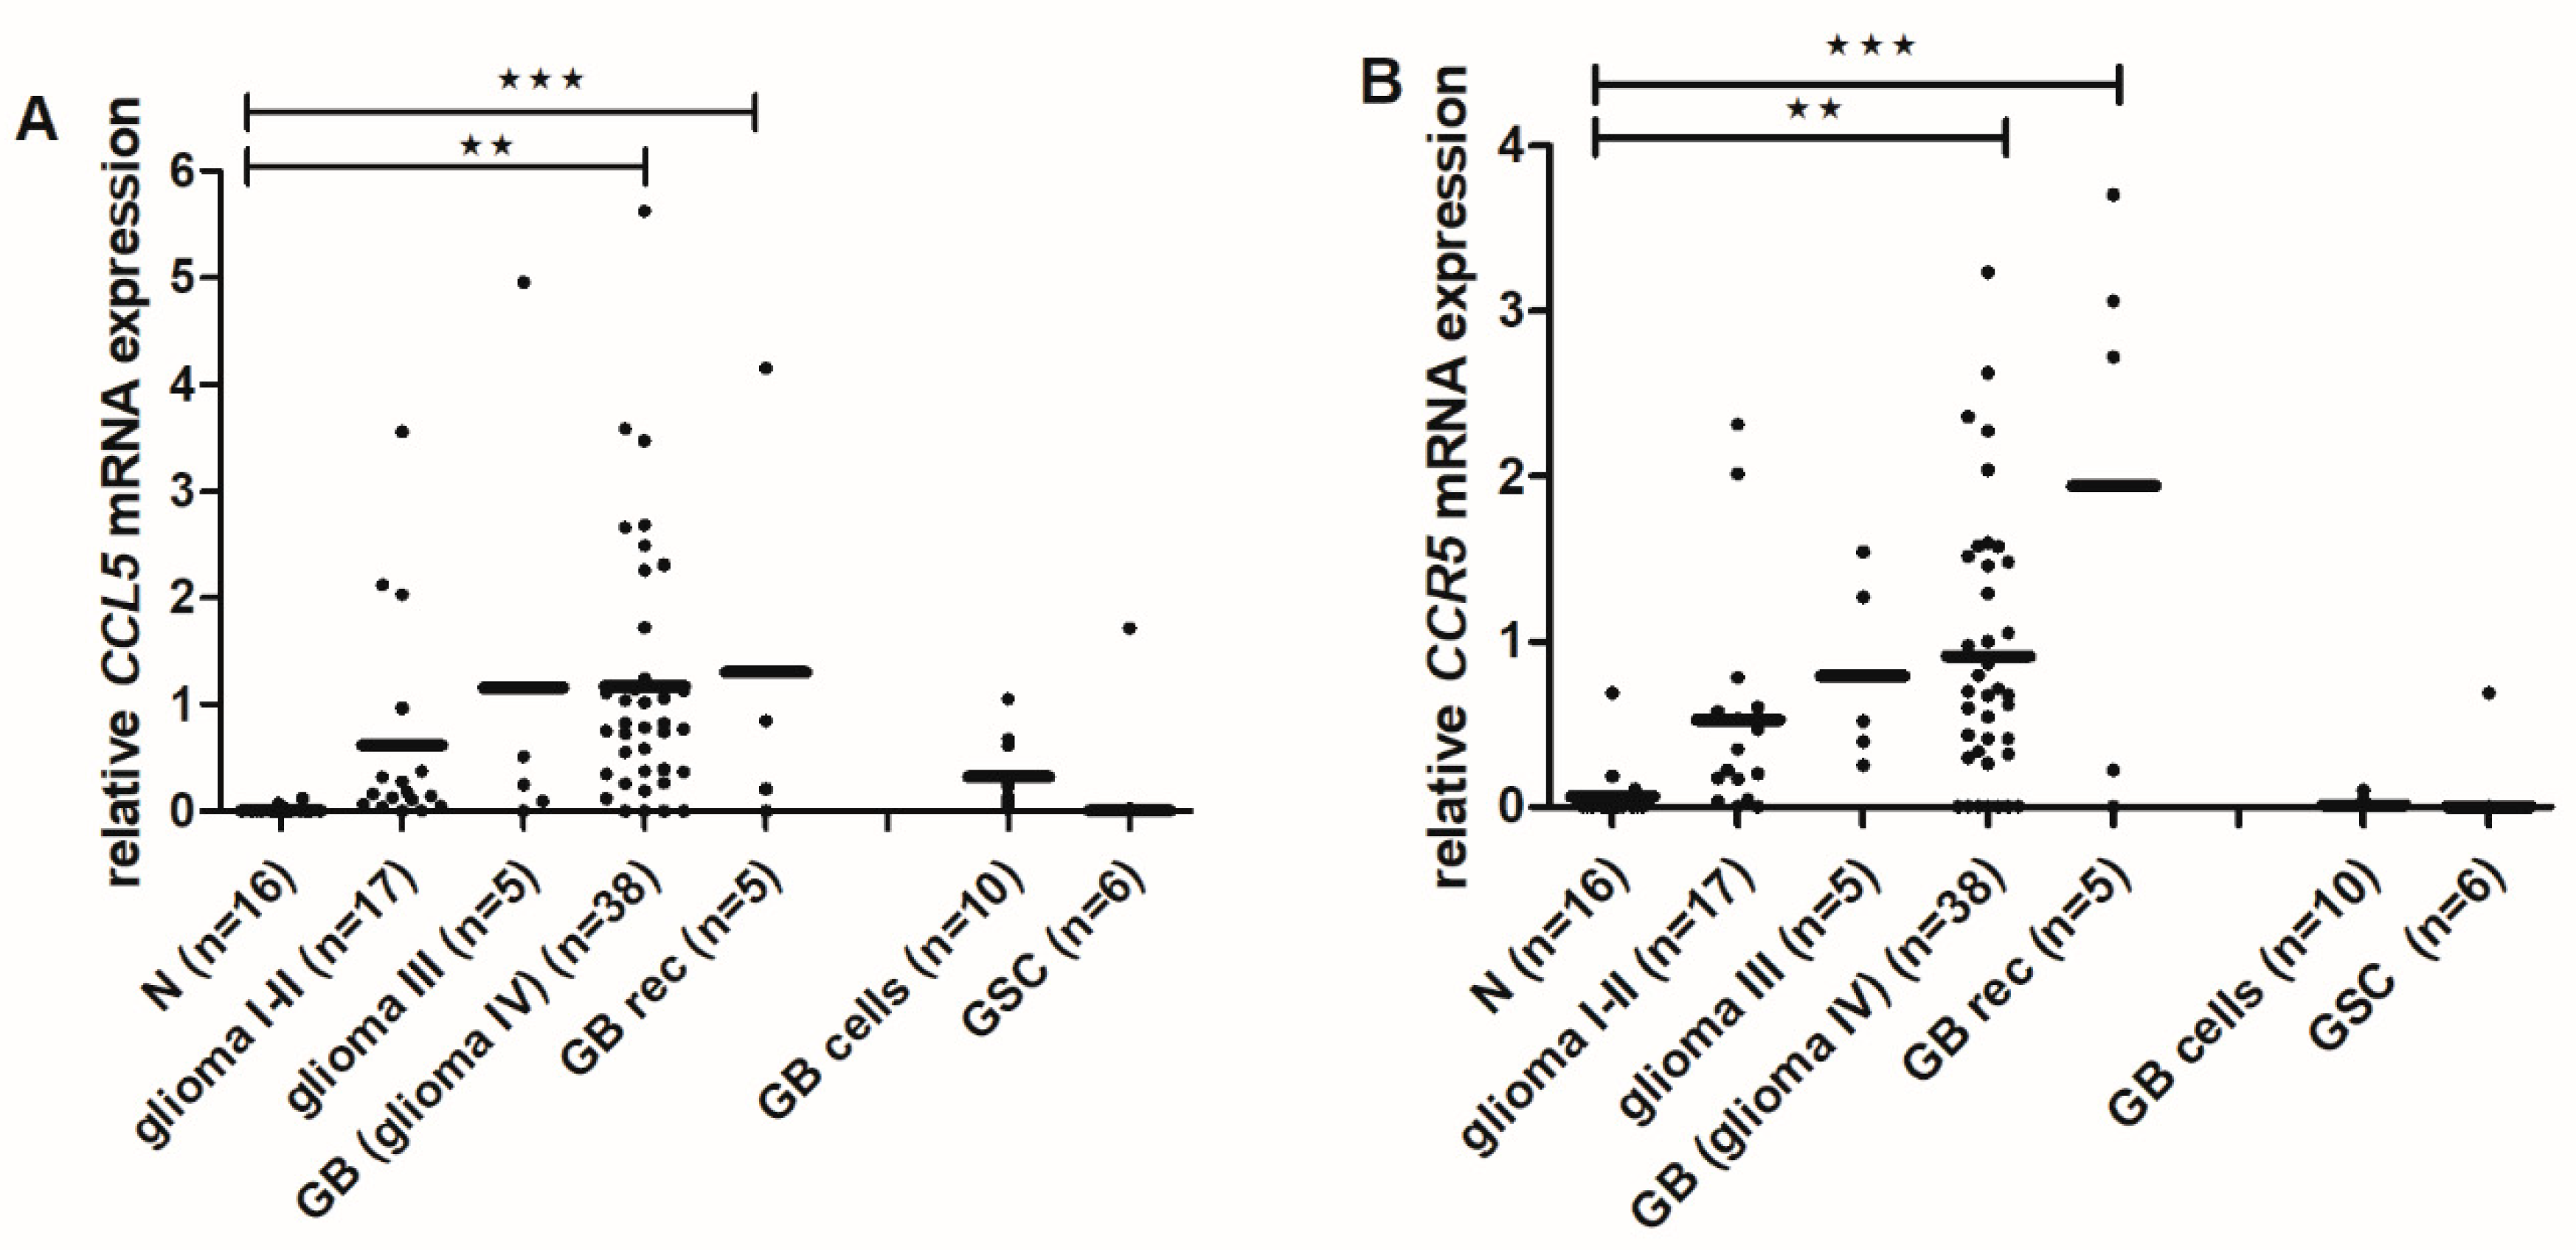
2.6. CCL5 and CCR5 mRNA Levels Are Increased in High-Grade Gliomas

To determine, if the high protein levels of CCL5/CCR5 in GB tissues result from increased gene expression, i.e., transcriptional activity, we determined the mRNA levels of CCL5 and CCR5 in the tissues of normal and malignant specimens: non-cancerous brain tissues (n = 16), glioma I-II- low-grade gliomas (n = 17), glioma III-anaplastic astrocytomas (n = 5), glioma IV-GBs (n = 38), recurrent GB (GB rec) (n = 5), GB cells-primary glioblastoma cells (n = 10) and GSCs (n = 6), isolated from patient tumor samples).
CCL5 and CCR5 mRNA levels were significantly higher in GB and GB rec samples compare to non-cancerous brain tissues (Figure 7A,B). Primary glioblastoma cells expressed higher levels of CCL5 mRNA, compared to GSCs what also correlated with protein levels seen in Figure 2 and Figure 3.

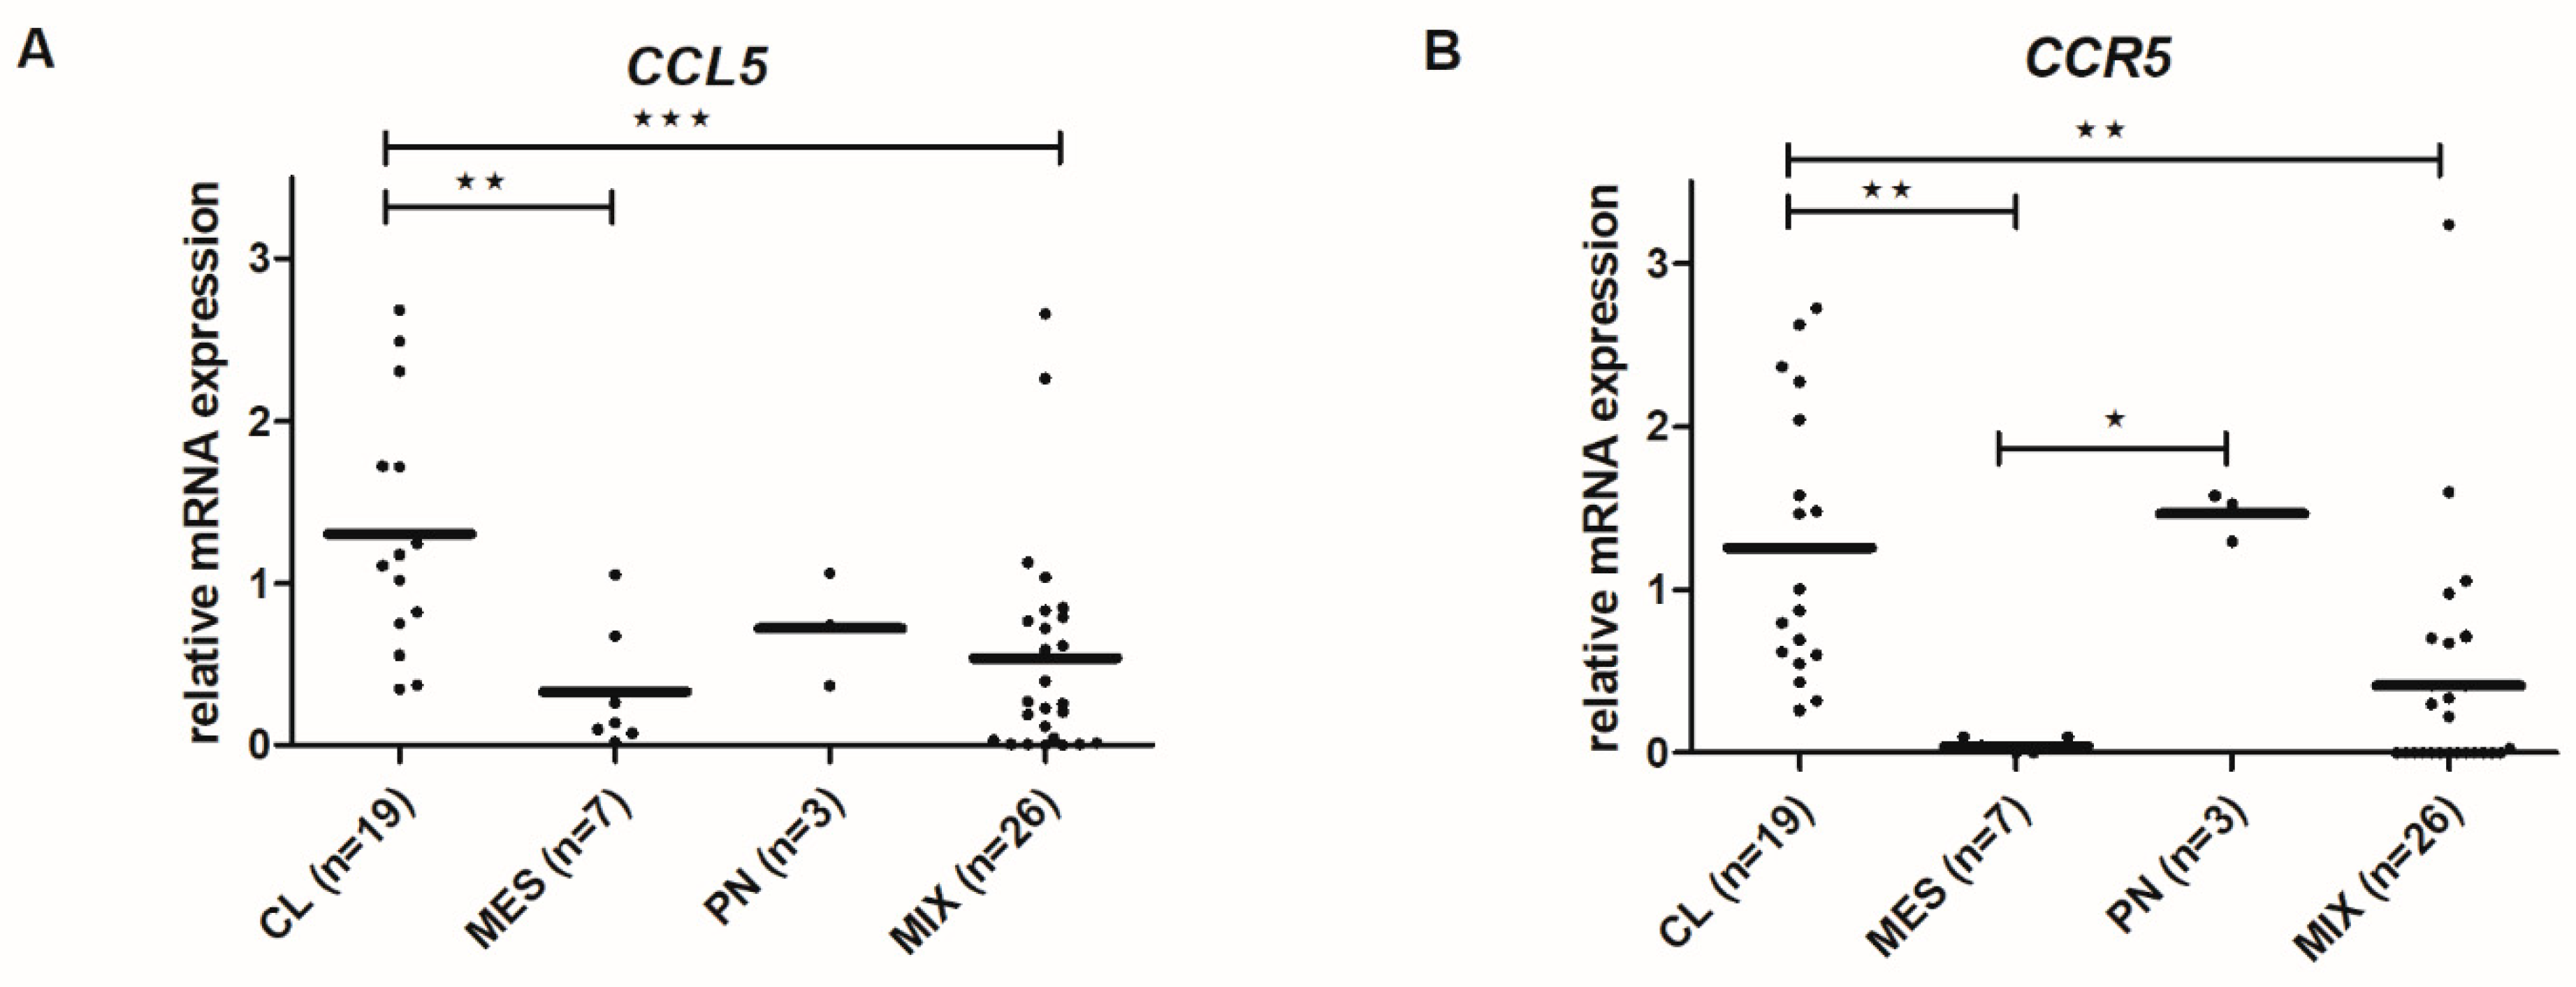
2.7. CCL5 and CCR5 mRNA Levels Differ among Glioblastoma Subtypes

We analyzed the CCL5 and CCR5 mRNA levels in four GB subtypes, MES (Mesenchymal), PN (Proneural), CL (Classical), and MIX, based on the expression values of 12 genes from Behnan et al. (2016) [41]. PN subtype was classified with expression levels of P2RX7, STMN4, SOX10, and ERBB3 genes. CL subtype was classified with expression levels of ACSBG1 and KCNF1 and MES subtype with expression levels of S100A, DAB2, TGFB1, THBS1, COL1A2, and COL1A1, as described in Materials and Methods. Cl subtype exhibited the highest level of both CCL5 and CCR5 mRNA expressions, while MES expressed the lowest (Figure 8).

3. Discussion

The CCL5/CCR5 axis has been reported as a mechanism of tumor progression in pancreatic [19], gastric [23], and breast cancer [42]. The CCL5-receptors’ signaling can favor cancer progression, directly affecting proliferation, migration, and cell survival of cancer cells by autocrine signaling, or indirectly by paracrine signaling recruiting pro-tumor and/or anti-inflammatory effector cells into the tumor microenvironment (TME) [43].
The basic question when investigating chemokine autocrine signaling in cancer, such as presented by CCL5/CCR5 axis, is “what activates what,” whereas in paracrine signaling in heterogeneous cancers the question is “what attracts what.” Autocrine signaling means that GB cells express both ligand and receptor, and thus activate the pathways downstream of CCR5 in a cell-autonomous manner. Therefore, we first need to reveal the CCL5/CCR5 distribution in patients’ tissues with respect to glioma stage and glioblastoma subtype, and secondly CCL5 and CCR5 relative expressions in the isolated primary glioblastoma cell lines. By analyzing CCL5/CCR5 mRNA and protein expression in glioma tissues in a larger cohort of 65 patients, we confirmed that both, CCL5 and CCR5 genes are increasingly expressed in advanced glioma (Figure 7). Moreover, higher CCL5 and CCR5 were detected in secondary, recurrent glioblastoma as compared to the primary glioblastoma. As the recurrences are known to be more aggressive [44], we suggest that CCL5 and CCR5 autocrine signaling is playing a significant role in glioblastoma progression. Secondly, we detected higher CCL5 and CCR5 proteins in glioblastoma tissues and cells than in non-malignant brain tissues and normal astrocytes (Figure 1 and Figure 2).
Our results are consistent with studies that showed increased CCL5 and CCR5 expression in human glioma tissues [45,46] and glioblastoma cells [47], compared to normal counterparts. Our finding of increased CCR5 expression in worse prognosis glioma are consistent with reports that high CCR5 levels correlate with shorter survival [28]. Similarly, CCL5 was demonstrated as a bad prognostic marker for survival of patients with various types of cancer [19]. As in low-grade gliomas, for which we have shown low expression of both CCL5 and CCR5, we may speculate that the progression probably relays more on stromal cells’ supportive chemokine stimulation. Whereas in glioblastoma, high levels of CCL5/CCR5 enable an autocrine chemokine activation, resulting in increased tumor cell proliferation and invasion [45,46] that is becoming independent of stromal cells.
This is leading to a lower survival rate of glioblastoma patients, as suggested by Pan et al. [45]. These authors showed that CCL5 established autocrine signaling in high-grade glioma by affecting growth regulatory circuit that was critical in particular for mesenchymal (MES) glioblastoma subtype. In contrast to expected, in our group of patient-derived GB tissues, CCL5 and CCR5 proteins were not correlating, as each may be present in some specimen, but absent in others, and they were found in a different subcellular compartment. This indicates on non-exclusive partnering, but also the promiscuous binding of CCL5 and CRR5 in tumors in vivo [45,47,48].
As mentioned above, recurrent glioblastoma supposedly acquires aggressive mesenchymal phenotype, being possibly induced by irradiation [44] via epithelial to mesenchymal transition (EMT). Such phenotype is more invasive and tends to express higher stemness-related genes (Majc et al., accepted, 2020) [49]. The dilemma of autocrine signaling in glioblastoma is therefore also related to glioblastoma cell subtypes. However, exploring the gene expression distribution of CCR5 and CCL5 among different genetic subtypes, we found the highest levels of both genes in the CL-glioblastoma subtype and the lowest in MES-glioblastoma subtype (Figure 8). This contrasts to the results by Pan et al. [45], demonstrating the highest CCL5 (gene) expression in MES-glioblastoma and the lowest in PN-glioblastoma. This discrepancy could be due to the low number of samples in each subtype group in our study, and using smaller [41] vs. larger panel of gene fingerprints defining the subtype [7] by us than by Pan et al. [45]. Moreover, in MES-glioblastoma, the autocrine CCL5-dependent activation loop has also been proven by adding exogenous CCL5, and because no further activation was achieved, it was concluded that CCL5 promotes survival and proliferation of the cells in a cell-autonomous manner. Noteworthy, MES-subtypes characteristically express the CD44 a non-conventional CCL5 receptor, also a stemness marker [50]. As CCL5 is a promiscuous ligand, binding to more than one receptor [46], several receptors need to be blocked to inhibit CCL5 driven axis processes in brain tumors.
There are three major reasons for poor survival: (1) increased tumor cell invasion, (2) the abundance of more aggressive glioblastoma stem cells (GSCs), and (3) supportive stromal cells in TME. Firstly, glioblastoma invasion is characterized by extensive single-cell infiltration into healthy brain tissue, preventing total tumor removal during surgery [51]. Increased invasion of glioblastoma cells could also be activated by CCL5/CCR5 signaling the migratory downstream pathways through αvβ3 integrin, PI3K/Akt kinases, NF-κB pathways [52], and proteases such as matrix metalloproteases (MMPs) [53]. However, protease inhibitors, such as MMPs and cathepsin inhibitors failed to inhibit invasive cancer spread in clinical trials. Thus CCL5/CCR5 axis blocking agents were suggested as efficient anti-invasive therapeutics [54]. Both ligand CCL5 and its receptor CCR5 have been suggested as potential therapeutic targets in various cancers, including glioblastoma, breast and prostate cancer, and impairing disease progression [28,55]. Most promising is CCR5 blocking by synthetic drug maraviroc, an allosteric inverse CCR5 agonist [56], which has been proven to significantly inhibit proliferation, colony formation, and migration of several carcinomas, including breast [42] and prostate cancer [55]. Maraviroc has very recently been reported also in metastasis of breast cancer cells xenografts [18,20,22,42]. Here, we demonstrated that CCR5-expressing primary glioblastoma cells and glioblastoma stem cells (GSC) invasion, when enhanced by recombinant CCL5, was also significantly inhibited by adding maraviroc.
Secondly, we demonstrated that maraviroc inhibited glioblastoma stem cell (GSCs) invasion. This is an important novelty of this research, as GSCs are recognized as a key target of therapy in glioblastomas and all other cancers, as these are cancer stem cells (CSCs) and are highly resistant to irradiation and chemotherapy. As CSCs represent the tumor-initiating cells, i.e., the seed of primary and the secondary tumors metastases, these are the cells that need to be eradicated by a novel kind of therapy. High levels of GSCs in glioblastoma were observed in more aggressive tumors vs. low-grade glioma, as reported by us and others [57,58] and their abundance is related to prognosis.
These cells are trafficking within the tissues into and out their niches [12] and presumably invade into the brain parenchyma, based on the chemoattraction among the tumor and stromal cells, as has been demonstrated for CXCR12/SDF-1α [31,59]. As maraviroc significantly inhibited CCL5-induced GSC invasion (Figure 6), we propose targeting CCL5/CCR5 signaling as novel glioblastoma therapeutics, as initially suggested by Kast et al. [60]. Moreover, we show that GSCs express only CCR5, but not CCL5 (Figure 3), indicating that only paracrine signaling would stimulate GSC invasion. This may be occurring in vivo, as dormant GSCs reside in glioblastoma tissue niches and are presumably activated in a paracrine cross-talk by stromal cells, infiltrating the niche to migrate out of the niches [12,59], expressing CCL5 and CCR5.
Thirdly, glioblastoma TME consists beside brain tissue astrocytes and microglia, also from infiltrating immune cells, macrophages, lymphocytes, neutrophils, and mesenchymal stem cells (MSCs) that interact in complex networks of molecular signals [43,61], where chemokines are the key molecules for directing the cells to move along a chemical gradient towards the tumor [62]. We are still far from understanding complex multiple interactions under in vivo conditions, however, by categorically studying bilateral ligand and receptor expressions by selected cell types, their specific mechanisms in CCL5/CCR5 signaling in glioblastoma may be elucidated. Here, we focused on MSCs, proven as glioblastoma-infiltrating cells, recruited from bone marrow or brain tissues, and also present in GSC niches, where MSCs may also affect glioblastoma cell differentiation and proliferation as well as invasion, as proven by us and others [12,31,36,63].
We demonstrated that paracrine MSC-glioblastoma and GSC cell interactions enhance invasion, maintained by CCR5 receptors, as it was inhibited when maraviroc was added to the system (Figure 6). Our extensive previous research [35,36,64], provided sufficient evidence by quantifying a set of chemokines released from bone-marrow MSCs in indirect co-cultures and glioblastoma cells. MSC have been demonstrated to secrete among other chemokines, also CCL5, which interacts with specific cytokine receptors such as CCR1, CCR3, and CCR5. CCL5 paracrine signaling was found to promote the migratory, invasive, and metastatic properties of breast cancer cells [24]. Similar was later confirmed by Choi et al. [65] demonstrating that also adipose MSCs target brain tumor-initiating cells from glioblastoma, medulloblastoma, and ependymoma, by releasing potential cytokines, including CXCR4/SDF-1alpha, CCR5/RANTES, IGF1R/IGF-1, IL6R/IL-6, and IL8R/IL-8.
Complementary to this, we demonstrated here the bilateral ligand and receptor expression on glioblastoma tissue sections using the specific markers of CD105 for MSCs and CD68 for macrophages. We showed that MSCs express ligand CCL5 (Figure 4) and macrophages receptor CCR5 (Figure 5). These results further suggest that the CCL5/CCR5 axis may mediate cellular cross-talk between MSCs, macrophages, and GSCs by attracting them to peri-vascular tumor niches, that are populated by MSCs. The involvement of the CCL5/CCR5 axis in MSC-GB cell interactions has not been known so far, in comparison to the well-known pro-migratory role of macrophage-secreted CCL5 [53]. Finally, we hypothesize that MSC-secreted CCL5 maintains the interactions between MSCs and GSCs, and targeting the CCL5/CCR5 axis with maraviroc may become effective anti-invasive therapy preventing invasive GSCs migration out of their niches to spread to brain parenchyma.
In conclusion, we have demonstrated the heterogeneous tissue/cellular distribution and subcellular expression of CCL5 and CCR5 in glioblastoma. Using the CCR5 antagonist, maraviroc, we have shown CCL5 and CCR5 drive primary glioblastoma (GB) cells and glioblastoma stem cells (GSCs) invasion and their interactions with stromal MSCs and can be used as repositioned drug for novel clinical trials in glioblastoma. These results suggest paracrine and autocrine CCL5/CCR5 axis-dependent signaling in a lower grade (gliomas) vs. higher grade glioblastoma invasion. The potential role of CCL5/CCR5 in paracrine GSC niche interactions warrants further investigations.

4. Materials and Methods

4.1. Cell Cultures

Human bone marrow-derived MSCs were obtained from Lonza Bioscience (Walkersville, MD, USA; Lot139 number 6F4393). MSCs were cultured in Dulbecco’s medium (DMEM 5921; Sigma-Aldrich, St. Louis, MO, USA) containing 10% (v/v) heat-inactivated Fetal Bovine Serum (FBS, Gibco, Dublin, Ireland), 100 IU/mL penicillin (Thermo Fisher Scientific, Waltham, MA, USA), 100 µg streptomycin (Thermo Fisher Scientific, Waltham, MA, USA), 2 mM L-glutamine (Thermo Fisher Scientific, Waltham, MA, USA), sodium- pyruvate (Gibco, Dublin, Ireland), and nonessential amino acids (Sigma-Aldrich, St. Louis, MO, USA ). Human glioblastoma cell line U373 cells were obtained from American Type Culture Collection (ATTC, Manassas, VA, USA) and were grown in DMEM high glucose medium (GE Healthcare, Il, Chicago, IL, USA), supplemented with 10% (v/v) FBS, 2 mM L Glutamine, 100 IU/mL penicillin and 100 µg streptomycin, as described in Kološa et al. [63] and Breznik et al. [36]. Glioblastoma stem cell lines, NCH644 and NCH421k were obtained from CLS (Cell Lines Service GmbH, Eppelheim, Germany) and grown as spheroid suspensions in complete Neurobasal Medium (Invitrogen, Life Technologies, Carlsbad, CA, USA) containing 2 mM L-glutamine, 1 × penicillin/streptomycin, 1 × B-27 (Invitrogen, Life Technologies, Carlsbad, CA, USA), 1 U/mL heparin (Sigma-Aldrich, St. Louis, MO, USA), 20 ng/mL bFGF and EGF (both from Invitrogen, Life Technologies, Carlsbad, CA, USA). All cell lines were maintained at 37 °C with 5% CO2 and 95% of humidity. All cell cultures were tested for mycoplasma contamination using MycoAlert Mycoplasma Detection Kit (Lonza, Basel, Switzerland).

4.2. Glioblastoma Samples from Patients

Glioma biopsies were obtained from 65 patients that operated at the Department of Neurosurgery, University Medical Centre of Ljubljana, Slovenia. Tumor tissue samples were snap-frozen in liquid nitrogen and stored in the liquid nitrogen for RNA/DNA analyses. The study was approved by the National Medical Ethics Committee of the Republic of Slovenia (approval no. 0120-179 190/2018/4). Patients with glioblastoma (glioma grade IV) were selected for this study (Table 2). The clinical parameters and tumor characteristics were provided by the Department of Neurosurgery and Institute of Pathology at medical faculty in Ljubljana (Table 2). Formalin-fixed, paraffin-embedded tissues were prepared at the Institute of Pathology and were used for immunohistochemical analyses. Non-cancer brain samples (NB1 and NB2) were also obtained from the Institute of Pathology, from patients who were brain cancer-free.

4.3. Establishment of Primary Glioblastoma and Glioblastoma Stem Cell Lines

Fresh glioblastoma tumor tissue samples were minced by scalpels in DMEM/high glucose cell culture media supplemented with 10% FBS, 2 mM L-glutamine, and penicillin-streptomycin and seeded in 6 well plates. Outgrowing cells were detached with 0.25% trypsin-EDTA solution (Sigma-Aldrich, St. Louis, MO, USA) and transferred to T25 cell culture flasks. Cells were collected by low-speed centrifugation (1000 rpm for 60 s). After centrifugation 2–3 times, the cells were transferred to T75 culture flasks and expanded for subsequent analyses.
Cells’ solution was further filtered through Nylon mash 40 μm pores (BD Falcon cell strainer, Nylon). Single cells were collected and resuspended in stem cell media, Neurobasal Medium (Invitrogen, Life Technologies, Carlsbad, CA, USA) containing 2 mM L-glutamine, 1 × penicillin/streptomycin, 1 × B-27 (Invitrogen, Life Technologies), 1 U/mL heparin (Sigma-Aldrich, St. Louis, MO, USA), 20 ng/mL bFGF and EGF (both from Invitrogen, Life Technologies, Carlsbad, CA, USA) and cultured on agar coated T25 flasks until spheres with a diameter of 200 μm were formed. Healthy spheres were frozen in stem cell media with 10% DMSO for further analysis. GSCs were authenticated for stem cell marker CD133 and SOX2 expression using immunofluorescence.

4.4. Immunohistochemistry and Immunocytochemistry

Immunohistochemistry (IHC) analyses were performed using antibodies against CCR5 (ab65850, Abcam, Cambridge, UK), CCR5 peptide (ab192862, Abcam, Cambridge, UK), and CCL5-RANTES (ab189841, Abcam, Cambridge, UK). After fixation, tumor sections (4 μm thick) were deparaffinized in xylene and rehydrated in ethanol. Antigen retrieval was carried out in 10 mM sodium citrate buffer (pH 6.0) at 95 °C for 20 min followed by 20-min cooling on ice. The sections were treated with 100% methanol (Merck, Kenilworth, NJ, USA) containing 0.3% H2O2 (Merck, Kenilworth, NJ, USA) for 10 min to block endogenous peroxidase activity to reduce non-specific background staining, followed by a washing step in distilled water. Non-specific binding sites were blocked with 1% bovine serum albumin with 2% goat serum in PBS before incubation with antibodies overnight in the fridge. The sections were incubated with biotinylated secondary antibody followed by horseradish peroxidase-conjugated streptavidin (Cell Signaling Technology, Danvers, MA, USA). The sections were further incubated with the 2,4-diaminobenzidine substrate and counterstained with hematoxylin. Immunocytochemistry was performed as described without the deparaffinization and antigen retrieval. To achieve high antibody specificity, we used CCR5 blocking peptide (CCR5 P) that binds specifically to the target antibody epitope in 10 times higher concentration as the primary CCR5 antibody. IHC scoring was performed by a pathologist using a semi-quantitative grading system; immunostaining intensity: +++ strong, ++ moderate, + weak or no expression, and the abundance of stained cells percentage positive cells: 0, 1–33% = 1, 33–66% = 2, 66–100% = 3. The intracellular localization was evaluated as m = membrane, n = nuclear, c = cytoplasmic; e = extracellular.

4.5. Immunofluorescence of Glioblastoma Stem Cell Spheroids

The 3D GSC spheroids were washed with PBS, fixed in ice-cold methanol (Sigma-Aldrich, St. Louis, MO, USA) for 15 min at room temperature, and incubated for 15 min in 0.1% Triton X-100/1% FBS/PBS at room temperature for membrane permeabilization. The spheroids were stained for 30 min at room temperature with the following antibodies: CCR5 (ab65850, Abcam, Cambridge, UK ) and CCL5-RANTES (ab189841, Abcam, Cambridge, UK). Negative control staining was performed in the absence of the primary antibodies. Spheroids were stained with an Alexa Fluor 488®- and Alexa Fluor 546®- conjugated secondary antibody (1:200; Invitrogen, Life Technologies, Carlsbad, CA, USA ) for 30 min at room temperature. For nuclear staining, the spheroids were incubated with the Hoechst 33342 dye (1:1000, Invitrogen, Life Technologies), for 5 min at room temperature. The spheroids were then mounted in AntiFade reagent (Invitrogen, Life Technologies, Carlsbad, CA, USA) and analyzed with a confocal microscope (Leica DFC 7000 T, Wetzlar, Germany).

4.6. Immunofluorescence of Glioblastoma Tumor Tissue Sections

Tumor sections, prepared at the Institute of Pathology, Medical Faculty, were deparaffinized in xylene and rehydrated in ethanol. Following rehydration, antigen retrieval was carried out in 10 mM sodium citrate buffer (pH 6.0) at 95 °C for 20 min followed by 20-min cooling on ice.
Non-specific binding sites were blocked with normal goat serum (Dako) and 0.1% Triton-X for 1 h at room T to reduce non-specific background staining. Sections were incubated overnight at 4 °C with primary antibodies, diluted in PBS containing 1% BSA (Sigma-Aldrich, St. Louis, MO, USA); CCR5 (ab65850, Abcam, Cambridge, UK), CCL5-RANTES (ab189841, Abcam, Cambridge, UK), CD68 (Dako, clone EBM11), CD105 (ab27422, Abcam, Cambridge, UK), CD133 (ab19898, Abcam, Cambridge, UK) and GFAP (ab10062, Abcam, Cambridge, UK). The sections were washed in PBS containing 1% BSA. Alexa Fluor 488-conjugated goat anti-rabbit antibodies (Life Technologies, Carlsbad, CA, USA) and Alexa Fluor 546-conjugated goat anti-mouse antibodies (Thermo Fisher Scientific, Waltham, MA, USA), were used as secondary antibodies in 1:200 PBS dilution, containing 1% BSA for 1 h at roomT. Sections were washed in PBS for 5 min and coverslipped using Prolong Gold mounting medium with DAPI (Life Technologies, Carlsbad, CA, USA). Control incubations were performed in the absence of primary antibodies. Fluorescence imaging was performed using NIS-Elements AR 4.13.04 software and a Nikon Eclipse Ti-inverted microscope (Nikon Instruments, Melville, NY, USA).

4.7. Invasion Assay

Primary glioblastoma cell (GB) and glioblastoma stem cell (GSC) invasion was measured using 24-well Transwell units with 6.5 mm inserts and 8 µm pores (Corning, New York, NY, USA). Primary GB from patient 2 (10,000/insert) and GSC (NCH644, 80,000/insert), were seeded in the upper compartment, which was coated with 0.5 mg/mL Matrigel (Becton Dickinson, Franklin Lakes, NJ, USA) in serum-free medium. The lower compartment was seeded with MSC (20,000/insert) in MSC media containing 10% FBS or with recombinant CCL5/RANTES peptide (R&D, 278-RN-050, Minneapolis, MN, USA) (300 ng/mL). Maraviroc (MVR, Selleckchem, S200, Houston, TX, USA) in a final concentration of 10 µM was added into the upper chamber to GB and to GSCs. Cells were allowed to invade at 37 °C in 5% CO2 for 48 h. Non-invading cells were removed from the upper surface of the membrane using a cotton swab. The lower surface of the membrane was fixed in 4% PFA, stained with 0.1% crystal violet, and stained cells were counted using the Nikon Eclipse Ti- inverted microscope (Nikon Instruments, Melville, NY, USA) at 4× magnification. Three biological experiments with two separate membranes for each condition were analyzed.

4.8. Cell Viability Assay

Cell viability of primary glioblastoma cells was determined after 48 h of treatment with maraviroc (MVR, Selleckchem, S2003, USA) using the MTT reagent (3-(4,5-dimethylthiazol- 2-yl)-2,5-diphenyltetrazolium-bromide; Sigma-Aldrich, USA) according to manufacturer’s instructions. Briefly, cells were seeded into 96-well plates (8000 cells/well) and grown overnight. Cells were treated with different concentrations of MVR (0.1–50 µM). Stock solutions of MVR were prepared in dimethyl sulfoxide (DMSO, Sigma-Aldrich, St. Louis, MO, USA). Control incubations contained the same amount of DMSO (0.2%, v/v). After 48 h, MTT was added and after 3 h of incubation, the formed formazan crystals were dissolved in DMSO and the absorbance was measured as the change in optical density (ΔOD 570/690 nm) using microplate reader (Synergy™ HT, Bio-Tec Instruments Inc., Winooski, VT, USA). Cell viability was analyzed using GraphPad Prism software (GraphPad Software, San Diego, CA, USA)

4.9. Gene Expression Analysis

Total RNA from glioblastoma tissues and cells was isolated using AllPrep DNA/RNA/Protein Mini Kit (Qiagen, MD, USA) according to the manufacturer’s instruction. 1 µg of RNA was reverse transcribed using a High-Capacity cDNA Reverse Transcription Kit (Thermo Fischer Scientific, Waltham, MA, USA). High-throughput RT-qPCR was used to measure CCL5, CCR5 expression. RT-qPCR was performed with FAM-MGB probes with Fluidigm BioMark HD System RT-PCR (Fluidigm Corporation, San Francisco, CA, USA) using 48.48 Dynamic Arrays IFC [66], where 42 samples and 24 assays (probes) were mixed pairwise in nanoliter chambers to enable parallel analysis of 2304 reactions.
Visualization and analysis of qPCR results were done using the Fluidigm RT-qPCR analysis software and quantGenius software [40]. Relative copy numbers of mRNA were normalized to housekeeping genes HPRT1 and GAPDH. Assays are described in Table S1.

4.10. Data Analysis

4.10.1. Glioblastoma Subtyping

Firstly, we assessed whether the expression profiles of 12 selected genes (COL1A2, COL1A, TGFB1, THBS1, DAB2, S100A4, P2RX7, STMN4, SOX10, ERBB3, ACSBG1, KCBF1) from 4 sample types (GB-glioblastoma; GB rec-recurrent glioblastoma; GB cells-primary glioblastoma cells; GSC-glioblastoma stem cells) are suitable markers for GB subtype distinction into mesenchymal (MES), proneural (PN), classical (CL) subtype and finally the subtype combination (MIX). Since the number of subtypes (clusters) was known in advance, we used k-means clustering to partition the expression profiles of the selected genes in one of the four subtypes. K-means clustering partitions each gene to the subtype (cluster) with the nearest mean. Data was first standardized. We used two clustering techniques, k-means, and PAM (partition around medoids).
The difference between the two is that k-means uses artificially calculated means, while PAM uses the so-called medoids, which are actual dataset values. PAM is also more robust. The cluster (subtype) assignment for each gene was then compared and the method which shows more concordance with the subtype assignment from clinical data (EGFRIII mut, IDH mut, PFGFR, p53 status) was selected (in our case this was the k-means clustering). When the analyses were repeated by removing genes with extreme values (only 2 such genes), the results did not significantly change. All analyses were done in R version 3.6.1 and its libraries fpc (used for visualizations) [67] and cluster (used for PAM clustering) [68].

4.10.2. Differentially Expressed Genes among Tissues and Glioblastoma Subtypes

We analyzed the differences in the expression of CCL5 and CCR5 among sample types; N-non-cancerous brain tissues; glioma I-II- low-grade gliomas; glioma III; GB-glioblastoma; GB rec- recurrent glioblastoma; GB cells; GSCs in the first analysis and between previously defined subtypes (mesenchymal—MES, proneural—PN, classical—CL subtype and finally the subtype combination—MIX) in the second analysis. To minimize the effect of genes with a low expression we first removed them from the analysis by replacing the Ct values > 40 as zero. We then assessed the overall similarity of genes/samples (sample types in the first analysis and subtypes in the second one) by hierarchical clustering and plotted the heatmaps for visual inspection of the results. The differential expression analyses were done using linear models and the empirical Bayes method to moderate the standard errors of the log of fold changes that were estimated with the linear model. In the first set of analyses we tested which genes differentially expressed when glioma or glioblastoma samples were compared with normal tissue when the gene expression in glioblastoma cells and GSCs was compared to normal astrocytes (NAS) when gene expression in glioblastoma samples was compared with N, glioma I and II, glioma III, and GB-rec and finally when gene expression in GSCs was compared with NAS and GB-cells. In the second experiment, samples were categorized according to their subtypes and the difference in gene expression between every pair of subtypes was tested. To enable an easier estimation of genes that were differentially expressed in two or more analyses we used Venn diagrams. All analyses were done in R version 3.6.1 and its libraries HTqPCR (used for data preprocessing and visualizations) [69], limma (used for differential expression calculations and Venn diagram visualizations) [70].

Supplementary Materials

The following are available online at https://www.mdpi.com/1422-0067/21/12/4199/s1, Figure S1: Fluorescence immunocytochemical staining of CCL5 and CCR5 in bone-marrow derived mesenchymal stem cells (BM-MSC). Figure S2: Normal astrocytes do not express CCL5 and CCR5. Figure S3: Cell viability of primary glioblastoma cells is not affected by CCR5 inhibitor Maraviroc. Table S1: List of assays used for RT-qPCR analysis (Thermo Fisher Scientific, USA).

Author Contributions

Conceptualization, M.N., R.G.P., and T.L.T.; formal analysis, A.R. and J.M.; funding acquisition, T.L.T.; investigation, M.N., M.K.K., B.H., B.B., B.M., M.M., and J.M.; methodology, M.N., B.B., and K.S.; project administration, B.B. and T.L.T.; resources, A.P. and R.G.P.; supervision, M.N., B.B., and T.L.T.; validation, M.N. and B.B.; visualization, M.N.; Writing—original draft, M.N., B.B., and T.L.T.; writing—review and editing, M.N., R.G.P., and T.L.T. All authors have read and agreed to the published version of the manuscript.

Funding

This work was supported by Slovenian Research Agency (Grant Program P1-0245 to TLT, post-doctoral project Z3-1870 to BB) and by the European Program of Cross-Border Cooperation for Slovenia-Italy Interreg TRANS-GLIOMA (to TLT).

Acknowledgments

We acknowledge the suggestions of Vashendriya Hira in experiments using immunofluorescence labeling and Cornelis van Noorden for critically reading the manuscript.

Conflicts of Interest

The author(s) declared no potential conflicts of interest with respect to the research, authorship, and/or publication of this article.

References

  1. Louis, D.N.; Perry, A.; Reifenberger, G.; von Deimling, A.; Figarella-Branger, D.; Cavenee, W.K.; Ohgaki, H.; Wiestler, O.D.; Kleihues, P.; Ellison, D.W. The 2016 world health organization classification of tumors of the central nervous system: A summary. Acta Neuropathol. 2016, 131, 803–820. [Google Scholar] [CrossRef] [PubMed] [Green Version]
  2. Thomas, A.A.; Brennan, C.W.; DeAngelis, L.M.; Omuro, A.M. Emerging therapies for glioblastoma. JAMA Neurol. 2014, 71, 1437–1444. [Google Scholar] [CrossRef] [PubMed]
  3. Noch, E.K.; Ramakrishna, R.; Magge, R. Challenges in the treatment of glioblastoma: Multisystem mechanisms of therapeutic resistance. World Neurosurg. 2018, 116, 505–517. [Google Scholar] [CrossRef] [PubMed]
  4. Stupp, R.; Mason, W.P.; Van Den Bent, M.J.; Weller, M.; Fisher, B.; Taphoorn, M.J.B.; Belanger, K.; Brandes, A.A.; Marosi, C.; Bogdahn, U.; et al. Radiotherapy plus concomitant and adjuvant temozolomide for glioblastoma. N. Engl. J. Med. 2005, 352, 987–996. [Google Scholar] [CrossRef] [PubMed]
  5. Lathia, J.D.; Mack, S.C.; Mulkearns-Hubert, E.E.; Valentim, C.L.L.; Rich, J.N. Cancer stem cells in glioblastoma. Genes Dev. 2015, 29, 1203–1217. [Google Scholar] [CrossRef] [PubMed] [Green Version]
  6. Osuka, S.; Van Meir, E.G. Overcoming therapeutic resistance in glioblastoma: The way forward. J. Clin. Investig. 2017, 127, 415–426. [Google Scholar] [CrossRef] [PubMed] [Green Version]
  7. Verhaak, R.G.W.; Hoadley, K.A.; Purdom, E.; Wang, V.; Qi, Y.; Wilkerson, M.D.; Miller, C.R.; Ding, L.; Golub, T.; Mesirov, J.P.; et al. Integrated genomic analysis identifies clinically relevant subtypes of glioblastoma characterized by abnormalities in PDGFRA, IDH1, EGFR, and NF1. Cancer Cell 2010, 17, 98–110. [Google Scholar] [CrossRef] [Green Version]
  8. Kranjc, M.K.; Novak, M.; Pestell, R.G.; Lah, T.T. Cytokine CCL5 and receptor CCR5 axis in glioblastoma multiforme. Radiol. Oncol. 2019, 53, 397–406. [Google Scholar] [CrossRef] [Green Version]
  9. Oliveira, M.N.; Breznik, B.; Pillat, M.M.; Pereira, R.L.; Ulrich, H.; Lah, T.T. Kinins in glioblastoma microenvironment. Cancer Microenviron. 2019, 12, 77–94. [Google Scholar] [CrossRef]
  10. Teng, J.; Da Hora, C.C.; Kantar, R.S.; Nakano, I.; Wakimoto, H.; Batchelor, T.T.; Chiocca, A.E.; Badr, C.E.; Tannous, B.A. Dissecting inherent intratumor heterogeneity in patient-derived glioblastoma culture models. Neuro Oncol. 2017, 19, 820–832. [Google Scholar] [CrossRef] [Green Version]
  11. Wang, X.; Prager, B.C.; Wu, Q.; Kim, L.J.Y.; Gimple, R.C.; Shi, Y.; Yang, K.; Morton, A.R.; Zhou, W.; Zhu, Z.; et al. Reciprocal signaling between glioblastoma stem cells and differentiated tumor cells promotes malignant progression. Cell Stem Cell 2018, 22, 514–528. [Google Scholar] [CrossRef] [PubMed] [Green Version]
  12. Hira, V.V.V.; Breznik, B.; Vittori, M.; de Jong, L.A.; Mlakar, J.; Oostra, R.-J.; Khurshed, M.; Molenaar, R.J.; Lah, T.; Van Noorden, C.J.F. Similarities between stem cell niches in glioblastoma and bone marrow: Rays of hope for novel treatment strategies. J. Histochem. Cytochem. 2019, 68, 33–57. [Google Scholar] [CrossRef] [PubMed]
  13. Hira, V.V.V.; Aderetti, D.A.; van Noorden, C.J.F. Glioma stem cell niches in human glioblastoma are periarteriolar. J. Histochem. Cytochem. 2018, 66, 349–358. [Google Scholar] [CrossRef] [PubMed] [Green Version]
  14. Breznik, B.; Motaln, H.; Turnšek, T.L. Proteases and cytokines as mediators of interactions between cancer and stromal cells in tumours. Biol. Chem. 2017, 398, 709–719. [Google Scholar] [CrossRef] [PubMed] [Green Version]
  15. O’Hayre, M.; Salanga, C.L.; Handel, T.M.; Allen, S.J. Chemokines and cancer: Migration, intracellular signalling and intercellular communication in the microenvironment. Biochem. J. 2008, 409, 635–649. [Google Scholar] [CrossRef] [Green Version]
  16. Griffith, J.W.; Sokol, C.L.; Luster, A.D. Chemokines and chemokine receptors: Positioning cells for host defense and immunity. Annu. Rev. Immunol. 2014, 32, 659–702. [Google Scholar] [CrossRef] [PubMed] [Green Version]
  17. Sarvaiya, P.J.; Guo, D.; Ulasov, I.V.; Gabikian, P.; Lesniak, M.S.; Sarvaiya, P.J.; Guo, D.; Ulasov, I.V.; Gabikian, P.; Lesniak, M.S. Chemokines in tumor progression and metastasis. Oncotarget 2013, 4, 2171–2185. [Google Scholar] [CrossRef] [Green Version]
  18. Velasco-Velázquez, M.; Xolalpa, W.; Pestell, R.G. The potential to target CCL5/CCR5 in breast cancer. Expert Opin. Ther. Targets 2014, 18, 1265–1275. [Google Scholar] [CrossRef]
  19. Singh, S.K.; Mishra, M.K.; Eltoum, I.A.; Bae, S. CCR5/CCL5 axis interaction promotes migratory and invasiveness of pancreatic cancer cells. Sci. Rep. 2018, 8, 1–2. [Google Scholar] [CrossRef] [Green Version]
  20. Velasco-Velázquez, M.; Jiao, X.; De La Fuente, M.; Pestell, T.G.; Ertel, A.; Lisanti, M.P.; Pestell, R.G. CCR5 antagonist blocks metastasis of basal breast cancer cells. Cancer Res. 2012, 72, 3839–3850. [Google Scholar] [CrossRef] [Green Version]
  21. Ignatov, A.; Robert, J.; Gregory-Evans, C.; Schaller, H.C. RANTES stimulates Ca 2+ mobilization and inositol trisphosphate (IP 3) formation in cells transfected with G protein-coupled receptor 75. Br. J. Pharmacol. 2006, 149, 490–497. [Google Scholar] [CrossRef] [PubMed] [Green Version]
  22. Jiao, X.; Nawab, O.; Patel, T.; Kossenkov, A.V.; Halama, N.; Jaeger, D.; Pestell, R.G. Recent advances targeting CCR5 for cancer and its role in immuno-oncology. Cancer Res. 2019, 79, 4801–4807. [Google Scholar] [CrossRef] [PubMed] [Green Version]
  23. Sugasawa, H.; Ichikura, T.; Kinoshita, M.; Ono, S.; Majima, T.; Tsujimoto, H.; Chochi, K.; Hiroi, S.; Takayama, E.; Saitoh, D.; et al. Gastric cancer cells exploit CD4+ cell-derived CCL5 for their growth and prevention of CD8+ cell-involved tumor elimination. Int. J. Cancer 2008, 122, 2535–2541. [Google Scholar] [CrossRef] [PubMed]
  24. Karnoub, A.E.; Dash, A.B.; Vo, A.P.; Sullivan, A.; Brooks, M.W.; Bell, G.W.; Richardson, A.L.; Polyak, K.; Tubo, R.; Weinberg, R.A. Mesenchymal stem cells within tumour stroma promote breast cancer metastasis. Nature 2007, 449, 557–563. [Google Scholar] [CrossRef]
  25. Cambien, B.; Richard-Fiardo, P.; Karimdjee, B.F.; Martini, V.; Ferrua, B.; Pitard, B.; Schmid-Antomarchi, H.; Schmid-Alliana, A. CCL5 Neutralization restricts cancer growth and potentiates the targeting of PDGFRβ in colorectal carcinoma. PLoS ONE 2011, 6, e28842. [Google Scholar] [CrossRef]
  26. Chen, L.; Liu, X.; Zhang, H.-Y.; Du, W.; Qin, Z.; Yao, Y.; Mao, Y.; Zhou, L. Upregulation of chemokine receptor CCR10 is essential for glioma proliferation, invasion and patient survival. Oncotarget 2014, 5, 6576–6583. [Google Scholar] [CrossRef] [Green Version]
  27. Kouno, J.; Nagai, H.; Nagahata, T.; Onda, M.; Yamaguchi, H.; Adachi, K.; Takahashi, H.; Teramoto, A.; Emi, M. Up-regulation of CC chemokine, CCL3L1, and receptors, CCR3, CCR5 in human glioblastoma that promotes cell growth. J. Neuro Oncol. 2004, 70, 301–307. [Google Scholar] [CrossRef] [PubMed]
  28. Zhao, L.; Wang, Y.; Xue, Y.; Lv, W.; Zhang, Y.; He, S. Critical roles of chemokine receptor CCR5 in regulating glioblastoma proliferation and invasion. Acta Biochim. Biophys. Sin. 2015, 47, 890–898. [Google Scholar] [CrossRef] [Green Version]
  29. Moogooei, M.; Shamaei, M.; Khorramdelazad, H.; Fattahpour, S.; Seyedmehdi, S.M.; Moogooei, M.; Hassanshahi, G.; Kalantari Khandani, B. The intricate expression of CC chemokines in glial tumors: Evidence for involvement of CCL2 and CCL5 but Not CCL11. Acta Med. Iran. 2015, 53, 770–777. [Google Scholar]
  30. Podergajs, N.; Motaln, H.; Rajčević, U.; Verbovšek, U.; Koršič, M.; Obad, N.; Espedal, H.; Vittori, M.; Herold-Mende, C.; Miletic, H.; et al. Transmembrane protein CD9 is glioblastoma biomarker, relevant for maintenance of glioblastoma stem cells. Oncotarget 2015, 7, 593–609. [Google Scholar] [CrossRef] [Green Version]
  31. Hossain, A.; Gumin, J.; Gao, F.; Figueroa, J.; Shinojima, N.; Takezaki, T.; Priebe, W.; Villarreal, D.; Kang, S.G.; Joyce, C.; et al. Mesenchymal stem cells isolated from human gliomas increase proliferation and maintain stemness of glioma stem cells through the IL-6/gp130/STAT3 pathway. Stem Cells 2015, 33, 2400–2415. [Google Scholar] [CrossRef] [Green Version]
  32. Appaix, F. Brain mesenchymal stem cells: The other stem cells of the brain? World J. Stem Cells 2014, 6, 134. [Google Scholar] [CrossRef] [PubMed]
  33. Motaln, H.; Koren, A.; Gruden, K.; Ramšak, Ž.; Schichor, C.; Lah, T.T. Heterogeneous glioblastoma cell cross-talk promotes phenotype alterations and enhanced drug resistance. Oncotarget 2015, 6, 40998–41017. [Google Scholar] [CrossRef] [PubMed] [Green Version]
  34. Motaln, H.; Turnsek, T.L. Cytokines play a key role in communication between mesenchymal stem cells and brain cancer cells. Protein Pept. Lett. 2015, 22, 322–331. [Google Scholar] [CrossRef] [PubMed]
  35. Oliveira, M.N.; Pillat, M.M.; Motaln, H.; Ulrich, H.; Lah, T.T. Kinin-B1 receptor stimulation promotes invasion and is involved in cell-cell interaction of co-cultured glioblastoma and mesenchymal stem cells. Sci. Rep. 2018, 8, 1299. [Google Scholar] [CrossRef] [PubMed] [Green Version]
  36. Breznik, B.; Motaln, H.; Vittori, M.; Rotter, A.; Turnšek, L.T. Mesenchymal stem cells differentially affect the invasion of distinct glioblastoma cell lines. Oncotarget 2017, 8, 25482–25499. [Google Scholar] [CrossRef] [Green Version]
  37. Matias, D.; Balça-Silva, J.; da Graça, G.C.; Wanjiru, C.M.; Macharia, L.W.; Nascimento, C.P.; Roque, N.R.; Coelho-Aguiar, J.M.; Pereira, C.M.; Dos Santos, M.F.; et al. Microglia/astrocytes-glioblastoma crosstalk: Crucial molecular mechanisms and microenvironmental factors. Front. Cell. Neurosci. 2018, 12, 235. [Google Scholar] [CrossRef] [Green Version]
  38. Morantz, R.A.; Wood, G.W.; Foster, M.; Clark, M.; Gollahon, K. Macrophages in experimental and human brain tumors. Part 2: Studies of the macrophage content of human brain tumors. J. Neurosurg. 1979, 50, 305–311. [Google Scholar] [CrossRef]
  39. Laudati, E.; Currò, D.; Navarra, P.; Lisi, L. Blockade of CCR5 receptor prevents M2 microglia phenotype in a microglia-glioma paradigm. Neurochem. Int. 2017, 108, 100–108. [Google Scholar] [CrossRef]
  40. Baebler, Š.; Svalina, M.; Petek, M.; Stare, K.; Rotter, A.; Pompe-Novak, M.; Gruden, K. quantGenius: Implementation of a decision support system for qPCR-based gene quantification. BMC Bioinform. 2017, 18, 276. [Google Scholar] [CrossRef]
  41. Behnan, J.; Stangeland, B.; Hosainey, S.A.M.; Joel, M.; Olsen, T.K.; Micci, F.; Glover, J.C.; Isakson, P.; Brinchmann, J.E. Differential propagation of stroma and cancer stem cells dictates tumorigenesis and multipotency. Oncogene 2017, 36, 570–584. [Google Scholar] [CrossRef] [PubMed] [Green Version]
  42. Jiao, X.; Velasco-Velazquez, M.A.; Wang, M.; Li, Z.; Rui, H.; Peck, A.R.; Korkola, J.E.; Chen, X.; Xu, S.; Du Hadaway, J.B.; et al. CCR5 governs DNA damage repair and breast cancer stem cell expansion. Cancer Res. 2018, 78, 1657–1671. [Google Scholar] [CrossRef] [PubMed] [Green Version]
  43. Broekman, M.L.; Maas, S.L.N.; Abels, E.R.; Mempel, T.R.; Krichevsky, A.M.; Breakefield, X.O. Multidimensional communication in the microenvirons of glioblastoma. Nat. Rev. Neurol. 2018, 4, 482–495. [Google Scholar] [CrossRef] [PubMed]
  44. Bao, S.; Wu, Q.; McLendon, R.E.; Hao, Y.; Shi, Q.; Hjelmeland, A.B.; Dewhirst, M.W.; Bigner, D.D.; Rich, J.N. Glioma stem cells promote radioresistance by preferential activation of the DNA damage response. Nature 2006, 444, 756–760. [Google Scholar] [CrossRef] [PubMed]
  45. Pan, Y.; Smithson, L.J.; Ma, Y.; Hambardzumyan, D.; Gutmann, D.H. Ccl5 establishes an autocrine high-grade glioma growth regulatory circuit critical for mesenchymal glioblastoma survival. Oncotarget 2017, 8, 32977–32989. [Google Scholar] [CrossRef] [PubMed] [Green Version]
  46. Pham, K.; Luo, D.; Liu, C.; Harrison, J.K. CCL5, CCR1 and CCR5 in murine glioblastoma: Immune cell infiltration and survival rates are not dependent on individual expression of either CCR1 or CCR5. J. Neuroimmunol. 2012, 246, 10–17. [Google Scholar] [CrossRef] [PubMed] [Green Version]
  47. Wu, S.-Y.; Watabe, K. The roles of microglia/macrophages in tumor progression of brain cancer and metastatic disease. Front. Biosci. 2017, 22, 1805–1829. [Google Scholar] [CrossRef] [PubMed] [Green Version]
  48. Balkwill, F. Cancer and the chemokine network. Nat. Rev. Cancer 2004, 4, 540–550. [Google Scholar] [CrossRef] [PubMed]
  49. Ye, X.; Weinberg, R.A. Epithelial-mesenchymal plasticity: A central regulator of cancer progression. Trends Cell Biol. 2015, 25, 675–686. [Google Scholar] [CrossRef] [PubMed] [Green Version]
  50. Roscic-Mrkic, B.; Fischer, M.; Leemann, C.; Manrique, A.; Gordon, C.J.; Moore, J.P.; Proudfoot, A.E.I.; Trkola, A. RANTES (CCL5) uses the proteoglycan CD44 as an auxiliary receptor to mediate cellular activation signals and HIV-1 enhancement. Blood 2003, 102, 1169–1177. [Google Scholar] [CrossRef]
  51. Mentlein, R.; Hattermann, K.; Held-Feindt, J. Lost in disruption: Role of proteases in glioma invasion and progression. Biochim. Biophys. Acta 2012, 1825, 178–185. [Google Scholar] [CrossRef] [PubMed]
  52. Huang, C.Y.; Fong, Y.C.; Lee, C.Y.; Chen, M.Y.; Tsai, H.C.; Hsu, H.C.; Tang, C.H. CCL5 increases lung cancer migration via PI3K, Akt and NF-κB pathways. Biochem. Pharmacol. 2009, 77, 794–803. [Google Scholar] [CrossRef] [PubMed]
  53. Wu, C.Y.-J.; Chen, C.-H.; Lin, C.-Y.; Feng, L.-Y.; Lin, Y.-C.; Wei, K.-C.; Huang, C.-Y.; Fang, J.-Y.; Chen, P.-Y. CCL5 of glioma-associated microglia/macrophages regulates glioma migration and invasion via calcium-dependent matrix metalloproteinase-2. Neuro Oncol. 2019, 1–14. [Google Scholar]
  54. Winer, A.; Adams, S.; Mignatti, P. Matrix metalloproteinase inhibitors in cancer therapy: Turning past failures into future successes. Mol. Cancer Ther. 2018, 17, 1147–1155. [Google Scholar] [CrossRef] [PubMed] [Green Version]
  55. Sicoli, D.; Jiao, X.; Ju, X.; Velasco-Velazquez, M.; Ertel, A.; Addya, S.; Li, Z.; Andò, S.; Fatatis, A.; Paudyal, B.; et al. CCR5 receptor antagonists block metastasis to bone of v-Src oncogene-transformed metastatic prostate cancer cell lines. Cancer Res. 2014, 74, 7103–7114. [Google Scholar] [CrossRef] [Green Version]
  56. Rosenbaum, D.M.; Rasmussen, S.G.F.; Kobilka, B.K. The structure and function of G-protein-coupled receptors. Nature 2009, 459, 356–363. [Google Scholar] [CrossRef] [Green Version]
  57. Ardebili, S.; Zajc, I.; Gole, B.; Campos, B.; Herold-Mende, C.; Drmota, S.; Lah, T. CD133/prominin1 is prognostic for GBM patient’s survival, but inversely correlated with cysteine cathepsins’ expression in glioblastoma derived spheroids. Radiol. Oncol. 2011, 45, 1–13. [Google Scholar] [CrossRef]
  58. Zeppernick, F.; Ahmadi, R.; Campos, B.; Dictus, C.; Helmke, B.M.; Becker, N.; Lichter, P.; Unterberg, A.; Radlwimmer, B.; Herold-Mende, C.C. Stem cell marker CD133 affects clinical outcome in glioma patients. Clin. Cancer Res. 2008, 14, 123–129. [Google Scholar] [CrossRef] [Green Version]
  59. Hira, V.V.V.; Verbovšek, U.; Breznik, B.; Srdič, M.; Novinec, M.; Kakar, H.; Wormer, J.; der Swaan, B.V.; Lenarčič, B.; Juliano, L.; et al. Cathepsin K cleavage of SDF-1α inhibits its chemotactic activity towards glioblastoma stem-like cells. Biochim. Biophys. Acta Mol. Cell Res. 2017, 1864, 594–603. [Google Scholar] [CrossRef]
  60. Kast, R.E. Glioblastoma: Synergy of growth promotion between CCL5 and NK-1R can be thwarted by blocking CCL5 with miraviroc, an FDA approved anti-HIV drug and blocking NK-1R with aprepitant, an FDA approved anti-nausea drug. J. Clin. Pharm. Ther. 2010, 35, 657–663. [Google Scholar] [CrossRef]
  61. Schiffer, D.; Annovazzi, L.; Mazzucco, M.; Mellai, M. The microenvironment in gliomas: Phenotypic expressions. Cancers 2015, 7, 2352–2359. [Google Scholar] [CrossRef] [PubMed]
  62. Borsig, L.; Wolf, M.J.; Roblek, M.; Lorentzen, A.; Heikenwalder, M. Inflammatory chemokines and metastasis—Tracing the accessory. Oncogene 2014, 33, 3217–3224. [Google Scholar] [CrossRef] [PubMed] [Green Version]
  63. Kološa, K.; Motaln, H.; Herold-Mende, C.; Koršič, M.; Lah, T.T. Paracrine effects of mesenchymal stem cells induce senescence and differentiation of glioblastoma stem-like cells. Cell Transplant. 2015, 24, 631–644. [Google Scholar] [CrossRef]
  64. Motaln, H.; Gruden, K.; Hren, M.; Schichor, C.; Primon, M.; Rotter, A.; Lah, T.T. Human mesenchymal stem cells exploit the immune response mediating chemokines to impact the phenotype of glioblastoma. Cell Transplant. 2012, 21, 1529–1545. [Google Scholar] [CrossRef] [Green Version]
  65. Choi, S.A.; Lee, J.Y.; Kwon, S.E.; Wang, K.C.; Phi, J.H.; Choi, J.W.; Jin, X.; Lim, J.Y.; Kim, H.; Kim, S.K. Human adipose tissue-derived mesenchymal stem cells target brain tumor-initiating cells. PLoS ONE 2015, 10, 1–15. [Google Scholar]
  66. Ramšak, Ž.; Coll, A.; Stare, T.; Tzfadia, O.; Baebler, Š.; Van de Peer, Y.; Gruden, K. Network modeling unravels mechanisms of crosstalk between ethylene and salicylate signaling in potato. Plant Physiol. 2018, 178, 488–499. [Google Scholar] [CrossRef] [PubMed] [Green Version]
  67. FPC: Flexible Procedures for Clustering. Rpackage Version 2.2-3. Available online: https://CRAN.R-project.org/package=fpc. (accessed on November 2019).
  68. Maechler, M.; Rousseeuw, P.; Struyf, A.; Hubert, M.; Hornik, K. Cluster: Cluster Analysis Basics and Extensions. R Package Version 2.1.0.; R Foundation for Statistical Computing: Vienna, Austria, 2019. [Google Scholar]
  69. Dvinge, H.; Bertone, P. HTqPCR: High-throughput analysis and visualization of quantitative real-time PCR data in R. Bioinformatics 2009, 25, 3325–3326. [Google Scholar] [CrossRef] [PubMed] [Green Version]
  70. Ritchie, M.E.; Phipson, B.; Wu, D.; Hu, Y.; Law, C.W.; Shi, W.; Smyth, G.K. Limma powers differential expression analyses for RNA-sequencing and microarray studies. Nucleic Acids Res. 2015, 43, e47. [Google Scholar] [CrossRef] [PubMed]
Figure 1. Brain tissue sections immunolabeling for CCL5 and CCR5. Immunohistochemical localization of CCL5 and CCR5 in glioblastoma and non-cancerous tissue (NB1 and NB2) sections was performed as described in Materials and Methods. Cell nuclei were counterstained by hematoxylin (blue). CCR5 epitope blocking peptide (P) was used (in CCR5+P images) as a control for specific binding of the primary antibody. Scale bar represents 100 µm. Black arrows indicate examples of CCL5 and CCR5 positive cells. Microscopy was carried out at 20× objective magnification.
Ijms 21 04199 g001
Figure 2. Immunocytochemical localization of CCL5 and CCR5 in primary glioblastoma cells. ICC localization of CCL5 and CCR5 in primary glioblastoma cells isolated from patients’ tumors and the glioblastoma cell line U373 as performed as described in Materials and Methods. Cell nuclei were counterstained by hematoxylin (blue). CCR5 epitope blocking peptide (P) was used (in CCR5 + P images) as a control. Negative control staining was performed in the absence of the primary antibody. Scale bar represents 50 µm. Microscopy was carried out at 20× objective magnification.
Ijms 21 04199 g002
Figure 3. Primary glioblastoma stem cells express CCR5. Immunofluorescence labeling was performed as described in Materials and Methods on GSC spheroids, established from the patient’s Nb.4 tissue and established GSC lines NCH644 and NCH421k. Nuclei were stained with DAPI (blue), CCR5 expression is shown as a green and CCL5 as red fluorescence. The last panel presents merged channels. Confocal microscopy was carried out at 20× objective magnification. Scale bar represents 100 µm.
Ijms 21 04199 g003
Figure 4. Mesenchymal stem cells in glioblastoma tissues express CCL5. Fluorescence immunohistochemical staining of CCL5 antigen was performed on glioblastoma sections of 3 patients, Nb. 8, Nb. 12 and Nb. 5. MSCs were immunolabeled using the antibody against their specific marker CD105. Nuclei were stained with DAPI (blue), CCL5 with Alexa Fluor 546 (red), and CD105 with Alexa Fluor 488 (green) dye. Merged images represent colocalization (violet color) of CD105 and CCL5. Microscopy was carried out at 20× objective magnification. Scale bar represents 100 µm.
Ijms 21 04199 g004
Figure 5. Glioblastoma-associated macrophages express CCR5. Fluorescence immunohistochemical staining of CCR5 antigen was performed on glioblastoma sections of 3 patients, Nb. 8, Nb. 12 and Nb. 5. Macrophages were immunolabeled, using an antibody against the specific marker CD68. Nuclei were stained with DAPI (blue), CD68 with Alexa Fluor 546 (red), and CCR5 with Alexa Fluor 488 (green) dye. Merged images represent colocalization (yellow color) of CD68 and CCR5. Microscopy was carried out at 20× objective magnification. Scale bar represents 100 µm.
Ijms 21 04199 g005
Figure 6. Effects of CCL5 and MSC on the invasion of primary glioblastoma cells and glioblastoma stem cells. Primary glioblastoma cells from patient Nb. 2 (GB Nb.2) (10,000 cells/insert) and GSC cells (NCH644) (80,000 cells/insert), were seeded in the upper compartment alone or in combination with maraviroc (MRV) (final concentration 10 µM) which was coated with 0.5 mg/mL Matrigel in serum-free medium. (A,C) Recombinant CCL5 (final concentration 300 ng/mL) was added to the lower chamber (B,D) MSCs (20,000/insert) were added to the lower chamber. The cells that invaded the matrigel after 48 h, were stained with 0.1% crystal violet and counted using an inverted microscope. Each value represents mean ± SD (n = 3). p < 0.05, ★★ p < 0.01, ★★★ p < 0.001 vs. control group (t-test).
Ijms 21 04199 g006
Figure 7. CCL5 and CCR5 gene expression in glioma tissues and primary glioblastoma cells. The expression of CCL5 (A) and CCR5 (B) at mRNA was determined in glioma, non-cancerous brain tissues and glioblastoma cells analyzed by RT-qPCR. mRNA values were normalized to housekeeping genes HPRT1 and GAPDH and analyzed with quantGenius software [40] as described in Materials and Methods. n-number of samples; N-non-cancerous brain tissues; glioma I-II- low-grade gliomas: pilocytic astrocytoma, astrocytoma, oligodendroglioma; glioma III-anaplastic astrocytoma, anaplastic oligodendroglioma, and anaplastic mixed oligoastrocytoma; GB-glioblastoma; GB rec- recurrent glioblastoma; GB cells-primary glioblastoma cells; GSC-glioblastoma stem cells isolated from patient tumor samples. ★★ p < 0.01, ★★★ p < 0.001 versus the non-cancerous brain tissues.
Ijms 21 04199 g007
Figure 8. CCL5 and CCR5 gene expression in glioblastoma subtypes. mRNA expression of CCL5 (A) and CCR5 (B) in glioblastoma tissues and glioblastoma cells analyzed by RT-qPCR. mRNA values were normalized to housekeeping genes HPRT1 and GAPDH and analyzed with quantGenius software as described in Materials and Methods. n-number of samples; CL-classical, MES-mesenchymal, PN-proneural, and MIX subtypes. p < 0.05, ★★ p < 0.01, ★★★ p < 0.001 versus the non-cancerous brain tissues.
Ijms 21 04199 g008
Table 1. Immunohistochemical analyses of CCL5 and CCR5 expression in glioblastoma and non-cancerous tissues.
CCR5CCL5
TumorIntensity% Positive CellsLocalizationIntensity% Positive CellsLocalization
Patient 2+1c0/
Patient 50/+1c, e
Patient 8+1c++3c
Patient 90/0/
NB 10/++1c
NB 2+2c++2c
IHC scoring was performed by a pathologist using a semi-quantitative grading system. This comprise the scoring immunostaining intensity: ++ moderate, + weak or no expression (−) and the abundance of stained cells percentage positive cells: 0; 1–33% = 1; 33–66% = 2; 66–100% = 3. The intracellular localization was evaluated as m = membrane, n = nuclear, c = cytoplasmic; e = extracellular, (/) = not determined.
Table 2. Clinical and histological parameters of glioblastoma patients.
PatientsAge (Years)GenderSurvival * (Months)DiagnosisNecrosis **Angiogenesis **Karnofsky Score ***Subtype (MES, PN, CL, MIX) ****IDH *****
Patient 151F3GByesyes90NDwt
Patient 254M10GByesyes80MIXwt
Patient 361M8GByesyes70PNwt
Patient 476F16GBnoyes50NDn.a.
Patient 561M8GBnoyes80MIXwt
Patient 851M6GBnoyes100CLwt
Patient 967M9GBnono80NDwt
Patient 1263F9GBnono90CLwt
* Survival: from the date of the first operation until death, GB—glioblastoma. ** Necrosis and angiogenesis were analyzed as »yes« or »no« by observation of the obtained glioblastoma tissue sample, before processing of the sample. *** Karnofsky score (at the time of the first operation) was determined by the clinician. Patient’s functional impairment; 80–100: normal activity, able to work, no special care needed; 50–70: unable to work, able to live at home, a varying amount of assistance needed; 0–40: unable to care for self, hospital care. **** Glioblastoma subtypes, mesenchymal (MES), proneural (PN) classical (CL), and MIX were determined based on the pattern of mRNA expression levels of selected genes, according to Behnan et al. (2017). n.a.: not available, ND: not determined. ***** IDH = Isocitrate dehydrogenase enzyme mutations were determined at the Pathology; wt-wild type, non-mutated.
Table 3. Immunocytochemical analyses of CCL5 and CCR5 expression in primary glioblastoma cells.
Cell Sample NameCCR5 *CCL5 *
Patient 1+
Patient 2++
Patient 3
Patient 5+++
Patient 8+++++
U373
* Immunocytochemical grades: +++ strong, ++ moderate, + weak, − no expression.

