Article

Novel Comprehensive Bioinformatics Approaches to Determine the Molecular Genetic Susceptibility Profile of Moderate and Severe Asthma

Department of Biomedical Sciences College of Health Sciences, QU Health, Qatar University, Doha 2713, Qatar
Int. J. Mol. Sci. 2020, 21(11), 4022; https://doi.org/10.3390/ijms21114022
Submission received: 17 March 2020 / Revised: 19 May 2020 / Accepted: 26 May 2020 / Published: 4 June 2020
(This article belongs to the Special Issue Functional Genomics in Health and Disease)

Abstract

:
Background: Asthma is a chronic inflammatory condition linked to hyperresponsiveness in the airways. There is currently no cure available for asthma, and therapy choices are limited. Asthma is the result of the interplay between genes and the environment. The exact molecular genetic mechanism of asthma remains elusive. Aims: The aim of this study is to provide a comprehensive, detailed molecular etiology profile for the molecular factors that regulate the severity of asthma and pathogenicity using integrative bioinformatics tools. Methods: The GSE43696 omnibus gene expression dataset, which contains 50 moderate cases, 38 severe cases, and 20 healthy controls, was used to investigate differentially expressed genes (DEGs), susceptible chromosomal loci, gene networks, pathways, gene ontologies, and protein–protein interactions (PPIs) using an intensive bioinformatics pipeline. Results: The PPI network analysis yielded DEGs that contribute to interactions that differ from moderate-to-severe asthma. The combined interaction scores resulted in higher interactions for the genes STAT3, AGO2, COL1A1, CLCN6, and KSR for moderate asthma and JAK2, INSR, ERBB2, NR3C1, and PTK6 for severe asthma. Enrichment analysis (EA) demonstrated differential enrichment between moderate and severe asthma phenotypes; the ion transport regulation pathway was significantly enhanced in severe asthma phenotypes compared to that in moderate asthma phenotypes and involved PER2, GCR, IRS-2, KCNK7, KCNK6, NOX1, and SCN7A. The most enriched common pathway in both moderate and severe asthma is the development of the glucocorticoid receptor (GR) signaling pathway followed by glucocorticoid-mediated inhibition of proinflammatory and proconstrictory signaling in the airway of smooth muscle cell pathways. Gene sets were shared between severe and moderate asthma at 16 chromosome locations, including 17p13.1, 16p11.2, 17q21.31, 1p36, and 19q13.2, while 60 and 48 chromosomal locations were unique for both moderate and severe asthma, respectively. Phylogenetic analysis for DEGs showed that several genes have been intersected in phases of asthma in the same cluster of genes. This could indicate that several asthma-associated genes have a common ancestor and could be linked to the same biological function or gene family, implying the importance of these genes in the pathogenesis of asthma. Conclusion: New genetic risk factors for the development of moderate-to-severe asthma were identified in this study, and these could provide a better understanding of the molecular pathology of asthma and might provide a platform for the treatment of asthma.

1. Introduction

Asthma is a common complex chronic disorder affecting adults and children. It results due to the interplay of genetic factors and the environment [1]. Symptoms of acute asthma include coughing, chest tightness and chest pain, wheezing, nocturnal worsening, and difficulty sleeping [2]. Asthma is a highly heterogeneous disorder that manifests with multiple clinical phenotypes that might have different risk factors and therapeutic responses [3]. Severe asthma tends to be distinguished by ongoing symptoms, heterogeneous pathobiology, inflammation of the airways and clinical characteristics, which are poorly controlled by the present standard of care [4,5]. Asthmatic patients seem to be more vulnerable to diseases and chronic comorbidities that are correlated with worse outcomes of asthma [1].
Earlier genetic research showed that asthma could be inherited with incomplete penetrance in a Mendelian autosomal dominant fashion [6], which is common among individuals with a family history of the disease [7]. Recently, polygenic, codominant, and multifactorial modes of inheritance have been reported [8]. Monozygotic twins are at a significant risk of developing asthma than dizygotic twins [9,10].
Approximately 38% of childhood asthma is attributed to combinatorial genetic factors [11]. Normal and moderate asthma patients clustered separately from the extreme category of asthma, indicating significant changes in gene expression linked to the progression of asthma [12]. To date, a small portion of 38 genomic loci contributing to asthma has been mapped [13]. These loci are demonstrating genetic heterogeneity of the disease that might be responsible for the variable disease manifestations. Most genes associated with asthma show an increased risk of 1.2 [14]⁠, and these are mostly involved in the immune system, muscle, and lung function [15].⁠
Studying complex diseases such as asthma requires a general understanding of their pathogenesis, natural history, and mapping of candidate genes using system-level analysis at the cell scale. Network analysis for asthma-related genes through protein–protein interactions (PPIs) is an alternative method for evaluating the dynamic influences of associated candidate genes. Such analysis could propose a list of gene drug targets [16]. In addition, disease databases are valuable tools for investigating asthma epidemiology, providing real-world data on the symptoms and genetic background of asthma patients [17].
To understand the genetic causes of a complex disease such as asthma, a multidisciplinary analysis approach is needed to connect such a variety of resources and extract useful and conclusive information. Therefore, I decided to study the comprehensive genetic susceptibility profile for asthma patients using an integrative bioinformatics platform, mainly to evaluate the genetic susceptibility profile of moderate and severe asthma, and determine the molecular factors that regulate the severity and pathogenicity of asthma. To achieve this goal, I attempted (a) to identify genes showing significant differences in expression between patients with asthma endotypes and controls; (b) to study gene networks, families, pathways, ontologies and protein–protein interactions affecting asthma; (c) to assess single nucleotide variations in asthma-related genes, and (d) to determine genetic similarities between asthma-related genes.

2. Results

2.1. DEG Identification

A total of 417 DEGs were detected through the analysis of moderate, severe asthma and asthma-phase related (moderate-to-severe) phenotypes (Table S1).The samples were derived from human fresh bronchial epithelial cells from normal and asthmatic patients. A total of 108 samples were in this data set, which included 20 normal controls, 50 moderate asthma patients, and 38 severe asthma patients. The top 250 DEGs for each of the moderate and severe asthma groups were generated by comparing the 50 moderate and 38 severe asthmatic patients individually with the 20 normal controls. Additionally, the top 250 DEGs were developed to classify moderate-to-severe genes by comparing the 50 moderate asthma samples to the 38 severe asthma samples (Figure 1B–D and Table S1). The human genome information of GRCh38 (Venter et al., 2001), http://m.ensembl.org/Homo_sapiens/Info/Annotation#assembly, was used to demonstrate all genes that are significantly differentiated among the comparison methods and their corresponding chromosomal location (Figure 1G). The disease–gene association p-value scores (−1og10) in moderate asthma-related genes ranged from 3.2 (ZNF862) to 6 (PER2) (Figure 1D and Table S2), while in severe asthma-related genes, it varied from 2.2 (TMCC1) to 6 (SLCO1B3, and WNK4) (Figure 1C and Table S2). In moderate-to-severe asthma-related genes, it ranged from 3 (AIM1L) to 7.73 (WNK4) (Figure 1B and Table S2).

2.2. Pathogenic SNP Analysis among DEGs in Asthmatic Patients

The Ensembl database was used to search pathogenic SNPs and related diseases (Figure 1E,F and Table S1). A high frequency of shared pathogenic SNPs related to type I osteogenesis imperfecta disease (161 SNPs) and Lynch syndrome (40 SNPs) were detected among moderate asthma-related genes. Moreover, patients with severe asthma shared 164 and 57 pathogenic SNPs in genes related to type I osteogenesis imperfecta disease and inborn genetic diseases, respectively. The moderate-to-severe asthma phase shared a high number of genes with inborn genetic diseases (59 SNPs), achromatopsia 3 (63 SNPs), and hereditary cancer-predisposing syndrome (80 SNPs) (Figure 1F and Table S2). CNGB3, BMPR1A, PKP2, and COL1A1 had the highest number of pathogen-associated SNPs (63, 76, 94, and 284, respectively) (Figure 1E and Table S1).

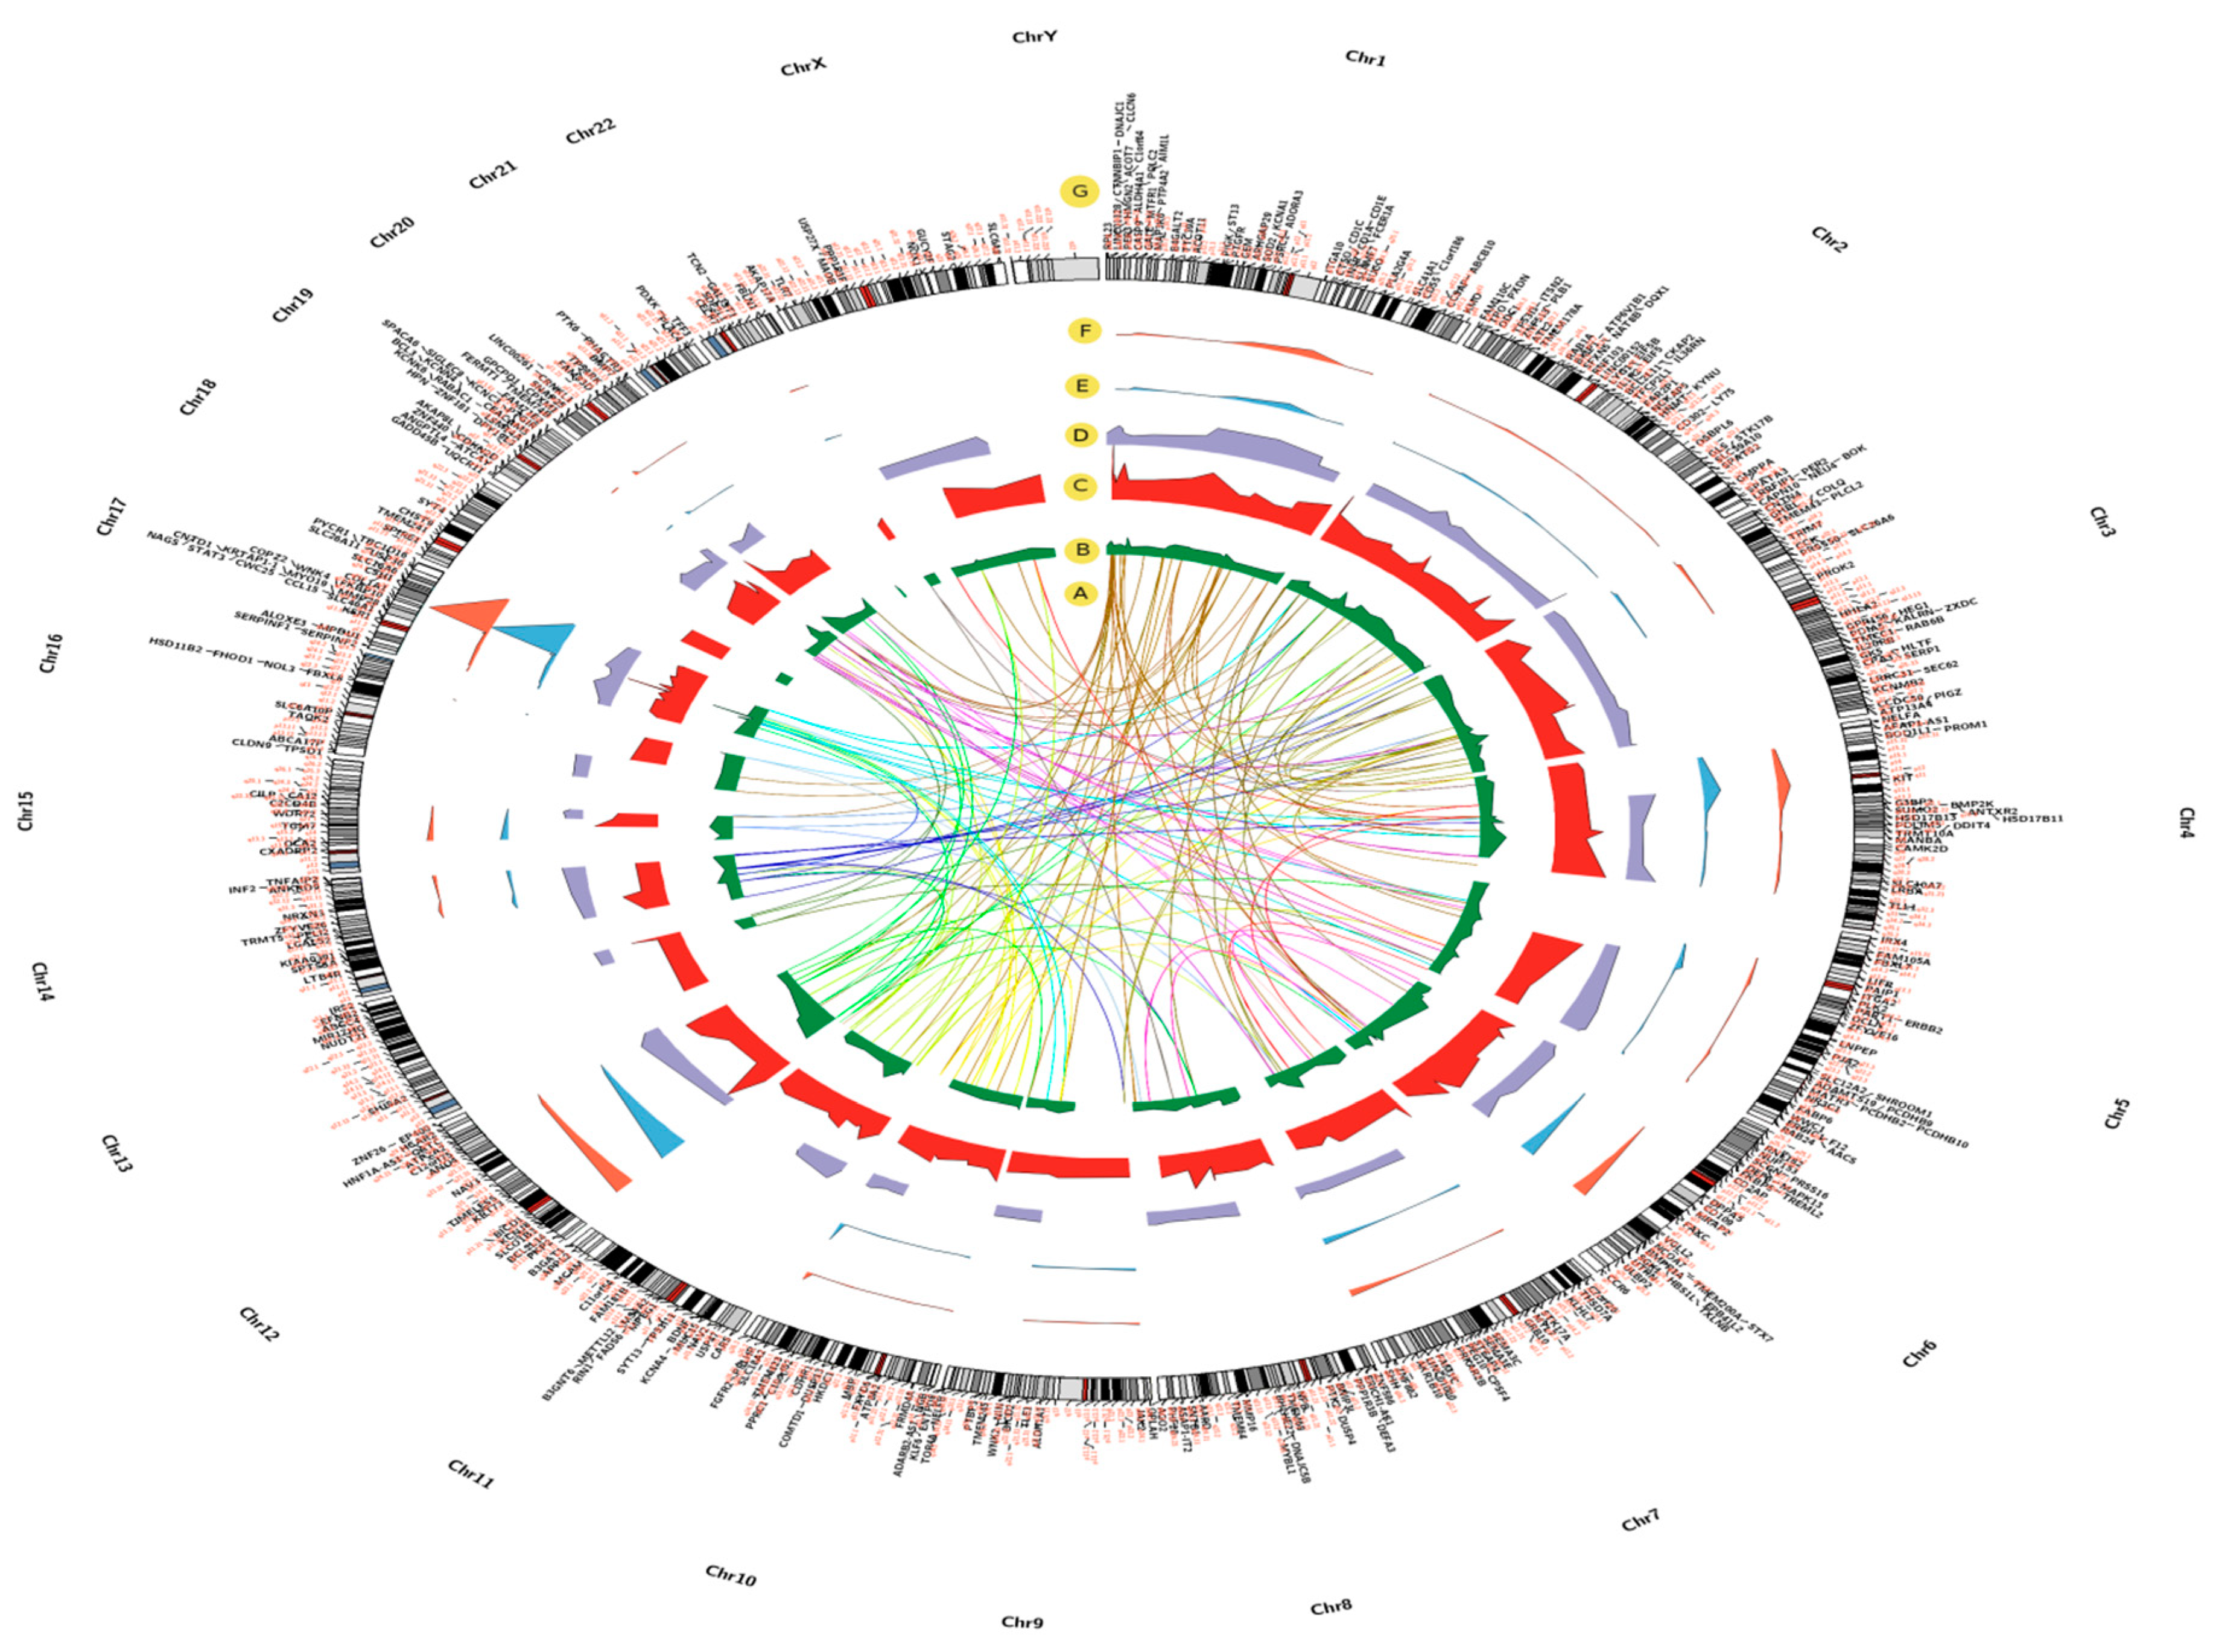
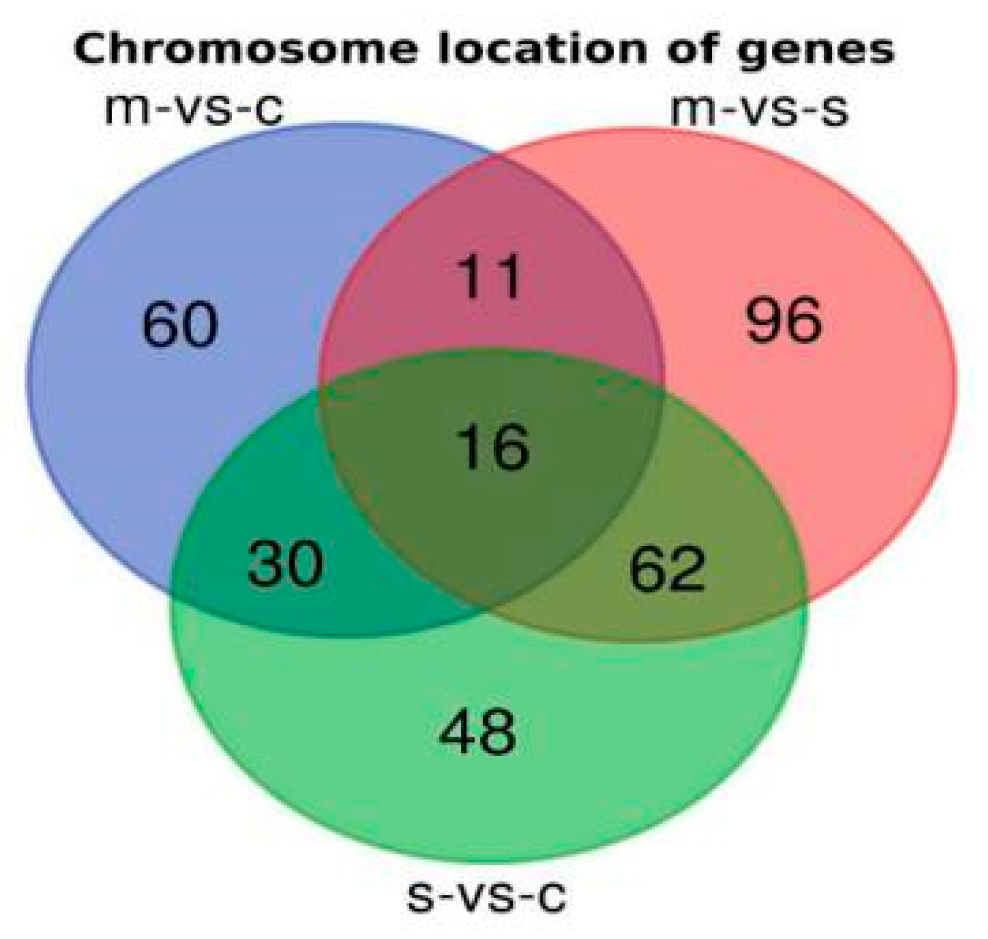
2.3. Chromosomal Locations of DEGs among Asthma Patients

The genome localization of DEGs in asthma patients showed a high abundance for chromosomal locations, including 17q25.3, 6q22.32, 2q13, 19q13.1, and 2q37.3 in patients with moderate asthma, 17q21.2, 6p21.31, and 1p36 in patients with severe asthma, and 17q12 in patients with moderate-to-severe asthma (Figure 1G and Figure 2 and Table S1). Intersection of chromosome locations of asthma-associated DEGs has shown a high number of chromosome regions shared between severe and moderate-to-severe asthma profiles (Figure 2).

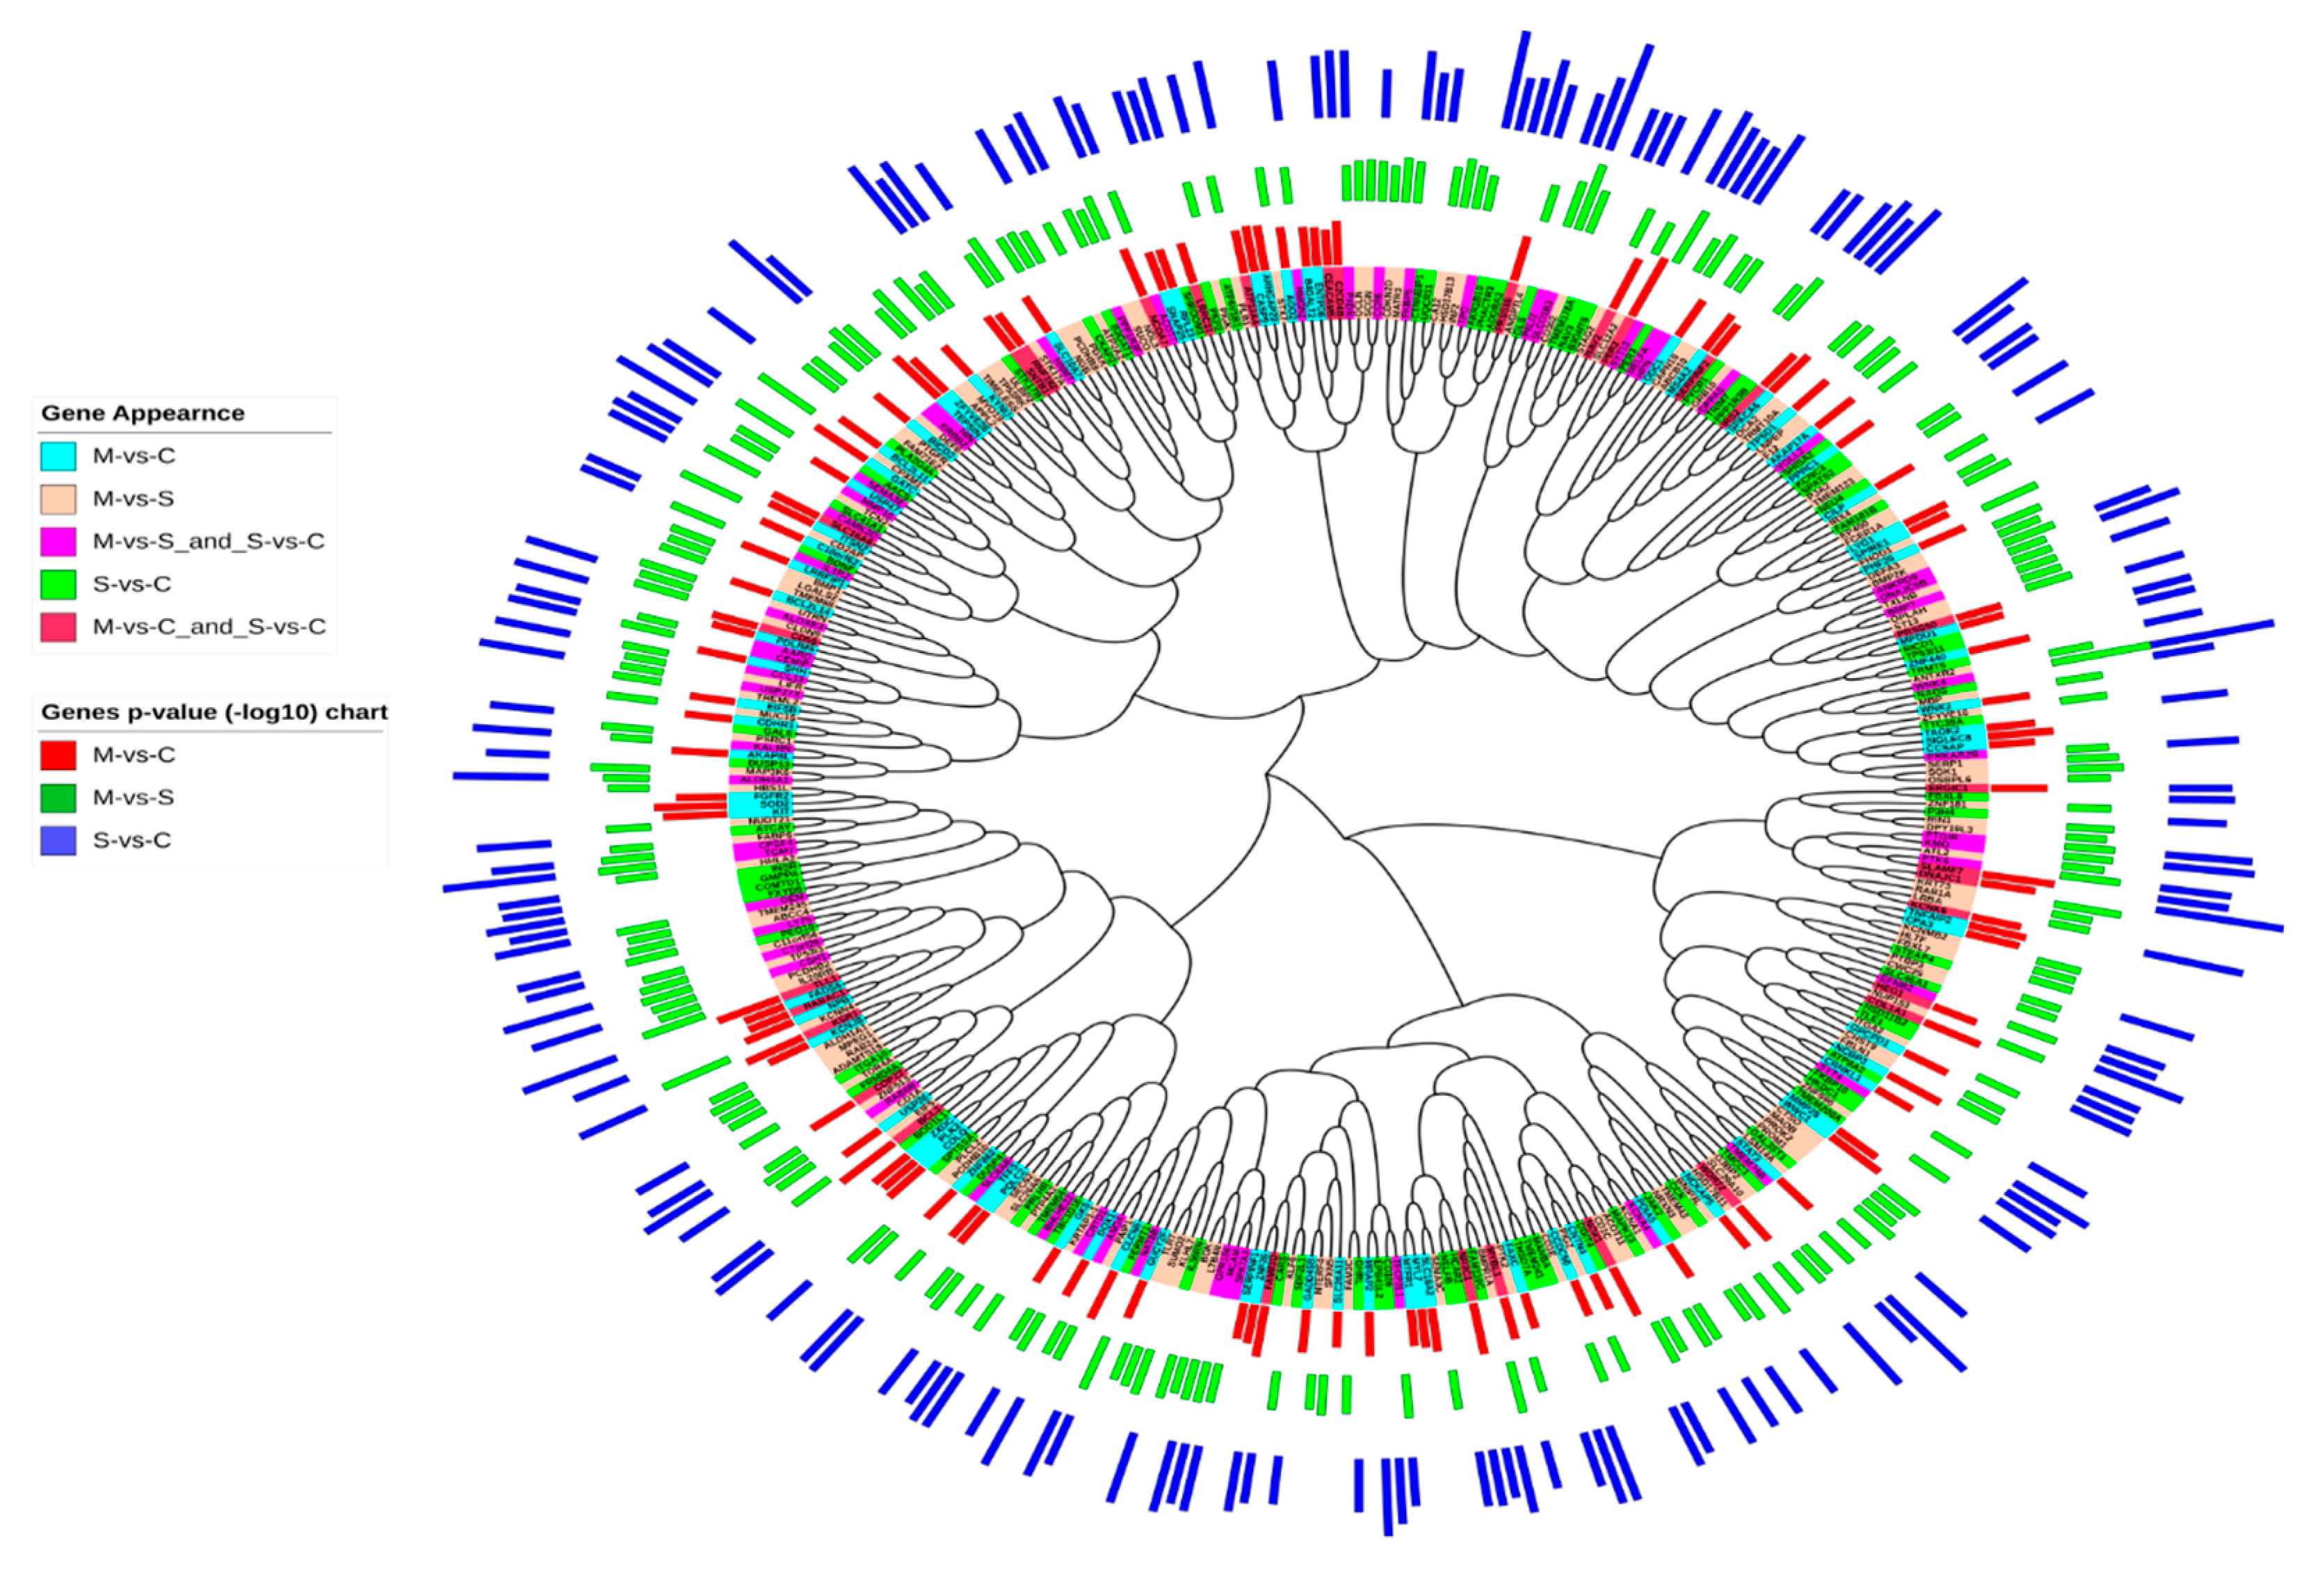
2.4. Sequence Similarities between DEGs in Asthmatic Patients

The BLAST sequence alignment tool was used to infer sequence similarity between DEGs and to screen for genes with a high similarity and common functions (Figure 1A). The BLAST analysis showed that MBP and WNK2 DEGs have five other similar genes in the asthma-related gene group. When comparing gene sequences using sequence similarity, 20 genes have more than two similar genes, indicating gene clustering and a possible common function (Figure 1A). Multiple sequence alignment is a great tool that can be used effectively for gene clustering, in which genes with a similar sequence structure are clustered into one category. This technique is very useful in the study of family genes, which are supposed to control specific biological tasks [18]. These clustered genes are commonly translated into phylogenetic trees, which depict the genetic relationship between genes. Genes with high sequence similarities and possible common functions are clustered in one branch. Using this approach, I tried to combine asthma-related gene details with phylogenetic analysis to obtain a more definitive understanding of their typical role (Figure 3). Phylogenetic analysis, gene expression in the asthma phase and the statistical significance of asthma-related genes resulted in DEGs clustered into five main categories (Figure 3).

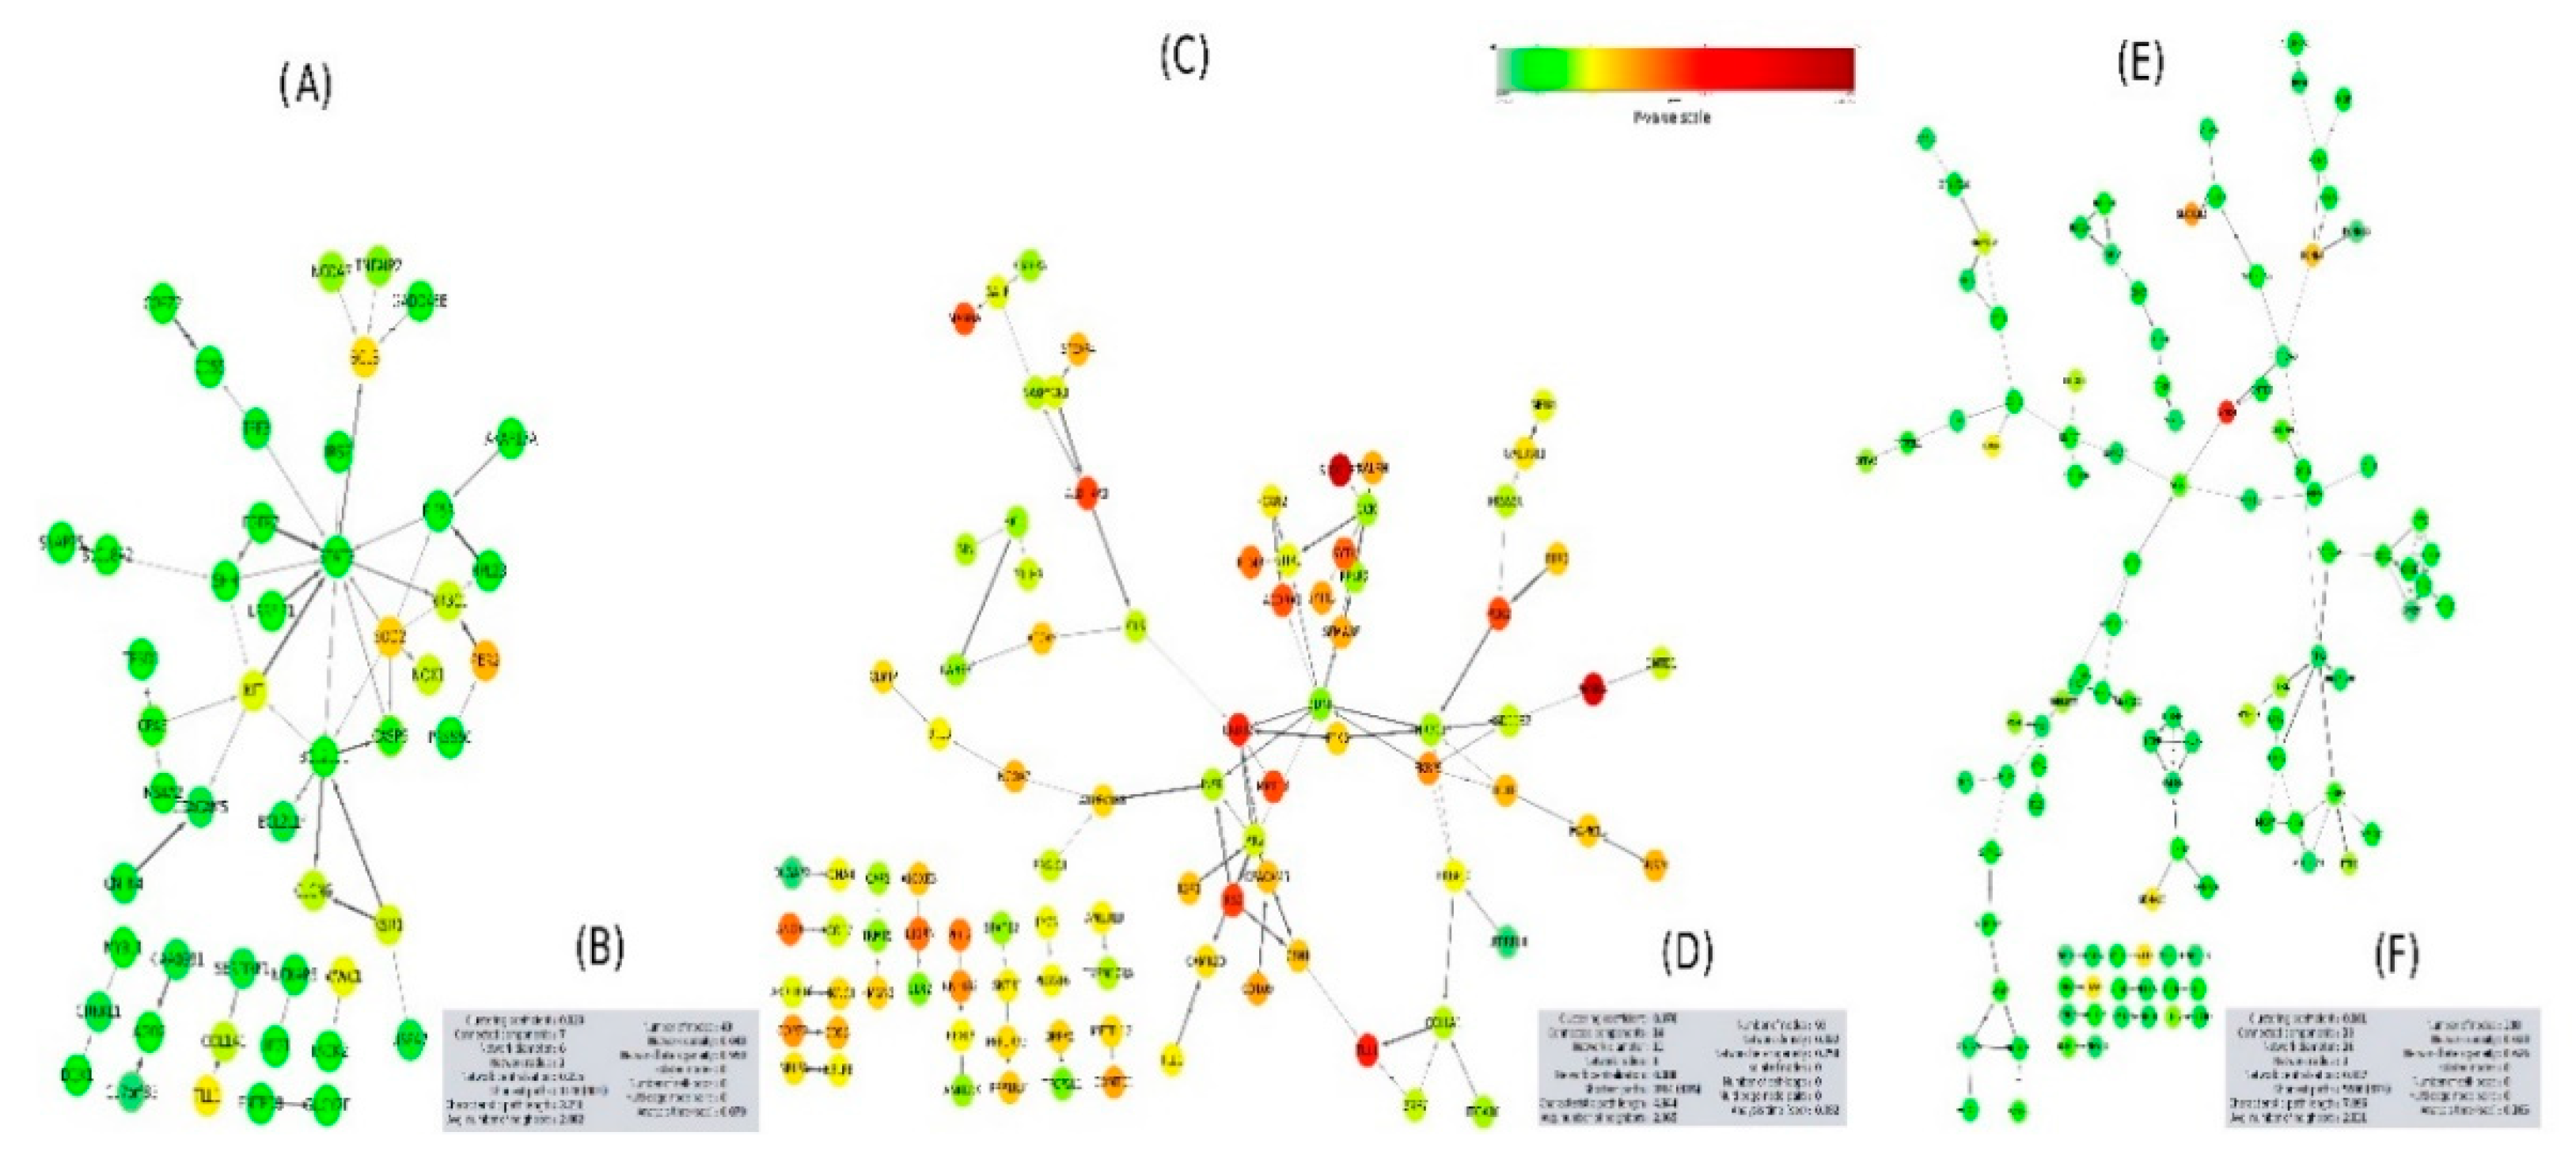
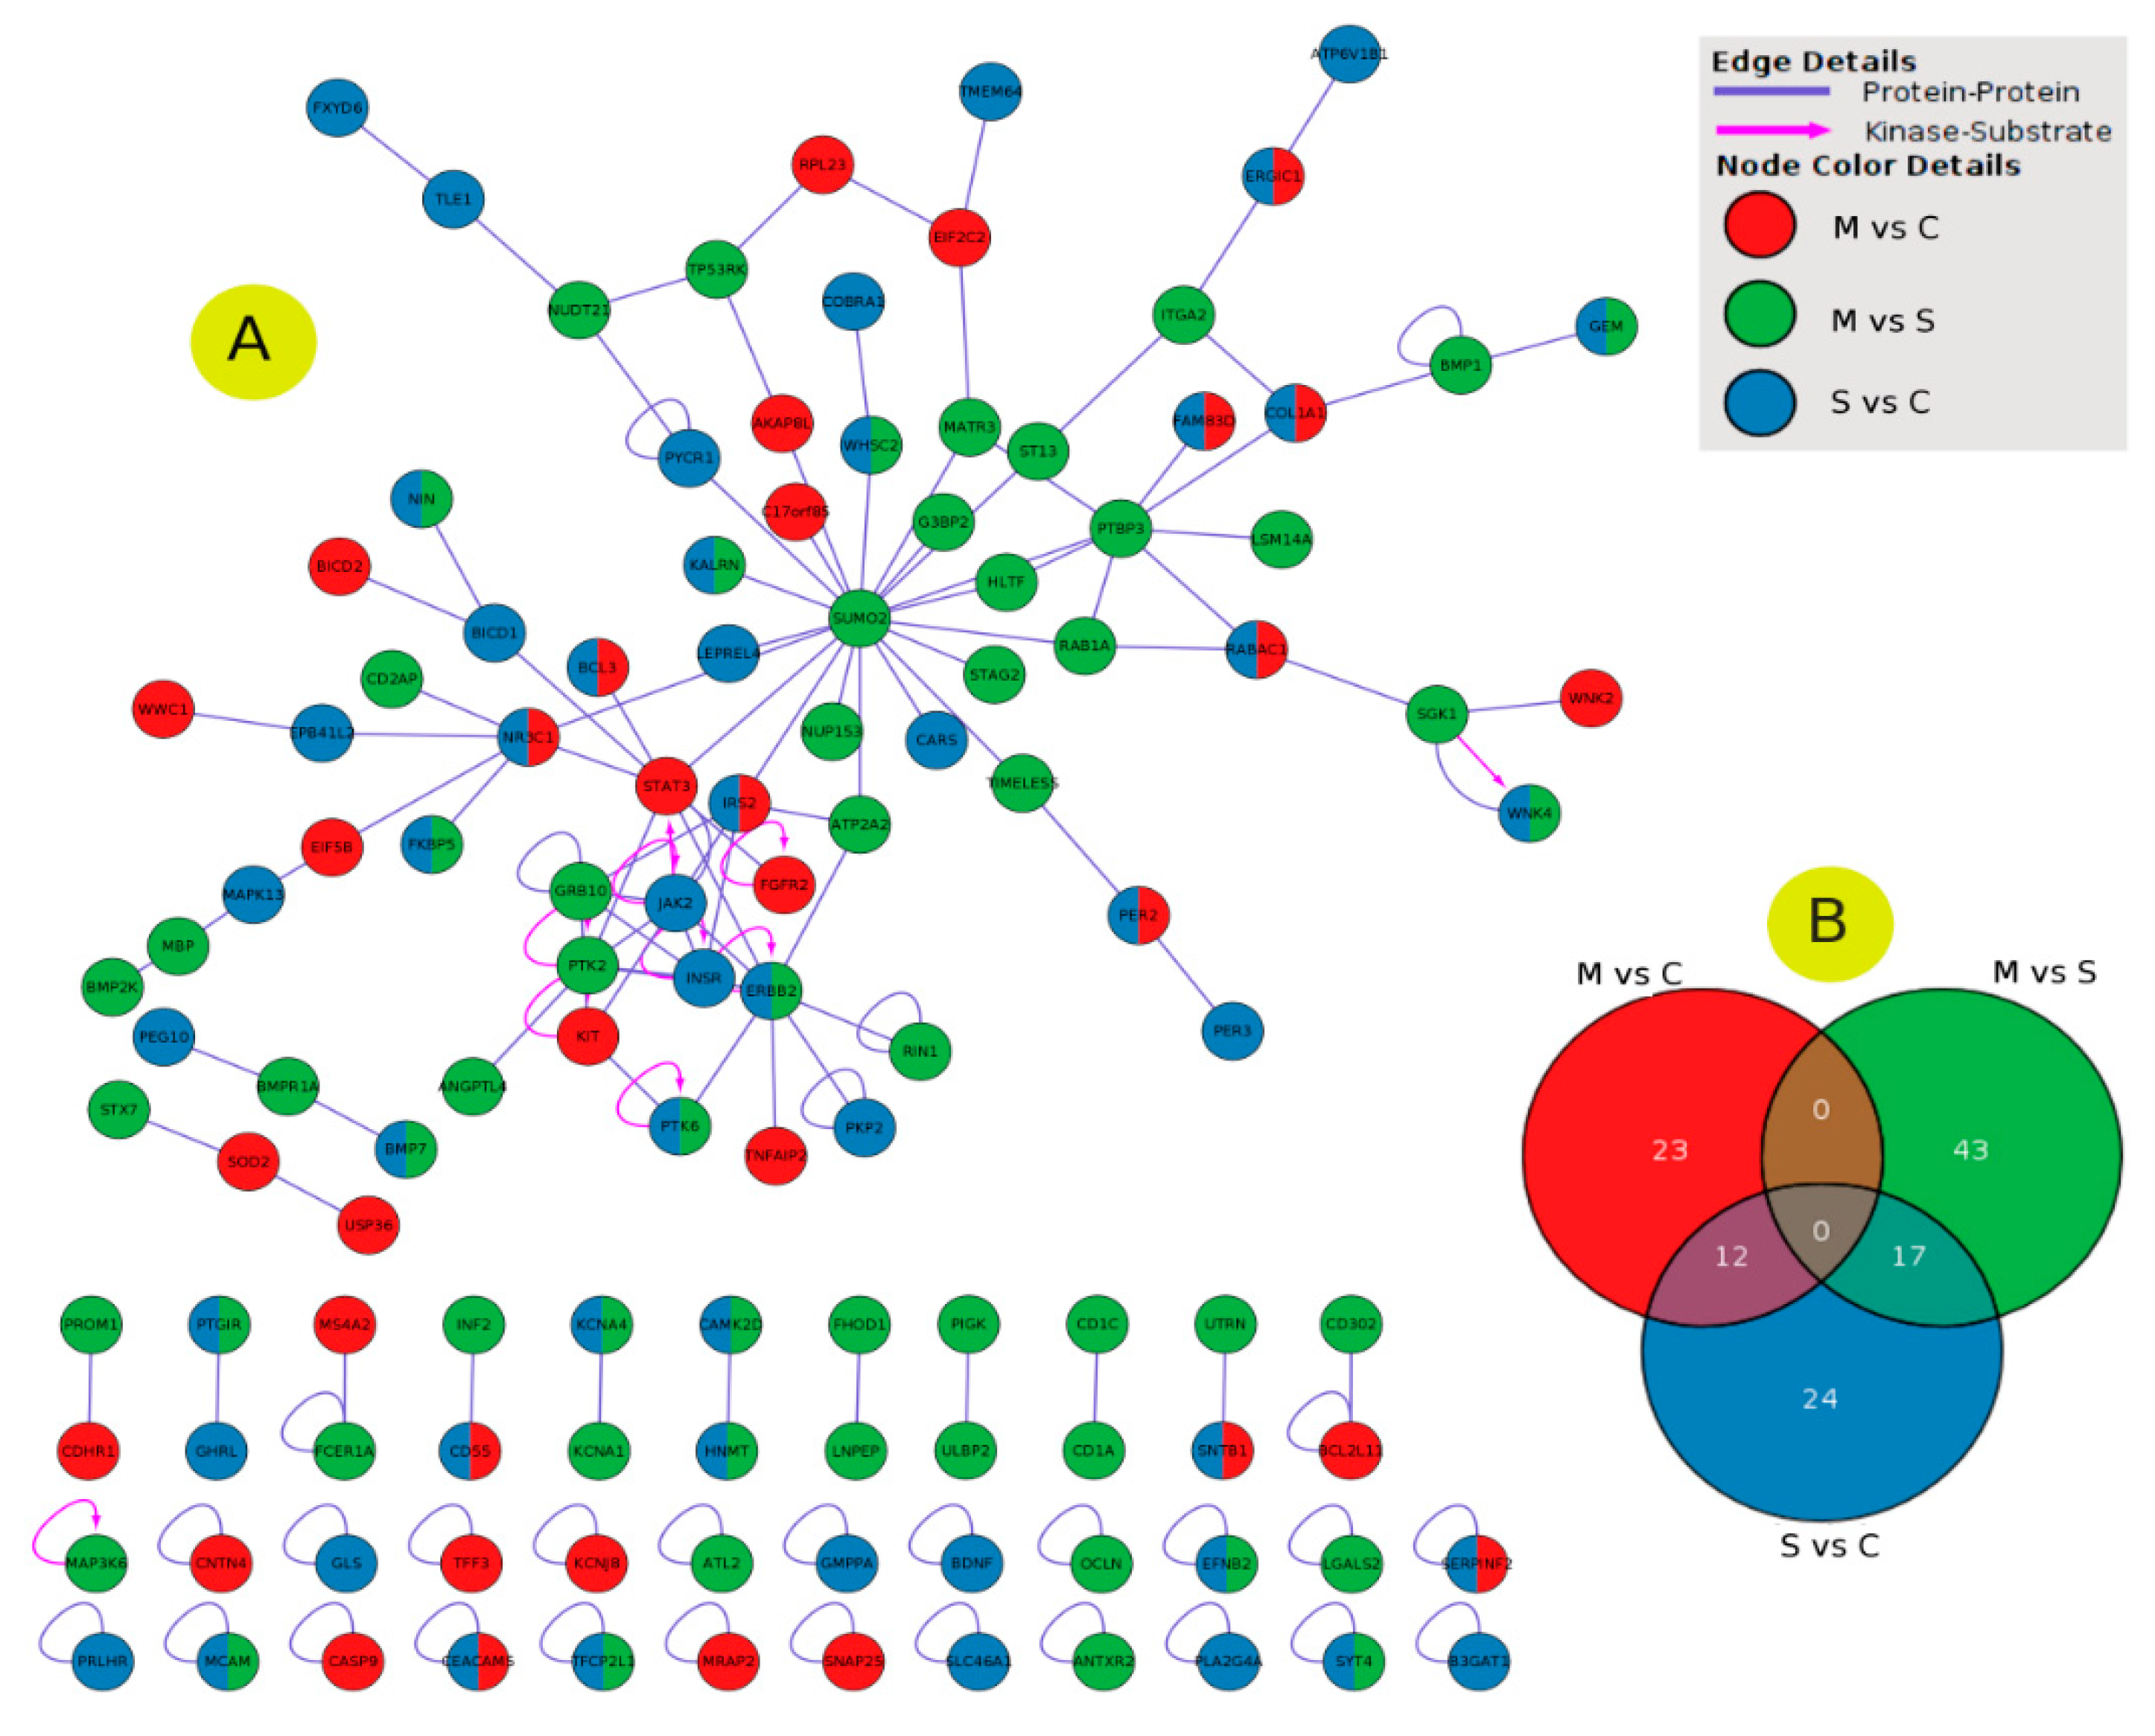
2.5. PPI Network Interaction

I have used the STRING tool to evaluate the PPI network for DEGs for patients with moderate, severe, and moderate-to-severe asthma (Figure 4). PPI analysis revealed that some genes have a highly significant association with the different types of asthma; these include: PER2, SLAMF7, SOD2, BCL3, TLL1, SIGLEC8, and NAV2 for moderate asthma (Figure 4A), SLCO1B3, DNAJC1, WNK4, TPO, TMEM74B, TGM7, and PLAC4 for severe asthma (Figure 4C), and WNK4, SLCO1B3, KCNN4, CPXM1, SYT13, KRT73, SEMA3E, CD2AP, IL20RB, and NAT8B for moderate-to-severe asthma (Figure 4F). The Cytoscape network analysis tool was used to analyze the clustering gene networks of moderate- (Figure 4B), severe- (Figure 4D), and moderate-to-severe-associated genes (Figure 4F). Protein Interaction Network Analysis for Multiple Sets (PINA4MS) is a Cytoscape plug-in used to evaluate all GSE datasets, thus enhancing the analytical efficacy and visualizing the common DEGs [19]. I used this tool to visualize and link severe, moderate, and moderate-to-severe asthma-related DEGs using the PPI network. It also was used to visualize common and unique genes for each phase (Figure 5A,B). This interaction between different stages of asthma shows that no shared genes have been detected between different sets of comparisons. Although several shared genes have been detected between severe and moderate asthma (12 genes) and between severe and moderate-to-severe asthma (17 genes) (Figure 5B). Some genes were shared between severe and moderate asthma, and these include COL1A1, PER2, FAM83D, ERGIC1, and BCL3. ERBB2, PTK6, FKBP5, and WNK4 (Figure 5A).

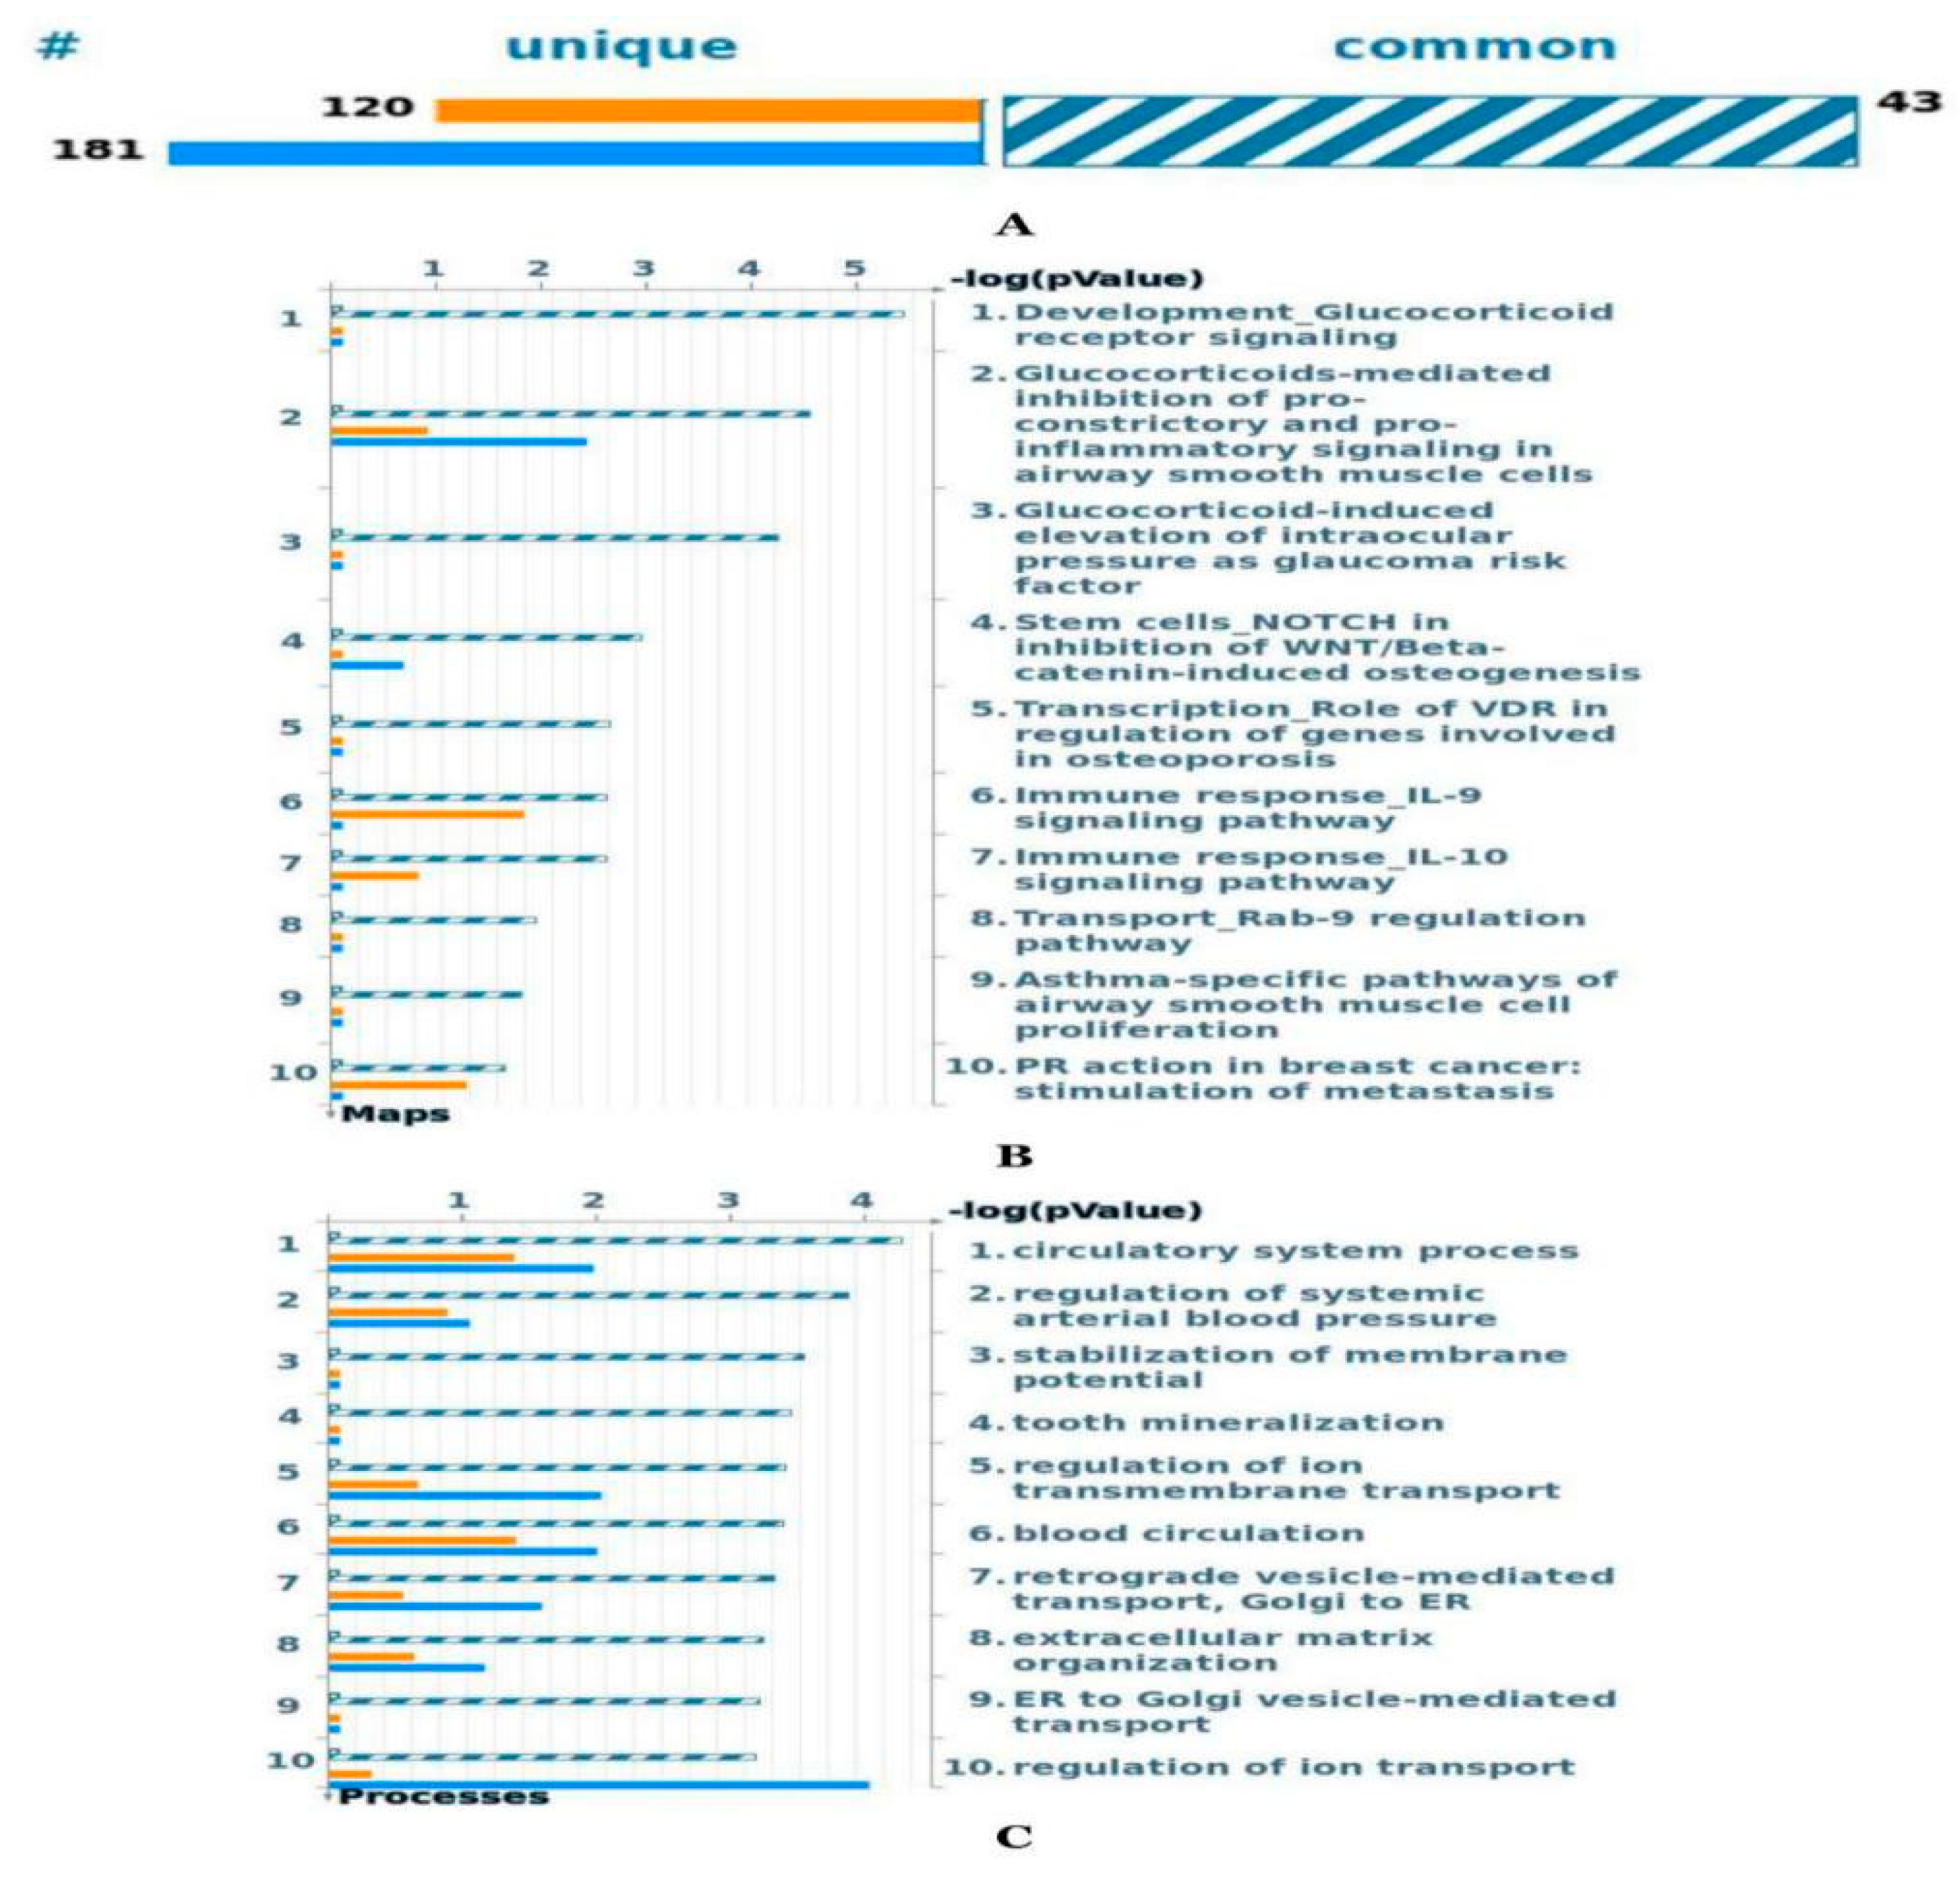
2.6. Enrichment Analysis

To understand the DEG sets between the moderate and severe asthma gene sets, I have used the MetaCore software from Clarivate Analytics to perform an enrichment analysis (EA), which includes pathway maps, GO processes, and process networks. EA comprises matching gene IDs of potential targets for “common” and unique DEG sets with gene IDs in MetaCore functional ontologies.

2.6.1. Comparative Pathways and Gene Ontology Process Analysis between Moderate and Severe Asthma Gene Sets

The number of genes recognized by this database was 163 for moderate asthma and 224 for severe asthma. Of these, 43 genes were common between the two phenotypes, 120 were unique to moderate asthma gene set and 181 were unique to the severe asthma gene set (Figure 6A). The top ten pathways that were enriched in both moderate and severe asthma gene sets are represented in Figure 6B. It seems that the most enriched pathway is the development glucocorticoid receptor signaling pathway; this pathway was enriched equally between the two gene sets. However, the glucocorticoid-mediated inhibition of proconstrictory and proinflammatory signaling in airway smooth muscle cell pathways has shown more enriched gene sets that belong to the severe phenotype (Figure 6B). I used a MetaCore analysis to study the GO biological processes of the gene sets for both the moderate and severe phenotypes. These GOs are involved in many biological processes, which are listed from 1–10 according to their significant association (Figure 6C). These processes are involved in the circulatory system process, regulation of systemic arterial blood pressure, and regulation of ion transmembrane transport.

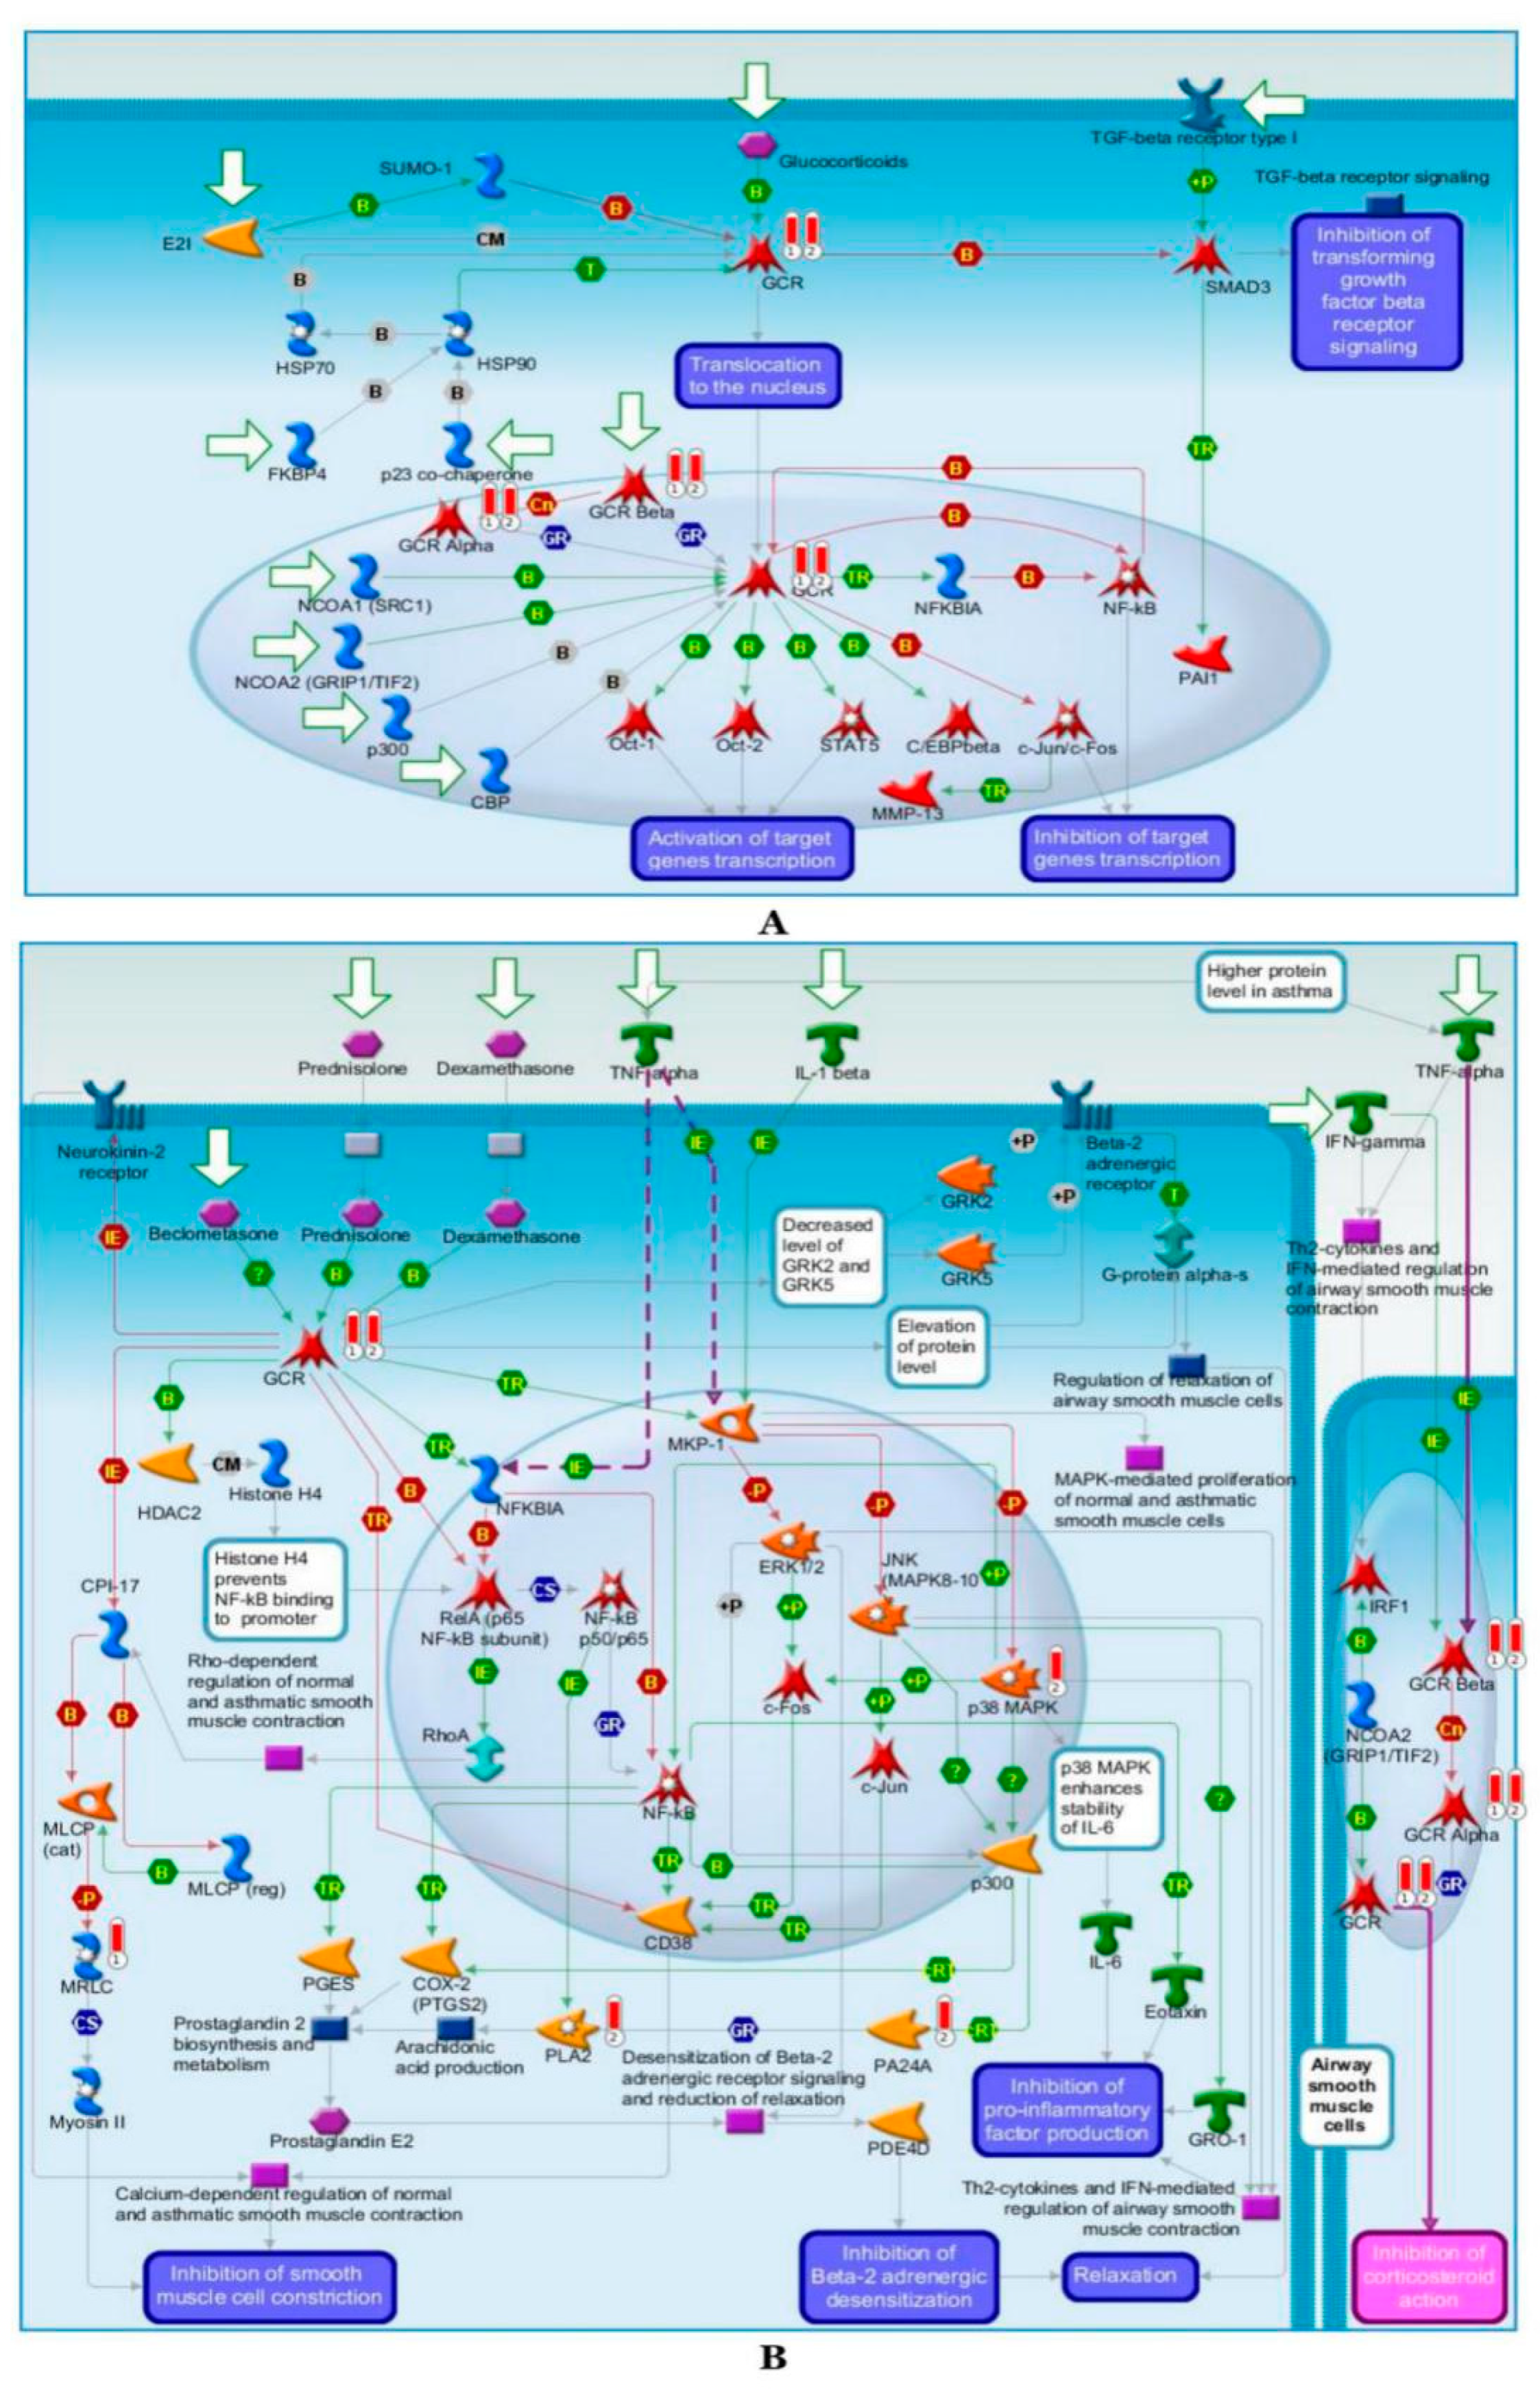
2.6.2. Pathway Map Analysis

The most enriched pathway in both moderate and severe asthma is the development glucocorticoid receptor signaling pathway, which includes the upregulation of GCR, GCR alpha, and GCR beta (Figure 7A), and this is indicated with a full-red color thermometer labeled with “1” for the genes belonging to the moderate asthma phenotype and “2” for the severe asthma phenotype. The second enriched pathway is the glucocorticoids-mediated inhibition of proconstrictory and proinflammatory signaling in the airway smooth muscle cells pathway, in which the MRLC gene is involved in moderate asthma phenotype and the PLA2, p38 MAPK, and PA24A genes are involved in the pathogenesis of the severe asthma phenotype (Figure 7B).

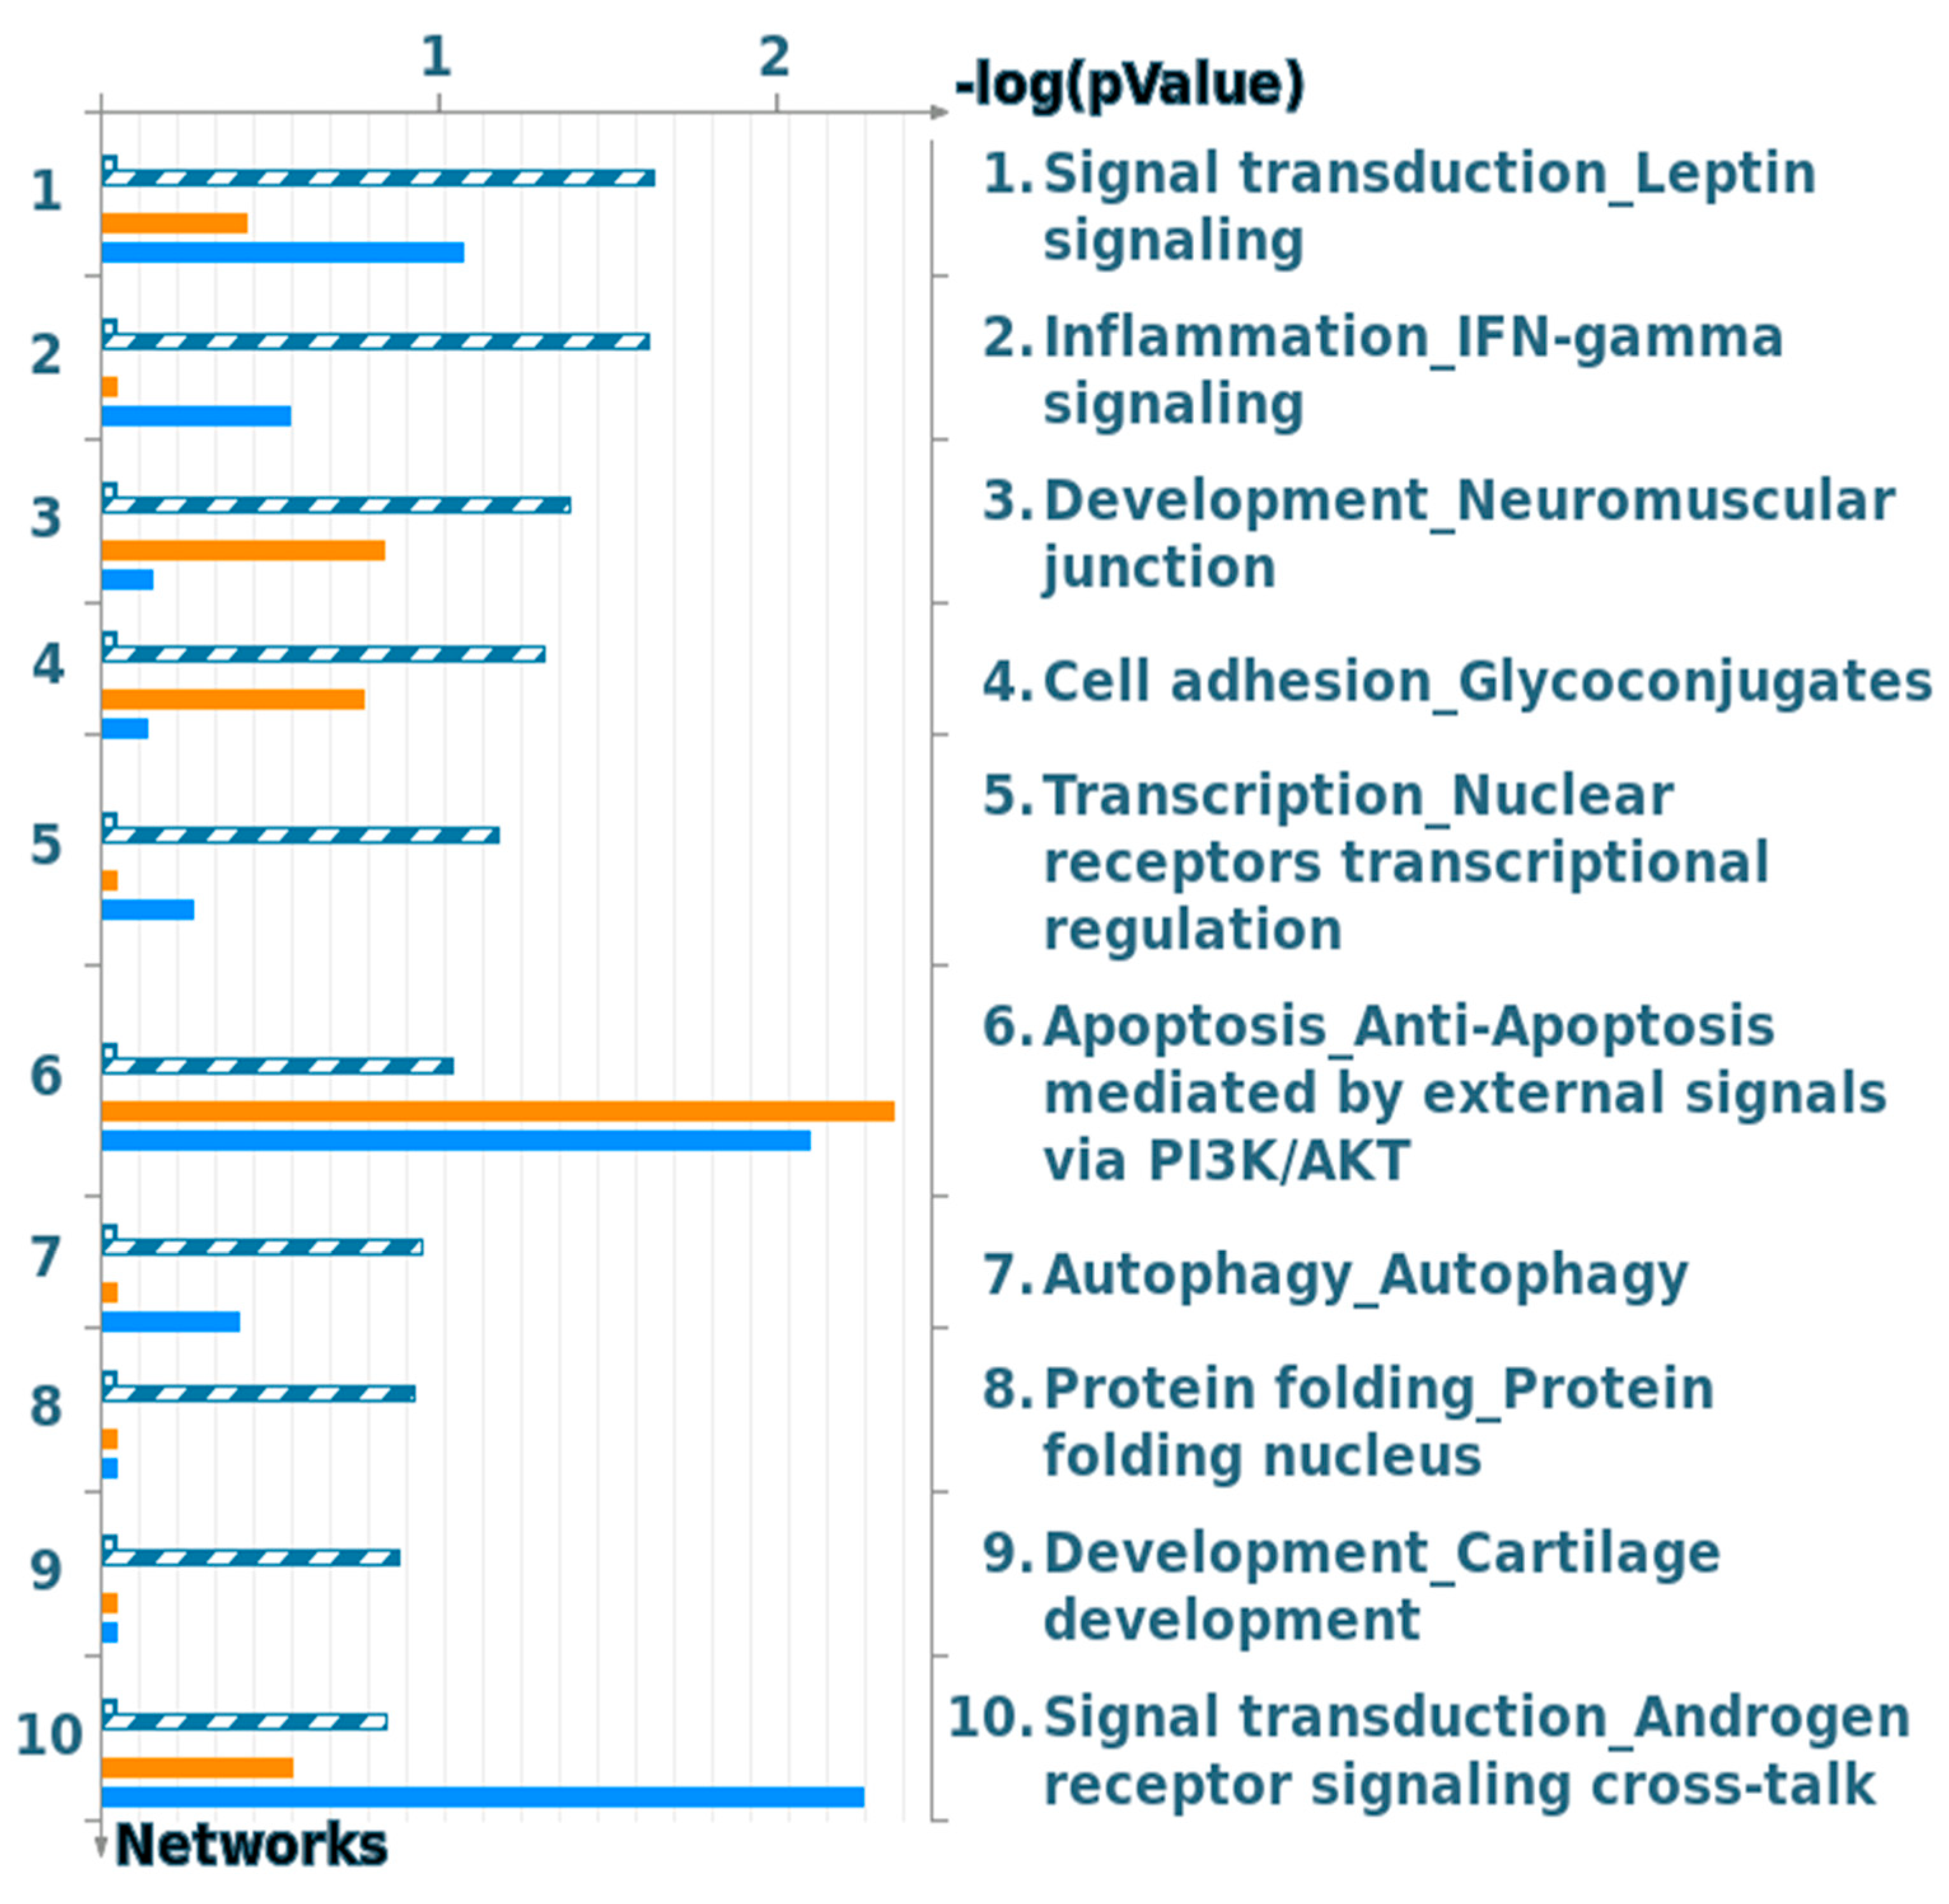
2.6.3. Process Network Analysis

The vast majority of the network that is manually curated with Clarivate Analytics was examined with our DEGs that are specific for moderate and severe asthma through common genes that are involved in the gene network and in the pathogenesis of either asthma phenotype. Interestingly, the most significant process network is involved in the signal transduction of leptin signaling, followed by the inflammation IFN gamma signaling process network (Figure 8).

3. Discussion

Asthma stratification at the molecular level, particularly with the use of accessible biospecimens, could greatly facilitate the selection of patients for targeted therapy. Additionally, an indicator of the genetic background of asthma could be given by the use of omics technology in patients with asthma in different ethnic groups [20,21,22]. In the present work, I used the GSE43696 and the GEO2R tool to individually analyze the top 250 DEGs (p-value < 0.001) for the moderate, severe, and moderate-to-severe asthma phenotypes (Figure 1 and Table S1). This study compared to a previously published research, using the same dataset [23], provides detailed information on the DEGs, gene enrichment networks, and biological pathways that are involved in asthma pathogenicity. In addition, this study dissects the role of the potential genetic factors in the severity of the asthma phenotypes. It also provides a more comprehensive interpretation of the activity of these DEGs linked to their location of chromosome and karyotype, related diseases, pathogenic SNPs, and highlights genes with sequence and function similarities. PPI network analysis yielded DEGs that contribute to interactions that are distinguished from moderate-to-severe asthma. For example, in severe asthma, the combined interaction scores for the STAT3, AGO2, COL1A1, CLCN6, and KSR1 genes yielded a higher interaction for the moderate asthma phenotype (Figure 4A), and the JAK2, INSR, ERBB2, NR3C1, and PTK6 genes (Figure 4C) were more interactive for the severe asthma phenotype. The CD1C, TLR7, PTK2, CD1E, CD1A, and ERBB2 genes had a higher rate of engaging protein interactions in the PPI for the moderate-to-severe asthma phenotype (Figure 4E). The combination of these genes might explain the high genetic complexity and phenotypic heterogeneity of asthmatic patients. For instance, the STAT3 transcription factor is essential for an acute phase response, and for cytokine signaling. Previous reports suggested that STAT3 acts as a new allergic response epithelial regulator; therefore, recent studies support targeting this molecule as the basis for novel asthma therapy [24,25]. Similarly, JAK2 controls white blood cells, a number of red blood cells and platelets that are correlated with severe asthma. Recent clinical validations indicate that inhibition of the JAK2/STAT6 signaling pathway may be considered for ovalbumin-induced asthma therapies [26]. Thus could confirm the strong association of JAK2, STAT3 and severe asthma. Erb-B2 tyrosine kinase 2 (ErbB2) was found to be highly correlated with asthma and was suggested to be a novel therapeutic target for asthma [27,28]. Moreover, both NR3C1 and COL1A1 were linked to inflammation in asthmatic airways [29,30]. While, clinical studies have reported that NR3C1 is strongly associated with asthma severity [31].
This study demonstrated an important role of INSR (insulin receptor) in asthma. The PPI network analysis, among other genes, identified INSR to be more closely related to severe asthma, as it was more interactive in this phenotype (Figure 4A,B and Table S2). This could suggest its potential role in developing complications of asthma. INSR has a potential role in mediating insulin-like growth factor 2 (IGF2) signaling and therefore regulates cell proliferation, growth, migration, differentiation, and survival. It was reported that, INSR has a high correlation with asthma and diabetes [32,33]. Similarly, I have found that discoidin domain receptor 1 (DDR1/PTK3) is strongly linked to chronic obstructive pulmonary disease (COPD), a type of obstructive pulmonary disease typified by having long-term respiratory problems and a weak airflow [34]. Moreover, chloride voltage-gated channel 6 (CLCN6) was found to be involved in lung vasodilatation, pulmonary permeability, and bronchorelaxation and is correlated with disorders, including neural tube defects, folate sensitivity, and benign childhood epilepsy [35,36]. The presence of the argonaut (Ago2) gene among highly associated asthma genes in this study could support previous reports involving posttranscriptional miRNA silencing and asthma. It was assumed that changes in the expression of several miRNAs are correlated with the development of asthma [37]. The interaction of genes, including CD1(c, e, a) and TLR7, in the transition to the severity of asthma could be correlated with its previously published roles in the severity of asthma [38,39]. The high number of genes belonging to the family differentiation cluster (CD) confirms their key role in asthma severity. Such role have been validated through functional validation [40]. Additionally, studying the moderate-to-severe asthma PPI network revealed a higher cluster coefficient than that in the moderate and severe asthma PPI networks (Figure 4E,F), indicating that genes are more actively connected and belong to a common complex network.
EA showed differential enrichment between the moderate and severe asthma phenotypes for various signaling pathways and biological processes in GO (Figure 6 and Table S3). A review of the path map showed that the most enriched common pathway is the development glucocorticoid receptor (GR) signaling pathway, which includes the upregulation of GCR, GCR alpha, and GCR beta in patients with moderate and severe asthma phenotypes (Figure 6A and Table S3). GR is the receptor to which cortisol and other glucocorticoids attach, is expressed in nearly every cell in the body and regulates genes that control metabolism, development, and immune response. The correlation between GR and asthma has been studied, as alternative splicing of GR mRNA expression could identify asthma phenotypes, and some GR genes are reported to be highly correlated with asthma [41,42]. The second enriched pathway is the glucocorticoid-mediated inhibition of proinflammatory and proconstrictory signaling in the airway smooth muscle cell pathway, in which the MRLC gene is involved in moderate asthma and the PLA2, p38 MAPK, and PA24A genes are involved in the pathogenesis of severe asthma (Figure 6B and Table S3). In this respect, arachidonyl phospholipids are selectively hydrolyzed by the protein PA24A; therefore, differences in species and distribution of lipids in the lungs are involved in the effects of cystic fibrosis, lung cancer, and asthma [43,44]. Methylation activity of some genes belonging to the MAPK family has been reported to be highly correlated with remission of asthma [45].
Process network analysis showed that the most significant process network participates in the signal transduction of leptin signaling, followed by the inflammation IFN gamma signaling process network (Figure 8). Previously, the connection between leptin signaling and asthma was reported, and this association could be triggered by the role of this process in maintaining energy homeostasis and body weight; hence, leptin deficiency could provoke cardiovascular disease, dyslipidemia, insulin resistance, stroke, and type 2 diabetes. Thus, airway epithelial leptin signaling is speculated to be involved in asthma pathogenesis [46,47]. Curiously, the inflammatory IFN gamma signaling process network highlighted in this study is closely linked to the JAK/STAT signaling cascade, and two genes, STAT3 and JAK2, belong to the signaling complex (Figure 1 and Table S1). Both genes have a high correlation with asthma pathogenicity (>3.5 p-value (−log10)), where JAK2 and STAT3 were linked to moderate and severe asthma phenotypes and have a high number of pathogenic SNPs (8 and 24 SNPs, respectively) and related human diseases (18 and 37 diseases, respectively) (Figure 1 and Table S1). Moreover, IFNs have been reported as essential mediators of the pathogenesis of asthma [48,49]. Interestingly, the ion transportation regulation pathway was significantly enriched in the severe asthma phenotype compared to the moderate asthma phenotype (Figure 6C). The genes involved in such regulation include PER2, GCR, IRS-2, KCNK7, KCNK6, NOX1, and SCN7A (p-value of 0.0006) (Table S3). PER2 had a high significance in the moderate-to-severe asthma dataset (Figure 1 and Table S1). This is not surprising, given that polymorphisms in this gene could increase the risk of developing certain cancers and have been associated with sleep disorders [50].The association between asthma and sleep disorders could explain the high level of circadian CLOCK-related gene expression (PER2 and GCR) and the high interaction activity of the TIMELESS gene in PPIs for the moderate-to-severe asthma phenotype (Figure 4C). Such an association has been discussed in some studies on gene expression [51], indicating the consequences of such mechanical surveillance disorder and the severity of asthma. Similar to the INSR gene mentioned earlier, IRS-2 is an insulin receptor substrate that is highly associated with diabetes and obesity and negatively controls alternative macrophage activation and allergic inflammation of the lungs. The two genes KCNK7 and KCNK6 belong to the KCNK family of genes that are significantly enriched among the severe asthma patients compared to the moderate asthma phonotype. Interestingly, these two genes together with SCN7A control the K2P potassium and voltage-gated sodium channels, respectively, where its regulation in vascular smooth muscle cells could be a pathophysiological key to the severity of asthma [52]. Moreover, NOX1 is an oxidative stress-induced gene that is highly linked to lung inflammation in asthma and COPD disorders [53].
The involvement of ion regulation in the pathogenesis of asthma has been reported to be involved in the identification of therapeutic targets or pathophysiological mechanisms for better control of the disease [54]. This is regarding its participating in the development of epithelium-based hydroelectrolytic secretions in the control of intracellular Ca(2+) rates and therefore remodeling of airway smooth muscle cells in asthma. Ion channels have therefore been the focus of a number of studies aimed at understanding the pathophysiological mechanisms of asthma or identifying therapeutic targets for stronger disease control [55]. Glucocorticoids are potent anti-inflammatory substances that are widely used in the treatment of asthma. Their effect is mainly due to their interaction with the glucocorticoid receptor that affects the glucocorticoid responsive elements in the promoter region of genes or to the interaction between the glucocorticoid/glucocorticoid receptor complex and other transcription factors, especially activating protein-1 or nuclear factor-kappa B [56,57]. GABA receptors, together with other factors, including GCR, bestrophin-2, and RAPL3, are common risk factors between moderate and severe asthma phenotypes (Table S2). GABA receptors respond to the neurotransmitter gamma-aminobutyric acid (GABA), the primary inhibitory neurotransmitter in the vertebrate CNS; GABA has been shown to regulate smooth muscle contraction in the airway and may be correlated with asthma pathogenesis [58].
One of largest study of asthma genetics was conducted in 2010, which genotyped 10,365 patients vs. 16,110 controls to test for an association between 582,892 SNPs and asthma. This previous study identified genes on chromosomes 2 (IL1RL1/IL18R1), 6 (HLA-DQ), 9 (IL33), 15 (SMAD3), 17 (ORMDL3/GSDMB), and 22 (IL2RB) correlated with asthma [11]. Consistent with my findings (Figure 1 and Table S2), this study reported that moderate and moderate-to-severe asthma phenotypes share part of the same genetic structure. It also indicates that part of the same genetic architecture is shared by moderate and severe asthma phenotypes, which confirm current study findings (Figure 1 and Table S1). Additionally, I can confirm that IL1 family members of IL1R2 have a high significance in severe and moderate-to-severe asthma gene sets, in which p-values are > 4.4 (−log10) (Figure 1 and Table S1). Recently, an asthma study was performed in 2019, genotyped patient-level data for two UK cohorts and then used data from the UK Biobank to gather genomic patient-level data for cases and controls with European descent [59]. They concluded that certain SNP occurrences in genes such as CD247, ERBB2, IL1RL1 and several interleukin family genes are strongly correlated with moderate-to-severe asthma. In accordance with the current study, ERBB2 was found to be strongly associated with severe-to-moderate and severe asthma (Figure 1 and Table S1). Additionally, I found that CD2AP, which is highly interacted with CD247 is highly correlated with moderate-to-severe asthma (Figure 1 and Table S1). Moreover, genome variation of 350,000 individuals were studied to identify novel loci of asthma. Several novel SNPs with large effect on asthma were identified in TNFRSF8/CD302 and BHMG1 genes [60]. Taking in consideration that, Basic helix–loop–helix and HMG-box containing 1 (BHMG1) contains bHLH and HMG-box protein domains. In current investigation, CD302 was strongly correlated with moderate-to-severe asthma (Figure 1 and Table S1). In addition, BHLHE22 and HMGN2, which contain bHLH and HMG-box protein domains, have been found to be highly associated with severe and moderate-to-severe asthma, respectively (Figure 1 and Table S1). In this regard, 113 unique candidate genes were found to be strongly correlated with asthma by studying the genetic variation of 37,846 British white individuals diagnosed with asthma (Pividori et al., 2019). Several of these genes belonged to the family of Solute Carrier protein family. In current study, I have found 12 Solute Carrier genes that are strongly asthma-related, with three, three and two unique association with moderate, moderate-to-severe and severe asthma, respectively (Figure 1 and Table S1). In addition, I have compared my findings to those reported by Pividori et al. [61], where they reported a high association between FAM105A, HNF1A, and childhood and adult–child-shared asthma, respectively. My findings have linked both of FAM105A and HNF1A Antisense RNA 1 (HNF1A-AS1) to moderate-to-severe and severe asthma (Figure 1 and Table S1).
Three gene sets have been shared in 16 chromosomal locations (Figure 1 and Figure 2 and Table S1); these sites include 17p13.1, 16p11.2, 17q21.31, 1p36, and 19q13.2, which are closely linked to asthma, especially those located on chromosome 17 [62]. The 17q12 was reported to be the most significant asthma-associated locus [61]. My findings have shown that 17q12 is shared between moderate, severe, and moderate-to-severe asthma, which may confirm its high significance in asthma pathogenicity (Figure 1 and Figure 2 and Table S1). Phylogenetic analysis using DEG sequences between the three different gene sets has provided very comprehensive information about the relationship between these genes and the stage of the disease, chromosomal locations or synonymous gene names (Figure 3). Several genes intersect in asthma phases, in which RAB24 and ADAMTS19 are located in the same branch in a set of moderate-to-severe asthma genes (Figure 3); these genes are linked to immune gene airway diseases and autophagy [63], suggesting the involvement of these genes in the pathogenesis of asthma.
The use of different bioinformatics research methods in the current study has shed some light on the strength and weakness of these analytical techniques. A number of potential asthma-associated DEGs have been successfully identified in the PPI study, however this survey is mostly based on our current knowledge of known protein interactions and current statistical models. Phylogenetic analysis based on sequence similarity was useful in clustering genes with related functions. However, I should assume that alignment of sequences depending on the protein structure will be more efficient. Thus, we could cluster asthma-associated genes according to their common protein domains. Current work has linked multiple analytical methods through the study of asthma, such as gene-related pathogenic SNPs, sequence similarity, and chromosome location analyses. I have shown that, the analysis of pathogenic SNPs linked to asthma and other diseases could connect asthma to such disorders and perhaps explain some of its pathogenicity. Genes with a large number of disease-associated SNPs may be used to relate DEGs analysis to other omics studies, such as protein structure prediction and genome wide association analyses. However, a higher number of samples may be required to study the complex evolution of asthma, where independent replication of findings is required to assess the validity of my results.

4. Materials and Methods

4.1. Data Retrieval

The data used in this work have been retrieved from the Gene Expression Omnibus database of NCBI (GEO, http://www.ncbi.nlm.nih.gov/geo) and are accessible through GEO Series accession ID GSE43696 [64]. These data are based on the Affymetrix human genome gene chip set, revealing the gene expression profiles of 108 bronchial epithelial cell (BEC) samples isolated from 20 normal controls, 50 mild-moderate asthmatic patients, and 38 severe asthmatic patients. The identification of DEGs in the transcription profile was analyzed using the default parameters in the GEO2R statistical tool [65] using default parameters. Control transcription profiles of patients with mild-moderate or severe asthma were compared to determine asthma severity-related DEGs.

4.2. Gene Ontology Enrichment and Protein–Protein Interaction Network Analysis

To evaluate the functional annotation and analysis of the vast number of gene profiles within the results, I entered all DEGs into the Database for Annotation, Visualization and Integrated Discovery (DAVID) online tool using the Affymetrix identity code. DAVID identifies canonical pathways related to specific genes by estimating the p-value based on a hypergeometric study to determine the probability of a gene array being correlated with a pathway [66]. The interconnection of selected genes dependent on literature-based annotations was generated by GeneGO™ MetaCore™ software (Encinitas, CA, USA). The evaluation of the PPI network and gene ontology (GO) enrichment was conducted with the STRING database system [67]. Cytoscape software was used to visualize the structures of protein–protein networks [67]. The Protein Interaction Network Analysis for Multiple Sets (PINA4MS) Cytoscape plugin was used to allow the visualization of the shared expressed genes using default parameters [19]. The online tool Draw Venn Diagram (http:/bioinformatics.psb.ugent.be/webtools/Venn/) was used to sketch a Venn diagram to demonstrate some analysis information. Local ClustalW was used to confer gene similarities using default parameters [68]. The iToL phylogenetic configuration was used for constructing a phylogenetic tree [69]. Enrichment analysis (EA) consists of matching gene IDs of possible targets for the “common”, and “unique” sets with gene IDs in functional ontologies in MetaCore. The probability of a random intersection between a set of IDs, the size of target list with ontology entities is estimated in p-value (<0.0001) of hypergeometric intersection. The lower p-value means higher relevance of the entity to the dataset, which shows in higher rating for the entity.

4.3. Genes and Single Nucleotide Polymorphism (SNP) Analysis

The Ensembl database [70] was used to fetch information of previously published pathogenic SNPs related to asthma-associated genes using Ensembl-BioMart [71]. The ClinVar database was used to search for known disease-associated SNPs [72]. The local BLASTp tool [73] was used to detect possible sequence similarities between amino acid sequences of asthma-associated DEGs. DEGs with alignment length of more than 300 amino acids, sequence similarity of 70% for the aligned area and e-value < 0.0001 were considered similar to each other. Circos software [74] was used to depict different obtained data on the human genome (GRCh38). Tools used to perform these analyses are described in File S1.

5. Conclusions

Asthma is a complex disease that has yet to be defined genetically. This study used a comprehensive molecular bioinformatics approach to delineate the molecular genetic profile of asthma. The PPI network analysis identified DEGs that contribute to the development of severe asthma. These genes may explain certain features of asthma severity, including allergic response (STAT3) and inflammation in asthmatic airways (NR3C1 and COL1A1). It also highlighted genes that link severe asthma to hematopoietic system disorders (JAK2). EA showed differential enrichment between moderate and severe asthma phenotypes and shed light on the proinflammatory signaling of the airway smooth muscle pathway, in which the MRLC gene is involved in the pathogenesis of moderate asthma and the PLA2, p38 MAPK, and PA24A genes are involved in the pathogenesis of severe asthma. Analysis of the process network recorded the significance of the inflammation IFN-gamma signaling process network and ion transport regulatory pathway when comparing severe and moderate asthma phonotypes. It also illustrated the role of some CLOCK-related circadian genes (PER2 and GCR). The chromosomal location analysis of asthma-associated genes shows 16 chromosomal loci shared between moderate and severe asthma phenotypes, some of which are closely related to asthma (17p13.1, 16p11.2, 17q21.31, 1p36, and 19q13.2). Additionally, I have identified novel genetic risk factors for the development of moderate-severe asthma that will provide a better understanding of this difficult-to-treat patient population. My results suggest that the genes that contribute to the pathogenesis of moderate asthma are unique to those involved in the pathogenesis of severe asthma and that even the genes that play a role as a hub between the different genes are also different; this is an important observation, as it will guide therapeutic developments by refining the drug development targets.

Supplementary Materials

Can be found at https://www.mdpi.com/1422-0067/21/11/4022/s1. File S1. The programming scripts and software parameters used in this study. Table S1. DEGs information GSE43696 for the top 250 DEGs (p-value < 0.001) for both the moderate, severe asthma and asthma-phase related (moderate-to-severe) phenotypes individually. (A) The significance p-value (−log10) for asthma-associated genes related to moderate, severe and asthma-phase, here known single nucleotide variation (B) associated pathogenic SNPs (C) and the intersection of their chromosomal location among the three gene sets (D). Table S2. Significant gene networks and their associated biological processes. Table S4. The analysis report of gene enrichment for asthma-associated genes. Table S3. The analysis report of gene enrichment for asthma-associated genes.

Funding

This research received no external funding.

Acknowledgments

This publication was supported by Qatar University Internal Grant No.: QUST-1-CHS-2020-2.

Conflicts of Interest

The authors declare no conflict of interest.

References

  1. Loftus, P.A.; Wise, S.K. Epidemiology of Asthma. Curr. Opin. Otolaryngol. Head Neck Surg. 2016, 24, 245–249. [Google Scholar] [CrossRef] [PubMed]
  2. Illig, T.; Wjst, M. Genetics of asthma and related phenotypes. Paediatr. Respir. Rev. 2002, 3, 47–51. [Google Scholar] [CrossRef] [PubMed]
  3. Ramratnam, S.K.; Bacharier, L.B.; Guilbert, T.W. Severe asthma in children. J. Allergy Clin. Immunol. Pract. 2017, 5, 889–898. [Google Scholar] [CrossRef] [PubMed]
  4. Fitzpatrick, A.M.; Moore, W.C. Severe asthma phenotypes—how should they guide evaluation and treatment? J. Allergy Clin. Immunol. 2017, 5, 901–908. [Google Scholar] [CrossRef] [PubMed]
  5. Ray, A.; Raundhal, M.; Oriss, T.B.; Ray, P.; Wenzel, S.E. Current concepts of severe asthma. J. Clin. Investig. 2016, 126, 2394–2403. [Google Scholar] [CrossRef]
  6. Longo, G.; Strinati, R.; Poli, F.; Fumi, F. Genetic factors in nonspecific bronchial hyperreactivity. An epidemiologic study. Am. J. Dis. Child. 1987, 141, 331–334. [Google Scholar] [CrossRef]
  7. Sibbald, B.; E Horn, M.; Gregg, I. A family study of the genetic basis of asthma and wheezy bronchitis. Arch. Dis. Child. 1980, 55, 354–357. [Google Scholar] [CrossRef] [Green Version]
  8. Ramachandra, N.B.; Davoodi, P.; Mahesh, P.A.; Holla, A.D. Family history & the risk for adult onset asthma. Indian J. Med Res. 2015, 141, 361–363. [Google Scholar] [CrossRef]
  9. Murphy, T.; Wong, C.; Arseneault, L.; Burrage, J.; Macdonald, R.; Hannon, E.; Fisher, H.L.; Ambler, A.; Moffitt, T.E.; Caspi, A.; et al. Methylomic markers of persistent childhood asthma: A longitudinal study of asthma-discordant monozygotic twins. Clin. Epigenetics 2015, 7, 130. [Google Scholar] [CrossRef] [Green Version]
  10. Ullemar, V.; Magnusson, P.K.E.; Lundholm, C.; Zettergren, A.; Melén, E.; Lichtenstein, P.; Almqvist, C. Heritability and confirmation of genetic association studies for childhood asthma in twins. Allergy 2015, 71, 230–238. [Google Scholar] [CrossRef]
  11. Moffatt, M.F.; Gut, I.G.; Demenais, F.; Strachan, D.P.; Bouzigon, E.; Heath, S.; Von Mutius, E.; Farrall, M.; Lathrop, M.; Cookson, W.O.; et al. A large-scale, consortium-based genomewide association study of asthma. N. Engl. J. Med. 2010, 363, 1211–1221. [Google Scholar] [CrossRef] [PubMed] [Green Version]
  12. Alrashoudi, R.H. Gene Expression Data Analysis Identifies Multiple Deregulated Pathways in Patients with Asthma, Bioscience Reports. Biosci. Rep. 2018, 38, BSR20180548. [Google Scholar] [CrossRef] [PubMed] [Green Version]
  13. Willis-Owen, S.A.; Cookson, W.O.; Moffatt, M.F. The Genetics and Genomics of Asthma. Annu. Rev. Genom. Hum. Genet. 2018, 19, 223–246. [Google Scholar] [CrossRef] [PubMed]
  14. Thomsen, S.F. Genetics of asthma: An introduction for the clinician. Eur. Clin. Respir. J. 2015, 2, 215. [Google Scholar] [CrossRef] [PubMed] [Green Version]
  15. Bunyavanich, S.; Schadt, E.E. Systems biology of asthma and allergic diseases: A multiscale approach. J. Allergy Clin. Immunol. 2014, 135, 31–42. [Google Scholar] [CrossRef] [PubMed] [Green Version]
  16. Hwang, S.; Son, S.-W.; Kim, S.C.; Kim, Y.J.; Jeong, H.; Lee, D.-J. A protein interaction network associated with asthma. J. Theor. Boil. 2008, 252, 722–731. [Google Scholar] [CrossRef]
  17. Sweeney, J.; Patterson, C.C.; Menzies-Gow, A.; Niven, R.M.; Mansur, A.H.; Bucknall, C.; Chaudhuri, R.; Price, D.; Brightling, C.E.; Heaney, L.G. Comorbidity in severe asthma requiring systemic corticosteroid therapy: Cross-sectional data from the Optimum Patient Care Research Database and the British Thoracic Difficult Asthma Registry. Thorax 2016, 71, 339–346. [Google Scholar] [CrossRef] [Green Version]
  18. Deokar, A.A.; Tar’An, B. Genome-Wide Analysis of the Aquaporin Gene Family in Chickpea (Cicer arietinum L.). Front. Plant Sci. 2016, 7, 1802. [Google Scholar] [CrossRef] [Green Version]
  19. Cowley, M.J.; Pinese, M.; Kassahn, K.; Waddell, N.; Pearson, J.V.; Grimmond, S.; Biankin, A.V.; Hautaniemi, S.; Wu, J. PINA v2.0: Mining interactome modules. Nucleic Acids Res. 2011, 40, D862–D865. [Google Scholar] [CrossRef]
  20. Galeone, C.; Scelfo, C.; Bertolini, F.; Caminati, M.; Ruggiero, P.; Facciolongo, N.; Menzella, F. Precision Medicine in Targeted Therapies for Severe Asthma: Is There Any Place for “Omics” Technology? BioMed Res. Int. 2018, 2018, 1–15. [Google Scholar] [CrossRef] [Green Version]
  21. Zayed, H. The Arab genome: Health and wealth. Gene 2016, 592, 239–243. [Google Scholar] [CrossRef] [PubMed]
  22. Zayed, H. The Qatar genome project: Translation of whole-genome sequencing into clinical practice. Int. J. Clin. Pr. 2016, 70, 832–834. [Google Scholar] [CrossRef] [PubMed]
  23. Huang, Y.; Liu, H.; Zuo, L.; Tao, A. Key genes and co-expression modules involved in asthma pathogenesis. PeerJ 2020, 8, e8456. [Google Scholar] [CrossRef] [PubMed]
  24. Gonzalez, J.F.; Eckols, T.; Tuvim, M.; Dickey, B.; Tweardy, D. Selective Small Molecule STAT3 Inhibitor to Treat Eosinophilic and Neutrophilic Asthma in Mice. In A21. Advances in Asthma Pathogenes; American Thoracic Society: New York, NY, USA, 2019; p. 7298. [Google Scholar] [CrossRef]
  25. Simeone-Penney, M.C.; Severgnini, M.; Tu, P.; Homer, R.; Mariani, T.J.; Cohn, L.; Simon, A.R. Airway epithelial STAT3 is required for allergic inflammation in a murine model of asthma. J. Immunol. 2007, 178, 6191–6199. [Google Scholar] [CrossRef]
  26. Yang, X.; Wang, F. The effect of astragaloside IV on JAK2-STAT6 signalling pathway in mouse model of ovalbumin-induced asthma. J. Anim. Physiol. Anim. Nutr. 2019, 103, 1578–1584. [Google Scholar] [CrossRef]
  27. Inoue, H. Dysfunctional ErbB2, an EGF receptor family member, in asthmatic airway epithelial cells critically hinders repair after mechanical wounding. J. Allergy Clin. Immunol. 2019, 143, 2075. [Google Scholar] [CrossRef]
  28. Yan, Y.-R. MiR-216a inhibits proliferation and promotes apoptosis of human airway smooth muscle cells by targeting JAK2. J. Asthma 2019, 56, 938–946. [Google Scholar] [CrossRef]
  29. Keskin, Ö.; Farzan, N.; Birben, E.; Akel, H.; Karaaslan, C.; Ahmadizar, F.; Wechsler, M.E.; Vijverberg, S.J.; Kalayci, O. Genetic associations of the response to inhaled corticosteroids in asthma: A systematic review. Clin. Transl. Allergy 2019, 9, 2. [Google Scholar] [CrossRef] [Green Version]
  30. Pascoe, C.D.; Obeidat, M.; Arsenault, B.A.; Nie, Y.; Warner, S.; Stefanowicz, D.; Wadsworth, S.J.; A Hirota, J.; Yang, S.J.; Dorscheid, D.R.; et al. Gene expression analysis in asthma using a targeted multiplex array. BMC Pulm. Med. 2017, 17, 189. [Google Scholar] [CrossRef]
  31. Panek, M.; Pietras, T.; Antczak, A.; Górski, P.; Kuna, P.; Szemraj, J. The role of functional single nucleotide polymorphisms of the human glucocorticoid receptor gene NR3C1 in Polish patients with bronchial asthma. Mol. Boil. Rep. 2011, 39, 4749–4757. [Google Scholar] [CrossRef] [Green Version]
  32. Tsai, M.-J. Common MicroRNA-mediated Pathobiological Changes in Bronchial Epithelial Cells of Both Asthma and Chronic Obstructive Pulmonary Diseases. In B32. Asthma: Mechanisma of Disease I; American Thoracic Society: New York, NY, USA, 2019; p. A2920. [Google Scholar]
  33. Wu, T.D.; Brigham, E.P.; Keet, C.A.; Brown, T.T.; Hansel, N.N.; McCormack, M.C. Association Between Prediabetes/Diabetes and Asthma Exacerbations in a Claims-Based Obese Asthma Cohort. J. Allergy Clin. Immunol. Pract. 2019, 7, 1868–1873.e5. [Google Scholar] [CrossRef] [PubMed]
  34. Morrow, J. Networks of DNA Methylation Loci in Lung Tissue and Peripheral Blood Highlight Cross-Tissue Epigenetic Signatures of COPD. In C43. Copd and Population Health; American Thoracic Society: New York, NY, USA, 2019; p. A4865. [Google Scholar]
  35. Feng, H. Sample Size Estimation and Type I Error Correction in Genetic Association Studies; University of Idaho: Pocatello, ID, USA, 2016. [Google Scholar]
  36. Mohapatra, S.S.; Lima, J.J. Materials and Methods for Diagnosis of Asthma. U.S. Patent 20130029870A1, 2010. Available online: https://patents.google.com/patent/US20130029870A1/en (accessed on 10 March 2020).
  37. Jiang, X. The Emerging Role of MicroRNAs in Asthma, Molecular and Cellular Biochemistry; Springer: Berlin/Heidelberg, Germany, 2011; Volume 353, pp. 35–40. [Google Scholar]
  38. McCarthy, N.; Jones, H.A.; Marks, N.A.; Shiner, R.J.; Ind, P.W.; Al-Hassi, H.O.; English, N.R.; Murray, C.; Lambert, J.R.; Knight, S.C.; et al. Inhaled allergen-driven CD1c up-regulation and enhanced antigen uptake by activated human respiratory-tract dendritic cells in atopic asthma. Clin. Exp. Allergy 2007, 37, 72–82. [Google Scholar] [CrossRef] [PubMed]
  39. Møller-Larsen, S.; Nyegaard, M.; Haagerup, A.; Vestbo, J.; A Kruse, T.; Børglum, A.D. Association analysis identifies TLR7 and TLR8 as novel risk genes in asthma and related disorders. Thorax 2008, 63, 1064–1069. [Google Scholar] [CrossRef] [PubMed] [Green Version]
  40. Broekema, M.; Volbeda, F.; Timens, W.; Dijkstra, A.; Lee, N.; Lee, J.; Lodewijk, M.; Postma, D.; Hylkema, M.; Hacken, N.H.T.T. Airway eosinophilia in remission and progression of asthma: Accumulation with a fast decline of FEV1. Respir. Med. 2010, 104, 1254–1262. [Google Scholar] [CrossRef] [Green Version]
  41. Fu, G.; Fu, L.; Cai, Y.; Zhao, H.; Fu, W. Association between polymorphisms of glucocorticoid receptor genes and asthma: A meta-analysis. Cell. Mol. Boil. 2018, 64, 13–23. [Google Scholar] [CrossRef]
  42. Schofield, J.P.R.; Bigler, J.; Boedigheimer, M.; Affleck, K.; Taylor, A.; Pavlidis, S.; Riley, J.H.; Strazzeri, F.; Roberts, G.; Brandsma, J.; et al. Topological data analysis (TDA) of U-BIOPRED paediatric peripheral blood gene expression identified asthma phenotypes characterised by alternative splicing of glucocorticoid receptor (GR) mRNA. Paediatr. Asthma Allergy 2018, 52, PA5435. [Google Scholar] [CrossRef]
  43. Dautel, S.E.; Kyle, J.E.; Clair, G.; Sontag, R.L.; Weitz, K.K.; Shukla, A.K.; Nguyen, S.N.; Kim, Y.-M.; Zink, E.M.; Luders, T.; et al. Lipidomics reveals dramatic lipid compositional changes in the maturing postnatal lung. Sci. Rep. 2017, 7, 40555. [Google Scholar] [CrossRef] [Green Version]
  44. Hayakawa, M.; Ishida, N.; Takeuchi, K.; Shibamoto, S.; Hori, T.; Oku, N.; Ito, F.; Tsujimoto, M. Arachidonic acid-selective cytosolic phospholipase A2 is crucial in the cytotoxic action of tumor necrosis factor. J. Boil. Chem. 1993, 268, 11290–11295. [Google Scholar]
  45. Vermeulen, C.J.; Xu, C.-J.; Vonk, J.M.; Hacken, N.H.T.T.; Timens, W.; Heijink, I.H.; Nawijn, M.C.; Boekhoudt, J.; Van Oosterhout, A.J.; Affleck, K.; et al. Differential DNA methylation in bronchial biopsies between persistent asthma and asthma in remission. Eur. Respir. J. 2019, 55, 1901280. [Google Scholar] [CrossRef]
  46. Anathy, V. Airway Epithelium-Specific Deletion of Leptin Receptor Worsens Murine Asthma. In D101. Allergy and Asthma: Novel Regulatory Pathways; American Thoracic Society: New York, NY, USA, 2016; p. 7562. [Google Scholar]
  47. Zhou, Y.; Rui, L. Leptin signaling and leptin resistance. In Frontiers of Medicine; Springer: Berlin/Heidelberg, Germany, 2013; Volume 7, pp. 207–222. [Google Scholar]
  48. Hisada, T.; Aoki-Saito, H.; Koga, Y. Are specialized pro-resolving mediators promising therapeutic agents for severe bronchial asthma? J. Thorac. Dis. 2017, 9, 4266. [Google Scholar] [CrossRef]
  49. Tliba, O.; Amrani, Y. Airway Smooth Muscle Cell as an Inflammatory Cell. Proc. Am. Thorac. Soc. 2008, 5, 106–112. [Google Scholar] [CrossRef]
  50. Kim, D.W.; Chang, C.; Chen, X.; Doran, A.C.; Gaudreault, F.; Wager, T.; Demarco, G.J.; Kim, J.K. Systems approach reveals photosensitivity and PER 2 level as determinants of clock-modulator efficacy. Mol. Syst. Boil. 2019, 15, e8838. [Google Scholar] [CrossRef] [PubMed]
  51. Krakowiak, K.; Durrington, H.J. The Role of the Body Clock in Asthma and COPD: Implication for Treatment. Pulm. Ther. 2018, 4, 29–43. [Google Scholar] [CrossRef] [PubMed] [Green Version]
  52. Ceriotti, S. Assessment of pulmonary vascular smooth muscle remodeling in severe equine asthma. Int. J. Health Anim. Sci. Food Saf. 2017, 4. [Google Scholar] [CrossRef]
  53. Sethi, G.S.; Dharwal, V.; Naura, A.S. Immunological Basis of Oxidative Stress-Induced Lung Inflammation in Asthma and COPD. In Oxidative Stress in Lung Diseases; Springer Science and Business Media LLC: Berlin, Germany, 2019; pp. 195–223. [Google Scholar]
  54. Wang, W.; Ji, H.-L. Epithelial Sodium and Chloride Channels and Asthma. Chin. Med. J. 2015, 128, 2242–2249. [Google Scholar] [CrossRef]
  55. Valverde, M.A.; Cantero-Recasens, G.; Vicente, R.; Jung, C.; Carreras-Sureda, A.; Vicente, R. Ion Channels in Asthma. J. Boil. Chem. 2011, 286, 32877–32882. [Google Scholar] [CrossRef] [Green Version]
  56. Van Der Velden, V.H. Glucocorticoids: Mechanisms of action and anti-inflammatory potential in asthma. Mediat. Inflamm. 1998, 7, 229–237. [Google Scholar] [CrossRef]
  57. Gagliardo, R.; Vignola, A.M.; Mathieu, M. Is there a role for glucocorticoid receptor beta in asthma? Respiratory research. BioMed Cent. 2000, 2, 1. [Google Scholar]
  58. Tohda, Y. Role of GABA receptors in the bronchial response: Studies in sensitized guinea-pigs. Clin. Exp. Allergy J. Br. Soc. Clin. Immunol. 1998, 28, 772–777. [Google Scholar] [CrossRef]
  59. Shrine, N.; A Portelli, M.; John, C.; Artigas, M.S.; Bennett, N.; Hall, R.; Lewis, J.; Henry, A.P.; Billington, C.K.; Ahmad, A.; et al. Moderate-to-severe asthma in individuals of European ancestry: A genome-wide association study. Lancet Respir. Med. 2018, 7, 20–34. [Google Scholar] [CrossRef] [Green Version]
  60. Johansson, A.; Rask-Andersen, M.; Karlsson, T.; E Ek, W. Genome-wide association analysis of 350 000 Caucasians from the UK Biobank identifies novel loci for asthma, hay fever and eczema. Hum. Mol. Genet. 2019, 28, 4022–4041. [Google Scholar] [CrossRef] [PubMed] [Green Version]
  61. Pividori, M.; Schoettler, N.; Nicolae, D.L.; Ober, C.; Im, H.K. Shared and distinct genetic risk factors for childhood-onset and adult-onset asthma: Genome-wide and transcriptome-wide studies. Lancet Respir. Med. 2019, 7, 509–522. [Google Scholar] [CrossRef]
  62. Tantisira, K.G.; Lazarus, R.; Litonjua, A.; Klanderman, B.; Weiss, S.T. Chromosome 17: Association of a large inversion polymorphism with corticosteroid response in asthma. Pharm. Genom. 2008, 18, 733–737. [Google Scholar] [CrossRef] [Green Version]
  63. Ylä-Anttila, P.; Eskelinen, E.-L. Roles for RAB24 in autophagy and disease. Small GTPases 2017, 9, 57–65. [Google Scholar] [CrossRef]
  64. Voraphani, N. An airway epithelial Inos-DUOX2-thyroid peroxidase metabolome drives Th1/Th2 nitrative stress in human severe asthma. In Mucosal Immunology; Nature Publishing Group: Berlin, Germany, 2014; Volume 7, p. 1175. [Google Scholar]
  65. Barrett, T. NCBI GEO: Archive for Functional Genomics Data Sets—Update, Nucleic Acids Research; Oxford University Press: Oxford, UK, 2012; Volume 41, pp. D991–D995. [Google Scholar]
  66. Sherman, B.T.; Lempicki, R.A. Systematic and Integrative Analysis of Large Gene Lists Using DAVID Bioinformatics Resources, Nature Protocols; Nature Publishing Group: London, UK, 2009; Volume 4, pp. 44–57. [Google Scholar]
  67. Szklarczyk, D.; Morris, J.H.; Cook, H.V.; Kuhn, M.; Wyder, S.; Simonovic, M.; Santos, A.; Doncheva, N.T.; Roth, A.; Bork, P.; et al. The STRING database in 2017: Quality-controlled protein-protein association networks, made broadly accessible. Nucleic Acids Res. 2016, 45, D362–D368. [Google Scholar] [CrossRef]
  68. Thompson, J.D.; Higgins, D.; Gibson, T.J. CLUSTAL W: Improving the sensitivity of progressive multiple sequence alignment through sequence weighting, position-specific gap penalties and weight matrix choice. Nucleic Acids Res. 1994, 22, 4673–4680. [Google Scholar] [CrossRef] [Green Version]
  69. Letunic, I.; Bork, P. Interactive Tree Of Life (iTOL): An online tool for phylogenetic tree display and annotation. Bioinformatics 2006, 23, 127–128. [Google Scholar] [CrossRef] [Green Version]
  70. Hubbard, T. The Ensembl Genome Database Project, Nucleic Acids Research; Oxford University Press: Oxford, UK, 2002; Volume 30, pp. 38–41. [Google Scholar]
  71. Durinck, S.; Moreau, Y.; Kasprzyk, A.; Davis, S.; De Moor, B.; Brazma, A.; Huber, W. BioMart and Bioconductor: A powerful link between biological databases and microarray data analysis. Bioinformatics 2005, 21, 3439–3440. [Google Scholar] [CrossRef] [PubMed] [Green Version]
  72. Landrum, M.J. ClinVar: Public Archive of Interpretations of Clinically Relevant Variants, Nucleic Acids Research; Oxford University Press: Oxford, UK, 2015; Volume 44, pp. D862–D868. [Google Scholar]
  73. Altschul, S.F. Gapped BLAST and PSI-BLAST: A new generation of protein database search programs. In Nucleic Acids Research; Oxford University Press: Oxford, UK, 1997; Volume 25, pp. 3389–3402. [Google Scholar]
  74. Krzywinski, M.; Schein, J.; Birol, I.; Connors, J.; Gascoyne, R.; Horsman, D.; Jones, S.J.M.; Marra, M.A. Circos: An information aesthetic for comparative genomics. Genome Res. 2009, 19, 1639–1645. [Google Scholar] [CrossRef] [Green Version]
Figure 1. Circos configuration demonstrates differentially expressed genes (DEGs) between severe and moderate asthma, severe and control, moderate and control asthma levels in black type font and their corresponding chromosome and karyotype location locations in red type font (G), related diseases count (F), pathogenic SNPs count (E), p-values count (−log10) of significantly differentiated genes of GSE43696 between moderate and control, (D) severe and control (C), and severe-to-moderate, (B) asthma levels and hypothetical links of genes with high-sequence similarity (A).
Ijms 21 04022 g001
Figure 2. DEGs chromosomal location intersection between the three gene sets for moderate (m), severe (S), and moderate-to-severe asthma.
Ijms 21 04022 g002
Figure 3. Phylogenetic analysis of genes associated with moderate (M-vs-C), severe (S-vs-C) and moderate-to-severe (M-vs-S) asthma-related genes and intersected genes among these sets, where the p-values of these genes are shown (−log10).
Ijms 21 04022 g003
Figure 4. Protein–protein interaction (PPI) network interaction using STRING for moderate (A), severe (C) and (E) moderate-to-severe asthma phenotype using Cytoscape tool. Cytoscape network analysis was used to calculate the comprehensive set of topological parameters for moderate (B), severe (D) and (F) moderate-to-severe asthma phenotypes PPI networks (grey boxes). These parameters describe the degree of interaction and includes descriptive statistics such as the number of nodes, self-loops, and edges, the number of shortest paths, and the network radius, density, diameter, centralization, and clustering coefficient. See Cytoscape Network Analyzer Manual (http:/manual.cytoscape.org/en/stable/Network Analyzer.html) for more details. The confidence score for each interaction is linked to the thickness and opacity of the edge. The node color is associated with the asthma-association significance score of the DEGs.
Ijms 21 04022 g004
Figure 5. The PPI networks for DEGs differentiated in the three gene sets using Protein Interaction Network Analysis for Multiple Sets (PINA4MS). (A) PPI network, (B) the number of intersected genes through moderate (M-vs-C), severe (S-vs-C), and moderate-to-severe (M-vs-S) asthma gene sets. The color and shape of the edge (link) is related to the type of interaction (protein–protein or kinase-substrate interaction), where looped edges suggest that DEGs have a self-gene correlation. The color of the node of DEGs is associated with its participation in the asthma profiles studied.
Ijms 21 04022 g005
Figure 6. (A) The gene content is aligned between the moderate and severe asthma gene sets. The intersection set of experiments is defined as “common” and marked as a blue/white striped bar. The unique genes for moderate asthma are marked as orange, and for severe asthma as blue colored bars. (B) Canonical pathway maps represent a set of signaling and metabolic maps covering human in a comprehensive way. All maps are created by Clarivate Analytics scientists by a high-quality manual curation process based on published peer-reviewed literatures. (C) These are gene ontology (GO) cellular processes. As most GO processes have no gene/protein content, the “empty terms” are excluded from p-value calculations.
Ijms 21 04022 g006
Figure 7. Enriched pathway maps. (A) Map of the Development Glucocorticoid receptor signaling. It is the top scored map (map with the lowest p-value) based on the enrichment distribution. Experimental data from all files is linked to and visualized on the maps as thermometer-like figures. Up-ward thermometers have red color and indicate up-regulated signals. (B) Map of the Glucocorticoids-mediated inhibition of pro-constrictory and pro-inflammatory signaling in airway smooth muscle cells. The second scored map (map with the second lowest p-value) based on the enrichment distribution sorted by “common” set. Experimental data from all files is linked to and visualized on the maps as thermometer-like figures. Up-ward thermometers have red color and indicate up-regulated signals. The details of the symbols used in this Figure are available here: https://portal.genego.com/legends/MetaCoreQuickReferenceGuide.pdf.
Ijms 21 04022 g007
Figure 8. Process and biological networks. The content of these cellular and molecular processes is defined and annotated by Clarivate Analytics scientists. Each process represents a pre-set network of protein interactions characteristic for the process.
Ijms 21 04022 g008

