Abstract
Ischemic cardiomyopathy (ICM), characterized by pre-existing myocardial infarction or severe coronary artery disease, is the major cause of heart failure (HF). Identification of novel transcriptional regulators in ischemic HF can provide important biomarkers for developing new diagnostic and therapeutic strategies. In this study, we used four RNA-seq datasets from four different studies, including 41 ICM and 42 non-failing control (NF) samples of human left ventricle tissues, to perform the first RNA-seq meta-analysis in the field of clinical ICM, in order to identify important transcriptional regulators and their targeted genes involved in ICM. Our meta-analysis identified 911 differentially expressed genes (DEGs) with 582 downregulated and 329 upregulated. Interestingly, 54 new DEGs were detected only by meta-analysis but not in individual datasets. Upstream regulator analysis through Ingenuity Pathway Analysis (IPA) identified three key transcriptional regulators. TBX5 was identified as the only inhibited regulator (z-score = −2.89). F2R and SFRP4 were identified as the activated regulators (z-scores = 2.56 and 2.00, respectively). Multiple downstream genes regulated by TBX5, F2R, and SFRP4 were involved in ICM-related diseases such as HF and arrhythmia. Overall, our study is the first to perform an RNA-seq meta-analysis for clinical ICM and provides robust candidate genes, including three key transcriptional regulators, for future diagnostic and therapeutic applications in ischemic heart failure.
1. Introduction
Heart failure (HF), leading to considerable mortality and health care costs, is a critical health problem, especially among the people aged ≥65, around the world [1]. Characterized by pre-existing myocardial infarction, hibernating myocardium or severe coronary artery disease, ischemic cardiomyopathy (ICM) accounted for more than 60% of systolic HF cases in industrialized countries [2]. Mild or severe repeated injuries to left ventricle are common in patients with ICM, resulting in cardiac remodeling, chronic myocardial dysfunction and eventual HF [3].
Dysregulated transcriptional hubs, such as transcription factors, non-coding RNAs and chromatin regulators, and their downstream gene expression signatures are representative of genomic mechanisms underlying disease processes. Therefore, detecting such genomic signatures aids in the development of new diagnostic and therapeutic approaches. A few such independent studies have reported unique gene expression signatures eventually leading to cardiovascular diseases such as HF [4,5,6,7].
RNA-seq studies play an important role in understanding transcriptional regulation of cardiovascular diseases [8]. Since different sample and data processing strategies among different RNA-seq studies could generate contradicting results, meta-analysis has been widely used to overcome inconsistent findings among different studies [9,10]. In this study, we used four RNA-seq datasets from four different RNA-seq studies, including 41 ICM and 42 non-failing control (NF) samples of human left ventricle tissues, to perform the first RNA-seq meta-analysis for identifying key transcriptional regulators involved in clinical ICM.
2. Results
2.1. RNA-Seq Datasets
Four RNA-seq datasets (GSE116250 [11], GSE120852 [12], GSE46224 [13] and GSE48166 [14]), including 41 ICM and 42 NF samples, were included and analyzed in this study (Table 1). The information of each dataset was summarized in Table 1.

Table 1.
GEO datasets used for meta-analysis.
2.2. Differentially Expressed Genes
Expression levels of 58,884 coding and non-coding genes based on Homo_sapiens.GRCh38.96.gtf were quantified in this study. Nine hundred and eleven (911) differentially expressed genes (DEGs), including 582 downregulated and 329 upregulated genes, were identified in meta-analysis (Supplementary Table S1). The top 50 DEGs ordered by p-value are presented in Table 2. The number of common DEGs among the meta-analysis and the analyses of four individual studies are presented using Venn diagram (Figure 1A). A considerable number of DEGs were not consistent among different RNA-seq studies in terms of statistical significance (Figure 1A). Interestingly, 54 new DEGs were identified in the meta-analysis but not in the individual datasets (Figure 1A, Table 3). No common genes were identified as statistically significant among the meta-analysis and all four individual analyses (Figure 1A). However, a heatmap of all meta-analysis identified DEGs showed consistent patterns of up- or down-regulated DEGs among the samples across different studies (Figure 1B).
Table 2.
Top 50 DEGs identified in meta-analysis.
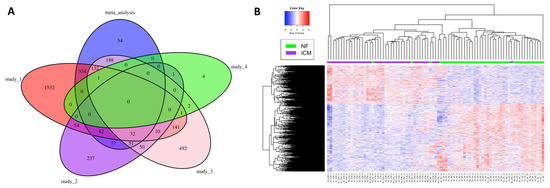
Figure 1.
Venn diagram and heatmap summarizing meta-analysis identified DEGs. (A) Venn diagram summarizing common DEGs among the meta-analysis and the individual studies. (B) Heatmap of the DEGs identified by the meta-analysis. S1, S2, S3, S4: Study_1, Study_2, Study_3, Study_4 (Table 1).
Table 3.
DEGs identified only by meta-analysis.
2.3. Toxicity Pathway Analysis
The IPA-Tox analysis identified 232 significant toxicity pathways (p-value < 0.05). Activation z-score > 2 was considered as significantly activated. Only two pathways, arrhythmia (z-score = 2.81) and failure of heart (z-score = 2.41), were marked with significant activation status. Interactions of these two pathways with their associated DEGs are shown in Figure 2A,B. To identify shared DEGs between these two pathways, an integrated network was generated (Figure 2C). Seventeen genes out of 62 DEGs were shared between the two pathways and interestingly, most of them were downregulated in the ICM group (Figure 2C, Table 4). Among the common DEGs between failure of heart and arrhythmia, DES and TNNT2 were among the top 50 DEGs (Figure 2C, Table 2). ATP1A1 was among the DEGs that were identified only in meta-analysis but not in the four individual datasets (Figure 2C, Table 3).
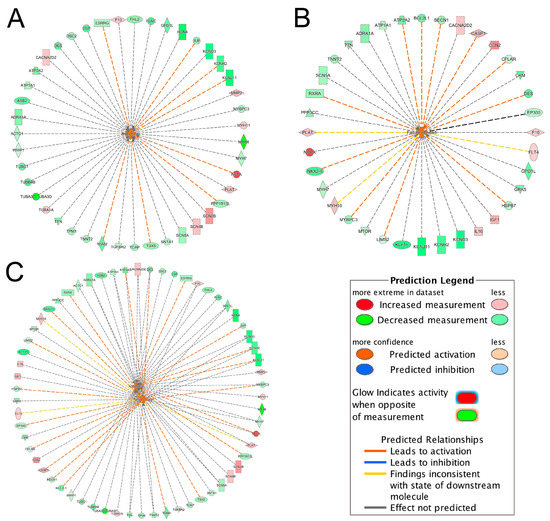
Figure 2.
Interactions of significantly activated toxicity pathways with their associated DEGs. (A) arrhythmia; (B) failure of heart; (C) integrated toxicity pathways. For example, in Figure 2A, the gene TBX5 was downregulated as indicated by the green color and the downregulation of TBX5 further promoted (indicated by the orange dash line) the activation of arrhythmia, as indicated by the orange color. For other indicators, please refer to the Prediction Legend.
Table 4.
Shared DEGs between arrhythmia and failure of heart.
2.4. Canonical Pathway Analysis
Among 122 significant canonical pathways identified by IPA (p-value < 0.05), only four pathways had absolute z-scores more than 2.0 and were marked as significantly inhibited in the ICM group (Figure 3). The DEGs involved in these pathways were summarized in Supplementary Table S2. Among these DEGs, ATP1A1 was involved in the Superpathway of Inositol Phosphate Compounds and also contributed to both heart failure and arrhythmia (Supplementary Table S2, Figure 2C). ACTC1 and TGFBR2 contributing to arrhythmia were also involved in EIF2 Signaling Pathway and Senescence Pathway, respectively (Figure 2A, Supplementary Table S2). MTOR, EP300 and PPP3CC in the Senescence Pathway were also involved in failure of heart (Figure 2B, Supplementary Table S2).
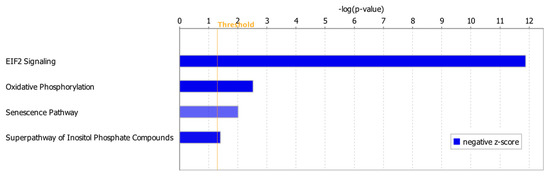
Figure 3.
Inhibited canonical pathways in the ICM group. All the inhibited pathways had z-scores smaller than −2.0 (Supplementary Table S2).
2.5. Upstream Regulator Analysis
IPA upstream regulator analysis identified 61 significant upstream regulators (p-value < 0.05) that were 38 downregulated and 23 upregulated in the ICM group, respectively (Supplementary Table S3). Among those upstream regulators, only TBX5 was marked as a significantly inhibited regulator (z-score = −2.89); only F2R and SFRP4 were significantly activated regulators (z-scores = 2.56 and 2.00, respectively) (Supplementary Table S3). Figure 4 summarized the targeted genes by these three upstream regulators.
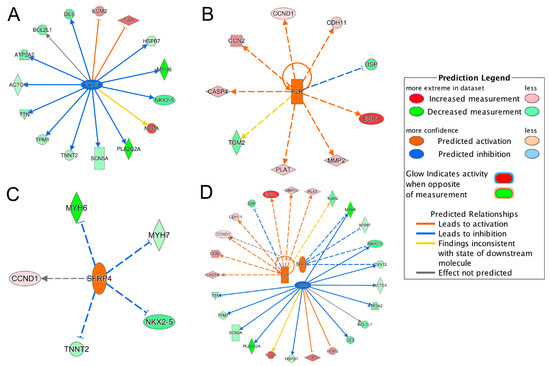
Figure 4.
Inhibited/activated upstream regulators and their targeted genes. (A) TBX5; (B) F2R; (C) SFRP4; (D) An integrated network of TBX5, F2R and SFRP4. All the targeted genes were differentially expressed based on the meta-analysis. For example, the activation of F2R leads to the overexpression (indicated by the orange arrow line) of CASP4 (indicated by the red color). For other indicators, please refer to the Prediction Legend.
Integrating the results of the TBX5-targeted genes and the DEGs in toxicity pathways, we found that the dysregulation of TBX5-targeted genes, TNNT2, NPPA, TTN, ATP2A2, DES and SCN5A, contributed to the development of heart failure and arrhythmia (Figure 2C and Figure 4A). NKX2-5, HSPB7 and BCL2L1 were also involved in failure of heart (Figure 2B and Figure 4A). TBX5-targeted genes, MYH6, ACTC1 and TPM1, were involved in arrhythmia (Figure 2A and Figure 4A). Moreover, ACTC1 in EIF2 Signaling Pathway was also regulated by TBX5. Among TBX5-targeted genes, MYH6, TNNT2, ECM2, TPM1 and DES, were found in the top 50 DEGs list (Table 2). The network of TBX5, its targeted genes and the corresponding cardiac disorders via IPA regulator effects analysis further indicated an important role of TBX5 in the development of HF-related dysfunctions and diseases (Figure 5). Inhibited TBX5 caused dysregulation of several genes such as BCL2L1, HSPB7, NPPA, SCN5A, NKX2-5, TNNT2, ATP2A2, TTN and DES, which are involved in the activation of heart failure (Figure 5). Inhibited TBX5 also contributed to other cardiac dysfunctions including degeneration of heart (increased), cardiac contractility (decreased), contractility of muscle (decreased) and function of cardiac muscle (decreased) (Figure 5).
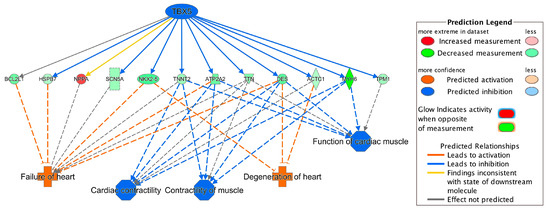
Figure 5.
Network of TBX5, its targeted genes and corresponding cardiac disorders. For example, inhibition of TBX5 leads to downregulation (indicated by blue line) of DES (shown by green color). Downregulation of DES further activates failure of heart (indicated by orange color). For other indicators, please refer to the Prediction Legend.
F2R, as the activated upstream regulator, upregulated PLAT, which was involved in heart failure and arrhythmia (Figure 2C and Figure 4B). Increased CCN2, regulated by F2R, contributed to failure of heart (Figure 2B and Figure 4B). Dysregulated MMP2, DSP and TGM2 were involved in arrhythmia (Figure 2A and Figure 4B). SFRP4, as the other activated upstream regulator, inhibited TNNT2 and MYH7, which contributed to the development of heart failure and arrhythmia (Figure 2C and Figure 4C). Upregulation of SFRP4 also inhibited the expression of NKX2-5 and MYH6 (Figure 4C). NKX2-5 and MYH6 were involved in failure of heart and arrhythmia, respectively (Figure 2).
Interestingly, an integrated network of the three upstream regulators and their targeted genes showed that MYH6, NKX2-5 and TNNT2 were regulated by both TBX5 and SFRP4 (Figure 4D). CCND1 was also regulated by both SFRP4 and F2R (Figure 4D). As mentioned above, some of these regulated genes were involved in failure of heart and/or arrhythmia (Figure 2C), indicating that the three key upstream regulators are common hubs regulating the downstream genes importantly contributing to HF-related cardiac disorders.
3. Discussion
In this study, we performed the first RNA-seq meta-analysis in the field of clinical ICM using four RNA-seq studies to profile gene expression signatures and identify key transcriptional regulators. We applied a consistent bioinformatics pipeline for processing the raw RNA-seq data (FASTQ files) of all four individual datasets to prevent methodological inconsistences in terms of data processing and bioinformatics pipelines among original studies. Our meta-analysis identified a total of 911 differentially expressed genes including 582 downregulated and 329 upregulated genes (Supplementary Table S1).
Among the top 50 significant DEGs (Table 2), several genes, such as OGN and RPL26, were previously reported to be dysregulated in ICM patients [15,16]. Upregulation of OGN, osteoglycin, has been reported to play a role in collagen maturation and deposition in mouse myocardial infarction tissue [15]. Increased circulating OGN has also been observed in ischemic HF patients experiencing myocardial infarction compared to patients with non-ischemic HF and thus it has been proposed as a biomarker for ischemic HF with pre-existing myocardial infarction [15]. Moreover, upregulation of RPL26, ribosomal protein L26, has also been observed in patient with ischemic HF [16]. Abnormal expressions of DES and PTN were also reported in dilated cardiomyopathy (DCM) [17,18]. Interestingly, genetic variants in several genes of the top 50 DEGs were reported to be associated with ICM and other heart diseases. For example, genetic variants of PALLD (palladin, cytoskeletal associated protein), important for organizing actin cytoskeleton, have been reported to be associated with myocardial infarction [19,20]. Genetic variants of MYH6, TNNT2 and TPM1, have been found to be associated with hypoplastic left heart, cardiac hypertrophy and DCM, respectively [21,22,23].
Meta-analysis is a more sensitive and reliable approach to identify novel robust DEGs due to its greater power to detect differential expression [9]. Fifty-four new DEGs were discovered through our meta-analysis and they were not detected by analyzing the individual datasets. Most of these genes have not been reported prior as related to ICM. However, some of these DEGs have been found to be associated with HF-related diseases. For example, CRMP1 has been demonstrated as a potential candidate for left-sided congenital heart disease [24]. Lower expression of ATP1A1 has been reported in end-stage HF [25]. Consistently, our IPA pathway analysis showed that ATP1A1 was involved in heart failure (Figure 2B). Abnormal expressions of AZGP1 in chronic HF [26] and MDFIC in DCM have been previously reported [27]. Moreover, genetic mutation in PKD2 has been reported in idiopathic DCM [28]. Further research is needed to investigate pathophysiological mechanisms of these newly identified genes in our meta-analysis.
ACE2, SP100, CITED2, CEBPD, BCL3, CREB, SMARCA4, NCAM1 and SFRP4 have been previously reported as transcriptional regulators in heart failure [29,30,31,32,33,34]. Although CITED2, CREB5 (belongs to CREB family), CREB3L1 (belongs to CREB family), SMARCA4, NCAM1 and SFRP4 were significant DEGs in our dataset (Supplementary Table S1), only SFRP4 was identified as the significantly activated transcriptional regulator based on significant activation z-score (absolute z-score > 2.0) from our IPA analysis (Figure 4). Upstream regulator analysis also identified two additional transcriptional regulators, TBX5 and F2R (Figure 4). TBX5, a member of the T-box transcription factor family, was the top inhibited regulator. It has been previously reported that malfunction of TBX5 could lead to several cardiovascular diseases during embryonic development and also during adulthood [35]. In our study, inhibition of TBX5 was shown to dysregulate several genes such as DES, NKX2-5, ACTC1, MYH6, ATP2A2 and HSPB7, which further contributed to ICM-related diseases such as failure of heart and degeneration of heart (Figure 5). Cardiac muscle functions including cardiac contractility, contractility of muscle and function of cardiac muscles were also shown to be influenced due to inhibition of TBX5 (Figure 5). Consistent with our finding, TBX5 along with MEF2C has been reported to activate the expression of MYH6, which is considered as the building block of cardiomyocytes and plays a crucial role in heart development and function [36]. Moreover, DES expression has also been reported to be regulated by TBX5 [37] and a decreased number of DES-positive myocytes has been found in ischemic heart failure and was associated with reduced cardiac function [38]. Our study also found that dysregulated TBX5 could inhibit the expression of ATP2A2 (Figure 5), an ATPase enzyme that plays an important role in muscle contraction and relaxation, and decreased ATP2A2 has also been observed during human end-stage heart failure [39,40]. TBX5-regulated NKX2-5 is involved in heart formation and development and dysregulated NKX2-5 could lead to heart failure and sudden cardiac death [37,41]. Therefore, our results demonstrate a strong association of TBX5 with heart diseases and further propose its important transcriptional regulatory role in the development of ICM for future mechanistic studies.
F2R and SFRP4 were identified as significantly activated upstream regulators mediating multiple HF-related genes (Figure 2 and Figure 4). SFRP4, secreted frizzled-related protein 4, is a member of the SFRPs family, functioning as soluble modulators in Wnt signaling [20]. Increased SFRP4 has been reported in patients with coronary heart disease and DCM [34,42]. Several SFRP4-targeted genes, such as MYH6, MYH7, TNNT2 and NKX2-5, contributed to different types of heart diseases [22,41,43,44]. F2R, coagulation factor II receptor, is a member of the G-protein coupled receptor family and it is important for regulating the thrombotic response [20]. Genetics variants in F2R have been reported to influence the risk of myocardial infarction and coronary heart disease [45,46]. In our study, activation of F2R was indicated to cause overexpression of several genes, including CCN2, CCND1, CDH11, CASP4, EGR1, MMP2 and PLAT, in the ICM group (Figure 4B). Activation of SFRP4 and F2R also upregulated CCND1 (Figure 4D), which was involved in EIF2 Signaling and Senescence Pathways (Supplementary Table S2). CCND1 (Cyclin D1) has been reported to promote cardiomyocyte division in vivo and regulate cardiac function responding to heart failure in a rat myocardial infarction model [47]. Besides TBX5, our study identified F2R and SFRP4 as two important activated transcriptional regulators involved in the development of ICM-related cardiac dysfunctions.
In conclusion, our study, which is the first RNA-seq meta-analysis in the field of clinical ICM, identified multiple novel dysregulated genes and three key transcriptional regulators involved in the development of ischemic cardiomyopathy and its associated cardiovascular diseases. The three transcriptional regulators could be further examined as potential biomarkers for simultaneous regulation of multiple ICM-involved genes to develop novel diagnostic and therapeutic strategies in ischemic heart failure.
4. Materials and Methods
Table 1 summarizes four RNA-seq studies of ICM using tissue samples from human left ventricle, found in NCBI GEO [48] database (https://www.ncbi.nlm.nih.gov/geo/). Further, we did not include the datasets if they were not collected using the Illumina sequencing platform or they were collected in patients with any treatment of a specific drug or medically implanted device. The clinical information of ICM patients and their controls has been described in Study_1 [49], Study_2 [50], Study_3 [51] and Study_4 [14]. RNA-seq analyses of these four individual studies were previously published [49,50,52,53], thus all four individual datasets have been validated for our current meta-analysis. Detailed information of the data processing and bioinformatics analysis has been described in our recently published paper [32] and is shown in Figure 6. Briefly, FASTQ files were downloaded from the European Nucleotide Archive website (https://www.ebi.ac.uk/ena). Quality control for raw reads and trimmed reads was performed using FastQC [54]. Adaptors and low-quality bases (Phred quality score < 10) were filtered using Cutadapt [55]. A pipeline of HISAT2 [56], Samtools [57] and HTSeq-count [58] was used for aligning the trimmed reads to the human reference genome (GRCh38) and quantifying gene expression. Only uniquely mapped reads were used for expression quantification.
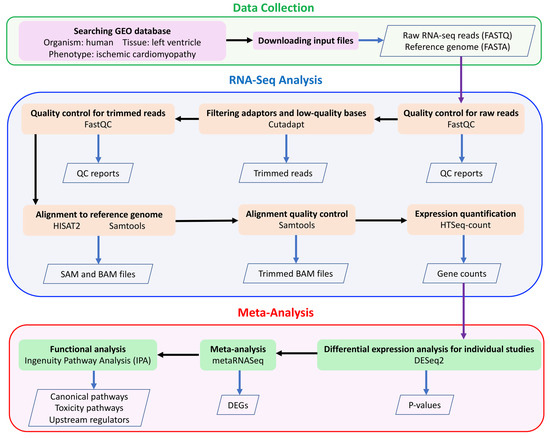
Figure 6.
The meta-analysis workflow.
DESeq2 [59] was used to perform differential expression analysis. Genes with low read counts were filtered with default parameters in DESeq2. Quantitative meta-analysis was performed through Fisher’s combined probability test [60] using metaRNASeq [9]. Raw p-values were adjusted by the Benjamini–Hochberg false discovery rate (FDR) method and the adjusted p-values less than 0.05 were considered as statistically significant. Only DEGs with consistent expression directions among the four individual studies were included in the final DEGs list.
To identify enriched canonical pathways, toxicity functions (IPA-Tox) and upstream transcriptional regulators, the Ingenuity Pathway Analysis software (IPA, Qiagen, Redwood City, CA, USA) [61] was used to analyze DEGs identified by meta-analysis. VennDiagram [62] in R was used to generate a Venn diagram of common DEGs among the meta-analysis and individual studies. A heatmap of the DEGs identified by meta-analysis was generated using the heatmap.2 function from the gplots package in R [63]. The compute-intensive tasks were performed using Ohio Supercomputer Center [64].
Supplementary Materials
Supplementary materials can be found at https://www.mdpi.com/1422-0067/21/10/3472/s1, Table S1: A complete list of differential expressed genes identified in meta-analysis; Table S2: Significant canonical pathways with absolute z-score > 2.0 and their involved genes; Table S3: Differentially expressed upstream regulators and their targeted genes.
Author Contributions
Conceptualization, X.C.; data curation, A.A. and X.C.; formal analysis, A.A.; funding acquisition, X.C.; investigation, A.A., S.A., I.M., B.J. and X.C.; methodology, A.A. and X.C.; project administration, X.C.; resources, B.J. and X.C.; software, A.A. and X.C.; supervision, X.C.; validation, A.A., S.A., I.M. and X.C.; visualization, A.A. and X.C.; writing—original draft, A.A.; writing—review and editing, A.A., S.A., I.M., B.J. and X.C. All authors have read and agreed to the published version of the manuscript.
Funding
The work was supported by Dean’s Postdoctoral to Faculty Fellowship from University of Toledo College of Medicine and Life Sciences to Xi Cheng. Xi Cheng also acknowledges funding support from the P30 Core Center Pilot Grant from NIDA Center of Excellence in Omics, Systems Genetics, and the Addictome. Bina Joe gratefully acknowledges grant support from the NIH (HL143082).
Acknowledgments
Authors appreciate the computational support from the Ohio Supercomputer Center.
Conflicts of Interest
The authors declare no conflict of interest. The funders had no role in the design of the study; in the collection, analyses, or interpretation of data; in the writing of the manuscript, or in the decision to publish the results.
References
- Roger, V.L. Epidemiology of heart failure. Circ. Res. 2013, 113, 646–659. [Google Scholar] [CrossRef] [PubMed]
- Griffin, B.P. (Ed.) Manual of Cardiovascular Medicine, 4th ed.; Lippincott Williams & Wilkins, A Wolters Kluwer Business Company: Philadelphia, PA, USA, 2013; ISBN 978-1451131604. [Google Scholar]
- Kelkar, A.A.; Butler, J.; Schelbert, E.B.; Greene, S.J.; Quyyumi, A.A.; Bonow, R.O.; Cohen, I.; Gheorghiade, M.; Lipinski, M.J.; Sun, W. Mechanisms contributing to the progression of ischemic and nonischemic dilated cardiomyopathy: Possible modulating effects of paracrine activities of stem cells. J. Am. Coll. Cardiol. 2015, 66, 2038–2047. [Google Scholar] [CrossRef]
- Lee, T.I.; Young, R.A. Transcriptional regulation and its misregulation in disease. Cell 2013, 152, 1237–1251. [Google Scholar] [CrossRef]
- Kuwahara, K.; Nishikimi, T.; Nakao, K. Transcriptional regulation of the fetal cardiac gene program. J. Pharmacol. Sci. 2012, 119, 198–203. [Google Scholar] [CrossRef]
- Dirkx, E.; da Costa Martins, P.A.; De Windt, L.J. Regulation of fetal gene expression in heart failure. Biochim. Biophys. Acta (BBA)-Mol. Basis Dis. 2013, 1832, 2414–2424. [Google Scholar] [CrossRef]
- Wirrig, E.E.; Yutzey, K.E. Transcriptional regulation of heart valve development and disease. Cardiovasc. Pathol. 2011, 20, 162–167. [Google Scholar] [CrossRef] [PubMed]
- Slagle, C.E.; Conlon, F.L. Emerging field of cardiomics: High-throughput investigations into transcriptional regulation of cardiovascular development and disease. Trends Genet. 2016, 32, 707–716. [Google Scholar] [CrossRef] [PubMed]
- Rau, A.; Marot, G.; Jaffrézic, F. Differential meta-analysis of RNA-seq data from multiple studies. BMC Bioinform. 2014, 15, 91. [Google Scholar] [CrossRef]
- Walker, E.; Hernandez, A.V.; Kattan, M.W. Meta-analysis: Its strengths and limitations. Cleve. Clin. J. Med. 2008, 75, 431. [Google Scholar] [CrossRef]
- Sweet, M.; Ambardekar, A.; Bristow, M.; Mestroni, L.; Taylor, M. RNA-seq of Heart Failure in Human Left Ventricles. In GEO Database; 2018. Available online: https://www.ncbi.nlm.nih.gov/geo/query/acc.cgi?acc=GSE116250 (accessed on 10 May 2019).
- Rau, C.; Tsai, E. Wipi1 Is a Genetic Hub That Mediates Right Ventricular Failure. In GEO Database; 2018. Available online: https://www.ncbi.nlm.nih.gov/geo/query/acc.cgi?acc=GSE120852 (accessed on 10 May 2019).
- Yang, K.; Nerbonne, J. Deep RNA Sequencing Reveals Dynamic Regulation of Myocardial Noncoding RNA in Failing Human Heart and Remodeling with Mechanical Circulatory Support. In GEO Database; 2014. Available online: https://www.ncbi.nlm.nih.gov/geo/query/acc.cgi?acc=GSE46224 (accessed on 10 May 2019).
- Wang, L.; Hu, Y.; Pu, W. RNA-seq Identifies Novel Transcript Elements and Transcript Processing in the Normal and Failing Hearts. In GEO Database; 2013. Available online: https://www.ncbi.nlm.nih.gov/geo/query/acc.cgi?acc=GSE48166 (accessed on 10 May 2019).
- Van Aelst, L.N.L.; Voss, S.; Carai, P.; Van Leeuwen, R.; Vanhoutte, D.; Sanders-van Wijk, S.; Eurlings, L.; Swinnen, M.; Verheyen, F.K.; Verbeken, E. Osteoglycin prevents cardiac dilatation and dysfunction after myocardial infarction through infarct collagen strengthening. Circ. Res. 2015, 116, 425–436. [Google Scholar] [CrossRef]
- Yang, G.; Chen, S.; Ma, A.; Lu, J.; Wang, T. Identification of the difference in the pathogenesis in heart failure arising from different etiologies using a microarray dataset. Clinics 2017, 72, 600–608. [Google Scholar] [CrossRef]
- Pawlak, A.; Gil, R.J.; Grajkowska, W.; Nasierowska-Guttmejer, A.M.; Rzezak, J.; Kulawik, T. Significance of low desmin expression in cardiomyocytes in patients with idiopathic dilated cardiomyopathy. Am. J. Cardiol. 2013, 111, 393–399. [Google Scholar] [CrossRef] [PubMed]
- Asakura, M.; Kitakaze, M. Global gene expression profiling in the failing myocardium. Circ. J. 2009, 73, 1568–1576. [Google Scholar] [CrossRef] [PubMed]
- Bare, L.A.; Morrison, A.C.; Rowland, C.M.; Shiffman, D.; Luke, M.M.; Iakoubova, O.A.; Kane, J.P.; Malloy, M.J.; Ellis, S.G.; Pankow, J.S. Five common gene variants identify elevated genetic risk for coronary heart disease. Genet. Med. 2007, 9, 682–689. [Google Scholar] [CrossRef] [PubMed]
- O’Leary, N.A.; Wright, M.W.; Brister, J.R.; Ciufo, S.; Haddad, D.; McVeigh, R.; Rajput, B.; Robbertse, B.; Smith-White, B.; Ako-Adjei, D. Reference sequence (RefSeq) database at NCBI: Current status, taxonomic expansion, and functional annotation. Nucleic Acids Res. 2015, 44, D733–D745. [Google Scholar] [CrossRef] [PubMed]
- Theis, J.L.; Zimmermann, M.T.; Evans, J.M.; Eckloff, B.W.; Wieben, E.D.; Qureshi, M.Y.; O’Leary, P.W.; Olson, T.M. Recessive MYH6 mutations in hypoplastic left heart with reduced ejection fraction. Circ. Cardiovasc. Genet. 2015, 8, 564–571. [Google Scholar] [CrossRef]
- Komamura, K.; Iwai, N.; Kokame, K.; Yasumura, Y.; Kim, J.; Yamagishi, M.; Morisaki, T.; Kimura, A.; Tomoike, H.; Kitakaze, M. The role of a common TNNT2 polymorphism in cardiac hypertrophy. J. Hum. Genet. 2004, 49, 129–133. [Google Scholar] [CrossRef]
- Yao, Q.; Zhang, W.; Zhang, T. Association of single nucleotide polymorphisms in the 3′ UTR region of TPM1 gene with dilated cardiomyopathy: A case-control study. Medicine 2019, 98, e17710. [Google Scholar] [CrossRef]
- Hitz, M.-P.; Lemieux-Perreault, L.-P.; Marshall, C.; Feroz-Zada, Y.; Davies, R.; Yang, S.W.; Lionel, A.C.; D’Amours, G.; Lemyre, E.; Cullum, R. Rare copy number variants contribute to congenital left-sided heart disease. PLoS Genet. 2012, 8, e1002903. [Google Scholar] [CrossRef]
- BORLAK, J.; THUM, T. Hallmarks of ion channel gene expression in end-stage heart failure. FASEB J. 2003, 17, 1592–1608. [Google Scholar] [CrossRef]
- Hou, L.; Li, F.; Zeng, Q.; Su, L.; Chen, P.; Xu, Z.; Zhu, D.; Liu, C.; Xu, D. Excretion of urinary orosomucoid 1 protein is elevated in patients with chronic heart failure. PLoS ONE 2014, 9, e107550. [Google Scholar] [CrossRef] [PubMed]
- Camargo, A.; Azuaje, F. Identification of dilated cardiomyopathy signature genes through gene expression and network data integration. Genomics 2008, 92, 404–413. [Google Scholar] [CrossRef] [PubMed]
- Paavola, J.; Schliffke, S.; Rossetti, S.; Kuo, I.Y.-T.; Yuan, S.; Sun, Z.; Harris, P.C.; Torres, V.E.; Ehrlich, B.E. Polycystin-2 mutations lead to impaired calcium cycling in the heart and predispose to dilated cardiomyopathy. J. Mol. Cell. Cardiol. 2013, 58, 199–208. [Google Scholar] [CrossRef] [PubMed]
- Crackower, M.A.; Sarao, R.; Oudit, G.Y.; Yagil, C.; Kozieradzki, I.; Scanga, S.E.; Oliveira-dos-Santos, A.J.; da Costa, J.; Zhang, L.; Pei, Y. Angiotensin-converting enzyme 2 is an essential regulator of heart function. Nature 2002, 417, 822–828. [Google Scholar] [CrossRef]
- Herrer, I.; Roselló-Lletí, E.; Ortega, A.; Tarazón, E.; Molina-Navarro, M.M.; Triviño, J.C.; Martínez-Dolz, L.; Almenar, L.; Lago, F.; Sánchez-Lázaro, I. Gene expression network analysis reveals new transcriptional regulators as novel factors in human ischemic cardiomyopathy. BMC Med. Genomics 2015, 8, 14. [Google Scholar] [CrossRef]
- Müller, F.U.; Neumann, J.; Schmitz, W. Transcriptional regulation by cAMP in the heart. Mol. Cell. Biochem. 2000, 212, 11–17. [Google Scholar] [CrossRef]
- Alimadadi, A.; Munroe, P.B.; Joe, B.; Cheng, X. Meta-Analysis of Dilated Cardiomyopathy Using Cardiac RNA-Seq Transcriptomic Datasets. Genes 2020, 11, 60. [Google Scholar] [CrossRef]
- Tur, M.K.; Etschmann, B.; Benz, A.; Leich, E.; Waller, C.; Schuh, K.; Rosenwald, A.; Ertl, G.; Kienitz, A.; Haaf, A.T. The 140-kD isoform of CD56 (NCAM1) directs the molecular pathogenesis of ischemic cardiomyopathy. Am. J. Pathol. 2013, 182, 1205–1218. [Google Scholar] [CrossRef]
- Schumann, H.; Holtz, J.; Zerkowski, H.-R.; Hatzfeld, M. Expression of secreted frizzled related proteins 3 and 4 in human ventricular myocardium correlates with apoptosis related gene expression. Cardiovasc. Res. 2000, 45, 720–728. [Google Scholar] [CrossRef]
- Steimle, J.D.; Moskowitz, I.P. TBX5: A key regulator of heart development. In Current Topics in Developmental Biology; Elsevier: Amsterdam, The Netherlands, 2017; Volume 122, pp. 195–221. ISBN 0070-2153. [Google Scholar]
- Ghosh, T.K.; Song, F.F.; Packham, E.A.; Buxton, S.; Robinson, T.E.; Ronksley, J.; Self, T.; Bonser, A.J.; Brook, J.D. Physical interaction between TBX5 and MEF2C is required for early heart development. Mol. Cell. Biol. 2009, 29, 2205–2218. [Google Scholar] [CrossRef] [PubMed]
- Nam, Y.-J.; Song, K.; Luo, X.; Daniel, E.; Lambeth, K.; West, K.; Hill, J.A.; DiMaio, J.M.; Baker, L.A.; Bassel-Duby, R. Reprogramming of human fibroblasts toward a cardiac fate. Proc. Natl. Acad. Sci. USA 2013, 110, 5588–5593. [Google Scholar] [CrossRef] [PubMed]
- Di Somma, S.; Di Benedetto, M.P.; Salvatore, G.; Agozzino, L.; Ferranti, F.; Esposito, S.; La Dogana, P.; Scarano, M.I.; Caputo, G.; Cotrufo, M. Desmin-free cardiomyocytes and myocardial dysfunction in end stage heart failure. Eur. J. Heart Fail. 2004, 6, 389–398. [Google Scholar] [CrossRef] [PubMed]
- Mercadier, J.-J.; Lompre, A.-M.; Duc, P.; Boheler, K.R.; Fraysse, J.B.; Wisnewsky, C.; Allen, P.D.; Komajda, M.; Schwartz, K. Altered sarcoplasmic reticulum Ca2 (+)-ATPase gene expression in the human ventricle during end-stage heart failure. J. Clin. Invest. 1990, 85, 305–309. [Google Scholar] [CrossRef] [PubMed]
- Zhu, Y.; Gramolini, A.O.; Walsh, M.A.; Zhou, Y.-Q.; Slorach, C.; Friedberg, M.K.; Takeuchi, J.K.; Sun, H.; Henkelman, R.M.; Backx, P.H. Tbx5-dependent pathway regulating diastolic function in congenital heart disease. Proc. Natl. Acad. Sci. USA 2008, 105, 5519–5524. [Google Scholar] [CrossRef]
- Sveinbjornsson, G.; Olafsdottir, E.F.; Thorolfsdottir, R.B.; Davidsson, O.B.; Helgadottir, A.; Jonasdottir, A.; Jonasdottir, A.; Bjornsson, E.; Jensson, B.O.; Arnadottir, G.A. Variants in NKX2-5 and FLNC Cause Dilated Cardiomyopathy and Sudden Cardiac Death. Circ. Genomic Precis. Med. 2018, 11, e002151. [Google Scholar] [CrossRef]
- Ji, Q.; Zhang, J.; Du, Y.; Zhu, E.; Wang, Z.; Que, B.; Miao, H.; Shi, S.; Qin, X.; Zhao, Y. Human epicardial adipose tissue-derived and circulating secreted frizzled-related protein 4 (SFRP4) levels are increased in patients with coronary artery disease. Cardiovasc. Diabetol. 2017, 16, 133. [Google Scholar] [CrossRef]
- Carniel, E.; Taylor, M.R.G.; Sinagra, G.; Di Lenarda, A.; Ku, L.; Fain, P.R.; Boucek, M.M.; Cavanaugh, J.; Miocic, S.; Slavov, D. α-Myosin heavy chain: A sarcomeric gene associated with dilated and hypertrophic phenotypes of cardiomyopathy. Circulation 2005, 112, 54–59. [Google Scholar] [CrossRef]
- Marian, A.J.; Braunwald, E. Hypertrophic cardiomyopathy: Genetics, pathogenesis, clinical manifestations, diagnosis, and therapy. Circ. Res. 2017, 121, 749–770. [Google Scholar] [CrossRef]
- Gigante, B.; Vikström, M.; Meuzelaar, L.S.; Chernogubova, E.; Silveira, A.; van’t Hooft, F.; Hamsten, A.; de Faire, U. Variants in the coagulation factor 2 receptor (F2R) gene influence the risk of myocardial infarction in men through an interaction with interleukin 6 serum levels. Thromb. Haemost. 2009, 101, 943–953. [Google Scholar]
- Gigante, B.; Bellis, A.; Visconti, R.; Marino, M.; Morisco, C.; Trimarco, V.; Galasso, G.; Piscione, F.; De Luca, N.; Prince, J.A. Retrospective analysis of coagulation factor II receptor (F2R) sequence variation and coronary heart disease in hypertensive patients. Arterioscler. Thromb. Vasc. Biol. 2007, 27, 1213–1219. [Google Scholar] [CrossRef]
- Tamamori-Adachi, M.; Takagi, H.; Hashimoto, K.; Goto, K.; Hidaka, T.; Koshimizu, U.; Yamada, K.; Goto, I.; Maejima, Y.; Isobe, M. Cardiomyocyte proliferation and protection against post-myocardial infarction heart failure by cyclin D1 and Skp2 ubiquitin ligase. Cardiovasc. Res. 2008, 80, 181–190. [Google Scholar] [CrossRef] [PubMed]
- Barrett, T.; Wilhite, S.E.; Ledoux, P.; Evangelista, C.; Kim, I.F.; Tomashevsky, M.; Marshall, K.A.; Phillippy, K.H.; Sherman, P.M.; Holko, M. NCBI GEO: Archive for functional genomics data sets—Update. Nucleic Acids Res. 2012, 41, D991–D995. [Google Scholar] [CrossRef]
- Sweet, M.E.; Cocciolo, A.; Slavov, D.; Jones, K.L.; Sweet, J.R.; Graw, S.L.; Reece, T.B.; Ambardekar, A.V.; Bristow, M.R.; Mestroni, L. Transcriptome analysis of human heart failure reveals dysregulated cell adhesion in dilated cardiomyopathy and activated immune pathways in ischemic heart failure. BMC Genom. 2018, 19, 812. [Google Scholar] [CrossRef]
- Tzimas, C.; Rau, C.D.; Buergisser, P.E.; Jean-Louis, G., Jr.; Lee, K.; Chukwuneke, J.; Dun, W.; Wang, Y.; Tsai, E.J. WIPI1 is a conserved mediator of right ventricular failure. JCI Insight 2019, 4, e122929. [Google Scholar] [CrossRef] [PubMed]
- Yang, K.-C.; Yamada, K.A.; Patel, A.Y.; Topkara, V.K.; George, I.; Cheema, F.H.; Ewald, G.A.; Mann, D.L.; Nerbonne, J.M. Deep RNA sequencing reveals dynamic regulation of myocardial noncoding RNAs in failing human heart and remodeling with mechanical circulatory support. Circulation 2014, 129, 1009–1021. [Google Scholar] [CrossRef] [PubMed]
- Li, X.; Liu, C.Y.; Li, Y.S.; Xu, J.; Li, D.G.; Li, X.; Han, D. Deep RNA sequencing elucidates microRNA-regulated molecular pathways in ischemic cardiomyopathy and nonischemic cardiomyopathy. Genet. Mol. Res. 2016, 15. [Google Scholar] [CrossRef] [PubMed]
- Li, W.; Li, L.; Zhang, S.; Zhang, C.; Huang, H.; Li, Y.; Hu, E.; Deng, G.; Guo, S.; Wang, Y. Identification of potential genes for human ischemic cardiomyopathy based on RNA-Seq data. Oncotarget 2016, 7, 82063. [Google Scholar] [CrossRef]
- Andrews, S. FastQC: A Quality Control Tool for High Throughput Sequence Data 2010. Available online: https://www.bioinformatics.babraham.ac.uk/projects (accessed on 14 May 2019).
- Martin, M. Cutadapt removes adapter sequences from high-throughput sequencing reads. EMBnet. J. 2011, 17, 10–12. [Google Scholar] [CrossRef]
- Kim, D.; Paggi, J.M.; Park, C.; Bennett, C.; Salzberg, S.L. Graph-based genome alignment and genotyping with HISAT2 and HISAT-genotype. Nat. Biotechnol. 2019, 37, 907–915. [Google Scholar] [CrossRef]
- Li, H.; Handsaker, B.; Wysoker, A.; Fennell, T.; Ruan, J.; Homer, N.; Marth, G.; Abecasis, G.; Durbin, R. The sequence alignment/map format and SAMtools. Bioinformatics 2009, 25, 2078–2079. [Google Scholar] [CrossRef]
- Anders, S.; Pyl, P.T.; Huber, W. HTSeq—A Python framework to work with high-throughput sequencing data. Bioinformatics 2015, 31, 166–169. [Google Scholar] [CrossRef]
- Love, M.I.; Huber, W.; Anders, S. Moderated estimation of fold change and dispersion for RNA-seq data with DESeq2. Genome Biol. 2014, 15, 550. [Google Scholar] [CrossRef]
- Fisher, R.A. Statistical Methods for Research Workers; Oliver and Boyd: Edinburgh, Scotland, 1925; ISBN 0-05-002170-2. [Google Scholar]
- Krämer, A.; Green, J.; Pollard, J., Jr.; Tugendreich, S. Causal analysis approaches in ingenuity pathway analysis. Bioinformatics 2013, 30, 523–530. [Google Scholar] [CrossRef]
- Chen, H.; Boutros, P.C. VennDiagram: A package for the generation of highly-customizable Venn and Euler diagrams in R. BMC Bioinform. 2011, 12, 35. [Google Scholar] [CrossRef]
- Warnes, G.R.; Bolker, B.; Bonebakker, L.; Gentleman, R.; Liaw, W.H.A.; Lumley, T.; Maechler, M.; Magnusson, A.; Moeller, S.; Schwartz, M.; et al. gplots: Various R Programming Tools for Plotting Data. R Package Version. 2015. Available online: https://cran.r-project.org/web/packages/gplots/index.html (accessed on 14 May 2019).
- Ohio Supercomputer Center; Ohio Supercomputer Center: Columbus, OH, USA, 1987; Available online: https://www.osc.edu (accessed on 15 June 2019).
© 2020 by the authors. Licensee MDPI, Basel, Switzerland. This article is an open access article distributed under the terms and conditions of the Creative Commons Attribution (CC BY) license (http://creativecommons.org/licenses/by/4.0/).