Article

Global Landscapes of the Na+/H+ Antiporter (NHX) Family Members Uncover their Potential Roles in Regulating the Rapeseed Resistance to Salt Stress

1
School of Life Sciences, Zhengzhou University, Zhengzhou 450001, China
2
School of Agricultural Sciences, Zhengzhou University, Zhengzhou 450001, China
*
Author to whom correspondence should be addressed.
These authors contributed equally to this work.
Int. J. Mol. Sci. 2020, 21(10), 3429; https://doi.org/10.3390/ijms21103429
Submission received: 21 April 2020 / Revised: 8 May 2020 / Accepted: 11 May 2020 / Published: 12 May 2020
(This article belongs to the Section Molecular Genetics and Genomics)

Abstract

:
Soil salinity is a main abiotic stress in agriculture worldwide. The Na+/H+ antiporters (NHXs) play pivotal roles in intracellular Na+ excretion and vacuolar Na+ compartmentalization, which are important for plant salt stress resistance (SSR). However, few systematic analyses of NHXs has been reported in allotetraploid rapeseed so far. Here, a total of 18 full-length NHX homologs, representing seven subgroups (NHX1-NHX8 without NHX5), were identified in the rapeseed genome (AnAnCnCn). Number variations of BnaNHXs might indicate their significantly differential roles in the regulation of rapeseed SSR. BnaNHXs were phylogenetically divided into three evolutionary clades, and the members in the same subgroups had similar physiochemical characteristics, gene/protein structures, and conserved Na+ transport motifs. Darwin´s evolutionary pressure analysis suggested that BnaNHXs suffered from strong purifying selection. The cis-element analysis revealed the differential transcriptional regulation of NHXs between the model Arabidopsis and B. napus. Differential expression of BnaNHXs under salt stress, different nitrogen forms (ammonium and nitrate), and low phosphate indicated their potential involvement in the regulation of rapeseed SSR. Global landscapes of BnaNHXs will give an integrated understanding of their family evolution and molecular features, which will provide elite gene resources for the genetic improvement of plant SSR through regulating the NHX-mediated Na+ transport.

1. Introduction

Plants are usually exposed to various environmental stresses, among which salinity is one of the major limiting factors for plant growth and development, and crop productivity [1,2,3]. Approximately 50% of the irrigated land worldwide suffers from salinity damage, which causes osmotic stress and ion disorder in plants [4]. In detail, salt stresses inhibit seed germination, root growth, photosynthesis and crop fructification [5].
Plants have developed multiple strategies to cope with salt stresses, including the regulation of growth and development, ion homeostasis, detoxification and osmotic adjustment [5]. Among them, the maintenance of ion homeostasis plays an essential role in the plant salt stress resistance (SSR). Under salt stresses, the decrease in sodium ion (Na+) concentrations and the increase in potassium ion (K+) concentrations, leading to a high K+/Na+ ratio, are very crucial for plant SSR. In this process, the Na+/H+ antiporters (NHXs) are very important players. Most NHXs, localized on the plasma membrane and tonoplast, are key to the maintenance of low intracellular Na+ concentrations by discharging Na+ into the extracellular parts and vacuole [6]. NHXs are driven by proton (H+) electrochemical gradients that are generated by two different types of H+ pumps: H+-ATPase and H+-PPase [7,8]. Arabidopsis NHXs can be divided into three main groups: (i) AtNHX1-4 localized on the tonoplast, (ii) AtNHX5-6 localized on the endosomal compartment, and (iii) AtSOS1 (Salt Overly Sensitive 1)/NHX7 and AtNHX8 localized on the plasma membrane [9,10,11]. NHXs are involved in cell expansion [12], pH regulation [13], SSR [14], K+ homeostasis [15,16], Na+ long-distance transport [17], and other physiological processes [18,19,20,21]. More and more studies are aimed at improving plant SSR through molecular modulation of NHXs. Enhanced expression of Arabidopsis NHX1 in rapeseed and tomato improved the plant SSR [22,23]. The silencing of GhNHX1 resulted in the enhanced sensitivity of cotton seedlings to high salt concentrations, which suggested that GhNHX1 positively regulated the cotton resistance to salt stress [24]. Ectopic expression of a wheat antiporter gene (TaNHX2) improved the SSR and growth performance in transgenic sunflower plants [25]. Ectopic expression of Arabidopsis NHX5 enhanced the soybean SSR [26].
Oilseed rape (Brassica napus L.) is widely cultivated and harvested for the production of vegetable oil, livestock protein powder, and biodiesel [27]. The allotetraploid rapeseed (AnAnCnCn, 2n=4x=38) originates from spontaneous hybridization of its diploid ancestors Brassica rapa (ArAr, 2n=2x=20) and Brassica oleracea (CoCo, 2n=2x=18) [28,29,30]. The seed yield and quality of rapeseed is also inhibited by soil salinity [31]. The whole-genome study of NHXs provides important information for the elucidation of molecular mechanisms underlying Na+ homeostasis and plant SSR. However, the NHX family has not been systematically studied in allotetraploid B. napus. Moreover, the core members have also been unknown among the numerous BnaNHXs. Therefore, in this study, we aimed to: (i) identify the genome-wide NHXs and core members in B. napus; (ii) determine the gene and protein features of BnaNHXs; and (iii) analyze the transcriptional responses of BnaNHXs to salt stress and other nutrient stresses, including ammonium toxicity and low phosphate. The genome-wide identification and molecular characterization of NHXs indicated their evolutionary conservation and functional divergence between allotetraploid rapeseed and the model Arabidopsis. Global landscapes of BnaNHXs will give an integrated understanding of their roles in the regulation of plant SSR, which will provide elite gene resources for the genetic improvement of plant SSR through regulating the NHX-mediated Na+ transport.

2. Results

2.1. Genome-Wide Identification of NHXs in Plant Species

To identify the NHX family members in diverse plant species, we used the amino acid sequences of Arabidopsis NHXs as queries to perform BLASTp search against the genome databases of B. rapa (‘Chiifu-401’), B. oleracea (‘TO1000’), B. napus (‘Darmor-bzh’), and other plant species. We found great differences in the homolog number of NHXs in dicots, monocots, and lower plant species (Table 1, Figure 1A). The plant genome sizes varied from 125 Mb (Arabidopssis thaliana) to 2300 Mb (Zea mays), and the NHX number ranged from 5 (Solanum lycopersicum) to 18 (B. napus). On the whole, the NHX homolog numbers appeared not to be closely correlated with the plant genome sizes (correlation coefficient = 0.06 > p = 0.05). In the model A. thaliana, NHXs had eight members (NHX1-NHX8), namely, each NHX member only had a single copy. We identified a total of 8, 8, and 18 NHX homologs in the diploid B. rapa, B. oleracea, and the allotetraploid B. napus, respectively. The homolog number of NHXs in B. napus was similar to the sum of NHXs in B. rapa and B. oleracea (Table 1). Therefore, it might be concluded that most NHXs were kept during the spontaneous hybridization between B. rapa and B. oleracea for the formation of allotetraploid B. napus. In detail, both BnaNHX1s and BnaNHX6s had four homologs, and BnaNHX2s, BnaNHX3s, BnaNHX4s, BnaSOS1s/BnaNHX7s, and BnaNHX8s had two homologs in B. napus (Figure 1B). However, we found that NHX5 was lost in B. rapa, B. oleracea and B. napus (Figure 1B). The variations in the BnaNHX number might indicate their significant differential roles in the resistance of B. napus to salt stresses.

2.2. Genomic Distribution and Expansion Patterns of BnaNHXs

Through physical position identification of eight NHXs in Arabidopsis, we found that four of them were distributed on Chr. 01 (AtNHX5, AtNHX6, and AtNHX8), Chr. 02 (AtSOS1), Chr. 03 (AtNHX2 and AtNHX4), and Chr. 05 (AtNHX1 and AtNHX3), respectively (Table 2, Figure 2A). To further understand the genomic distribution and expansion patterns of BnaNHXs, we retrieved the DNA sequences of BnaNHXs from the Brassica and CNS-Genoscope databases. The BnaNHXs were physically mapped onto nine chromosomes (A subgenome: A5, A6, A7, A9 and A10; C subgenome: C2, C5, C6 and C9) of B. napus (Table 2, Figure 2B). The 18 BnaNHXs were unevenly distributed in different chromosomes (Table 2, Figure 2). The chromosomes C9 and C5 had more BnaNHXs, including BnaC9.NHX1 (BnaC09g02990D), BnaC9.NHX3 (BnaC09g31970D), and BnaC9.SOS1 (BnaC09g52290D) on C9, and BnaC5.NHX2 (BnaC05g46790D), BnaC5.NHX4 (BnaC05g45460D), and BnaC5.NHX8 (BnaC05g10850D) on C5, than other chromosomes did (Table 2, Figure 2B).
Gene family expansion occurs mainly via four pathways: tandem duplication, segmental duplication, whole-genome duplication/polyploidization and replicative transposition [32]. The B. napus progenitor diploid (B. rapa and B. oleracea) genomes are ancient polyploids, and large-scale chromosomal rearrangements have occurred since their evolution from the model Arabidopsis, a lower chromosome number progenitor [33]. Comparative genomics reveals that the Arabidopsis genome can be divided into 24 ancestral crucifer blocks, which are labeled A-X [34]. Table 2 shows that AtNHXs and their corresponding BnaNHX homologs were located on the same chromosomal blocks. In detail, the NHXs were located on the Q (NHX1s), F (NHX2s), W (NHX3s), F (NHX4s), C (NHX5s), E (NHX6s), K (NHX7s/SOS1s), and A (NHX8s) chromosomal blocks, respectively (Table 2). From the genomic distribution of BnaNHXs, we propose that the family expansion of BnaNHXs was mainly attributed to whole-genome duplication and segmental duplication, except BnaC2.NHX1a and BnaC2.NHX1b, which were derived from tandem duplication (Figure 2B).

2.3. Phylogeny Analysis of BnaNHXs

To elucidate the molecular evolution and phylogenetic relationships among the NHX proteins in Cruciferae species, we constructed unrooted phylogenetic trees involving AtNHXs and their homologs in Brassica species (Figure 3). In Arabidopsis, the NHX family members were mainly classified into three clades: Clade I (AtNHX1, AtNHX2, AtNHX3 and AtNHX4), Clade II (AtNHX5 and AtNHX6), and Clade III (AtSOS1/AtNHX7 and AtNHX8) (Figure 3A). Further, we performed a phylogeny analysis of 8 NHXs in A. thaliana and 18 NHXs in B. napus. The phylogenetic tree could also be three larger clades, which could be further classified into eight smaller categories, and each BnaNHX member was closely clustered with the corresponding homologs in A. thaliana (Figure 3B). The result indicated that the NHXs diverged before the Brassica speciation. Most of the NHXs within each subfamily had very short branch lengths (Figure 3B), which suggested the occurrence of recent genetic divergence.

2.4. Molecular Characterization of BnaNHXs

To understand the molecular characteristics of BnaNHXs, we calculated the physicochemical parameters of each BnaNHX using ExPASy. The results showed that most proteins in the same NHX subfamily had similar parameters (Table 2). In total, the CDS lengths of BnaNHXs varied from 1590 bp (BnaA10.NHX3) to 3420 bp (BnaA9.SOS1 and BnaC9.SOS1), and the corresponding numbers of deduced amino acids varied from 529 to 1139 (Table 2). Most of the computed molecular weights of BnaNHXs ranged from 58.7 kD (BnaC9.NHX3) to 125.8 kD (BnaC9.SOS1 and BnaA9.SOS1) (Table 3). The theoretical isoelectric points (pIs) of BnaNHXs varied from 5.62 (BnaA7.NHX6a) to 7.76 (BnaA9.NHX1), with most >7.0 except that of BnaNHX6s (5.62–6.91) (Table 3). The grand average of hydropathy (GRAVY) value is defined as the sum of hydropathy values of the amino acids divided by the protein length. The results showed that BnaNHXs had GRAVY values ranging from 0.109 (BnaC9.SOS1) to 0.559 (BnaC9.NHX3) (Table 3), therefore all of which were assumed to be hydrophobic. Most instability indices of BnaNHXs were <40.0 (Table 3), and it indicated that most BnaNHXs showed strong protein stability, except those of BnaA7.NHX6a (41.65) and BnaC6.NHX6a (42.95), which were > 40.0. The online WoLF PSORT was used to predict the subcellular localization of 8 AtNHXs and 18 BnaNHXs. In general, the subcellular localizations of BnaNHXs were consistent with those of the corresponding Arabidopsis NHX homologs (Table 3, Figure S1). In detail, BnaNHX1s-4s were localized on the tonoplast, and BnaNHX5s and BnaNHX6s were localized on the endosome, while BnaSOS1s/BnaNHX7s and BnaNHX8s were localized on the plasma membrane. Different subcellular localizations of BnaNHXs indicated their distinct roles in the regulation of rapeseed SSR. To further identify the transmembrane topology of NHXs, we used the TMHMM tool to characterize their transmembrane structures, and found that AtNHXs and BnaNHXs had 8 to 12 membrane-spanning regions (Table 3; Figure S2). In detail, both AtNHX1 and BnaNHX1s had 12 transmembrane regions, and both AtNHX3 and BnaNHX3s had 11 transmembrane regions, whereas the other six subgroup members had different membrane-spanning regions between Arabidopsis and B. napus (Table 3). Prediction of phosphorylation sites in BnaNHXs showed that tyrosine is the most common site for phosphorylation (Figure S3). Similar to AtNHXs without signal peptides, BnaNHXs were not identified to have any signal peptides, either (Figure S4). The RPSP v. 2009 program predicted that the recombinant BnaNHX proteins would be insoluble when these proteins are overexpressed in E. coli.

2.5. Identification of Evolutionary Selection Pressure on BnaNHXs

To assess the selection pressure on BnaNHXs during the evolutionary process, we used the orthologous NHX pairs between B. napus and A. thaliana to calculate the values of Ka, Ks and Ka/Ks (Table 2). The Ka values of BnaNHXs ranged from 0.0338 (BnaC2.NHX1a) to 0.0909 (BnaC9.SOS1), with an average of 0.054, and the Ks values of BnaNHXs ranged from 0.2542 (BnaA6.NHX8) to 0.4996 (BnaC9.NHX1), with an average of 0.396. Further, we found that all the Ka/Ks values of BnaNHXs were < 1.0 (Table 2). Therefore, we proposed that BnaNHXs might have experienced very strong negative selection to preserve their functionality.
The Ks values of duplicated homologs among gene families are usually proposed to be molecular clocks, and they are expected to be similar over time. The segregation between the model Arabidopsis and its derived Brassica species occurred 12–20 million years ago (Mya) [35,36]. Our result showed that most BnaNHXs might diverge from AtNHXs approximately 12.0–18.0 Mya (Figure 3B), which implied that the Brassica plant speciation might be accompanied by the NHX divergence.

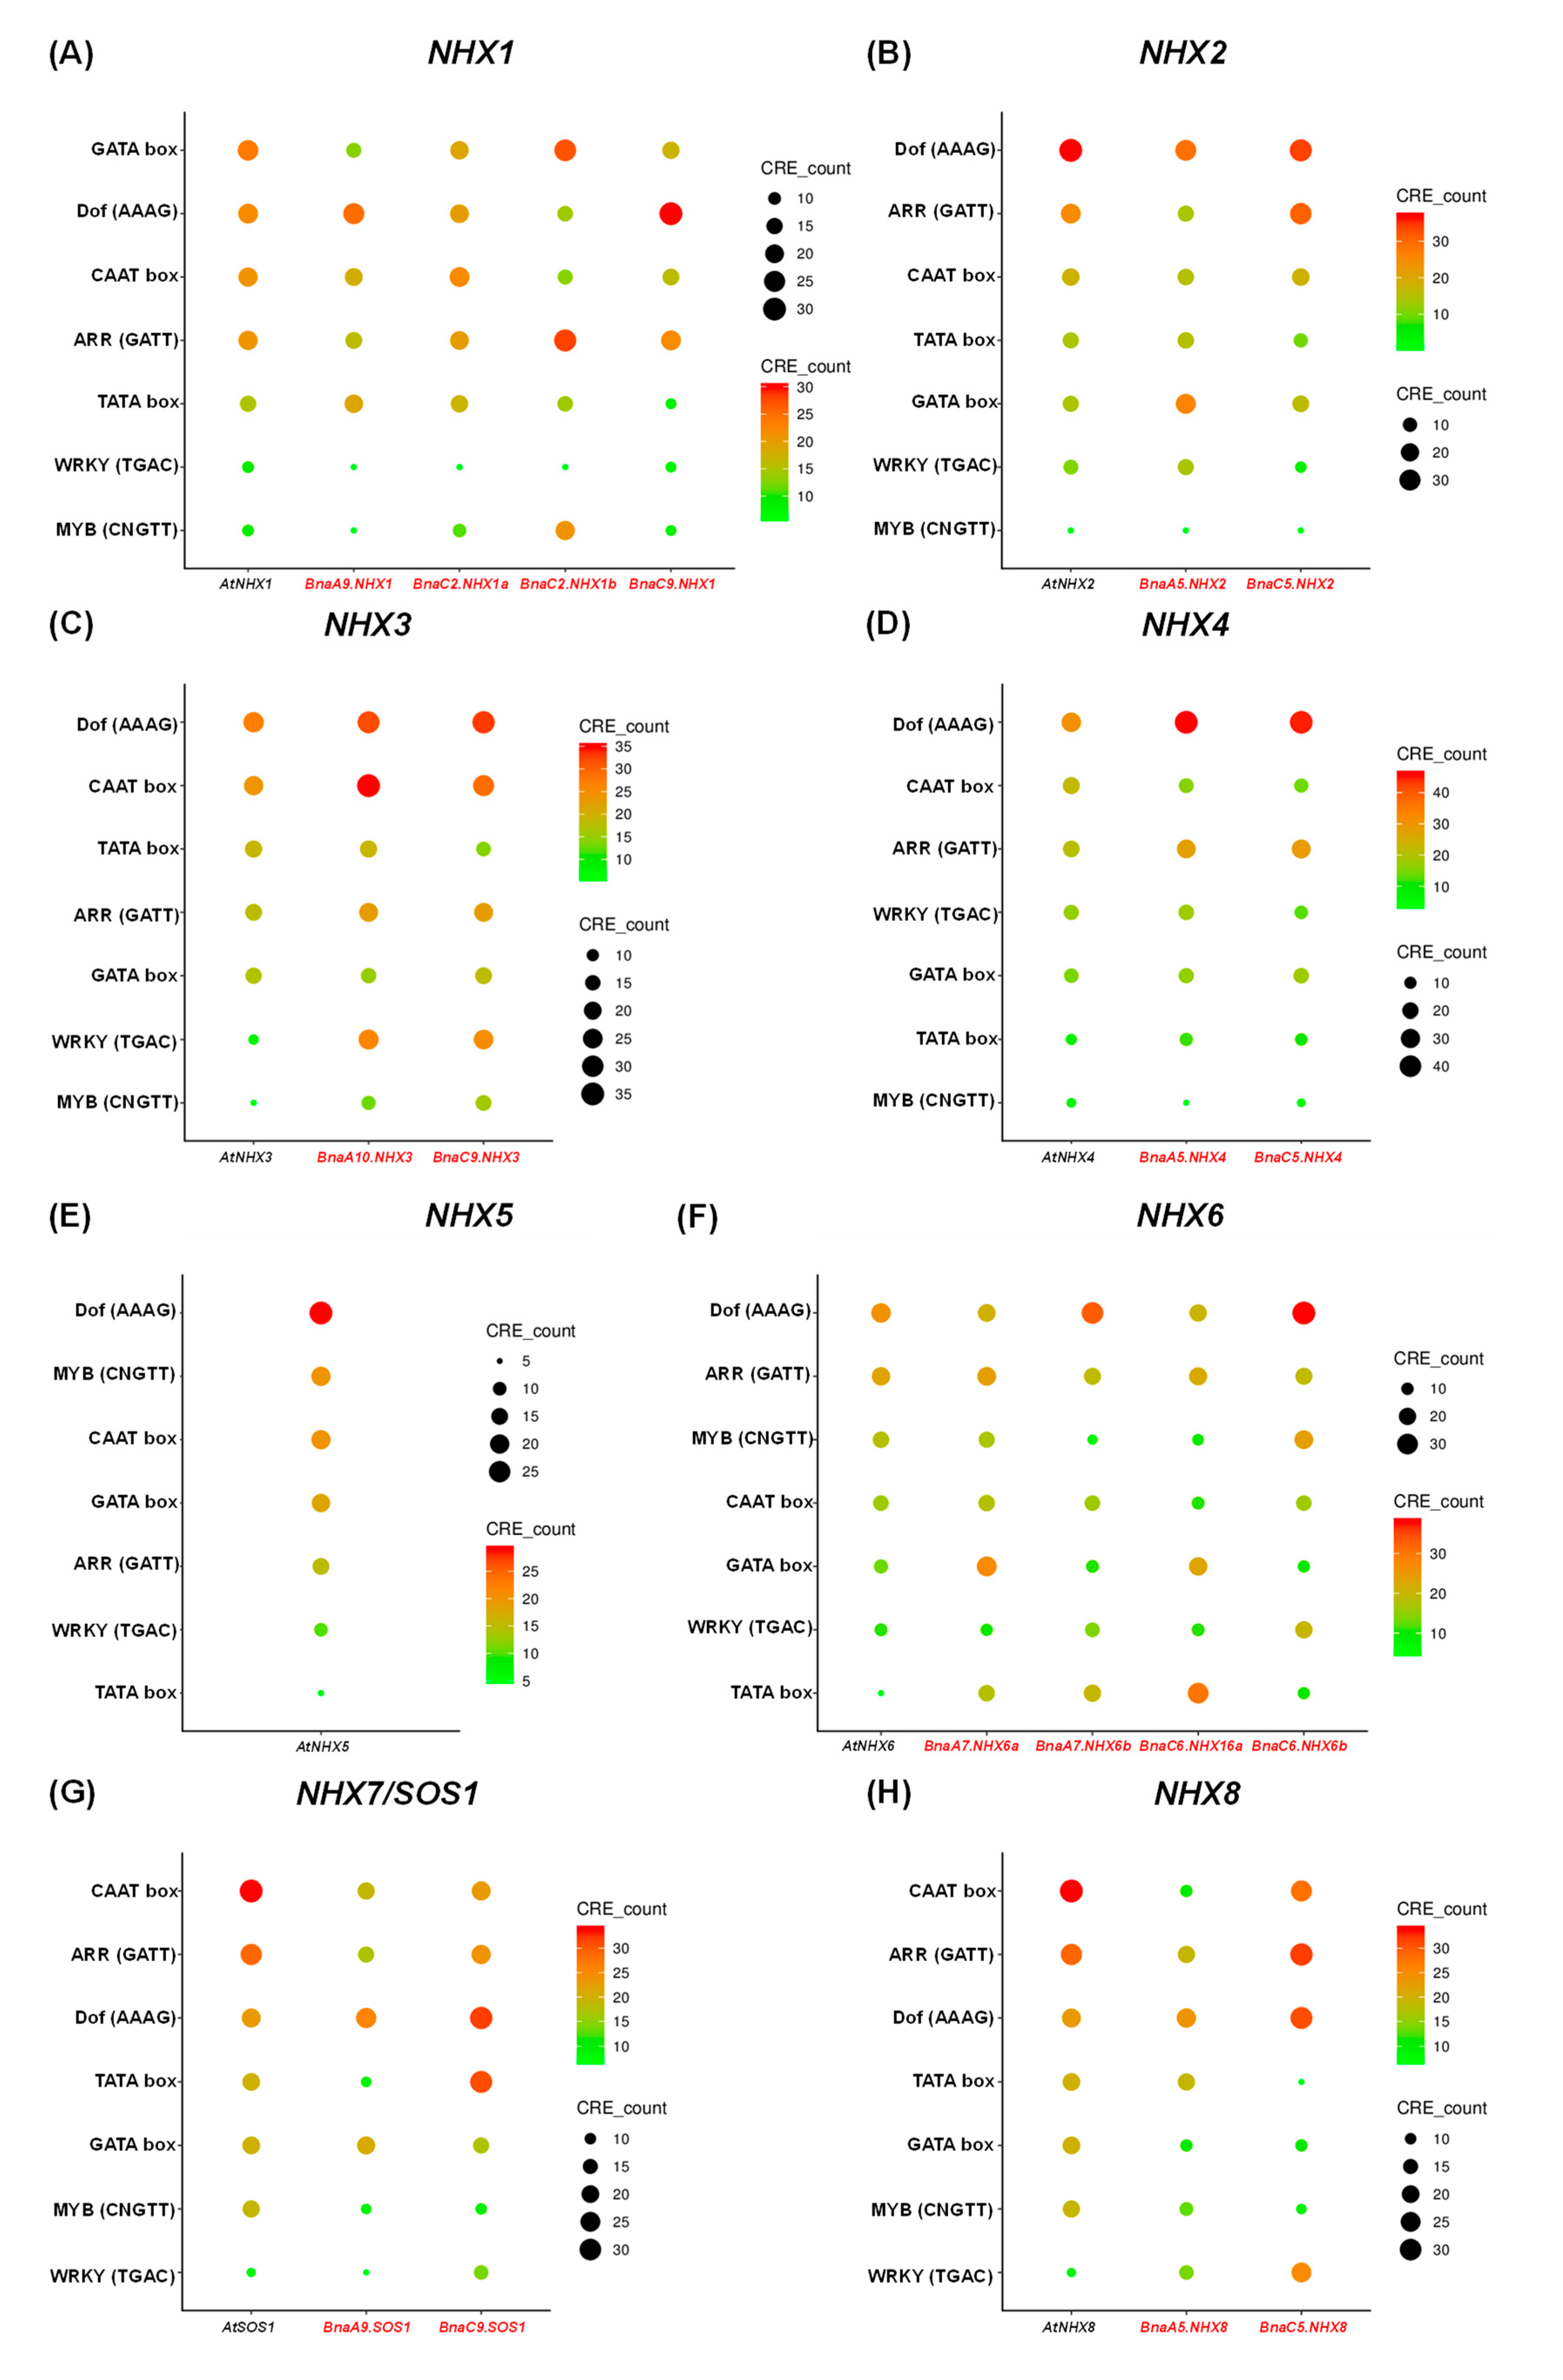
2.6. Conserved Domain, Gene Structure, Protein Interaction and Transcriptional Regulatory Analysis

The amino acid residues are thought to be functionally or structurally significant if they are evolutionarily conserved. The MEME results showed some conserved domains among the 8 AtNHXs and 18 BnaNHXs (Figure 4A). The predicted motifs of BnaNHXs ranged from 6 to 50 amino acids in length. Further, we identified that these conserved domains belonged to the Cation/Proton Antiporter (CPA) family (Figure 4A). Among the 15 conserved domains that we defined, we found that the amino acid sequences of the Motif III, V, VI, VIII, IX, XI and XIII had the highest identity among all the BnaNHXs (Figure 4B), and thus might be used as the indicators of the NHX family members. Noticeably, the amiloride-binding site (FFIYLLPPI), which is a typical feature of NHXs, was also found in the Motif II and III of BnaNHX1s-4s, whereas it was absent in BnaNHX6s-8s (Figure 4B).
To further identify which proteins might interact with BnaNHXs, we constructed protein interaction networks using the STRING database, based on either known experimental or predicted interactions. A previous study has shown that the transport activity of NHX is regulated by SOS2 and SOS3 [37], and HKT1 can also transport Na+ [38]. Consistently, all the NHXs interacted with high-affinity K+ transporters (HKTs), calcineurin B-like protein 4 (CBL4/SOS3), and CBL-interacting protein kinase 24 (CIPK24/SOS2) (Figure 5). In addition, except NHX4 and NHX6, the other NHXs interacted with AVP1 (Figure 5), which serves a job-sharing role with V-ATPase in vacuolar acidification [39].
The secondary structures of NHXs were predicted by the Phyre2 software, and the alpha helix, beta strand, disordered and transmembrane helix were mainly analyzed (Supplementary Figure S5). The alpha helix percentage of the BnaNHX secondary structures ranged from 67% (BnaA9.SOS1) to 79% (BnaC6.NHX6b), with an average of 75%, which indicated that alpha helix was a major constituent of the BnaNHX secondary structure. However, beta strand was not found in most BnaNHXs, except BnaSOS1s. The disordered structure ratios of BnaNHXs ranged from 17% (BnaA6.NHX8) to 26% (BnaA9.SOS1), with an average of 19.39%. The transmembrane helix proportion of BnaNHXs ranged from 22% (BnaA9.SOS1/BnaC9.SOS1) to 55% (BnaA7.NHX6b), with an average of 43.22% (Figure S5).
The number and organization of exon–intron structures are indicative of evolutionary imprints within gene families. Therefore, it led us to identify the BnaNHX structures, through the comparison of the genomic DNA sequences, with their corresponding coding sequences. As shown in Table 2, in general, most BnaNHXs had similar gene structures to Arabidopsis NHXs, which suggested their conserved functionality between the ancestor Arabidopsis and the progenitor B. napus. However, we also observed some structure variations between the same BnaNHX subgroup. The number of exons and introns of BnaNHX6s and BnaNHX8s was different from those of AtNHX6 and AtNHX8, respectively (Table 2, Figure S6). The exon number changes, potentially caused by alternative splicing, might contribute to the functional differentiation among different BnaNHXs.
Transcription factors, binding to the cis-acting regulatory elements (CREs) in the promoter regions of their target genes, play important roles in the transcriptional regulation [40]. To identify the core transcription factors regulating NHXs, the 2.0-kb upstream region sequences of the BnaNHX start codons were used to explore the enriched CREs (Figure 6). The results showed that BnaNHXs had various types of CREs in their promoter regions, and suggested that complicated regulatory networks may be involved in the transcriptional regulation of BnaNHXs. Apart from the common CREs, such as the TATA box and the CAAT box, we also identified that the CAAT-box, DNA-binding with One Finger (Dof, AAAG), and Age-Related Resistance (ARR, GATT) elements were three highly enriched terms in the BnaNHX promoters (Figure 6). Compared with the CREs in the BnaNHX promoters, the most over-presented CREs were the DNA-binding with one finger (Dof), MYB-binding and MYC/bHLH-binding elements, although some common CREs, including Dof (AAAG), CAAT-box and ARR (GATT), were also identified in both Arabidopsis and B. napus (Figure 6). These results showed that there existed common and specific regulatory mechanisms in the NHXs of Arabidopsis and B. napus.

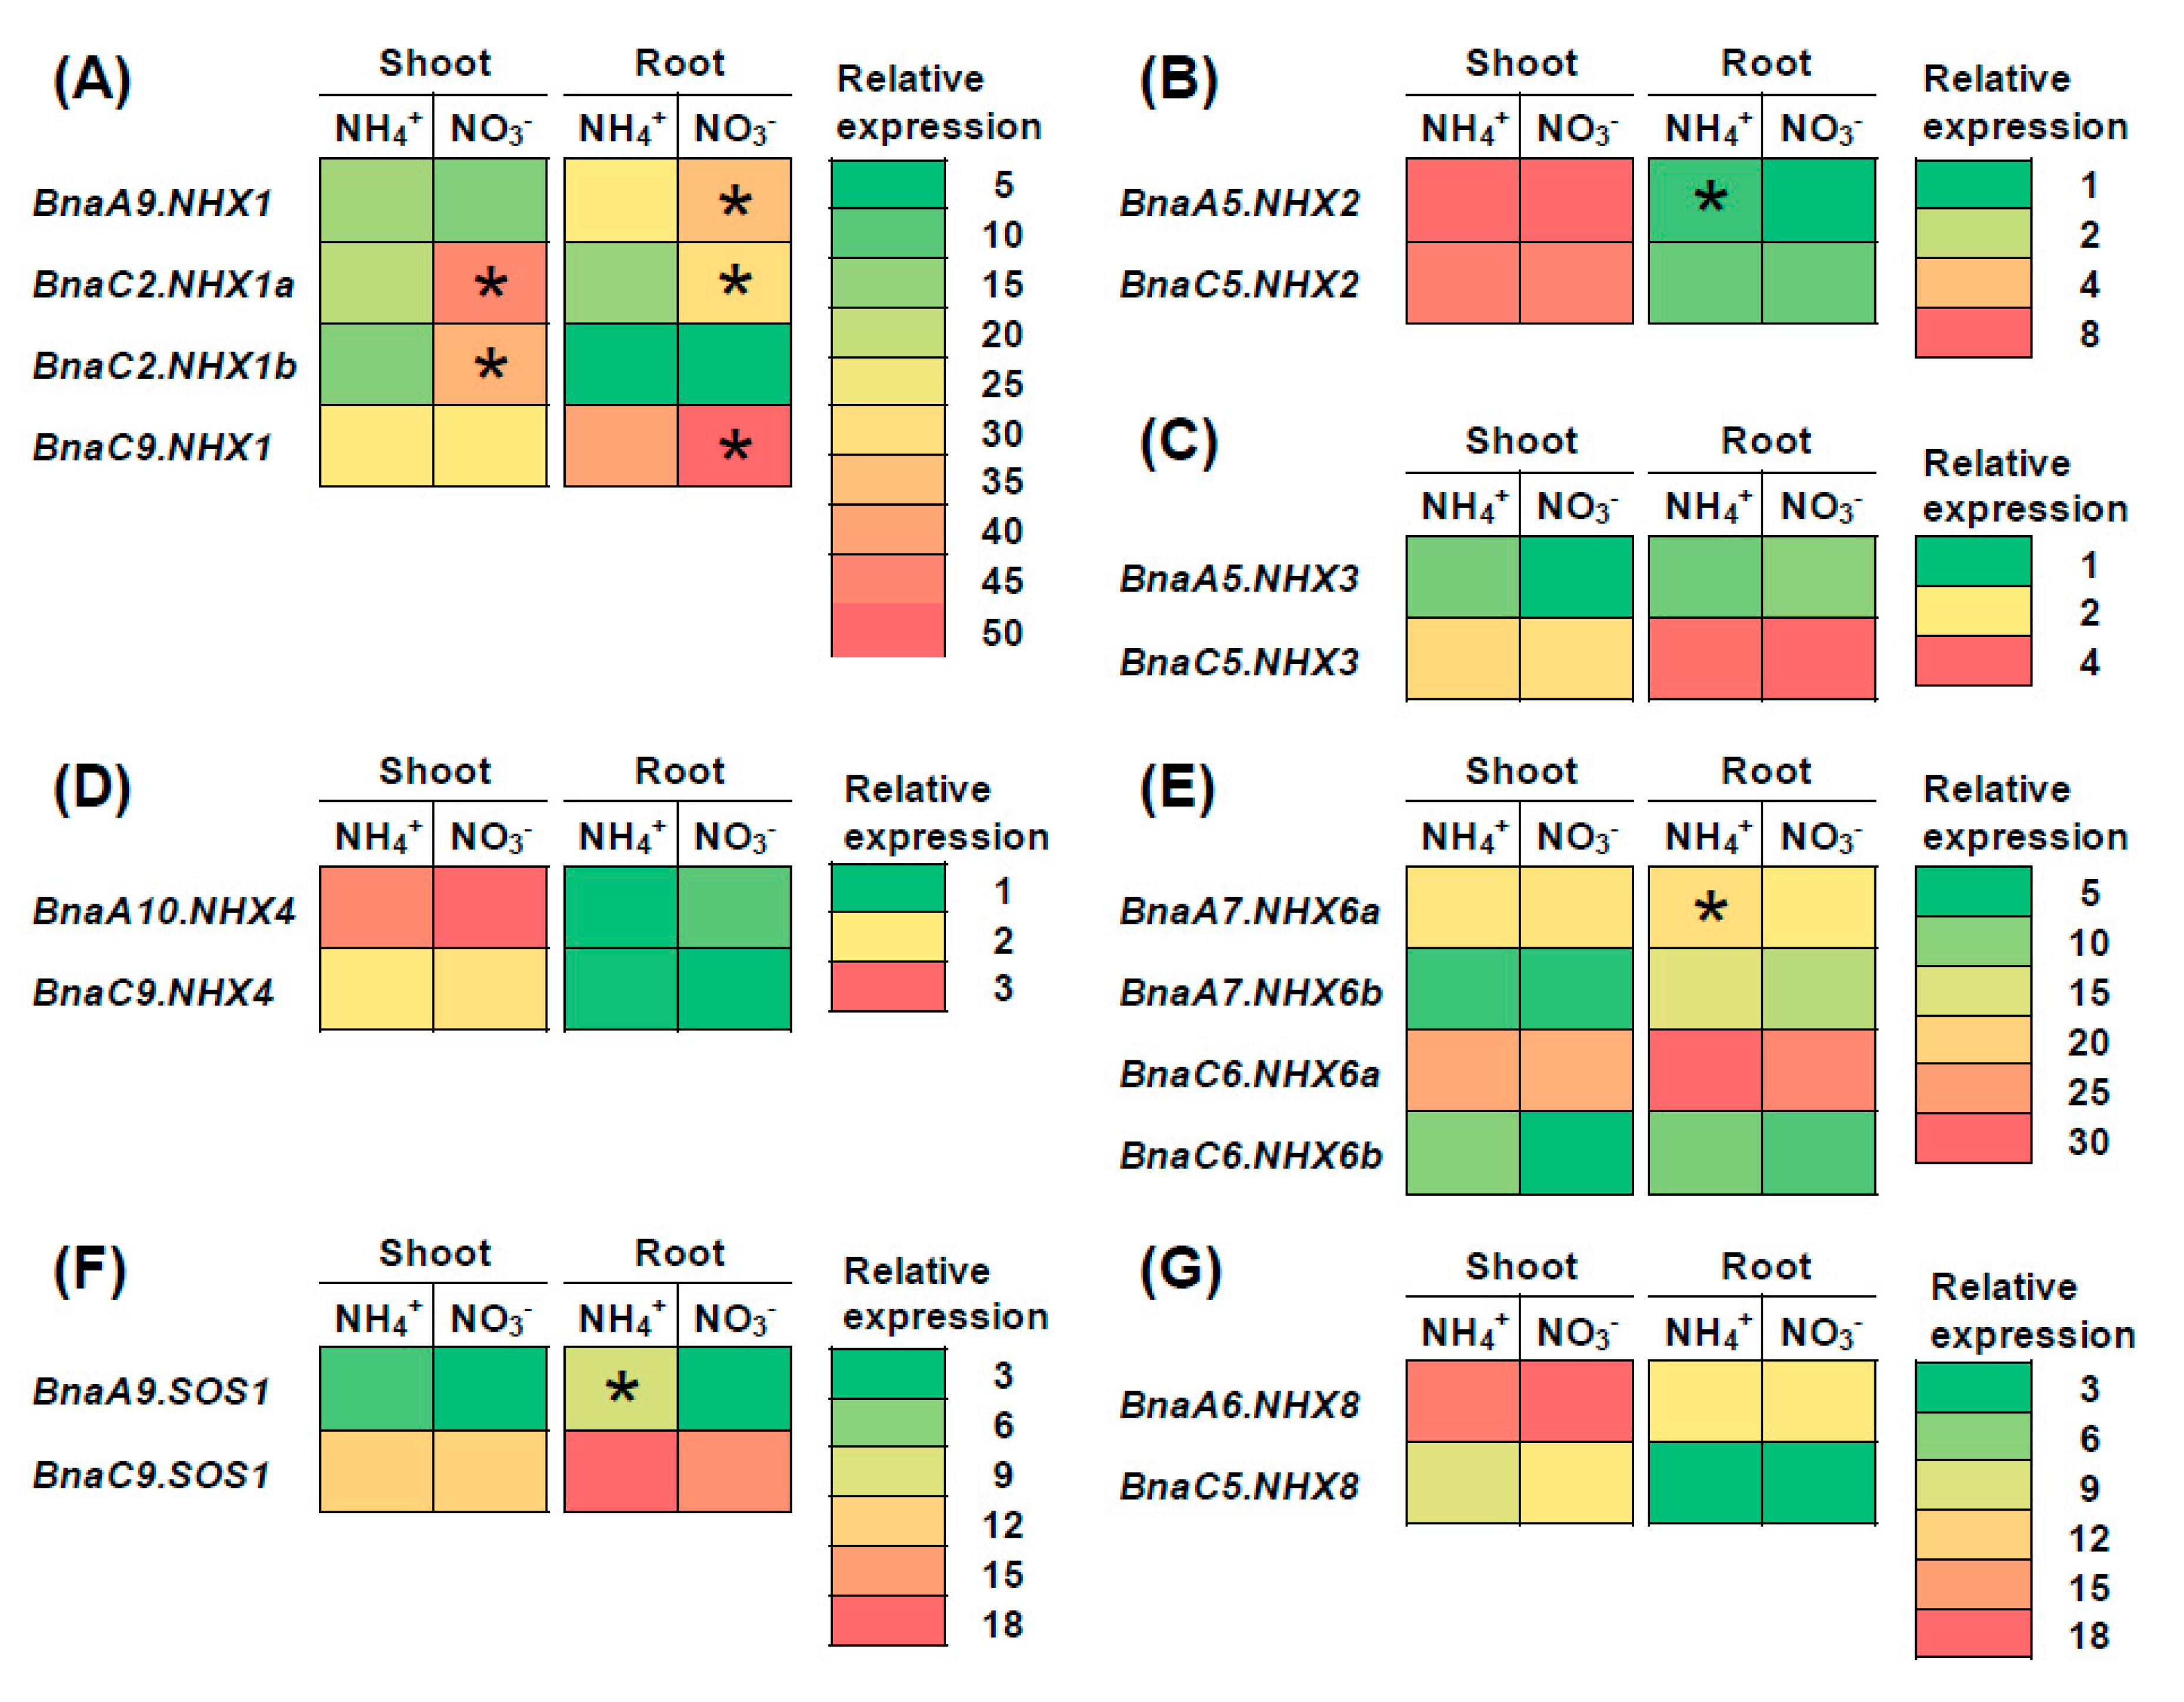
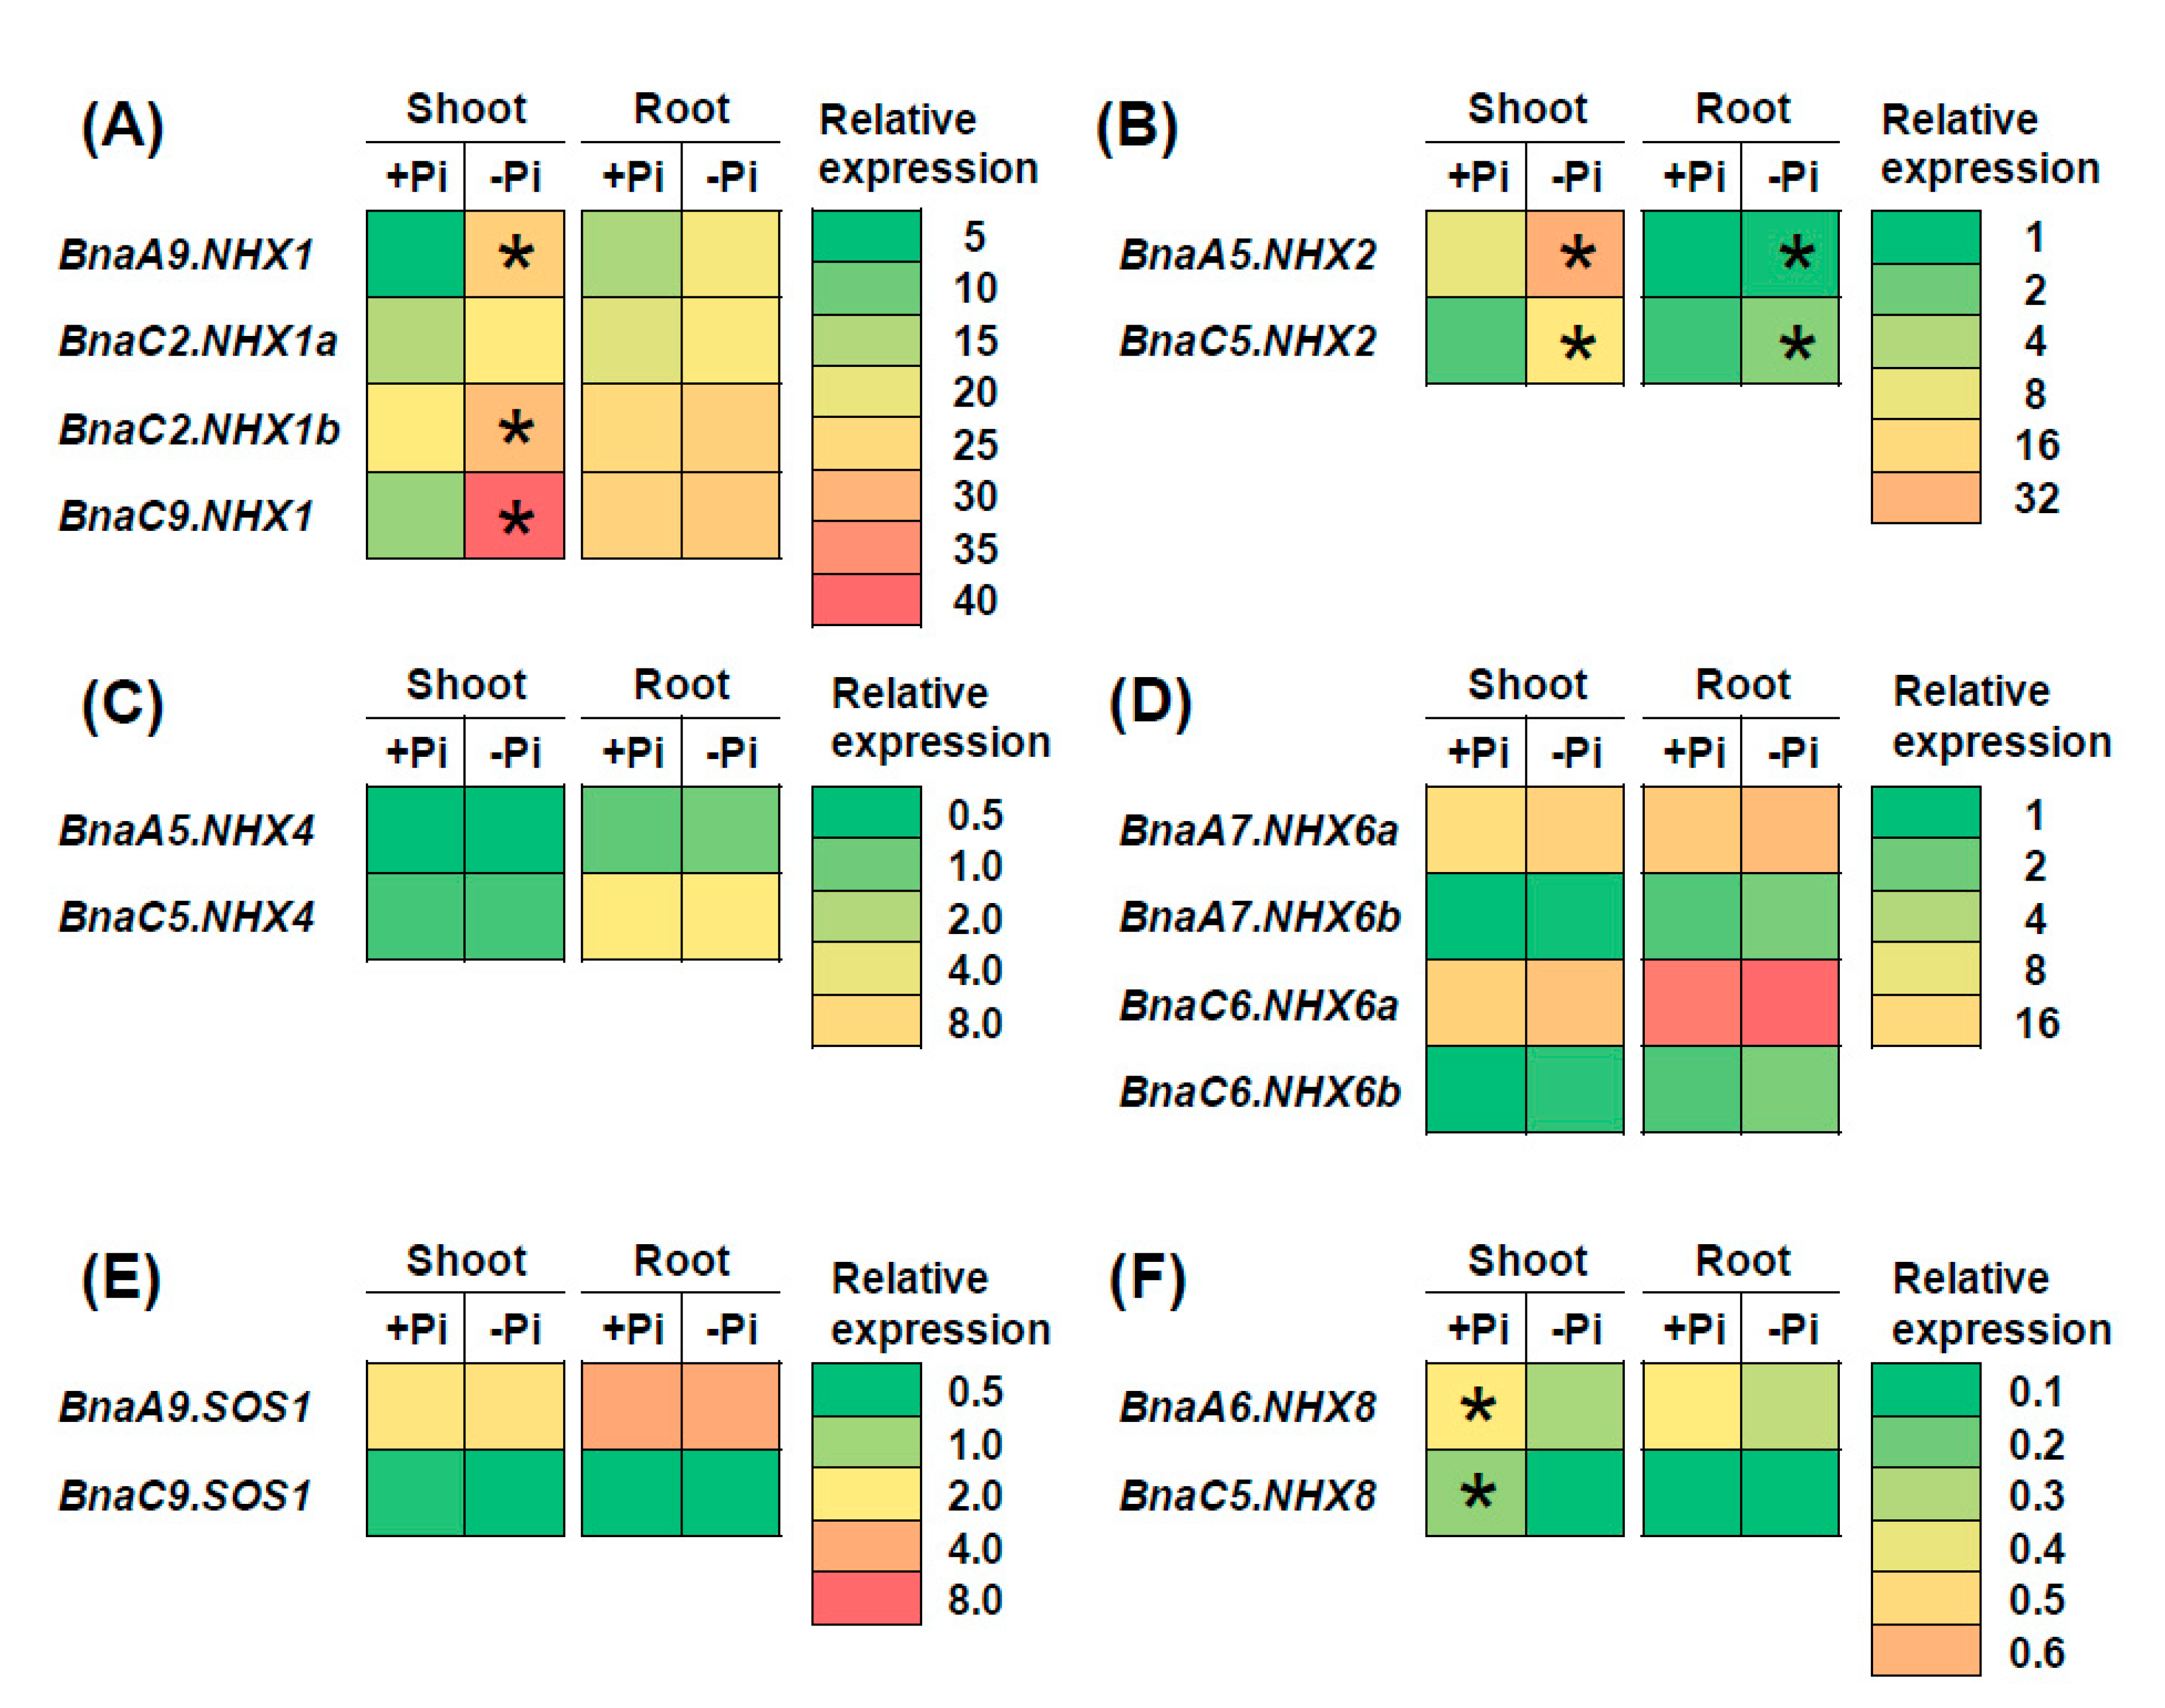
2.7. Transcriptional Analysis of BnaNHXs Under Diverse Nutrient Stresses

To identify the roles of BnaNHXs in regulating rapeseed against salt stress, we explored their transcriptional responses under these circumstances. First, we investigated the transcriptional patterns of AtNHXs in various tissues through the TAIR eFP Browser. The results showed that AtNHX1, AtNHX2, AtNHX3 and AtNHX4 were highly expressed in the vacuole (Figure S1), which indicated that they might play key roles in the transport of Na+ from the cytoplasm into the vacuole. In addition, both AtNHX5 and AtNHX6 had the highest expression levels in the endosome (Figure S1). AtSOS1/AtNHX7 and AtNHX8 had preferential expression in the plasma membrane (Figure S1). The differential expression characteristics implied the specific roles of NHXs in the regulation of plant SSR.
The results above-mentioned indicated that multicopies of each NHX homolog occurred in allotetraploid rapeseed (Figure 1, Table 1), and that transcriptional identification of the core NHX members is very important for a more in-depth understanding of BnaNHXs, which would contribute to the identification of elite gene resources for the genetic improvement of rapeseed SSR.
A total of 16 members of the 18 BnaNHXs, except 2 BnaNHX8s (BnaA6.NHX8s and BnaC5.NHX8s), were identified to be differentially expressed in rapeseed plants under salt stress (200 mM NaCl) (Figure 7). However, different BnaNHX members showed distinct transcriptional responses to salt stress. In detail, most (87.5%) of the differentially expressed genes (DEGs) were upregulated in the shoots or roots under salt stress (Figure 7), except that the two BnaNHX3s were downregulated in the roots (Figure 7H). Differential expression of BnaNHX1s, BnaA7.NHX6a, BnaC6.NHX6a and BnaSOS1s was only found in the shoots (Figure 7A,G). BnaNHX2s, BnaA7.NHX6b, BnaC6.NHX6b and BnaNHX4s were induced in both the shoots and roots (Figure 7B,D). To determine the core members functioning in the vacuolar sequestration of excessive Na+, we performed a co-expression network analysis of BnaNHX1s-4s. The result showed that BnaC2.NHX1a might play a major role in the vacuolar sequestration-mediated SSR of rapeseed plants (Figure 7E). BnaC6.NHX6a showed the highest expression levels among the four differentially expressed BnaNHX6s, and it was proposed to be the central gene in the endosome-mediated SSR (Figure 7E). In the plasma membrane-localized SOS1/NHX7- and NHX8-mediated Na+ efflux, BnaC9.SOS1 was identified to be the core member, by virtue of its differential expression in response to salt stress and higher expression levels (Figure 7G,H).
A previous study has found that nitrate enhances plant SSR more than ammonium does under salt stress [41]. Therefore, we analyzed the transcriptional expression of BnaNHXs under nitrate and ammonium conditions to investigate their roles in the plant SSR (Figure 8). Under different forms of nitrogen conditions, we identified a total of seven BnaNHX DEGs, which included four BnaNHX1s, BnaA5.NHX2, BnaA7.NHX6a, and BnaA9.SOS1 (Figure 8). Among these DEGs, we found that only the four BnaNHX1 DEGs showed higher expression levels under nitrate supply than under ammonium supply (Figure 8). However, the DEGs of BnaNHX2s, BnaNHX6s and BnaSOS1s were upregulated when ammonium was supplied (Figure 8B,E,F). Another previous report found that plant salt stress damages can be alleviated by phosphorus limitation [42]. Therefore, we analyzed the transcriptional expression of BnaNHXs under low phosphate to investigate their roles in the plant SSR (Figure 9). Under phosphate limitation condition, a total of seven BnaNHX DEGs, including three BnaNHX1s (BnaA9.NHX1, BnaC2.NHX1b, and BnaC9.NHX1), two BnaNHX2s, and two BnaNHX8s, were identified in the shoots or roots (Figure 9). In detail, the expression of three BnaNHX1 DEGs was upregulated only in the shoots (Figure 9A), whereas the expression of two BnaNHX2 DEGs was upregulated in both the shoots and roots (Figure 9B). However, the expression of two BnaNHX8 DEGs was repressed by low phosphate in the shoots (Figure 9F).
Based on the transcriptional results above, we constructed Venn diagrams to summarize the transcriptional responses of BnaNHXs to salt stress, nitrate supply, and low phosphate (Figure 10). The result showed that three BnaNHX1s (BnaA9.NHX1, BnaC2.NHX1b, and BnaC9.NHX1) were consistently upregulated under the above three nutrient conditions (Figure 10A). A BnaNHX gene (BnaC2.NHX1a) was upregulated under both salt stress and nitrate supply conditions, and two BnaNHX2s (BnaA5.NHX2 and BnaC5.NHX2) were upregulated under both salt stress and low phosphate conditions (Figure 10A). By contrast, none of the BnaNHXs were consistently downregulated under salt stress, nitrate supply, and low phosphate conditions (Figure 10B).

3. Discussion

Previous studies have shown that NHXs play critical roles in the regulation of plant growth, development, and abiotic and biotic stress responses. Under salt stresses, NHXs play pivotal roles in the intracellular Na+ excretion and vacuolar Na+ compartmentalization, which are important for plant SSR [6,10,17,43]. However, few systematic studies on NHXs have been performed in B. napus before. In this study, we identified a total of 18 full-length NHXs, representing seven subgroups (NHX1-NHX8 without NHX5) in the rapeseed genome. Subsequently, we performed analyses of their phylogeny relationships, physio-chemical characteristics, gene/protein structures, conserved motifs, selection pressure, promoter enriched cis-elements, and differential expression of BnaNHXs under different nutrient conditions.

3.1. An Integrated Bioinformatics Analysis Provided Comprehensive Insights into the Molecular Features of BnaNHXs

Through the identification of genome-wide NHXs in A. thaliana and Brassica crops, we found that NHX5 has been lost in B. rapa, B. oleracea, and B. napus (Figure 1B). We proposed that the loss of NHX5 in the evolutionary process may be attributed to the redundant functions between NHX5 and NHX6, the latter having four homologs in allotetraploid rapeseed (Figure 1B). Bioinformatics analysis showed that BnaNHXs can be divided into three classes according to their vacuolar (BnaNHX1s-4s), endosomal (BnaNHX6s), and plasma membrane (BnaSOS1s and BnaNHX8s) localizations. The structural diversity of exons/introns provides some evidence for phylogenetic grouping [24]. In B. napus, BnaNHX1s-4s have fewer exons (13–14) than BnaNHX6 (21–24), BnaSOS1 (23), and BnaNHX8 (14–19) class members (Supplementary Figure S6). Similarly, in soybean, seven members of GmNHXs contained 14–15 exons, whereas three other members had 20 exons [44]. These results indicated that there is structural diversity in the NHX family in different plant species.
Besides, the conserved motif analysis showed that all the BnaNHXs shared multiple motifs, and BnaNHX1s-4s had amiloride-binding sites (FFIYLLPPI) and transmembrane pores (Figure 4), indicating that BnaNHXs were relatively conserved in the evolutionary process. The SOS pathways, consisting of SOS3, SOS2, and SOS1/NHX7, have been well defined as crucial pathways to control cellular ion homeostasis, by extruding Na+ to the extracellular space, thus conferring SSR in plants [43]. Protein interaction network analysis showed that most NHXs interacted with SOS3, SOS2, and some cation/H+ antiporters (CHXs), such as the high-affinity K+ transporters (HKTs) (Figure 5). This result suggested that the SOS3-SOS2-CHX pathway might be not only a common but also an essential pathway regulating plant SRR. In addition, the cis-acting regulatory elements act as the agents involved in gene activity to control biological processes, such as hormonal responses and abiotic stress responses [35,36]. In the promoter regions of BnaNHXs, there were numerous binding sites of transcription factors (Figure 6), such as WRKYs, that respond to plant defense response and participate in plant hormone signaling pathways.

3.2. Transcriptional Analysis Revealed Differential Responses and Core Regulators of BnaNHXs Under Salt Stress

In this study, we found that most BnaNHXs were significantly upregulated under salt stress, among which the upregulated levels of BnaNHX1s were the highest (Figure 7). This finding highlighted the crucial role of BnaNHX1s in the regulation of rapeseed SSR. It has been demonstrated that NHXs play key roles in chelating Na+ into vacuoles to maintain Na+ homeostasis, and thus improving plant SSR [45]. In addition, we also found that the expression of BnaNHXs in the shoots was significantly higher than that in the roots under salt stress, which might be attributed to the excessive accumulation of Na+ in the shoots under high salt concentrations [46]. Based on the differential expression and co-expression network analysis under salt stress (Figure 7A), we proposed that BnaC2.NHX1a was the central gene in the vacuolar sequestration of excess Na+. In this study, salt stress significantly increased the expression of BnaSOS1s/BnaNHX7s (Figure 7G), whereas the plasma membrane-localized BnaNHX8s were not responsive to salt stress (Figure 7H). This result suggested that BnaSOS1s/BnaNHX7s played more important roles in expelling Na+ from intracellular parts than BnaNHX8s did.

3.3. BnaNHX1s and BnaNHX2s Might be Involved in the Nitrate- and Low Phosphate-Mediated Salt Stress Resistance Enhancement

A previous study has found that nitrate enhances plant SSR more than ammonium does, and the nitrate-mediated plant SSR was thought to be associated with apoplast Na+ concentrations [41]. Besides, plant salt stress damages can be alleviated by phosphate limitation, which was thought to increase tissue mass density, enhance osmolytes accumulation, and inhibit Na+ uptake [42]. However, whether NHXs were involved in the nitrate- and low phosphate-mediated SSR enhancement has been unknown. Therefore, in this study, we investigated the BnaNHX expression under different nitrogen forms and phosphate limitation (Figure 8 and Figure 9). It should be acknowledged that the upregulation of BnaNHXs, no matter where they were localized, was favorable for plant SSR through increasing Na+ compartmentation or efflux. Under different nitrogen forms, among the seven BnaNHX DEGs, only BnaNHX1s were upregulated, whereas other DEGs, including BnaA5.NHX2, BnaA7.NHX6a, and BnaA9.SOS1, were downregulated (Figure 8). Thus, we proposed that it was BnaNHX1s, instead of other BnaNHXs, that might be involved in the nitrate-mediated SSR enhancement. There were only three BnaNHX1s, two BnaNHX2s, and two BnaNHX8s responsive to low phosphate, among them, the expression of BnaNHX1s and BnaNHX2s was induced whereas the expression of BnaNHX8s was repressed (Figure 9). Thus, we proposed that both BnaNHX1s and BnaNHX2s might mediate low phosphate-induced SSR enhancement. Taken together, we proposed that nitrate or low phosphate enhanced plant SSR mainly through increasing vacuolar Na+ sequestration.
In conclusion, we believe that global landscapes of BnaNHXs will give an integrated understanding of their family evolution and molecular characteristics, which will provide elite gene resources for the genetic improvement of plant SSR through regulating the NHX-mediated Na+ transport.

4. Materials and methods

4.1. Retrieval of NHX Sequences

Using the amino acid sequences of Arabidopsis NHXs as source sequences, we conducted BLASTp analyses to search for the NHX homologs in B. rapa, B. oleracea, and B. napus. In this study, we retrieved the NHX sequences using the following databases: The Arabidopsis Information Resource (TAIR10, https://www.arabidopsis.org/) for A. thaliana, the Brassica Database (BRAD) v. 1.1 (http://brassicadb.org/brad/) [47] for B. rapa, Bol base v. 1.0 (http://119.97.203.210/bolbase/index.html) for B. oleracea [48], Brassica napus pan-genome information resource (BnIR) and Genoscope (http://www.genoscope.cns.fr/brassicanapus/) for B. napus [29], National Center for Biotechnology Information (NCBI, www.ncbi.nlm.nih.gov), EnsemblPlants (http://plants.ensembl.org/index.html), and Phytozome v. 10 (http://phytozome.jgi.doe.gov/pz/portal.html) [49].

4.2. Gene Nomenclature of NHXs in B. napus

In this study, based on the nomenclature previously proposed [50,51,52], we named NHXs in Brassica species following the criterion: genus (one capital letter) + plant species (two lowercase letters) + chromosome (followed by a period) + name of the NHX homologs in A. thaliana. For example, BnaA1.NHX1 represents an Arabidopsis NHX1 homolog on the chromosome A1 of B. napus.

4.3. Physical Mapping and Family Expansion Analysis of BnaNHXs

We determined the genomic locations of BnaNHXs by BLASTn searches using the complete nucleotide sequences of AtNHXs. Using the genomic annotation, we physically mapped the AtNHXs and BnaNHXs onto the chromosomes using the MapGene2Chromosome v2.1 (http://mg2c.iask.in/mg2c_v2.1/). In this study, we defined the tandem duplicated genes as an array of two or more NHXs within a 100-kb genomic region.

4.4. Sequence Alignment and Phylogeny Analysis of BnaNHXs

We aligned the full-length protein sequences of the NHXs of Arabidopsis and B. napus using ClustalW [53] within MEGA (Molecular Evolutionary Genetics Analysis) v. 6.06 (http://www.megasoftware.net/) [54]. After these alignments, we constructed phylogenetic trees with the neighbor-joining (NJ) method [55]. We set the Poisson correction, pairwise deletion, and bootstrapping (1000 replicates; random seeds) as the required parameters.

4.5. Analysis of Evolutionary Selection Pressure and Functional Divergence of BnaNHXs

To analyze positive or negative (purifying) selection pressure on BnaNHXs, we calculated the values of synonymous (Ks) and non-synonymous (Ka) nucleotide substitution, and Ka/Ks. First, we performed pairwise alignment of the BnaNHX coding sequences (CDSs) using Clustal Omega (http://www.clustal.org/omega/) [56]. Then, we submitted the alignment results to the Ka/Ks Calculator (http://www.bork.embl.de/pal2nal/) software [57] for the calculation of the Ka, Ks, and Ka/Ks with the yn00 method [58]. According to Darwin’s theory of evolution, we usually propose that Ka/Ks > 1.0 means positive selection, while Ka/Ks < 1.0 indicates the occurrence of purifying selection, and Ka/Ks = 1.0 denotes neutral selection. Further, we estimated the divergence time of BnaNHXs from their progenitors applying the following formula: T = Ks/2λ, λ = 1.5 × 10⁻⁸ for Brassicaceae species [59].

4.6. Molecular Characterization of BnaNHXs

We used the ExPASy ProtoParam (http://www.expasy.org/tools/protparam.html) [60] program to calculate amino acid number and composition, molecular weight (MW, kD), theoretical isoelectric point (pI), grand average of hydropathy (GRAVY), and instability index (II) of BnaNHXs. Values of II >40.0 suggest that the proteins are unstable [61].
We used the online WoLF PSORT (http://www.genscript.com/wolf-psort.html) [62] program to predict the subcellular localization of BnaNHXs. To identify the transmembrane helices of the AtNHXs and BnaNHXs, we submitted their amino acid sequences to the TMHMM v. 2.0 (http://www.cbs.dtu.dk/services/TMHMM/) program. Phosphorylation sites of BnaNHXs were predicted by NetPhos 3.1 server (http://www.cbs.dtu.dk/services/NetPhos/) [63].
We employed the online SignalP v. 4.1 (http://www.cbs.dtu.dk/services/SignalP/) [64] to predict the presence and location of signal peptide cleavage sites in the BnaNHX protein sequences. To determine the recombinant protein solubility, we used the Recombinant Protein Solubility Prediction (RPSP) v. 2009 (http://biotech.ou.edu) program, which assumes that the NHX proteins are overexpressed in Escherichia coli [65].
We used the STRING (Search Tool for Recurring Instances of Neighboring Genes) v 11.0 (https://string-db.org) [66] web-server to retrieve and display the repeatedly occurring association networks of the NHXs. The three-dimensional (3-D) structure of BnaNHXs was predicted using phyre2 (http://www.sbg.bio.ic.ac.uk/phyre2/webscripts/jobmonitor) [67].

4.7. Conserved Motif Identification of BnaNHXs

To further examine the structural divergence among the NHXs in A. thaliana and Brassica crops, we submitted their protein sequences to the online MEME (Multiple Expectation maximization for Motif Elicitation) v. 4.12.0 (http://meme-suite.org/tools/meme) [68] for the characterization of conserved motifs/domains. We used all the default parameters except for the following: the optimum motif width was set to 6–50 bp and the maximum number of motifs was set as 15. The conserved motif sequences were presented by the online Weblogo (https://weblogo.berkeley.edu/logo.cgi) [69].

4.8. Elucidation of Gene Structure and Promoter Regulatory Elements of BnaNHXs

Full-length genomic DNA (gDNA) and CDS sequences were collected from the annotated genomes of A. thaliana and B. napus, and they were used to predict the exon–intron structures of NHXs. For each NHX, a 2.0-kb genomic sequence upstream from the start codon (ATG) was downloaded from the TAIR (https://www.arabidopsis.org/) website and B. napus Genome Browser (http://www.genoscope.cns.fr/brassicanapus/) [29]. Subsequently, we submitted these sequences to the PLACE v. 30.0 (http://www.dna.affrc.go.jp/PLACE/) program [70] to identify putative CREs.

4.9. Transcriptional Characterization of BnaNHXs Under Diverse Nutrient Conditions

In this study, the gene expression patterns of AtNHXs were obtained from the TAIR eFP Browser [71]. To further investigate the transcriptional responses of BnaNHXs under diverse nutrient stresses, we transplanted the uniform B. napus seedlings (cv. Zhongshuang 11) into black plastic containers holding 10 L Hoagland nutrient solution. The basic nutrition solution contained 1.0 mM KH2PO4, 5.0 mM KNO3, 5.0 mM Ca(NO3)2·4H2O, 2.0 mM MgSO4·7H2O, 0.050 mM EDTA-Fe, 9.0 µM MnCl2·4H2O, 0.80 µM ZnSO4·7H2O, 0.30 µM CuSO4·5H2O, 0.37 µM Na2MoO4·2H2O, and 46 µM H3BO3. The rapeseed seedlings were cultivated in an illuminated chamber with the following growth conditions: the light intensity of 200 μmol m-2 s-1, the temperature of 25 °C daytime/22 °C night, the light period of 16 h photoperiod/8 h dark, the relative humidity of 70%.
For the salt stress treatment, the 7 d-old uniform B. napus seedlings after seed germination were hydroponically cultivated in a NaCl-free nutrient solution for 10 d, and then were transferred to 200 mM NaCl for 1 d until sampling. For the nitrate and ammonium treatment, the 7 d-old uniform B. napus seedlings after seed germination were first hydroponically cultivated under 6.0 mM nitrate (NO3-) for 10 d, and then were transferred to an N-free nutrient solution for 3 d. Subsequently, the above seedlings were sampled after exposure to 6.0 mM ammonium (NH4+) for 3 d. For the inorganic phosphate (Pi) starvation treatment, the 7 d-old uniform B. napus seedlings after seed germination were first hydroponically grown under 250 μM KH2PO4 for 10 d, and then were transferred to 5 μM KH2PO4 for 3 d. The shoots and roots were individually harvested and immediately stored at –80 °C until RNA isolation. Each sample contained 3 independent biological replicates for the transcriptional analyses of BnaNHXs under diverse nutrient conditions.

4.10. Quantitative Reverse-Transcription PCR Assays

The quantitative reverse-transcription polymerase chain reaction (qRT-PCR) assays were used to investigate the relative expression of BnaNHXs. After removing genomic DNA with RNase-free DNase I in the RNA samples, total RNA was used as the template for cDNA synthesis with the PrimeScriptTM RT reagent Kit with gDNA Eraser (Perfect Real Time) (TaKaRa, Shiga, Japan). We quantified the BnaNHX expression using the SYBR® Premix Ex TaqTM II (Tli RNaseH Plus) (TaKaRa, Shiga, Japan) kit under an Applied Biosystems StepOneTM Plus Real-time PCR System (Thermo Fisher Scientific, Waltham, MA, USA). The thermal recycle regimes were as follows: 95 °C for 3 min, followed by 40 cycles of 95 °C for 10 s, then 60 °C for 30 s [72]. We also conducted a melt curve analysis to ensure the primer (Table S1) gene-specificity: 95 °C for 15 s, 60 °C for 1 min, 60–95 °C for 15 s (+0.3 °C per cycle). We used the public genes BnaEF1-α [73] and BnaGDI1 [74] as internal references and calculated the BnaNHX expression levels with the 2-ΔΔCT method [75]. p < 0.05 was used as the significance level to identify the differential gene expression between the treatments and controls.

Abbreviation

AtArabidopsis thaliana
BnaBrasssica napus
BolBrassica oleracea
BraBrassica rapa
BRADBrassica Database
CDSCoding sequence
CREcis-acting regulatory element
DEGsdifferentially expressed genes
gDNAgenomic DNA
MEMEMultiple expectation maximization for motif elicitation
MWMolecular weight
Na+sodium ion
Nnitrogen
NCBINational Center for Biotechnology Information
NH4+ammonium
NHXNa+/H+ antiporter
NO3 -nitrate
PMPlasma membrane
PPIProtein-protein interaction
Piphosphate
qRT-PCRquantitative reverse-transcription polymerase chain reaction
SOSSalt overly sensitive
SSRsalt stress resistance
TAIRThe Arabidopsis Information Resource
TFtranscription factor
TMTransmembrane

Supplementary Materials

Supplementary materials can be found at https://www.mdpi.com/1422-0067/21/10/3429/s1.

Author Contributions

Conceptualization, Y.-p.H.; Data curation, J.-y.H.; Formal analysis, J.-q.C.; Investigation, T.Z.; Project administration, Y.L.; Supervision, C.-p.Y. All authors have read and agreed to the published version of the manuscript.

Funding

This research was funded by National Natural Science Foundation of China: 31801923.

Acknowledgments

This study was financially supported by the National Natural Science Foundation of China (Grant NO. 31801923).

Conflicts of Interest

The authors declare no conflict of interest.

References

  1. Munns, R.; Tester, M. Mechanisms of salinity tolerance. Annu. Rev. Plant Biol. 2008, 59, 651–681. [Google Scholar] [CrossRef] [PubMed] [Green Version]
  2. Munns, R.; James, R.A.; Xu, B.; Athman, A.; Conn, S.J.; Jordans, C.; Byrt, C.S.; Hare, R.A.; Tyerman, S.D.; Tester, M.; et al. Wheat grain yield on saline soils is improved by an ancestral Na⁺ transporter gene. Nat. Biotechnol. 2012, 30, 360–364. [Google Scholar] [CrossRef] [PubMed]
  3. Huang, X.S.; Wang, W.; Zhang, Q.; Liu, J.H. A basic helix-loop-helix transcription factor, PtrbHLH, of poncirus trifoliata confers cold tolerance and modulates peroxidase-mediated scavenging of hydrogen peroxide. Plant Physiol. 2013, 162, 1178–1194. [Google Scholar] [CrossRef] [Green Version]
  4. Zhao, Q.; Zhang, H.; Wang, T.; Chen, S.; Dai, S. Proteomics-based investigation of salt-responsive mechanisms in plant roots. J. Proteom. 2013, 82, 230–253. [Google Scholar] [CrossRef]
  5. Liang, W.; Ma, X.; Wan, P.; Liu, L. Plant salt-tolerance mechanism: A review. Biochem. Biophys. Res. Commun. 2018, 495, 286–291. [Google Scholar] [CrossRef]
  6. Pehlivan, N.; Sun, L.; Jarrett, P.; Yang, X.; Mishra, N.; Chen, L.; Kadioglu, A.; Shen, G.; Zhang, H. Co-overexpressing a plasma membrane and a vacuolar membrane sodium/proton antiporter significantly improves salt tolerance in transgenic Arabidopsis plants. Plant Cell Physiol. 2016, 57, 1069–1084. [Google Scholar] [CrossRef]
  7. Gaxiola, R.A.; Palmgren, M.G.; Schumacher, K. Plant proton pumps. FEBS Lett. 2007, 581, 2204–2214. [Google Scholar] [CrossRef] [Green Version]
  8. Bao, A.K.; Wang, S.M.; Wu, G.Q.; Xi, J.J.; Zhang, J.L.; Wang, C.M. Overexpression of the Arabidopsis H+-PPase enhanced resistance to salt and drought stress in transgenic alfalfa (Medicago sativa L.). Plant Sci. 2009, 176, 232–240. [Google Scholar] [CrossRef]
  9. Aharon, G.S.; Apse, M.P.; Duan, S.; Hua, X.; Blumwald, E. Characterization of a family of vacuolar Na+/H+ antiporters Arabidopsis thaliana. Plant Soil 2003, 253, 245–256. [Google Scholar] [CrossRef]
  10. Bassil, E.; Tajima, H.; Liang, Y.C.; Ohto, M.A.; Ushijima, K.; Nakano, R.; Esumi, T.; Coku, A.; Belmonte, M.; Blumwald, E. The Arabidopsis Na+/H+ antiporters NHX1 and NHX2 control vacuolar pH and K+ homeostasis to regulate growth, flower development, and reproduction. Plant Cell 2011, 23, 3482–3497. [Google Scholar] [CrossRef] [PubMed] [Green Version]
  11. Shi, H.; Ishitani, M.; Kim, C.; Zhu, J.K. The Arabidopsis thaliana salt tolerance gene SOS1 encodes a putative Na+/H+ antiporter. Proc. Natl. Acad. Sci. USA 2000, 97, 6896–6901. [Google Scholar] [CrossRef] [PubMed] [Green Version]
  12. Apse, M.P.; Sottosanto, J.B.; Blumwald, E. Vacuolar cation/H+ exchange, ion homeostasis, and leaf development are altered in a T-DNA insertional mutant of AtNHX1, the Arabidopsis vacuolar Na+/H+ antiporter. Plant J. 2003, 36, 229–239. [Google Scholar] [CrossRef]
  13. Ohnishi, M.; Fukada-Tanaka, S.; Hoshino, A.; Takada, J.; Inagaki, Y.; Iida, S. Characterization of a novel Na+/H+ antiporter gene InNHX2 and comparison of InNHX2 with InNHX1, which is responsible for blue flower coloration by increasing the vacuolar pH in the Japanese morning glory. Plant Cell Physiol. 2005, 46, 259–267. [Google Scholar] [CrossRef] [PubMed] [Green Version]
  14. Jiang, X.; Leidi, E.O.; Pardo, J.M. How do vacuolar NHX exchangers function in plant salt tolerance? Plant Signal. Behav. 2010, 5, 792–795. [Google Scholar] [CrossRef] [PubMed] [Green Version]
  15. Bassil, E.; Coku, A.; Blumwald, E. Cellular ion homeostasis: Emerging roles of intracellular NHX Na+/H+ antiporters in plant growth and development. J. Exp. Bot. 2012, 63, 5727–5740. [Google Scholar] [CrossRef] [PubMed] [Green Version]
  16. Huertas, R.; Rubio, L.; Cagnac, O.; García-Sánchez, M.J.; Alché-Jde, D.; Venema, K.; Fernández, J.A.; Rodríguez-Rosales, M.P. The K+/H+ antiporter LeNHX2 increases salt tolerance by improving K+ homeostasis in transgenic tomato. Plant Cell Environ. 2013, 36, 2135–2149. [Google Scholar] [CrossRef] [PubMed]
  17. Qiu, Q.S. Plant and yeast NHX antiporters: Roles in membrane trafficking. J. Integr. Plant Biol. 2012, 54, 66–72. [Google Scholar] [CrossRef]
  18. Rodríguez-Rosales, M.P.; Gálvez, F.J.; Huertas, R.; Aranda, M.N.; Baghour, M.; Cagnac, O.; Venema, K. Plant NHX cation/proton antiporters. Plant Signal. Behav. 2009, 4, 265–276. [Google Scholar] [CrossRef] [Green Version]
  19. Xiong, L.; Zhu, J.K. Molecular and genetic aspects of plant responses to osmoticstress. Plant Cell Environ. 2002, 25, 131–139. [Google Scholar] [CrossRef] [Green Version]
  20. Zhu, J.K. Regulation of ion homeostasis under salt stress. Curr. Opin. Plant Biol. 2003, 6, 441–445. [Google Scholar] [CrossRef]
  21. Adler, G.; Blumwald, E.; Bar-Zvi, D. The sugar beet gene encoding the sodium/proton exchanger 1 (BvNHX1) is regulated by a MYB transcription factor. Planta 2010, 232, 187–195. [Google Scholar] [CrossRef] [Green Version]
  22. Apse, M.P.; Aharon, G.S.; Snedden, W.A.; Blumwald, E. Salt tolerance conferred by overexpression of a vacuolar Na+/H+ antiport in Arabidopsis. Science 1999, 285, 1256–1258. [Google Scholar] [CrossRef]
  23. Zhang, H.X.; Blumwald, E. Transgenic salt-tolerant tomato plants accumulate salt in foliage but not in fruit. Nat. Biotechnol. 2001, 19, 765–768. [Google Scholar] [CrossRef] [PubMed]
  24. Long, L.; Zhao, J.R.; Guo, D.D.; Ma, X.N.; Xu, F.C.; Yang, W.W.; Gao, W. Identification of NHXs in Gossypium species and the positive role of GhNHX1 in salt tolerance. BMC Plant Biol. 2020, 20, 147. [Google Scholar] [CrossRef] [PubMed]
  25. Mushke, R.; Yarra, R.; Kirti, P.B. Improved salinity tolerance and growth performance in transgenic sunflower plants via ectopic expression of a wheat antiporter gene (TaNHX2). Mol. Biol. Rep. 2019, 46, 5941–5953. [Google Scholar] [CrossRef]
  26. Wu, X.X.; Li, J.; Wu, X.D.; Liu, Q.; Wang, Z.K.; Liu, S.S.; Li, S.N.; Ma, Y.L.; Sun, J.; Zhao, L.; et al. Ectopic expression of Arabidopsis thaliana Na+(K+)/H+ antiporter gene, AtNHX5, enhances soybean salt tolerance. Genet. Mol. Res. 2016, 15, 1–12. [Google Scholar] [CrossRef]
  27. Blackshaw, R.; Johnson, E.; Gan, Y.T.; May, W.; McAndrew, D.; Barthet, V.; McDonald, T.; Wispinski, D. Alternative oilseed crops for biodiesel feedstock on the Canadian prairies. Can. J. Plant Sci. 2001, 91, 889–896. [Google Scholar] [CrossRef]
  28. Bayer, P.E.; Hurgobin, B.; Golicz, A.A.; Chan, C.-K.K.; Yuan, Y.; Lee, H.; Renton, M.; Meng, J.; Li, R.; Zou, J.; et al. Assembly and comparison of two closely related Brassica napus genomes. Plant Biotechnol. J. 2017, 15, 1602–1610. [Google Scholar] [CrossRef] [Green Version]
  29. Chalhoub, B.; Denoeud, F.; Liu, S.; Parkin, I.A.; Tang, H.; Wang, X.; Chiquet, J.; Belcram, H.; Tong, C.; Corréa, M.; et al. Early allopolyploid evolution in the post-Neolithic Brassica napus oilseed genome. Science 2014, 345, 950–953. [Google Scholar] [CrossRef] [Green Version]
  30. Sun, F.; Fan, G.; Hu, Q.; Zhou, Y.; Guan, M.; Tong, C.; Li, J.; Du, D.; Qi, C.; Liu, W.; et al. The high-quality genome of Brassica napus cultivar ‘ZS11’ reveals the introgression history in semi-winter morphotype. Plant J. 2017, 92, 452–468. [Google Scholar] [CrossRef] [Green Version]
  31. Shokri-Gharelo, R.; Noparvar, P.M. Molecular response of canola to salt stress: Insights on tolerance mechanisms. PeerJ 2018, 6, e4822. [Google Scholar] [CrossRef] [PubMed]
  32. Xu, G.; Guo, C.; Shan, H.; Kong, H. Divergence of duplicate genes in exon-intron structure. Proc. Natl. Acad. Sci. USA 2012, 109, 1187–1192. [Google Scholar] [CrossRef] [Green Version]
  33. Schmidt, R.; Acarkan, A.; Boivin, K. Comparative structural genomics in the Brassicaceae family. Plant Physiol. Biochem. 2001, 39, 253–262. [Google Scholar] [CrossRef]
  34. Schranz, M.E.; Lysak, M.A.; Mitchell-Olds, T. The ABC’s of comparative genomics in the Brassicaceae: Building blocks of crucifer genomes. Trends Plant Sci. 2006, 11, 535–542. [Google Scholar] [CrossRef]
  35. Ding, X.; Li, J.; Pan, Y.; Zhang, Y.; Ni, L.; Wang, Y.; Zhang, X. Genome-wide identification and expression analysis of the UGlcAE gene family in tomato. Int. J. Mol. Sci. 2018, 19, 1583. [Google Scholar] [CrossRef] [Green Version]
  36. Verma, D.; Lakhanpal, N.; Singh, K. Genome-wide identification and characterization of abiotic-stress responsive SOD (superoxide dismutase) gene family in Brassica juncea and B. rapa. BMC Genom. 2019, 20, 227. [Google Scholar] [CrossRef]
  37. Yang, Y.; Guo, Y. Elucidating the molecular mechanisms mediating plant salt-stress responses. New Phytol. 2018, 217, 523–539. [Google Scholar] [CrossRef] [Green Version]
  38. Ali, A.; Maggio, A.; Bressan, R.A.; Yun, D.J. Role and functional differences of HKT1-type transporters in plants under salt stress. Int. J. Mol. Sci. 2019, 20, 1059. [Google Scholar] [CrossRef] [Green Version]
  39. Scholz-Starke, J.; Primo, C.; Yang, J.; Kandel, R.; Gaxiola, R.A.; Hirschi, K.D. Arabidopsis the flip side of the type I proton-pumping pyrophosphatase (AVP1): Using a transmembrane H gradient to synthesize pyrophosphate. J. Biol. Chem. 2019, 294, 1290–1299. [Google Scholar] [CrossRef] [Green Version]
  40. Wittkopp, P.J.; Kalay, G. Cis-regulatory elements: Molecular mechanisms and evolutionary processes underlying divergence. Nat. Rev. Genet. 2011, 13, 59–69. [Google Scholar] [CrossRef]
  41. Gao, L.; Liu, M.; Wang, M.; Shen, Q.; Guo, S. Enhanced salt tolerance under nitrate nutrition is associated with apoplast Na+ content in Canola (Brassica. napus L.) and Rice (Oryza sativa L.) Plants. Plant Cell Physiol. 2016, 57, 2323–2333. [Google Scholar] [CrossRef] [Green Version]
  42. Tang, H.; Niu, L.; Wei, J.; Chen, X.; Chen, Y. Phosphorus limitation improved salt tolerance in Maize through tissue tass density increase, osmolytes accumulation, and Na+ uptake inhibition. Front. Plant Sci. 2019, 10, 856. [Google Scholar] [CrossRef] [Green Version]
  43. Wang, J.; Zuo, K.; Wu, W.; Song, J.; Sun, X.; Lin, J.; Li, X.; Tang, K. Molecular cloning and characterization of a new Na+/H+ antiporter gene from Brassica napus. DNA Seq. 2003, 14, 351–358. [Google Scholar] [CrossRef]
  44. Chen, H.; Chen, X.; Wu, B.; Yuan, X.; Zhang, H.; Cui, X.; Liu, X. Whole-genome identification and expression analysis of K+ efflux antiporter (KEA) and Na+/H+ antiporter (NHX) families under abiotic stress in soybean. J. Integr. Agric. 2015, 14, 1171–1183. [Google Scholar] [CrossRef]
  45. Li, N.; Wang, X.; Ma, B.; Du, C.; Zheng, L.; Wang, Y. Expression of a Na+ /H+ antiporter RtNHX1 from recretohalophyte Reaumuria trigyna improved salt tolerance of transgenic Arabidopsis thaliana. J. Plant Physiol. 2017, 218, 109–120. [Google Scholar] [CrossRef]
  46. Wu, H. Plant salt tolerance and Na+ sensing and transport. Crop. J. 2018, 6, 215–225. [Google Scholar] [CrossRef]
  47. Wang, X.; Wu, J.; Liang, J.; Cheng, F.; Wang, X. Brassica database (BRAD) version 2.0: Integrating and mining Brassicaceae species genomic resources. Database (Oxf.) 2015, 2015, bav093. [Google Scholar] [CrossRef] [Green Version]
  48. Yu, J.; Zhao, M.; Wang, X.; Tong, C.; Huang, S.; Tehrim, S.; Liu, Y.; Hua, W.; Liu, S. Bolbase: A comprehensive genomics database for Brassica oleracea. BMC Genom. 2013, 14, 664. [Google Scholar] [CrossRef] [Green Version]
  49. Goodstein, D.M.; Shu, S.; Howson, R.; Neupane, R.; Hayes, R.D.; Fazo, J.; Mitros, T.; Dirks, W.; Hellsten, U.; Putnam, N.; et al. Phytozome: A comparative platform for green plant genomics. Nucleic Acids Res. 2012, 40, D1178–D1186. [Google Scholar] [CrossRef]
  50. Ostergaard, L.; King, G.J. Standardized gene nomenclature for the Brassica genus. Plant Methods 2008, 4, 10. [Google Scholar] [CrossRef] [Green Version]
  51. Li, S.; Chen, L.; Zhang, L.; Li, X.; Liu, Y.; Wu, Z.; Dong, F.; Wan, L.; Liu, K.; Hong, D.; et al. BnaC9.SMG7b functions as a positive regulator of the number of seeds per silique in Brassica napus by regulating the formation of functional female gametophytes. Plant Physiol. 2015, 169, 2744–2760. [Google Scholar] [CrossRef] [Green Version]
  52. Li, H.; Li, J.; Song, J.; Zhao, B.; Guo, C.; Wang, B.; Zhang, Q.; Wang, J.; King, G.J.; Liu, K. An auxin signaling gene BnaA3.IAA7 contributes to improved plant architecture and yield heterosis in rapeseed. New Phytol. 2019, 222, 837–851. [Google Scholar] [CrossRef]
  53. Larkin, M.A.; Blackshields, G.; Brown, N.P.; Chenna, R.; McGettigan, P.A.; McWilliam, H.; Valentin, F.; Wallace, I.M.; Wilm, A.; Lopez, R.; et al. Clustal W and Clustal X version 2.0. Bioinformatics 2007, 23, 2947–2948. [Google Scholar] [CrossRef] [Green Version]
  54. Tamura, K.; Stecher, G.; Peterson, D.; Filipski, A.; Kumar, S. MEGA6: Molecular evolutionary genetics analysis version 6.0. Mol. Biol. Evol. 2013, 30, 2725–2729. [Google Scholar] [CrossRef] [Green Version]
  55. Saitou, N.; Nei, M. The neighbor-joining method: A new method for reconstructing phylogenetic trees. Mol. Biol. Evol. 1987, 4, 406–425. [Google Scholar]
  56. Sievers, F.; Wilm, A.; Dineen, D.G.; Gibson, T.J.; Karplus, K.; Li, W.; Lopez, R.; McWilliam, H.; Remmert, M.; Söding, J.; et al. Fast, scalable generation of high-quality protein multiple sequence alignments using Clustal Omega. Mol. Syst. Biol. 2011, 7, 539. [Google Scholar] [CrossRef]
  57. Wang, D.P.; Zhang, Y.B.; Zhang, Z.; Zhu, J.; Yu, J. KaKs_Calculator 2.0: A toolkit incorporating gamma-series methods and sliding window strategies. Genom. Proteom. Bioinform. 2010, 8, 77–80. [Google Scholar] [CrossRef] [Green Version]
  58. Yang, Z.; Nielsen, R. Estimating synonymous and nonsynonymous substitution rates under realistic evolutionary models. Mol. Biol. Evol. 2000, 17, 32–43. [Google Scholar] [CrossRef] [Green Version]
  59. Blanc, G.; Wolfe, K.H. Widespread paleopolyploidy in model plant species inferred from age distributions of duplicate genes. Plant Cell 2004, 16, 1667–1678. [Google Scholar] [CrossRef] [Green Version]
  60. Gasteiger, E.; Hoogland, C.; Gattiker, A.; Duvaud, S.; Wilkins, M.R.; Appel, R.D.; Bairoch, A. Protein identification and analysis tools on the ExPASy server. In The Proteomics Protocols Handbook; Walker, J.M., Ed.; Humana Press: Totowa, NJ, USA, 2005; pp. 571–607. [Google Scholar]
  61. Guruprasad, K.; Reddy, B.V.; Pandit, M.W. Correlation between stability of a protein and its dipeptide composition: A novel approach for predicting in vivo stability of a protein from its primary sequence. Protein Eng. 1990, 4, 155–161. [Google Scholar] [CrossRef]
  62. Hamburger, D.; Horton, P.; Park, K.J.; Obayashi, T.; Fujita, N.; Harada, H.; Adams-Collier, C.J. WoLF PSORT: Protein localization predictor. Nucleic Acids Res. 2007, 35, W585–W587. [Google Scholar]
  63. Blom, N.; Sicheritz-Pontén, T.; Gupta, R.; Gammeltoft, S.; Brunak, S. Prediction of post-translational glycosylation and phosphorylation of proteins from the amino acid sequence. Proteomics 2004, 4, 1633–1649. [Google Scholar] [CrossRef] [PubMed]
  64. Petersen, T.N.; Brunak, S.; Von Heijne, G.; Nielsen, H. SignalP 4.0: Discriminating signal peptides from transmembrane regions. Nat. Methods 2011, 8, 785–786. [Google Scholar] [CrossRef]
  65. Harrison, R.G.; Bagajewicz, M.J. Predicting the solubility of recombinant proteins in Escherichia coli. Methods Mol. Biol. 2015, 1258, 403–408. [Google Scholar]
  66. Szklarczyk, D.; Gable, A.L.; Lyon, D.; Junge, A.; Wyder, S.; Huerta-Cepas, J.; Simonovic, M.; Doncheva, N.T.; Morris, J.H.; Bork, P.; et al. STRING v11: Protein-protein association networks with increased coverage, supporting functional discovery in genome-wide experimental datasets. Nucleic Acids Res. 2019, 47, D607–D613. [Google Scholar] [CrossRef] [Green Version]
  67. Kelley, L.A.; Mezulis, S.; Yates, C.M.; Wass, M.N.; Sternberg, M.J. The Phyre2 web portal for protein modeling, prediction and analysis. Nat. Protoc. 2015, 10, 845–858. [Google Scholar] [CrossRef] [Green Version]
  68. Bailey, T.L.; Boden, M.; Buske, F.A.; Frith, M.; Grant, C.E.; Clementi, L.; Ren, J.; Li, W.W.; Noble, W.S. MEME SUITE: Tools for motif discovery and searching. Nucleic Acids Res. 2009, 37, W202–W208. [Google Scholar] [CrossRef]
  69. Crooks, G.E.; Hon, G.; Chandonia, J.M.; Brenner, S.E. WebLogo: A sequence logo generator. Genome Res. 2004, 14, 1188–1190. [Google Scholar] [CrossRef] [Green Version]
  70. Higo, K.; Ugawa, Y.; Iwamoto, M.; Korenaga, T. Plant cis-acting regulatory DNA elements (PLACE) database: 1999. Nucleic Acids Res. 1999, 27, 297–300. [Google Scholar] [CrossRef] [Green Version]
  71. Winter, D.; Vinegar, B.; Nahal, H.; Ammar, R.; Wilson, G.V.; Provart, N.J. An “Electronic Fluorescent Pictograph” browser for exploring and analyzing large-scale biological data sets. PLoS ONE 2007, 2, e718. [Google Scholar] [CrossRef]
  72. Hua, Y.P.; Zhou, T.; Song, H.X.; Guan, C.Y.; Zhang, Z.H. Integrated genomic and transcriptomic insights into the two-component high-affinity nitrate transporters in allotetraploid rapeseed. Plant Soil 2018, 427, 245–268. [Google Scholar] [CrossRef]
  73. Maillard, A.; Etienne, P.; Diquélou, S.; Trouverie, J.; Billard, V.; Yvin, J.C.; Ourry, A. Nutrient deficiencies in Brassica napus modify the ionomic composition of plant tissues: A focus on cross-talk between molybdenum and other nutrients. J. Exp. Bot. 2016, 67, 5631–5641. [Google Scholar] [CrossRef] [PubMed] [Green Version]
  74. Yang, H.; Liu, J.; Huang, S.; Guo, T.; Deng, L.; Hua, W. Selection and evaluation of novel reference genes for quantitative reverse transcription PCR (qRT-PCR) based on genome and transcriptome data in Brassica napus L. Gene 2014, 538, 113–122. [Google Scholar] [CrossRef] [PubMed]
  75. Livak, K.J.; Schmittgen, T.D. Analysis of relative gene expression data using real-time quantitative PCR and the 2−ΔΔCT method. Methods 2001, 25, 402–408. [Google Scholar] [CrossRef] [PubMed]
Figure 1. Copy number of the Na+/H+ antiporter (NHX) family members in plant species. (A) Comparison of the total gene number of the NHX family in plant species. The correlation refers to the relationship between the NHX family gene numbers and plant genome sizes. ns: not significant. (B) Each NHX subgroup member number in Arabidopsis and three Brassica crops (Brassica rapa, Brassica oleracea, and Brassica napus).
Ijms 21 03429 g001
Figure 2. Physical mapping of the Na+/H+ antiporter (NHX) family members in Arabidopsis thaliana and Brassica napus. (AB) Genomic distribution of the Arabidopsis NHXs (A) and their homologs in B. napus (B).
Ijms 21 03429 g002
Figure 3. Phylogeny analysis of the Na+/H+ antiporters (NHXs) in Arabidopsis thaliana and Brassica napus. (AB) Phylogeny analysis of AtNHXs (A) and the NHX homologs in B. napus (B). The NHX protein sequences were multi-aligned using the ClustalW program, and then an unrooted phylogenetic tree was constructed using the software MEGA 6.06 with the neighbor-joining method. The percentages of replicate trees, in which the associated taxa clustered together in the bootstrap test (1000 replicates), are shown next to the branches. The tree is drawn to scale, with branch lengths in the same units as those of the evolutionary distances used to infer the phylogenetic tree. The evolutionary distances were computed with the Poisson correction method and are in the units of the number of amino acid substitutions per site.
Ijms 21 03429 g003
Figure 4. Identification and characterization of the conserved motifs in the Na+/H+ antiporters (NHXs) in Arabidopsis thaliana and Brassica napus. Molecular identification (A) and sequence characterization (B) of the conserved motifs in the NHXs. In Figure 4A, the boxes with different colors indicate different conserved motifs (motif I–XV), and grey lines represent the NHX regions without detected motifs. In Figure 4B, the larger the fonts, the more conserved the motifs.
Ijms 21 03429 g004
Figure 5. Protein–protein interaction networks involving the Na+/H+ antiporters (NHXs). The interaction networks of NHX1 (A), NHX2 (B), NHX3 (C), NHX4 (D), NHX5 (E), NHX6 (F), SOS1/NHX7 (G) and NHX8 (H) with other proteins were constructed by the STRING web-server. Network nodes represent proteins. Network is clustered to three clusters, which are represented with red, green and blue nodes, respectively. Colored nodes: query proteins and first shell of protein interactors; white nodes: second shell of protein interactors. Empty nodes: proteins of unknown 3D structure; filled nodes: some 3D structure is known or predicted. Edges represent protein–protein associations.
Ijms 21 03429 g005aIjms 21 03429 g005b
Figure 6. Enrichment analysis of the cis-acting regulatory elements (CREs) in the gene promoter regions of Na+/H+ antiporters (NHXs) in Brassica napus. Enrichment analysis of the CREs in the promoter regions of NHX1s (A), NHX2s (B), NHX3s (C), NHX4s (D), AtNHX5 (E), NHX6s (F), NHX7s/SOS1s (G), and NHX8s (H). In the scatter plot, the larger the circle size, the more the corresponding CREs.
Ijms 21 03429 g006
Figure 7. The qRT-PCR assisted transcriptional characterization of the Na+/H+ antiporters (NHXs) in Brassica napus under salt stress. (AD) Differential expression profiling of: BnaNHX1s (A), BnaNHX2s (B), BnaNHX3s (C), and BnaNHX4s (D) between the control (Ctrl) and salt stress. (E) The gene co-expression network diagram involving BnaNHX1s, BnaNHX2s, BnaNHX3s, and BnaNHX4s. (FH) Differential expression profiling of BnaNHX6s (F), BnaSOS1s/BnaNHX7s (G), and BnaNHX8s (H) under salt stress. For the transcriptional analysis, the 7 d-old uniform B. napus seedlings after seed germination were hydroponically cultivated in a NaCl-free solution for 10 d, and then were transferred to 200 mM NaCl for 12 h until sampling. The shoots and roots were individually sampled, and each sample includes three independent biological replicates. The significance level of p < 0.05 is used as the threshold to identify the differential BnaNHX expression under salt stress. The differentially expressed genes with higher expression are indicated with asterisks.
Ijms 21 03429 g007
Figure 8. The qRT-PCR-assisted transcriptional characterization of the Na+/H+ antiporters (NHXs) in Brassica napus under different forms of nitrogen (N) conditions. Differential expression of BnaNHX1s (A), BnaNHX2s (B), BnaNHX3s (C), BnaNHX4s (D), BnaNHX6s (E), BnaNHX7s (F), and BnaNHX8s (G) under nitrate (NO3-) and ammonium (NH4+) conditions. For the transcriptional analysis, the rapeseed seedlings were first hydroponically cultivated under 6.0 mM nitrate (NO3-) for 10 d, and then were transferred to an N-free solution for 3 d. Subsequently, the above seedlings were sampled after treatment with 6.0 mM ammonium (NH4+) for 3 d. The shoots and roots were individually sampled, and each sample includes three independent biological replicates. The significance level of p < 0.05 is used as the threshold to identify the differential BnaNHX expression under NO3- and NH4+ conditions. The differentially expressed genes with higher expression between different treatments are indicated with asterisks.
Ijms 21 03429 g008
Figure 9. The qRT-PCR-assisted transcriptional characterization of the Na+/H+ antiporters (NHXs) in Brassica napus under different phosphate (Pi) levels. Differential expression of BnaNHX1s (A), BnaNHX2s (B), BnaNHX4s (C), BnaNHX6s (D), BnaNHX7s (E), and BnaNHX8s (F) under high Pi and low Pi levels. For the transcriptional analysis, the 7 d-old uniform B. napus seedlings after seed germination were first hydroponically grown under 250 μM KH2PO4 (+Pi) for 10 d, and then were transferred to 5 μM KH2PO4 (-Pi) for 3 d until sampling. The shoots and roots were individually sampled, and each sample includes three independent biological replicates. The significance level of P < 0.05 is used as the threshold to identify the differential expression of BnaNHXs under high Pi and low Pi conditions. The differentially expressed genes with higher expression are indicated with asterisks.
Ijms 21 03429 g009
Figure 10. Venn diagrams summarizing the transcriptional responses of the Na+/H+ antiporters (NHXs) in Brassica napus under diverse nutrient stresses. (A,B) Upregulated (A) and downregulated (B) BnaNHXs in the rapeseed plants under different nutrient conditions. The differentially expressed genes between different nutrient treatments were listed in the brackets. Up, upregulation; Dw, downregulation.
Ijms 21 03429 g010
Table 1. Copy number of the Na+/H+ antiporter (NHX) genes in Arabidopsis and Brassica crops.
Gene
Name
Arabidopsis thaliana
(125 Mb)
Brassica rapa
(465 Mb)
Brassica oleracea
(485 Mb)
Brassica napus
(1130 Mb)
NHX11224
NHX21112
NHX31112
NHX41112
NHX51000
NHX61114
SOS1/NHX71112
NHX81112
Total88818
Table 2. Molecular characterization of the Na+/H+ antiporters (NHXs) in Arabidopsis thaliana and Brassica napus.
Gene IDGene NameBlockCDS (bp)Exon/
Intron
Amino Acid
(aa)
KaKsKa/KsDivergent Time
(Mya)
At5g27150AtNHX1Q161713/12538
BnaA09g03600DBnaA9.NHX1Q159613/125310.03570.45430.078713.10
BnaC02g39630DBnaC2.NHX1aQ163513/125440.03380.38030.08913.29
BnaC02g39600DBnaC2.NHX1bQ163513/125440.03660.40480.090313.48
BnaC09g02990DBnaC9.NHX1Q160813/125350.04230.49960.084812.49
At3g05030AtNHX2F164114/13546
BnaA05g32130DBnaA5.NHX2F164114/135460.03810.40290.094615.69
BnaC05g46790DBnaC5.NHX2F165014/135490.03570.46970.07616.76
At5g55470AtNHX3W159014/13529
BnaA10g09580DBnaA10.NHX3W159014/135290.0440.37380.117815.59
BnaC09g31970DBnaC9.NHX3W160214/135330.04820.38070.126515.96
At3g06370AtNHX4F151213/12503
BnaA05g30980DBnaA5.NHX4F167713/125580.07510.48010.156413.15
BnaC05g45460DBnaC5.NHX4F168313/125600.07280.4760.152912.88
At1g54370AtNHX5C156621/20521
At1g79610AtNHX6E160822/21535
BnaA07g20250DBnaA7.NHX6aE167421/205570.04490.38250.117418.26
BnaA07g35030DBnaA7. NHX6bE193522/216440.0370.36760.100715.22
BnaC06g19720DBnaC6. NHX6aE167421/205570.04390.3840.114417.99
BnaC06g39970DBnaC6. NHX6bE175224/235830.04720.39610.119114.56
At2g01980AtSOS1K344123/221146
BnaA09g18880DBnaA9.SOS1K342023/2211390.08640.36560.236416.55
BnaC09g52290DBnaC9.SOS1K342023/2211390.09090.37560.24218.16
At1g14660AtNHX8A227120/19756
BnaA06g09480DBnaA6.NHX8A223219/187430.08370.25420.329111.81
BnaC05g10850DBnaC5.NHX8A159914/135320.08010.28140.284717.52
Note: CDS, coding sequence; Ka, non-synonymous nucleotide substitution rate; Ks, synonymous nucleotide substitution rate.
Table 3. Molecular characterization of the Na+/H+ antiporters (NHXs) in Arabidopsis thaliana and Brassica napus.
Gene IDGene NamepIMW
(kDa)
IIGRAVYTM DomainsSubcellular Localization
At5g27150AtNHX16.7359.532.710.45812Vac
BnaA09g03600DBnaA9.NHX17.7658.935.140.454312Vac
BnaC02g39630DBnaC2.NHX1a7.5060.334.950.380312Vac
BnaC02g39600DBnaC2.NHX1b7.5060.434.890.404812Vac
BnaC09g02990DBnaC9.NHX17.5059.334.440.499612Vac
At3g05030AtNHX28.1460.536.740.46512Vac
BnaA05g32130DBnaA5.NHX27.4760.638.240.402912Vac
BnaC05g46790DBnaC5.NHX27.4961.037.620.469711Vac
At5g55470AtNHX38.1758.932.120.48511Vac
BnaA10g09580DBnaA10.NHX37.0959.034.000.373811Vac
BnaC09g31970DBnaC9.NHX37.0758.734.110.380711Vac
At3g06370AtNHX46.9255.639.490.59410Vac
BnaA05g30980DBnaA5.NHX47.0761.838.630.480112Vac
BnaC05g45460DBnaC5.NHX47.0762.239.760.47612Vac
At1g54370AtNHX54.9857.342.990.44410Endo
At1g79610AtNHX65.6859.340.300.3779Endo
BnaA07g20250DBnaA7.NHX6a5.6262.341.650.382510Endo
BnaA07g35030DBnaA7.NHX6b6.6872.439.360.367612Endo
BnaC06g19720DBnaC6.NHX6a5.8362.442.950.38410Endo
BnaC06g39970DBnaC6.NHX6b6.9165.538.430.396110Endo
At2g01980AtSOS17.62127.238.600.0989PM
BnaA09g18880DBnaA9.SOS17.02125.834.990.365612PM
BnaC09g52290DBnaC9.SOS17.00125.835.070.375612PM
At1g14660AtNHX86.5883.526.660.27312PM
BnaA06g09480DBnaA6.NHX87.5360.024.530.25428PM
BnaC05g10850DBnaC5.NHX87.3482.526.000.28149PM
Note: GRAVY, grand average of hydropathy; II, instability index; MW, molecular weight; pI, isoelectric point; PM, plasma membrane; TM, transmembrane; Vac, vacuole; Endo, endosome.

