Brain Protease Activated Receptor 1 Pathway: A Therapeutic Target in the Superoxide Dismutase 1 (SOD1) Mouse Model of Amyotrophic Lateral Sclerosis

 , , ,
, , ,
Abstract

1. Introduction
2. Results
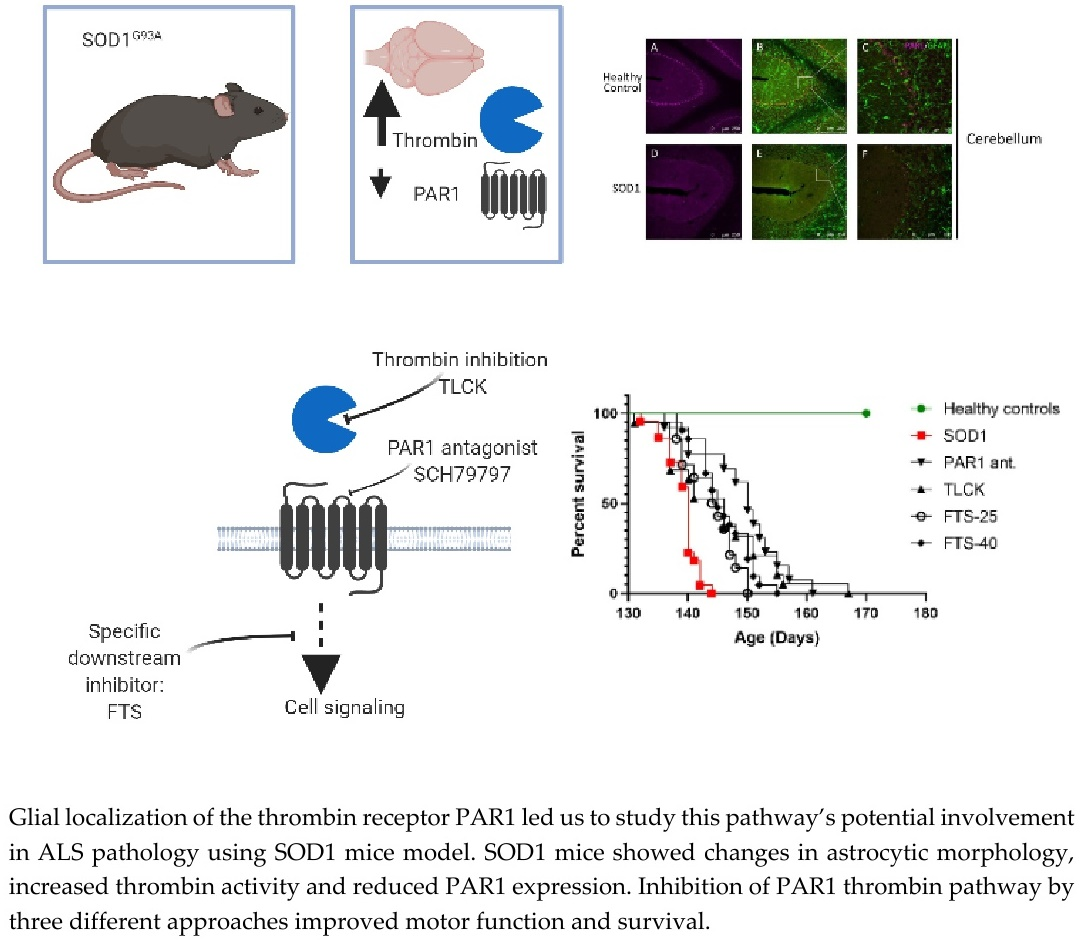
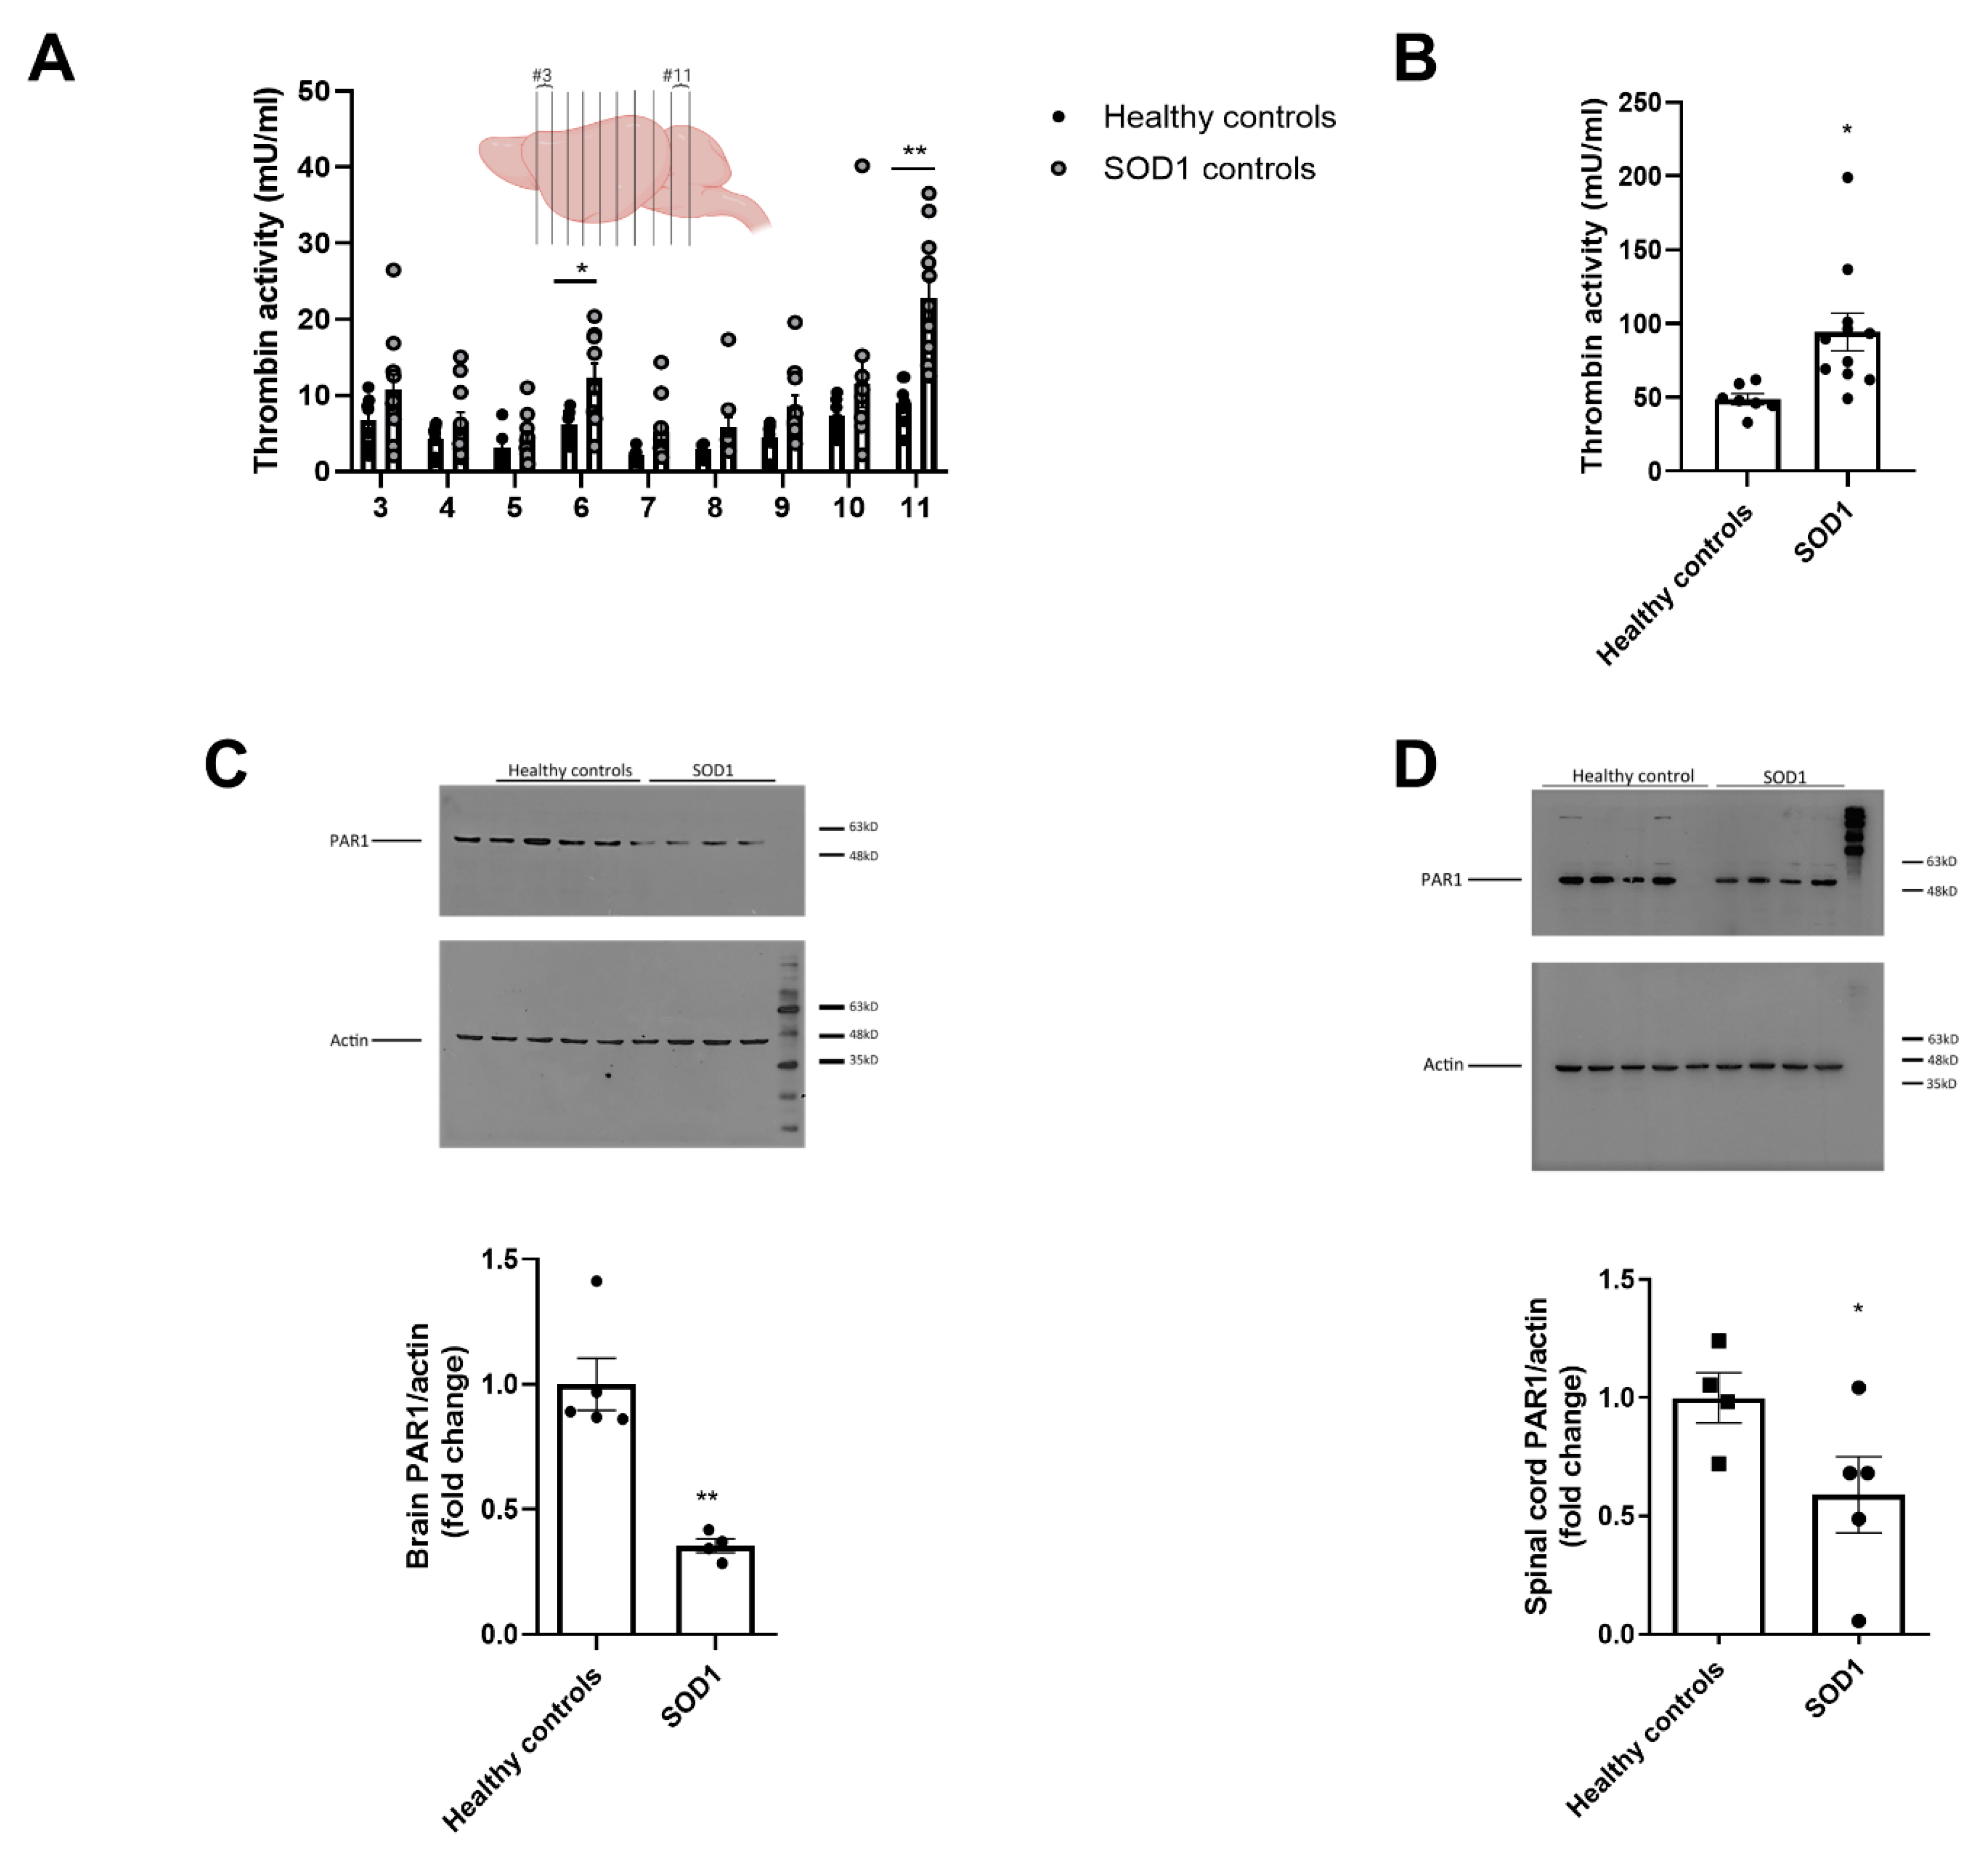
2.1. Increased Thrombin Activity and Decreased PAR1 Levels in Brain and Spinal Cord of SOD1 Mice
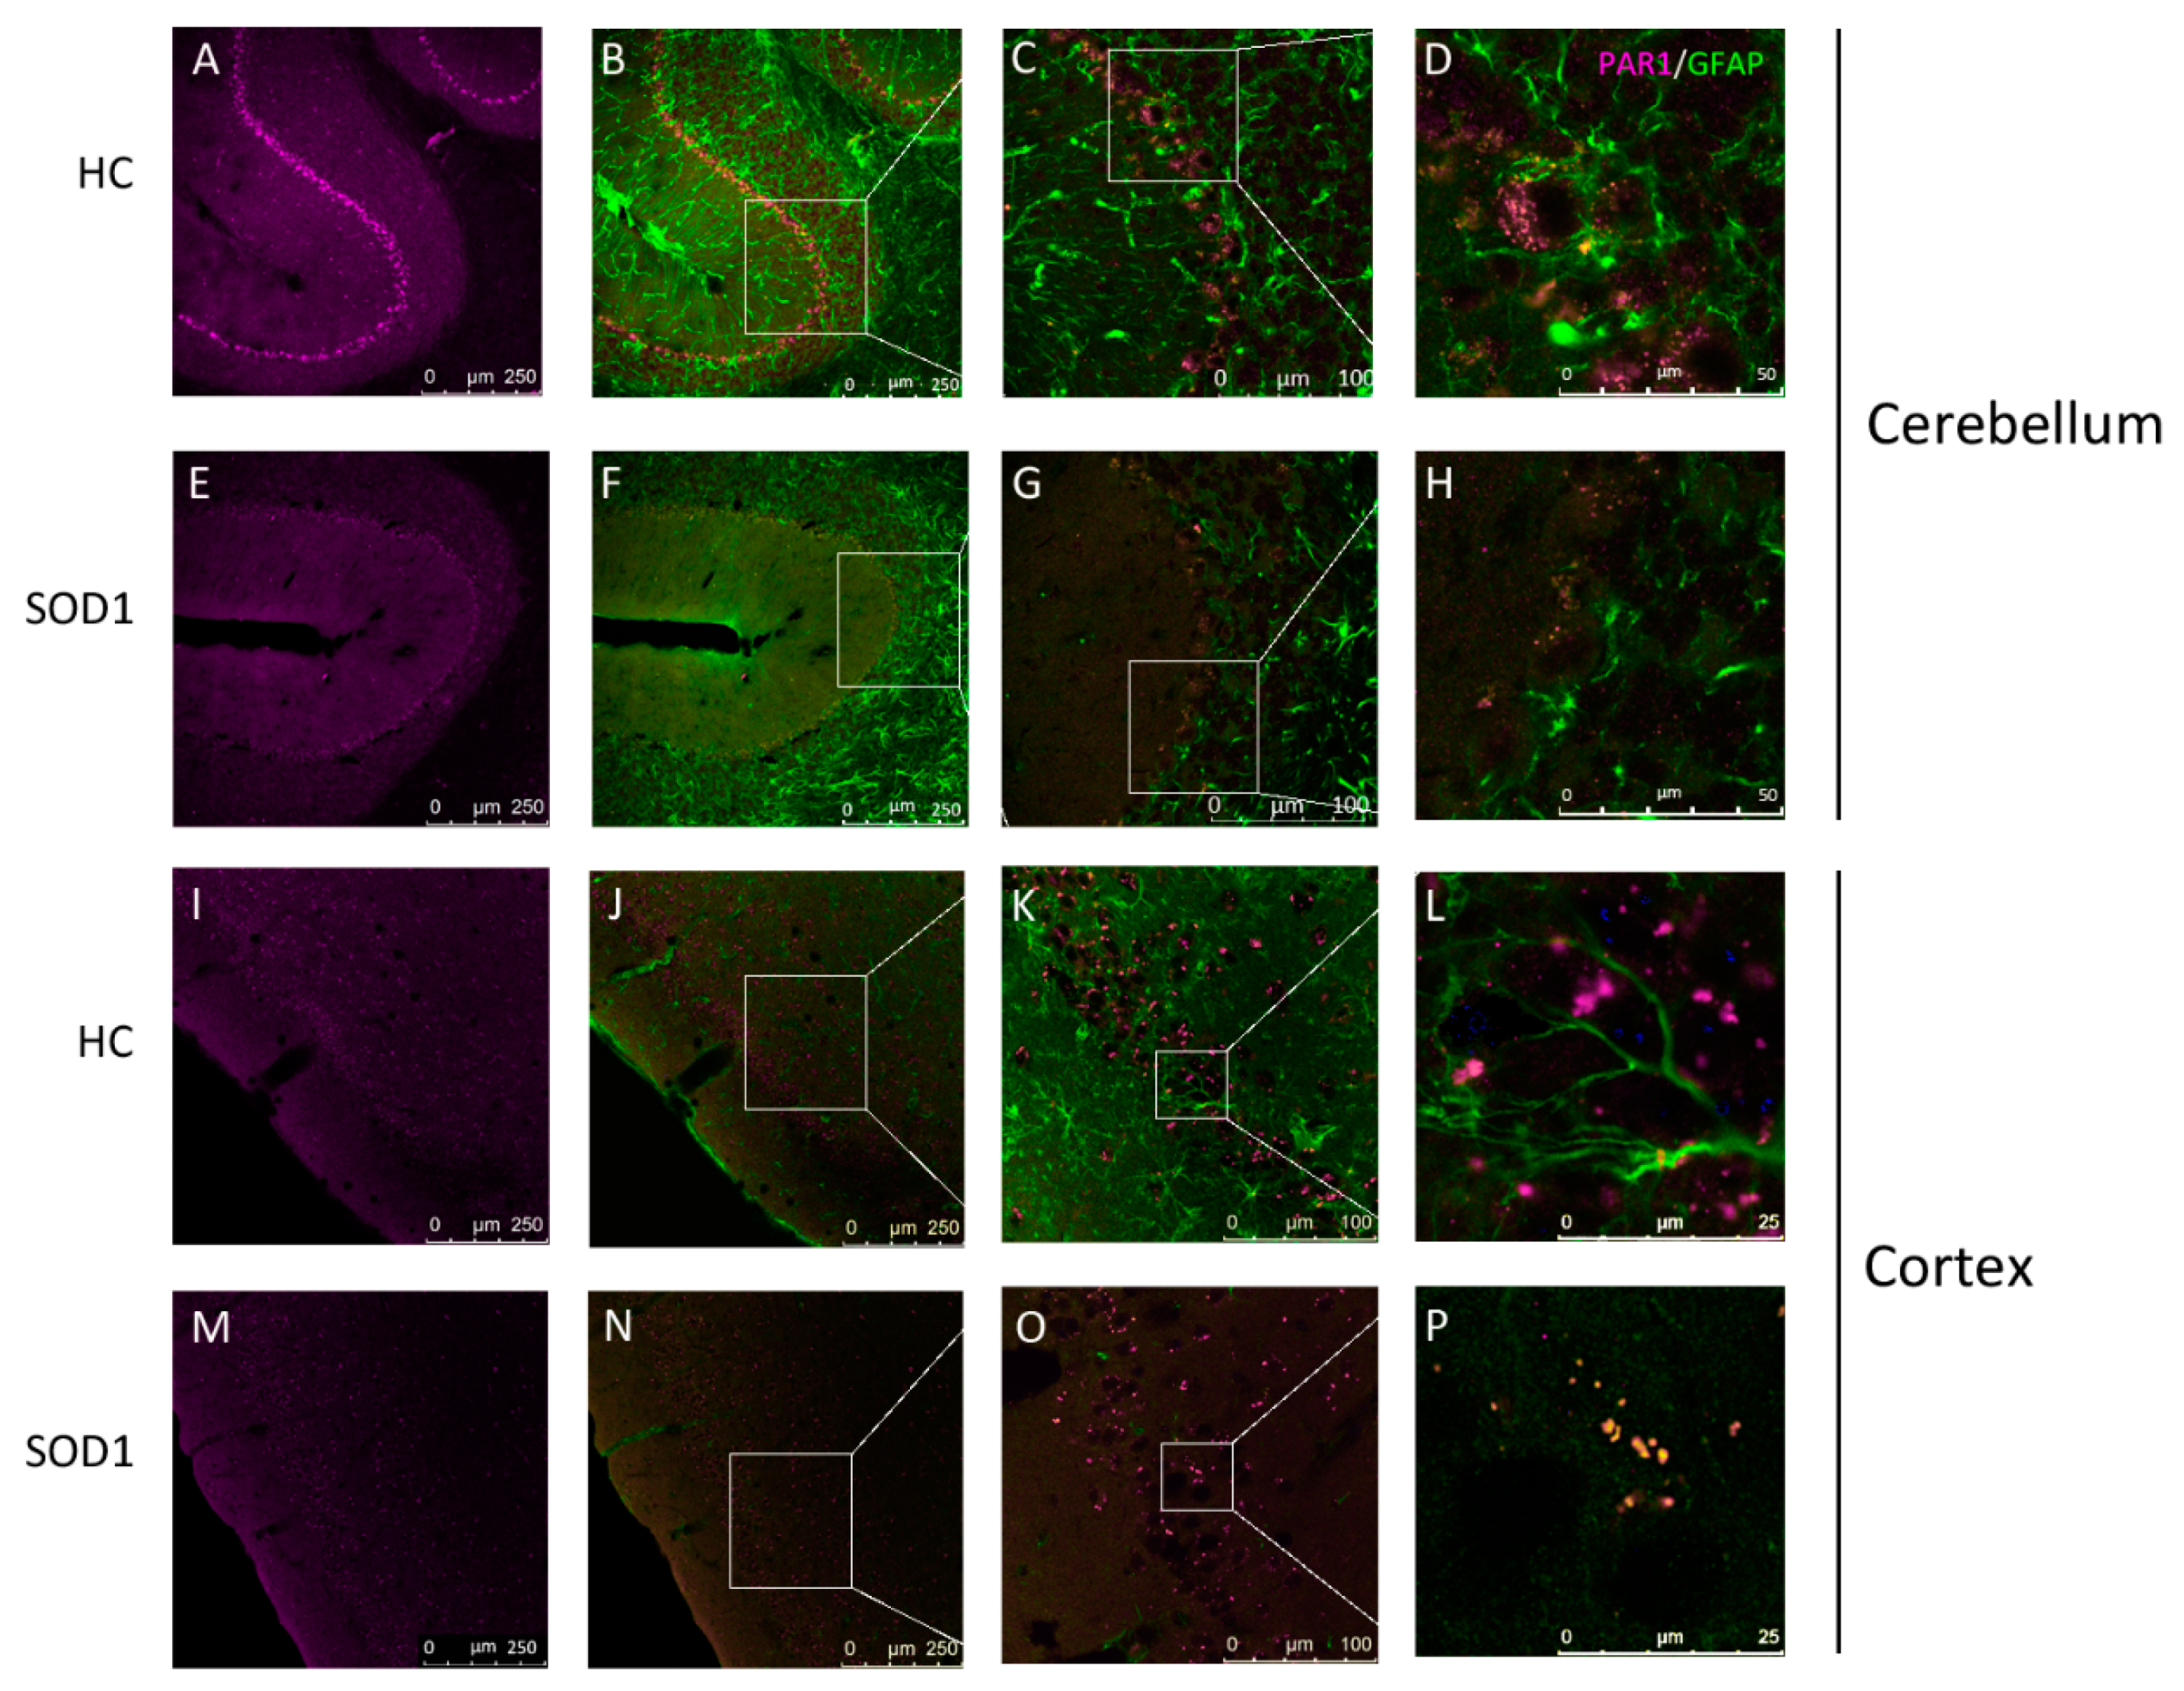
2.2. PAR1 Immunostaining in Cerebellum and Cortex
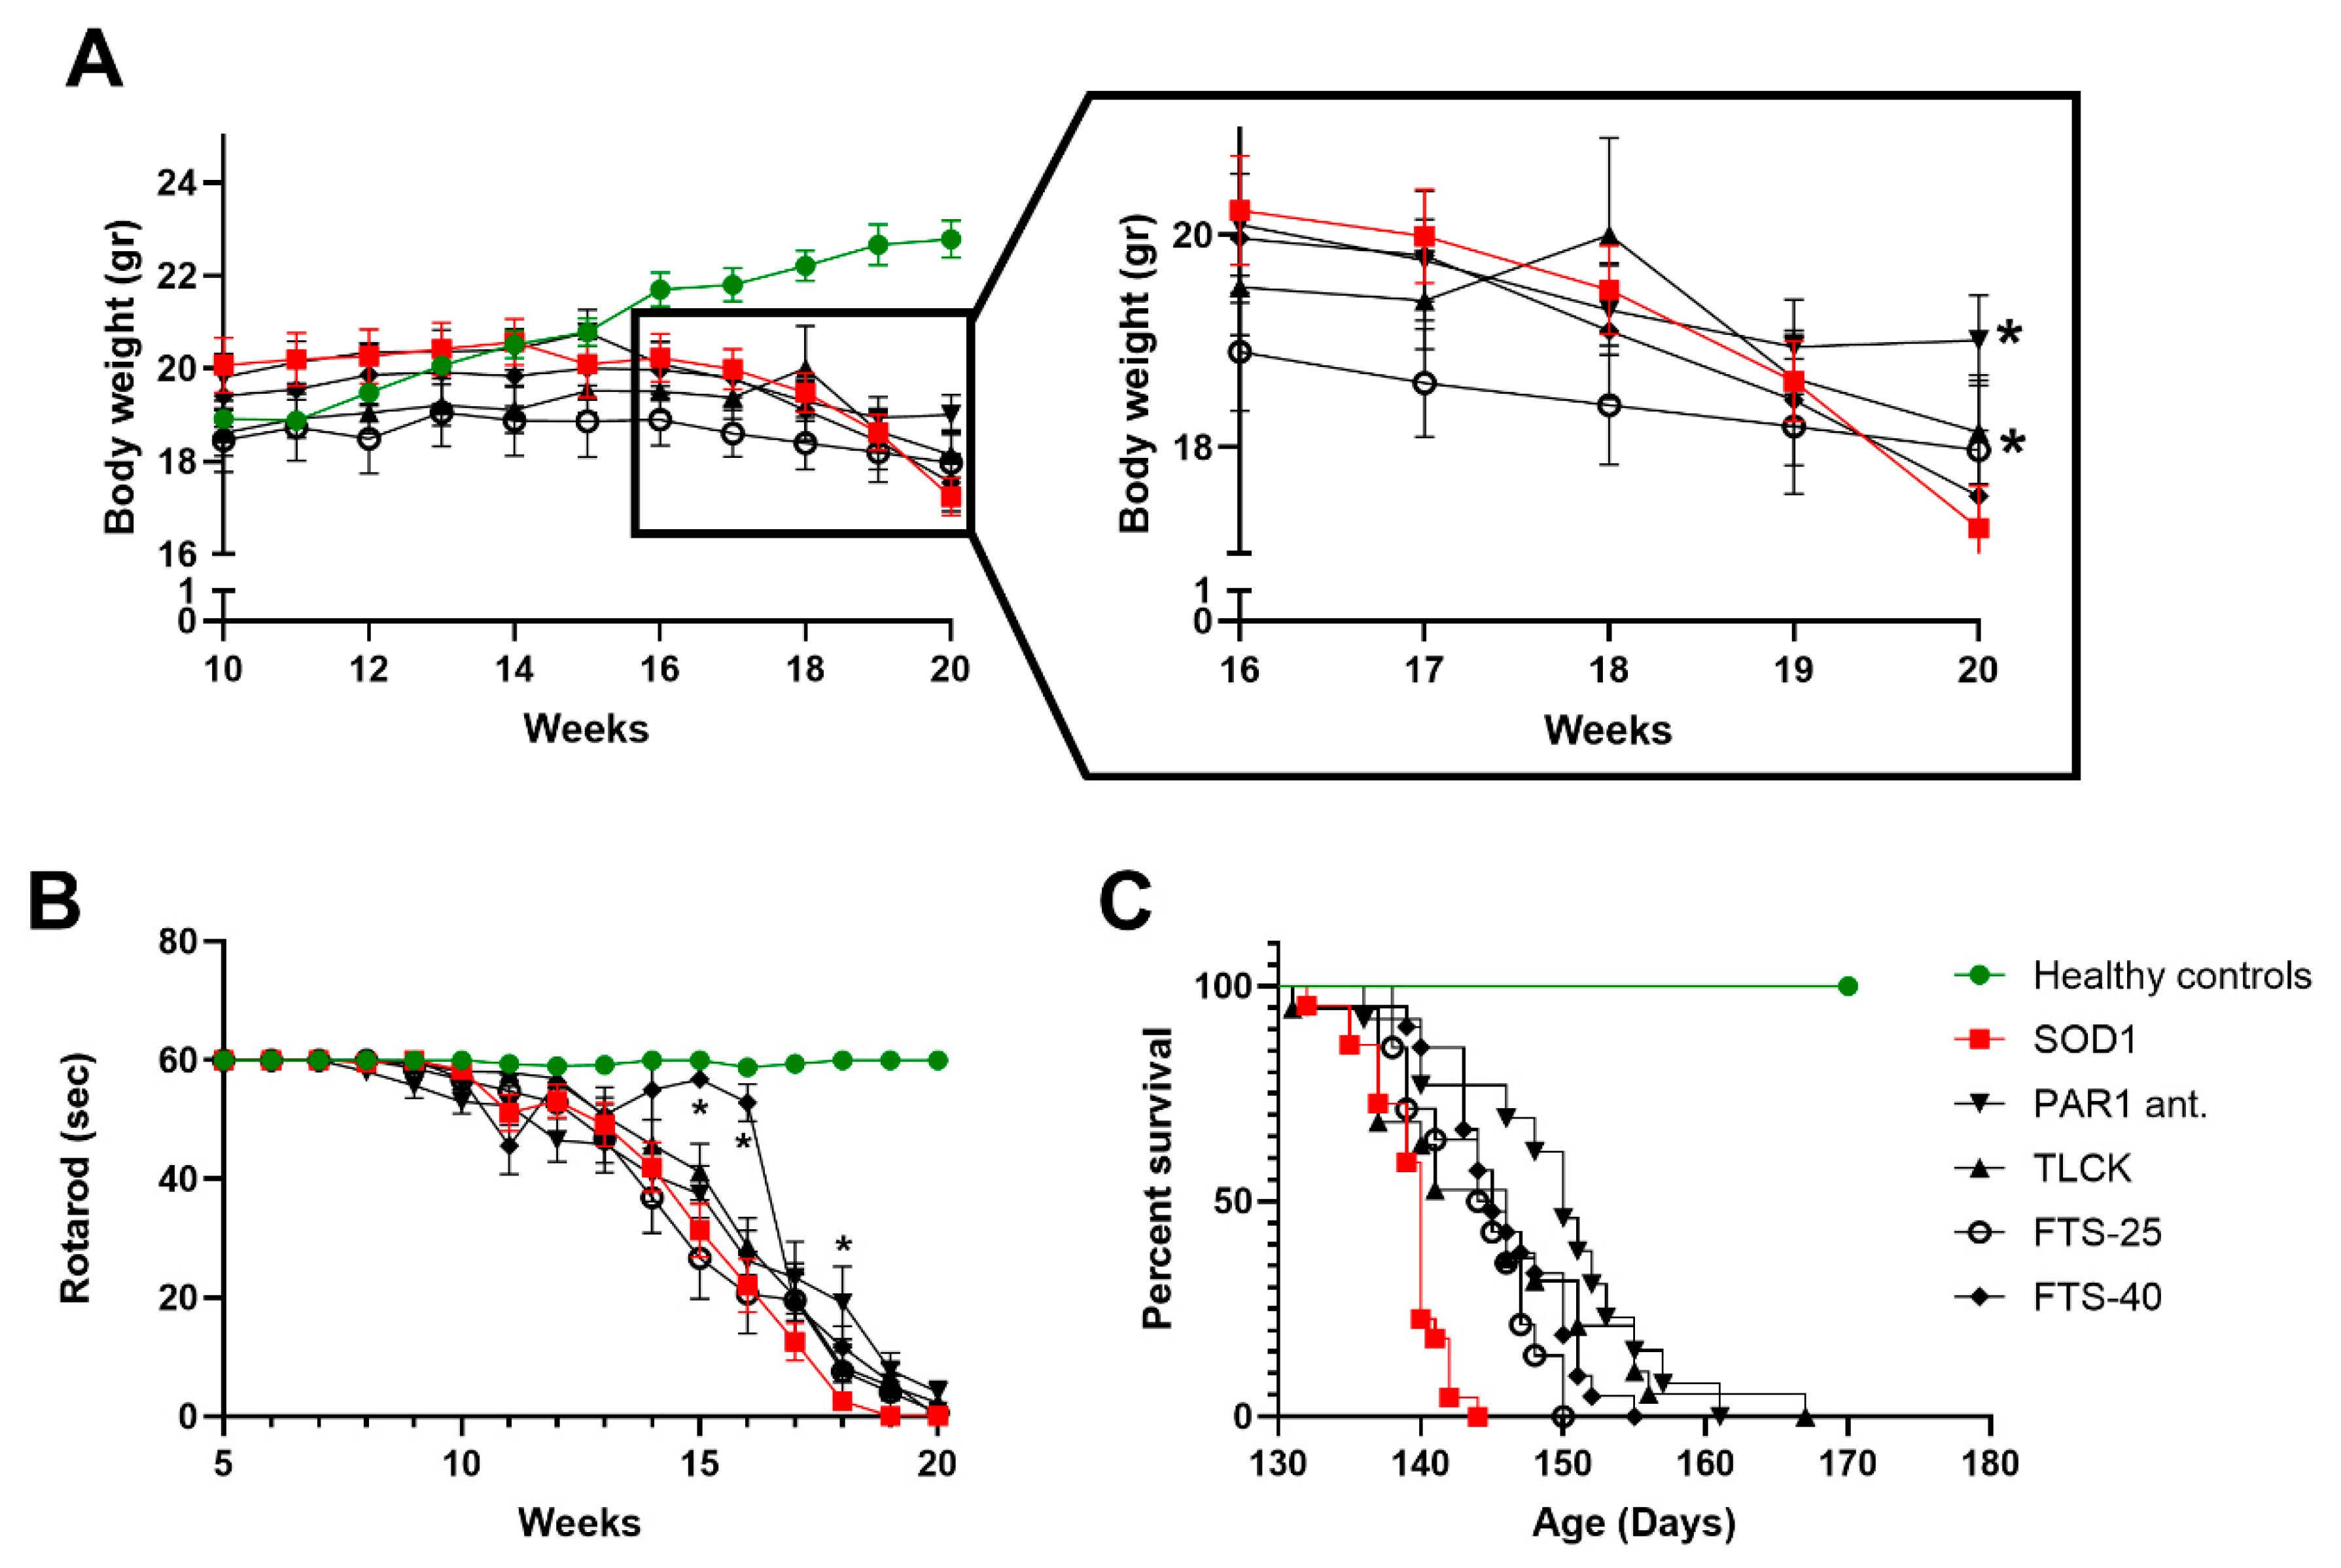
2.3. Weight Loss, Rotarod Test and Survival
2.4. Treatments Effects on Body Weight, Rotarod and Survival
3. Discussion
4. Materials and Methods
4.1. Animals
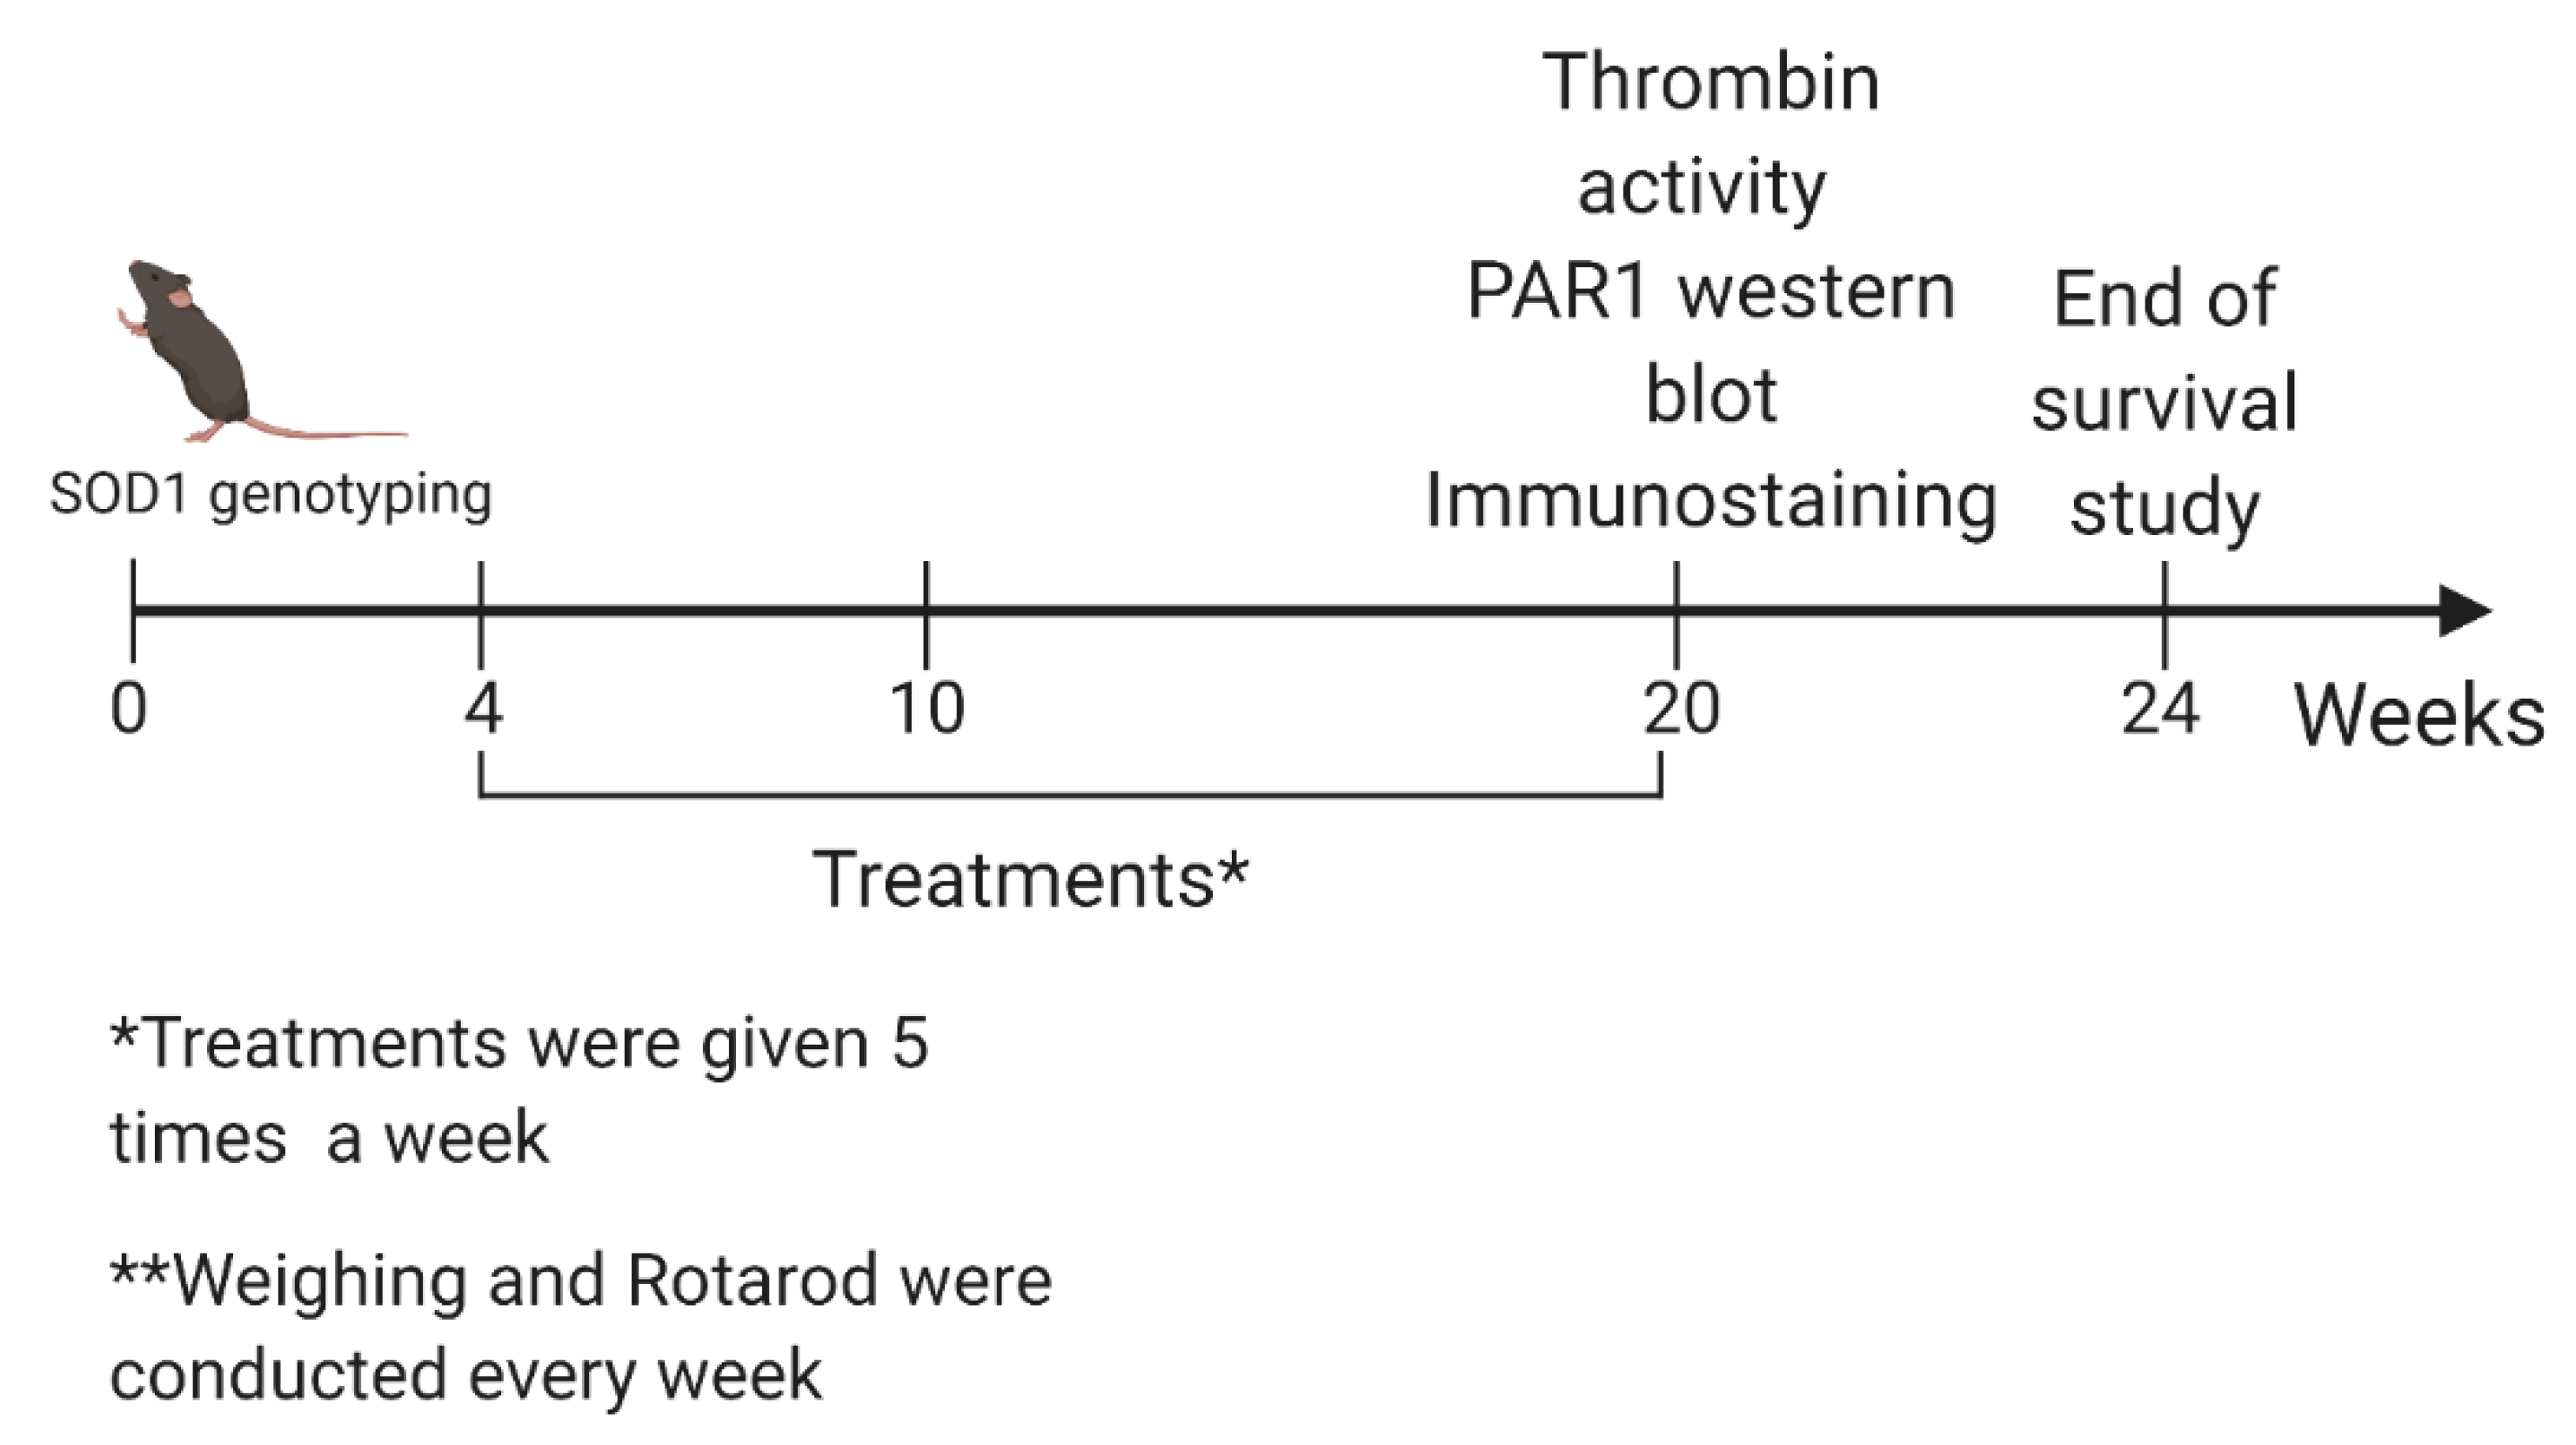
4.2. Study Design
4.3. Thrombin Activity
4.4. PAR1 Quantification in Mice Brains and Spinal Cords
4.5. PAR1 Localization in Mice Brain Slices
4.6. Motor Performance
4.7. Pharmacological Interventions
4.8. Statistics
Author Contributions
Funding
Acknowledgments
Conflicts of Interest
References
- Al-Chalabi, A.; Hardiman, O.; Kiernan, M.C.; Chiò, A.; Rix-Brooks, B.; van den Berg, L.H. Amyotrophic lateral sclerosis: Moving towards a new classification system. Lancet Neurol. 2016, 15, 1182–1194. [Google Scholar] [CrossRef]
- Rowland, L.P. Diagnosis of amyotrophic lateral sclerosis. J. Neurol. Sci. 1998, 160, S6–S24. [Google Scholar] [CrossRef]
- Frakes, A.E.; Ferraiuolo, L.; Haidet-Phillips, A.M.; Schmelzer, L.; Braun, L.; Miranda, C.J.; Ladner, K.J.; Bevan, A.K.; Foust, K.D.; Godbout, J.P.; et al. Microglia Induce Motor Neuron Death via the Classical NF-κB Pathway in Amyotrophic Lateral Sclerosis. Neuron 2014, 81, 1009–1023. [Google Scholar] [CrossRef]
- Philips, T.; Rothstein, J.D. Glial cells in amyotrophic lateral sclerosis. Exp. Neurol. 2014, 262, 111–120. [Google Scholar] [CrossRef]
- Miller, R.G.; Mitchell, J.D.; Moore, D.H. Riluzole for amyotrophic lateral sclerosis (ALS)/motor neuron disease (MND). Cochrane Database Syst. Rev. 2012. [Google Scholar] [CrossRef]
- Couratier, P.; Corcia, P.; Lautrette, G.; Nicol, M.; Preux, P.M.; Marin, B. Epidemiology of amyotrophic lateral sclerosis: A review of literature. Rev. Neurol. (Paris) 2016, 172, 37–45. [Google Scholar] [CrossRef]
- Zou, Z.Y.; Zhou, Z.R.; Che, C.H.; Liu, C.Y.; He, R.L.; Huang, H.P. Genetic epidemiology of amyotrophic lateral sclerosis: A systematic review and meta-analysis. J. Neurol. Neurosurg. Psychiatry 2017, 88, 540–549. [Google Scholar] [CrossRef] [PubMed]
- Rosen, D.R.; Siddique, T.; Patterson, D.; Figlewicz, D.A.; Sapp, P.; Hentati, A.; Donaldson, D.; Goto, J.; O’Regan, J.P.; Deng, H.-X.; et al. Mutations in Cu/Zn superoxide dismutase gene are associated with familial amyotrophic lateral sclerosis. Nature 1993, 362, 59–62. [Google Scholar] [CrossRef]
- Ripps, M.E.; Huntley, G.W.; Hof, P.R.; Morrison, J.H.; Gordon, J.W. Transgenic mice expressing an altered murine superoxide dismutase gene provide an animal model of amyotrophic lateral sclerosis. Proc. Natl. Acad. Sci. USA 1995, 92, 689–693. [Google Scholar] [CrossRef] [PubMed]
- Hilton, J.B.; Mercer, S.W.; Lim, N.K.H.; Faux, N.G.; Buncic, G.; Beckman, J.S.; Roberts, B.R.; Donnelly, P.S.; White, A.R.; Crouch, P.J. CuII (atsm) improves the neurological phenotype and survival of SOD1G93A mice and selectively increases enzymatically active SOD1 in the spinal cord. Sci. Rep. 2017, 7, 42292. [Google Scholar] [CrossRef] [PubMed]
- Hayashi, Y.; Homma, K.; Ichijo, H. SOD1 in neurotoxicity and its controversial roles in SOD1 mutation-negative ALS. Adv. Biol. Regul. 2016, 60, 95–104. [Google Scholar] [CrossRef] [PubMed]
- Alshikho, M.J.; Zürcher, N.R.; Loggia, M.L.; Cernasov, P.; Chonde, D.B.; Izquierdo Garcia, D.; Yasek, J.E.; Akeju, O.; Catana, C.; Rosen, B.R.; et al. Glial activation colocalizes with structural abnormalities in amyotrophic lateral sclerosis. Neurology 2016, 87, 2554–2561. [Google Scholar] [CrossRef]
- Bilsland, L.G.; Nirmalananthan, N.; Yip, J.; Greensmith, L.; Duchen, M.R. Expression of mutant SOD1G93A in astrocytes induces functional deficits in motoneuron mitochondria. J. Neurochem. 2008, 107, 1271–1283. [Google Scholar] [CrossRef]
- Haidet-Phillips, A.M.; Hester, M.E.; Miranda, C.J.; Meyer, K.; Braun, L.; Frakes, A.; Song, S.; Likhite, S.; Murtha, M.J.; Foust, K.D.; et al. Astrocytes from familial and sporadic ALS patients are toxic to motor neurons. Nat. Biotechnol. 2011, 29, 824–828. [Google Scholar] [CrossRef] [PubMed]
- Madji Hounoum, B.; Mavel, S.; Coque, E.; Patin, F.; Vourc’h, P.; Marouillat, S.; Nadal-Desbarats, L.; Emond, P.; Corcia, P.; Andres, C.R.; et al. Wildtype motoneurons, ALS-Linked SOD1 mutation and glutamate profoundly modify astrocyte metabolism and lactate shuttling. Glia 2017, 65, 592–605. [Google Scholar] [CrossRef] [PubMed]
- Grabham, P.; Cunningham, D.D. Thrombin Receptor Activation Stimulates Astrocyte Proliferation and Reversal of Stellation by Distinct Pathways: Involvement of Tyrosine Phosphorylation. J. Neurochem. 1995, 64, 583–591. [Google Scholar] [CrossRef]
- Gofrit, S.; Shavit-Stein, E. The neuro-glial coagulonome: The thrombin receptor and coagulation pathways as major players in neurological diseases. Neural Regen. Res. 2019, 14, 2043. [Google Scholar]
- Schmidlin, F.; Bunnett, N.W. Protease-activated receptors: How proteases signal to cells. Curr. Opin. Pharmacol. 2001, 1, 575–582. [Google Scholar] [CrossRef]
- Russo, A.; Soh, U.J.K.; Trejo, J. Proteases display biased agonism at protease-activated receptors: Location matters. Mol. Interv. 2009, 9, 87–96. [Google Scholar] [CrossRef]
- Zhong, Z.; Ilieva, H.; Hallagan, L.; Bell, R.; Singh, I.; Paquette, N.; Thiyagarajan, M.; Deane, R.; Fernandez, J.A.; Lane, S.; et al. Activated protein C therapy slows ALS-like disease in mice by transcriptionally inhibiting SOD1 in motor neurons and microglia cells. J. Clin. Invest. 2009, 119, 3437–3449. [Google Scholar] [CrossRef]
- Heuberger, D.M.; Schuepbach, R.A. Protease-activated receptors (PARs): Mechanisms of action and potential therapeutic modulators in PAR-driven inflammatory diseases. Thromb. J. 2019, 17, 4. [Google Scholar] [CrossRef]
- Ellis, C.A.; Malik, A.B.; Gilchrist, A.; Hamm, H.; Sandoval, R.; Voyno-Yasenetskaya, T.; Tiruppathi, C. Thrombin induces proteinase-activated receptor-1 gene expression in endothelial cells via activation of Gi-linked Ras/mitogen-activated protein kinase pathway. J. Biol. Chem. 1999, 274, 13718–13727. [Google Scholar] [CrossRef]
- Shavit, E.; Michaelson, D.M.; Chapman, J. Anatomical localization of protease-activated receptor-1 and protease-mediated neuroglilal crosstalk on peri-synaptic astrocytic endfeet. J. Neurochem. 2011, 119, 460–473. [Google Scholar] [CrossRef] [PubMed]
- Gurwitz, D.; Korczyn, A.D.; Beilin, O.; Karussis, D.M.; Aronovich, R.; Mizrachi-Kol, R.; Hantai, D.; Chapman, J.; Grigoriadis, N. Increased thrombin inhibition in experimental autoimmune encephalomyelitis. J. Neurosci. Res. 2004, 79, 351–359. [Google Scholar]
- Ben Shimon, M.; Zeimer, T.; Shavit Stein, E.; Artan-Furman, A.; Harnof, S.; Chapman, J.; Eisenkraft, A.; Pick, C.G.; Maggio, N. Recovery from trauma induced amnesia correlates with normalization of thrombin activity in the mouse hippocampus. PLoS ONE 2017, 12, e0188524. [Google Scholar] [CrossRef]
- Maggio, N.; Cavaliere, C.; Papa, M.; Blatt, I.; Chapman, J.; Segal, M. Thrombin regulation of synaptic transmission: Implications for seizure onset. Neurobiol. Dis. 2013, 50, 171–178. [Google Scholar] [CrossRef]
- Shavit-Stein, E.; Sheinberg, E.; Golderman, V.; Sharabi, S.; Wohl, A.; Gofrit, S.G.; Zivli, Z.; Shelestovich, N.; Last, D.; Guez, D.; et al. A Novel Compound Targeting Protease Receptor 1 Activators for the Treatment of Glioblastoma. Front. Neurol. 2018, 9, 1087. [Google Scholar] [CrossRef] [PubMed]
- Festoff, B.W.; D’Andrea, M.R.; Citron, B.A.; Salcedo, R.M.; Smirnova, I.V.; Andrade-Gordon, P. Motor neuron cell death in wobbler mutant mice follows overexpression of the G-protein-coupled, protease-activated receptor for thrombin. Mol. Med. 2000, 6, 410–429. [Google Scholar] [CrossRef] [PubMed]
- Rabinovich-Toidman, P.; Rabinovich-Nikitin, I.; Ezra, A.; Barbiro, B.; Fogel, H.; Slutsky, I.; Solomon, B. Mutant SOD1 increases APP expression and phosphorylation in cellular and animal models of ALS. PLoS ONE 2015, 10, e0143420. [Google Scholar] [CrossRef]
- Winkler, E.A.; Sengillo, J.D.; Sullivan, J.S.; Henkel, J.S.; Appel, S.H.; Zlokovic, B.V. Blood-spinal cord barrier breakdown and pericyte reductions in amyotrophic lateral sclerosis. Acta Neuropathol. 2013, 125, 111–120. [Google Scholar] [CrossRef]
- Stein, E.S.; Itsekson-Hayosh, Z.; Aronovich, A.; Reisner, Y.; Bushi, D.; Pick, C.G.; Tanne, D.; Chapman, J.; Vlachos, A.; Maggio, N. Thrombin induces ischemic LTP (iLTP): Implications for synaptic plasticity in the acute phase of ischemic stroke. Sci. Rep. 2015, 5, 7912. [Google Scholar] [CrossRef] [PubMed]
- Garbuzova-Davis, S.; Sanberg, P.R. Blood-CNS barrier impairment in ALS patients versus an animal model. Front. Cell. Neurosci. 2014, 8, 21. [Google Scholar] [CrossRef] [PubMed]
- Andjus, P.R.; Bataveljić, D.; Vanhoutte, G.; Mitrecic, D.; Pizzolante, F.; Djogo, N.; Nicaise, C.; Kengne, F.G.; Gangitano, C.; Michetti, F.; et al. In vivo morphological changes in animal models of amyotrophic lateral sclerosis and Alzheimer’s-like disease: MRI approach. Anat. Rec. (Hoboken) 2009, 292, 1882–1892. [Google Scholar] [CrossRef] [PubMed]
- Bushi, D.; Ben Shimon, M.; Shavit Stein, E.; Chapman, J.; Maggio, N.; Tanne, D. Increased thrombin activity following reperfusion after ischemic stroke alters synaptic transmission in the hippocampus. J. Neurochem. 2015, 135, 1140–1148. [Google Scholar] [CrossRef] [PubMed]
- Gera, O.; Shavit-Stein, E.; Bushi, D.; Harnof, S.; Shimon, M.B.; Weiss, R.; Golderman, V.; Dori, A.; Maggio, N.; Finegold, K.; et al. Thrombin and protein C pathway in peripheral nerve Schwann cells. Neuroscience 2016, 339, 587–598. [Google Scholar] [CrossRef]
- Shavit-Stein, E.; Aronovich, R.; Sylantiev, C.; Gofrit, S.G.; Chapman, J.; Dori, A. The role of thrombin in the pathogenesis of diabetic neuropathy. PLoS ONE 2019, 14, e0219453. [Google Scholar] [CrossRef]
- Shavit-Stein, E.; Aronovich, R.; Sylantiev, C.; Gera, O.; Gofrit, S.G.; Chapman, J.; Dori, A. Blocking Thrombin Significantly Ameliorates Experimental Autoimmune Neuritis. Front. Neurol. 2019, 9, 1139. [Google Scholar] [CrossRef]
- Bushi, D.; Stein, E.S.; Golderman, V.; Feingold, E.; Gera, O.; Chapman, J.; Tanne, D. A linear temporal increase in thrombin activity and loss of its receptor in mouse brain following ischemic stroke. Front. Neurol. 2017, 8, 138. [Google Scholar] [CrossRef]
- Itsekson-Hayosh, Z.; Shavit-Stein, E.; Katzav, A.; Rubovitch, V.; Maggio, N.; Chapman, J.; Harnof, S.; Pick, C.G. Minimal Traumatic Brain Injury in Mice: Protease-Activated Receptor 1 and Thrombin-Related Changes. J. Neurotrauma 2016, 33, 1848–1854. [Google Scholar] [CrossRef]
- Coughlin, S.R. How the protease thrombin talks to cells. Proc. Natl. Acad. Sci. USA 1999, 96, 11023–11027. [Google Scholar] [CrossRef]
- Festoff, B.W.; Citron, B.A. Thrombin and the Coag-Inflammatory Nexus in Neurotrauma, ALS, and Other Neurodegenerative Disorders. Front. Neurol. 2019, 10, 59. [Google Scholar] [CrossRef] [PubMed]
- Maggio, N.; Shavit, E.; Chapman, J.; Segal, M. Thrombin induces long-term potentiation of reactivity to afferent stimulation and facilitates epileptic seizures in rat hippocampal slices: Toward understanding the functional consequences of cerebrovascular insults. J. Neurosci. 2008, 28, 732–736. [Google Scholar] [CrossRef] [PubMed]
- Itzekson, Z.; Maggio, N.; Milman, A.; Shavit, E.; Pick, C.G.; Chapman, J. Reversal of trauma-induced amnesia in mice by a thrombin receptor antagonist. J. Mol. Neurosci. 2014, 53, 87–95. [Google Scholar] [CrossRef] [PubMed]
- Nagai, M.; Re, D.B.; Nagata, T.; Chalazonitis, A.; Jessell, T.M.; Wichterle, H.; Przedborski, S. Astrocytes expressing ALS-linked mutated SOD1 release factors selectively toxic to motor neurons. Nat. Neurosci. 2007, 10, 615–622. [Google Scholar] [CrossRef]
- Grosche, J.; Kettenmann, H.; Reichenbach, A. Bergmann glial cells form distinct morphological structures to interact with cerebellar neurons. J. Neurosci. Res. 2002, 68, 138–149. [Google Scholar] [CrossRef]
- Afshar, P.; Ashtari, N.; Jiao, X.; Rahimi-Balaei, M.; Zhang, X.; Yaganeh, B.; Del Bigio, M.R.; Kong, J.; Marzban, H. Overexpression of human SOD1 leads to discrete defects in the cerebellar architecture in the mouse. Front. Neuroanat. 2017, 11, 22. [Google Scholar] [CrossRef]
- Beers, D.R.; Appel, S.H. Immune dysregulation in amyotrophic lateral sclerosis: Mechanisms and emerging therapies. Lancet Neurol. 2019, 18, 211–220. [Google Scholar] [CrossRef]
- Wallis, N.; Lau, C.L.; Farg, M.A.; Atkin, J.D.; Beart, P.M.; O’Shea, R.D. SOD1 Mutations Causing Familial Amyotrophic Lateral Sclerosis Induce Toxicity in Astrocytes: Evidence for Bystander Effects in a Continuum of Astrogliosis. Neurochem. Res. 2018, 43, 157–170. [Google Scholar] [CrossRef]
- Almad, A.A.; Doreswamy, A.; Gross, S.K.; Richard, J.P.; Huo, Y.; Haughey, N.; Maragakis, N.J. Connexin 43 in astrocytes contributes to motor neuron toxicity in amyotrophic lateral sclerosis. Glia 2016, 64, 1154–1169. [Google Scholar] [CrossRef]
- Pagani, M.; Chiò, A.; Valentini, M.C.; Öberg, J.; Nobili, F.; Calvo, A.; Moglia, C.; Bertuzzo, D.; Morbelli, S.; De Carli, F.; et al. Functional pattern of brain FDG-PET in amyotrophic lateral sclerosis. Neurology 2014, 83, 1067–1074. [Google Scholar] [CrossRef]
- Cistaro, A.; Valentini, M.C.; Chiò, A.; Nobili, F.; Calvo, A.; Moglia, C.; Montuschi, A.; Morbelli, S.; Salmaso, D.; Fania, P.; et al. Brain hypermetabolism in amyotrophic lateral sclerosis: A FDG PET study in ALS of spinal and bulbar onset. Eur. J. Nucl. Med. Mol. Imaging 2012, 39, 251–259. [Google Scholar] [CrossRef] [PubMed]
- Prell, T.; Grosskreutz, J. The involvement of the cerebellum in amyotrophic lateral sclerosis. Amyotroph. Lateral Scler. Front. Degener. 2013, 14, 507–515. [Google Scholar] [CrossRef] [PubMed]
- Gill, C.; Phelan, J.P.; Hatzipetros, T.; Kidd, J.D.; Tassinari, V.R.; Levine, B.; Wang, M.Z.; Moreno, A.; Thompson, K.; Maier, M.; et al. SOD1-positive aggregate accumulation in the CNS predicts slower disease progression and increased longevity in a mutant SOD1 mouse model of ALS. Sci. Rep. 2019, 9, 1–13. [Google Scholar] [CrossRef] [PubMed]
- Gao, W.L.; Tian, F.; Zhang, S.Q.; Zhang, H.; Yin, Z.S. Epidermal growth factor increases the expression of Nestin in rat reactive astrocytes through the Ras-Raf-ERK pathway. Neurosci. Lett. 2014, 562, 54–59. [Google Scholar] [CrossRef] [PubMed]
- Samatar, A.A.; Poulikakos, P.I. Targeting RAS–ERK signalling in cancer: Promises and challenges. Nat. Rev. Drug Discov. 2014, 13, 928–942. [Google Scholar] [CrossRef] [PubMed]
- Minamino, T.; Yoshida, T.; Tateno, K.; Miyauchi, H.; Zou, Y.; Toko, H.; Komuro, I. Ras Induces Vascular Smooth Muscle Cell Senescence and Inflammation in Human Atherosclerosis. Circulation 2003, 108, 2264–2269. [Google Scholar] [CrossRef]
- Mor, A.; Philips, M.R.; Pillinger, M.H. The role of Ras signaling in lupus T lymphocytes: Biology and pathogenesis. Clin. Immunol. 2007, 125, 215–223. [Google Scholar] [CrossRef] [PubMed]
- Katzav, A.; Kloog, Y.; Korczyn, A.D.; Niv, H.; Karussis, D.M.; Wang, N.; Rabinowitz, R.; Blank, M.; Shoenfeld, Y.; Chapman, J. Treatment of MRL/lpr mice, a genetic autoimmune model, with the ras inhibitor, farnesylthiosalicylate (FTS). Clin. Exp. Immunol. 2001, 126, 570–577. [Google Scholar] [CrossRef]
- Karussis, D.; Abramsky, O.; Grigoriadis, N.; Chapman, J.; Mizrachi-Koll, R.; Niv, H.; Kloog, Y. The Ras-pathway inhibitor, S-trans-trans-farnesylthiosalicylic acid, suppresses experimental allergic encephalomyelitis. J. Neuroimmunol. 2001, 120, 1–9. [Google Scholar] [CrossRef]
- Chan, C.-P.; Chang, M.-C.; Wang, Y.-J.; Chen, L.-I.; Tsai, Y.-L.; Lee, J.-J.; Jia, H.-W.; Jeng, J.-H. Thrombin Activates Ras-CREB/ATF-1 Signaling and Stimulates c-fos, c-jun, and c-myc Expression in Human Gingival Fibroblasts. J. Periodontol. 2008, 79, 1248–1254. [Google Scholar] [CrossRef]
- Chung, Y.H.; Joo, K.M.; Lim, H.C.; Cho, M.H.; Kim, D.; Lee, W.B.; Cha, C.I. Immunohistochemical study on the distribution of phosphorylated extracellular signal-regulated kinase (ERK) in the central nervous system of SOD1G93A transgenic mice. Brain Res. 2005, 1050, 203–209. [Google Scholar] [CrossRef] [PubMed]
- Park, S.W.; Chen, S.W.C.; Kim, M.; D’Agati, V.D.; Lee, H.T. Human activated protein C attenuates both hepatic and renal injury caused by hepatic ischemia and reperfusion injury in mice. Kidney Int. 2009, 76, 739–750. [Google Scholar] [CrossRef] [PubMed]
- Morrow, D.A.; Alberts, M.J.; Mohr, J.P.; Ameriso, S.F.; Bonaca, M.P.; Goto, S.; Hankey, G.J.; Murphy, S.A.; Scirica, B.M.; Braunwald, E. Efficacy and safety of vorapaxar in patients with prior ischemic stroke. Stroke 2013, 44, 691–698. [Google Scholar] [CrossRef] [PubMed]
- Bushi, D.; Chapman, J.; Katzav, A.; Shavit-Stein, E.; Molshatzki, N.; Maggio, N.; Tanne, D. Quantitative detection of thrombin activity in an ischemic stroke model. J. Mol. Neurosci. 2013, 51, 844–850. [Google Scholar] [CrossRef]
- Günther, R.; Suhr, M.; Koch, J.C.; Bähr, M.; Lingor, P.; Tönges, L. Clinical testing and spinal cord removal in a mouse model for amyotrophic lateral sclerosis (ALS). J. Vis. Exp. 2012, 17, e3936. [Google Scholar] [CrossRef]
- Oron, T.; Elad-Sfadia, G.; Haklai, R.; Aizman, E.; Brazowski, E.; Kloog, Y.; Reif, S. Prevention of induced colitis in mice by the Ras antagonist farnesylthiosalicylic acid. Dig. Dis. Sci. 2012, 57, 320–326. [Google Scholar] [CrossRef]


© 2020 by the authors. Licensee MDPI, Basel, Switzerland. This article is an open access article distributed under the terms and conditions of the Creative Commons Attribution (CC BY) license (http://creativecommons.org/licenses/by/4.0/).
Share and Cite
Shavit-Stein, E.; Abu Rahal, I.; Bushi, D.; Gera, O.; Sharon, R.; Gofrit, S.G.; Pollak, L.; Mindel, K.; Maggio, N.; Kloog, Y.; et al. Brain Protease Activated Receptor 1 Pathway: A Therapeutic Target in the Superoxide Dismutase 1 (SOD1) Mouse Model of Amyotrophic Lateral Sclerosis. Int. J. Mol. Sci. 2020, 21, 3419. https://doi.org/10.3390/ijms21103419
Shavit-Stein E, Abu Rahal I, Bushi D, Gera O, Sharon R, Gofrit SG, Pollak L, Mindel K, Maggio N, Kloog Y, et al. Brain Protease Activated Receptor 1 Pathway: A Therapeutic Target in the Superoxide Dismutase 1 (SOD1) Mouse Model of Amyotrophic Lateral Sclerosis. International Journal of Molecular Sciences. 2020; 21(10):3419. https://doi.org/10.3390/ijms21103419
Chicago/Turabian StyleShavit-Stein, Efrat, Ihab Abu Rahal, Doron Bushi, Orna Gera, Roni Sharon, Shany G. Gofrit, Lea Pollak, Kate Mindel, Nicola Maggio, Yoel Kloog, and et al. 2020. "Brain Protease Activated Receptor 1 Pathway: A Therapeutic Target in the Superoxide Dismutase 1 (SOD1) Mouse Model of Amyotrophic Lateral Sclerosis" International Journal of Molecular Sciences 21, no. 10: 3419. https://doi.org/10.3390/ijms21103419
APA StyleShavit-Stein, E., Abu Rahal, I., Bushi, D., Gera, O., Sharon, R., Gofrit, S. G., Pollak, L., Mindel, K., Maggio, N., Kloog, Y., Chapman, J., & Dori, A. (2020). Brain Protease Activated Receptor 1 Pathway: A Therapeutic Target in the Superoxide Dismutase 1 (SOD1) Mouse Model of Amyotrophic Lateral Sclerosis. International Journal of Molecular Sciences, 21(10), 3419. https://doi.org/10.3390/ijms21103419