Article

Proteomics Reveal the Profiles of Color Change in Brunfelsia acuminata Flowers

College of horticulture, Fujian Agriculture and Forestry University, Fuzhou 350002, China
*
Author to whom correspondence should be addressed.
Int. J. Mol. Sci. 2019, 20(8), 2000; https://doi.org/10.3390/ijms20082000
Submission received: 7 March 2019 / Revised: 12 April 2019 / Accepted: 21 April 2019 / Published: 23 April 2019
(This article belongs to the Special Issue Plant Proteomic Research 2.0)

Abstract

:
Brunfelsia acuminata is a popular ornamental plant with different colors resulted from the rapid change of color after blooming. The petals at day one (purple), day three (white and purple) and day five (white) were used to analyze the reason of flower color change by a comparative proteomics approach, gas chromatography coupled to a time-of-flight mass analyzer (GC-TOF-MS) and quantitative real-time PCR (qRT-PCR). The results showed that the 52 identified proteins were classified into eight functional groups, 6% of which were related to the anthocyanin metabolic pathway. The expression levels of all anthocyanin proteins from the first day to fifth day were remarkably down-regulated, which was consistent with the changing patterns of the key genes (CHS, CHI and F3′5′H) in petals. Simultaneously, the main floral volatile components including Linalool and 2-Hexenal (E) were identified, and the contents of 2-Hexenal at day five increased dramatically. Moreover, the content of flavonoids and total phenolic increased at day five. The majority of the proteins associated with stress defense and senescence proteins were up-regulated and the activities of peroxidase (POD), superoxide dismutase (SOD) and catalase (CAT) in the petals at day five were significantly higher than others. It was concluded that the competition in the precursors of metabolic pathways occurs and causes the flow of metabolite to the pathways of floral scent and lignin derived from the shikimate pathway or degrade into others. Therefore, the anthocyanin content significantly decreased, and the petal color changed from deep purple to white.

1. Introduction

B. acuminata is an evergreen shrub native to Brazil. The date of flower blooming is from April to May (South of China). The color change in plants is very obvious, with a high ornamental value [1]. The color of the petal begins to change gradually from purple to white after two to three days of opening. The flower color is affected by different kinds of pigments, and the change is related to the decline of the anthocyanin content [2]. In general, the pigment of the petals is distributed in the vacuoles of epidermal cells, but is also present in other tissues, such as the cell wall [3], palisade, and chromoplasts [4]. The anthocyanin component in the B. acuminata petal includes in malvidin-3-O-glucoside chloride, petunidin-3-glucoside and delphinidin-3- glucoside, which are part of the polyphenolic [5]. They are water-soluble plant pigments that are susceptible to change [4] by pollinators [6], temperature, light [7], solvents, chemical structures, and pH changes [8]. Phenolic compounds are a large class of plant secondary metabolites including phenolic acids, tannins, lignans, coumarins, and flavonoids, which are responsible for the color of fruits and substrates for enzymatic browning [9]. Previous studies have shown that phenolic compounds play a role in the antioxidant activity of the flower [10,11]. Flavonoids are a biologically important group of phenolics in plants [12]. Secondary compounds are important in plants, especially in anthocyanin and as a stress and defense substance [13]. In addition, in the process of flower growth and development, the appearance of the petal changes with the alternation of the internal structure. Many studies have observed change in the structure and ultrastructure of the petals [14,15].
The biosynthetic pathway of anthocyanin has been the subject of much research and the associated biosynthetic and regulatory genes such as chalcone synthase (CHS), chalcone isomerase (CHI), and flavonoid 3′5′-hydroxylase (F3′5′H) are well defined in Brunfelsia plants [1,16,17]. These genes are also studied in many plants such as P. hybrida ‘Mirage Rose’ [18], Lilium spp. cultivar ‘Dizzy’ [19]. The process of anthocyanin degradation in B.calycina was dependent on de novo synthesis of mRNAs and proteins of peroxidase (BcPrx01) [20]. It is speculated that POD is an enzyme that causes the degradation of anthocyanin of B. calycina petals by Oren-Shamir [2].
Proteome approaches are a powerful tool and can assist the investigation of comprehensive protein expression profiles in specific biological responses [21]. Two dimensional electrophoresis (2-DE) is one of the mainstream methods for floral proteomics, and has been widely applied to flower organs, such as the androecium, the gynoecium, and petals [22].
However, the detailed knowledge of the degradation of anthocyanin is poorly understood in the B. acuminata petal. Therefore, the aim of this study was to explore the profiles of color changes of the flower in B. acuminata through proteomics analysis.

2. Results

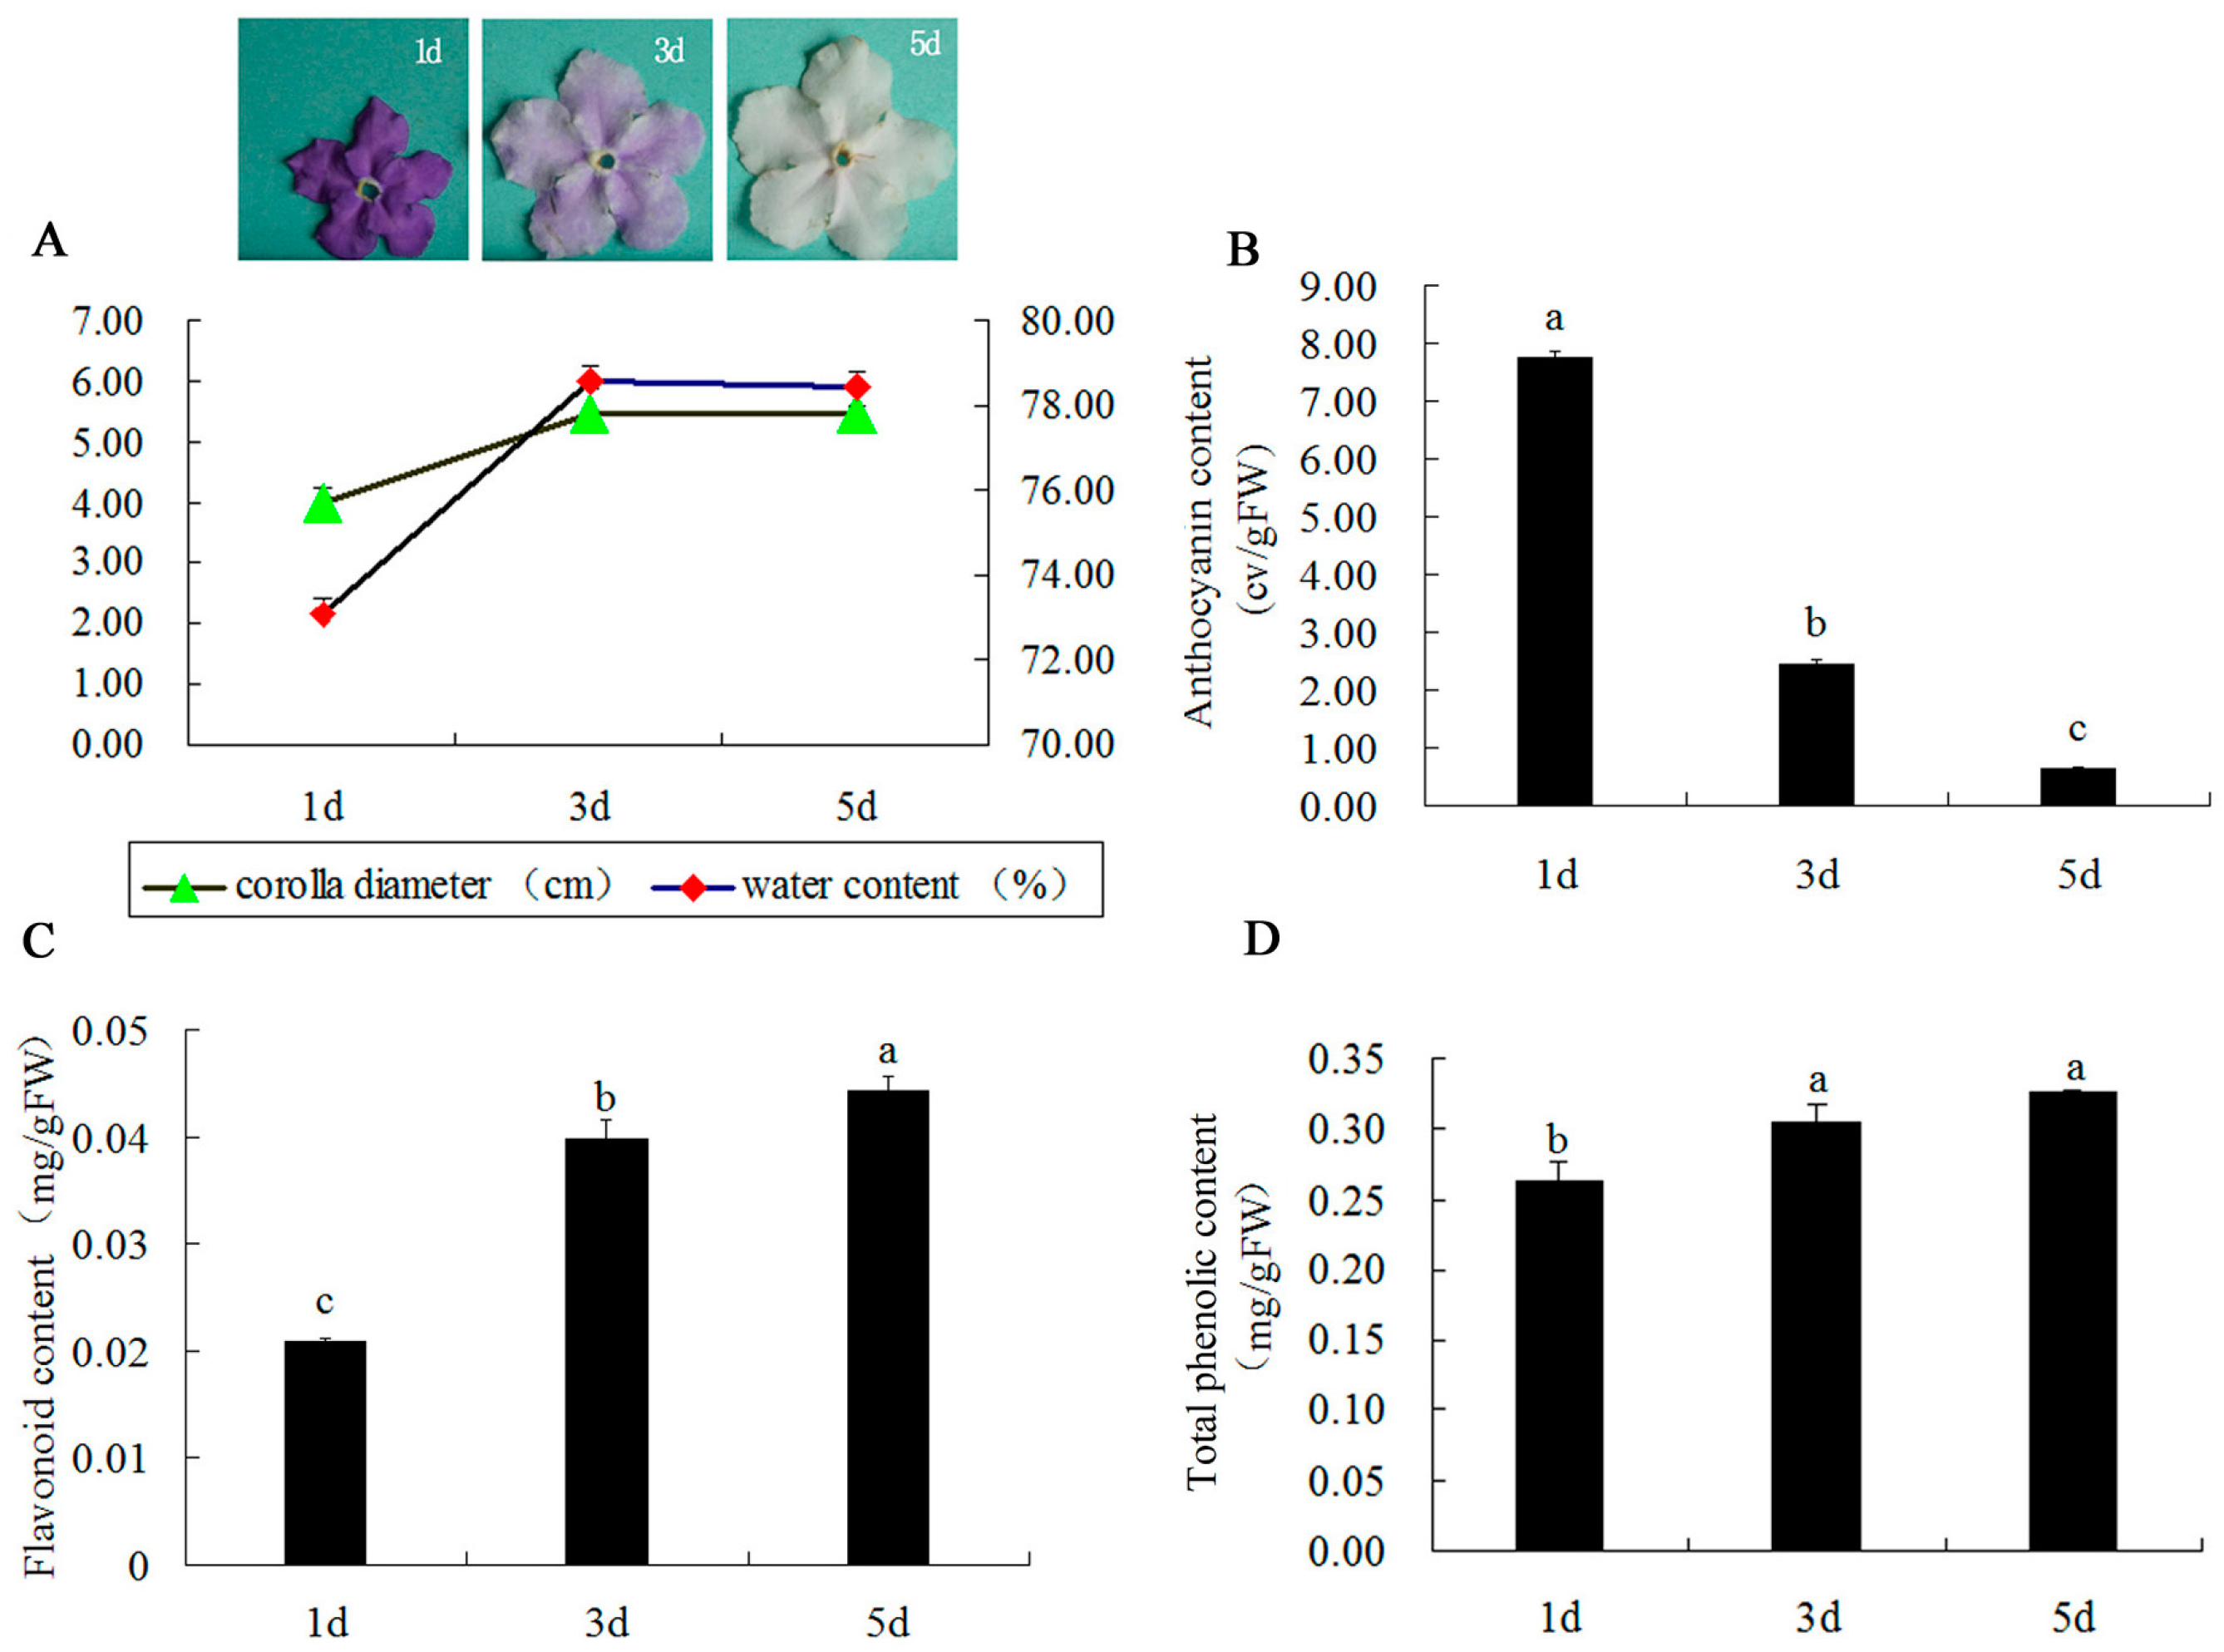
2.1. Changes in Corolla Diameter, Content of Water, Anthocyanin, Flavonoid, Total Phenolic, and Ultra-Structure during Flower Development

The corolla diameter of B. acuminata petals increased, and its water content at day 3 went up significantly as compared with day 1 and it kept stable in the petals at day 5 (Figure 1A). Simultaneously, the anthocyanin content reduced significantly (Figure 1B) in development of B. acuminata petals. The content accumulated to a maximum level at day 1 and degraded to a minimum level at day 5, whereas, the flavonoid content in the petals increased significantly from day 1 to day 3 (Figure 1C). Total phenolic content in the petals at day 3 was significantly higher than that in day 1. No significant difference was observed in between the contents at day 3 and at day 5 (Figure 1D).
From the day 1 to day 5, the cell volume of the petal expanded, and the petals grew rapidly (Figure 2A). The epidermal cell at day 1 was small purple and compact. With the expansion of the cell, its color became shallow at day 3, and became white at day 5 (Figure 2A,B). Unknown black pigment grain in the vacuoles of the petals was obviously observed at day 1, but the grain became smaller at day 3 and disappeared at day 5 (Figure 2C).

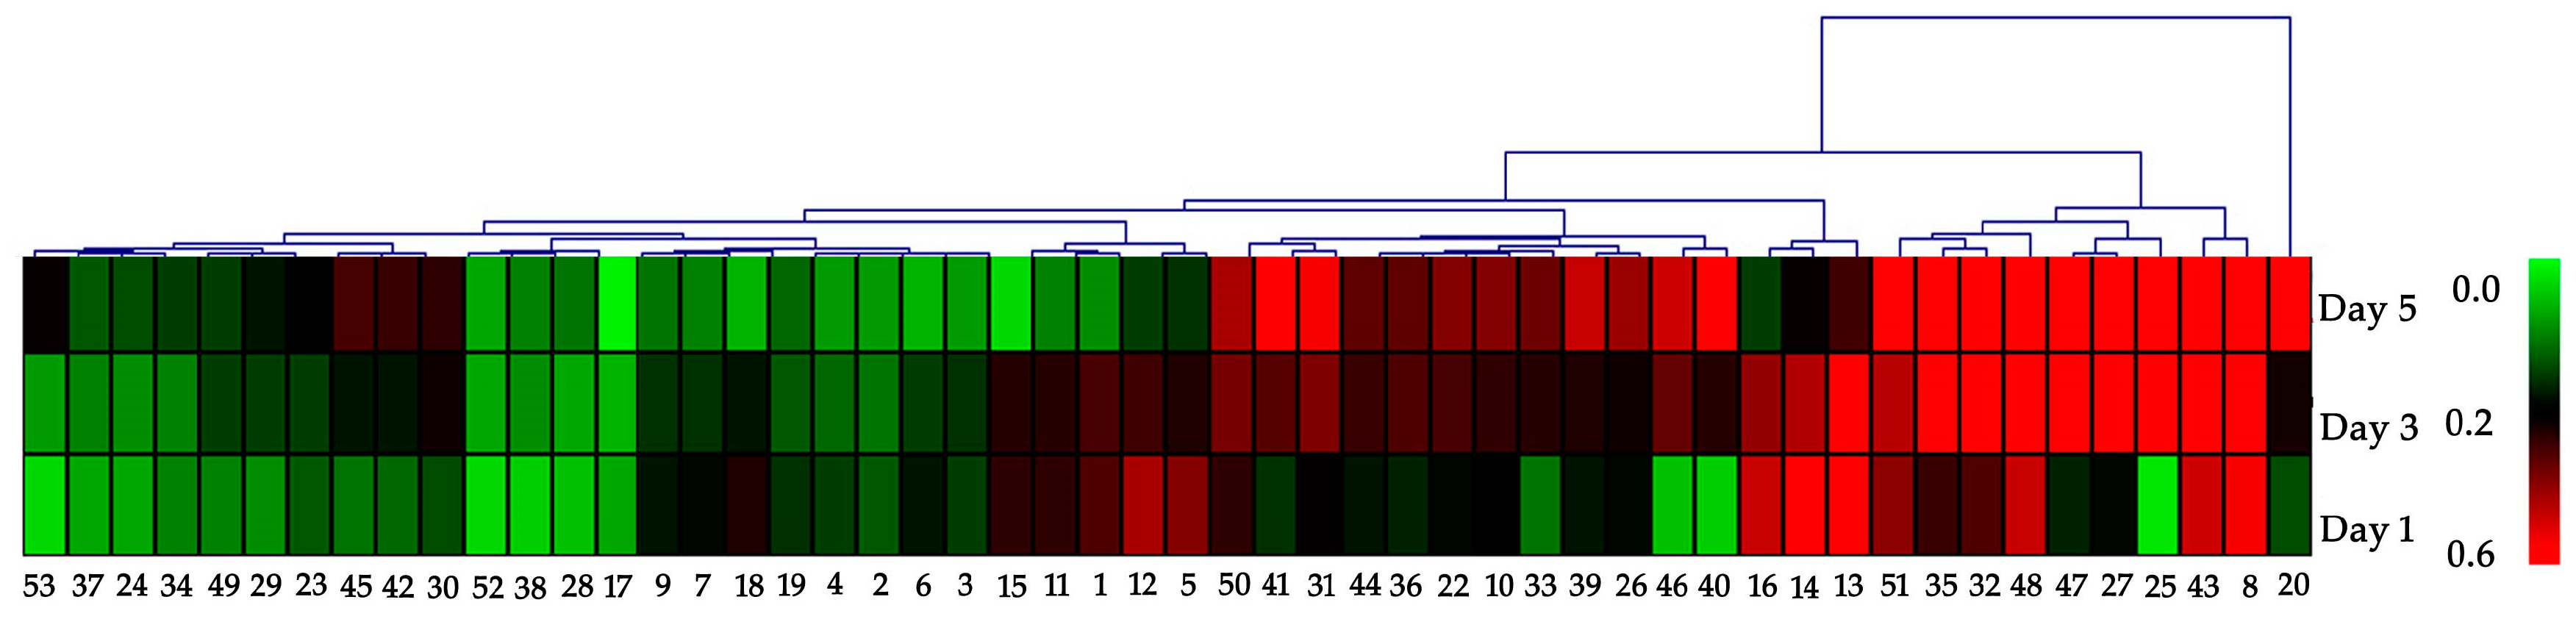
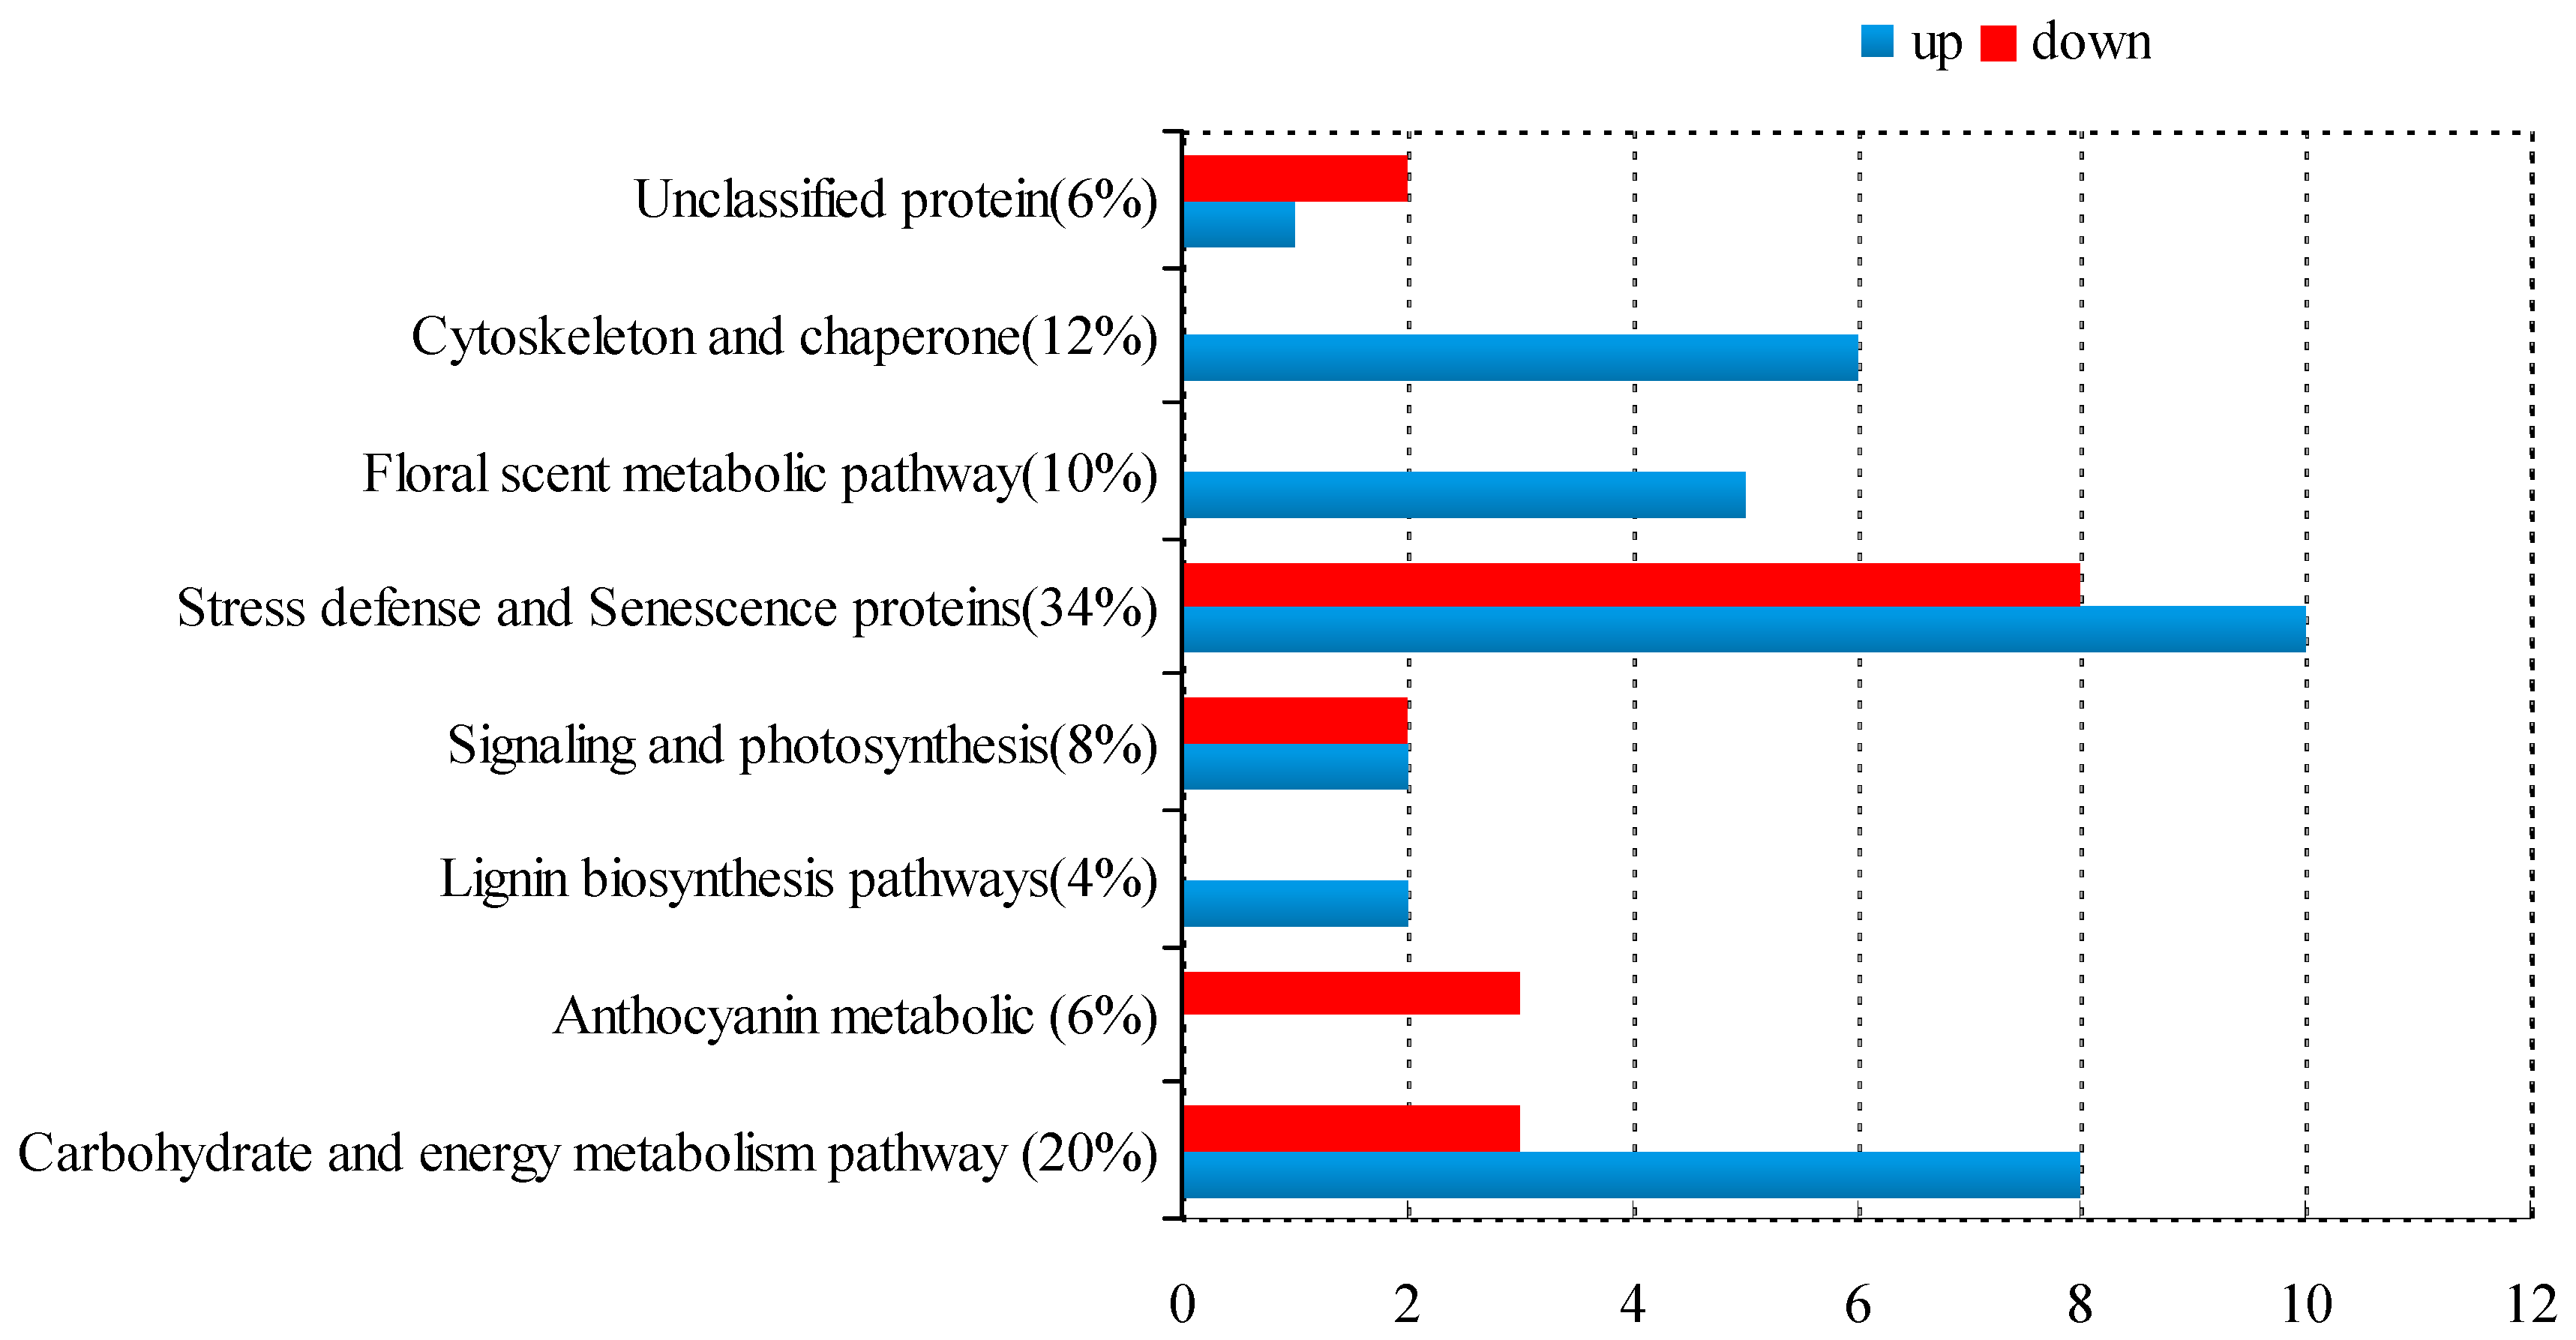
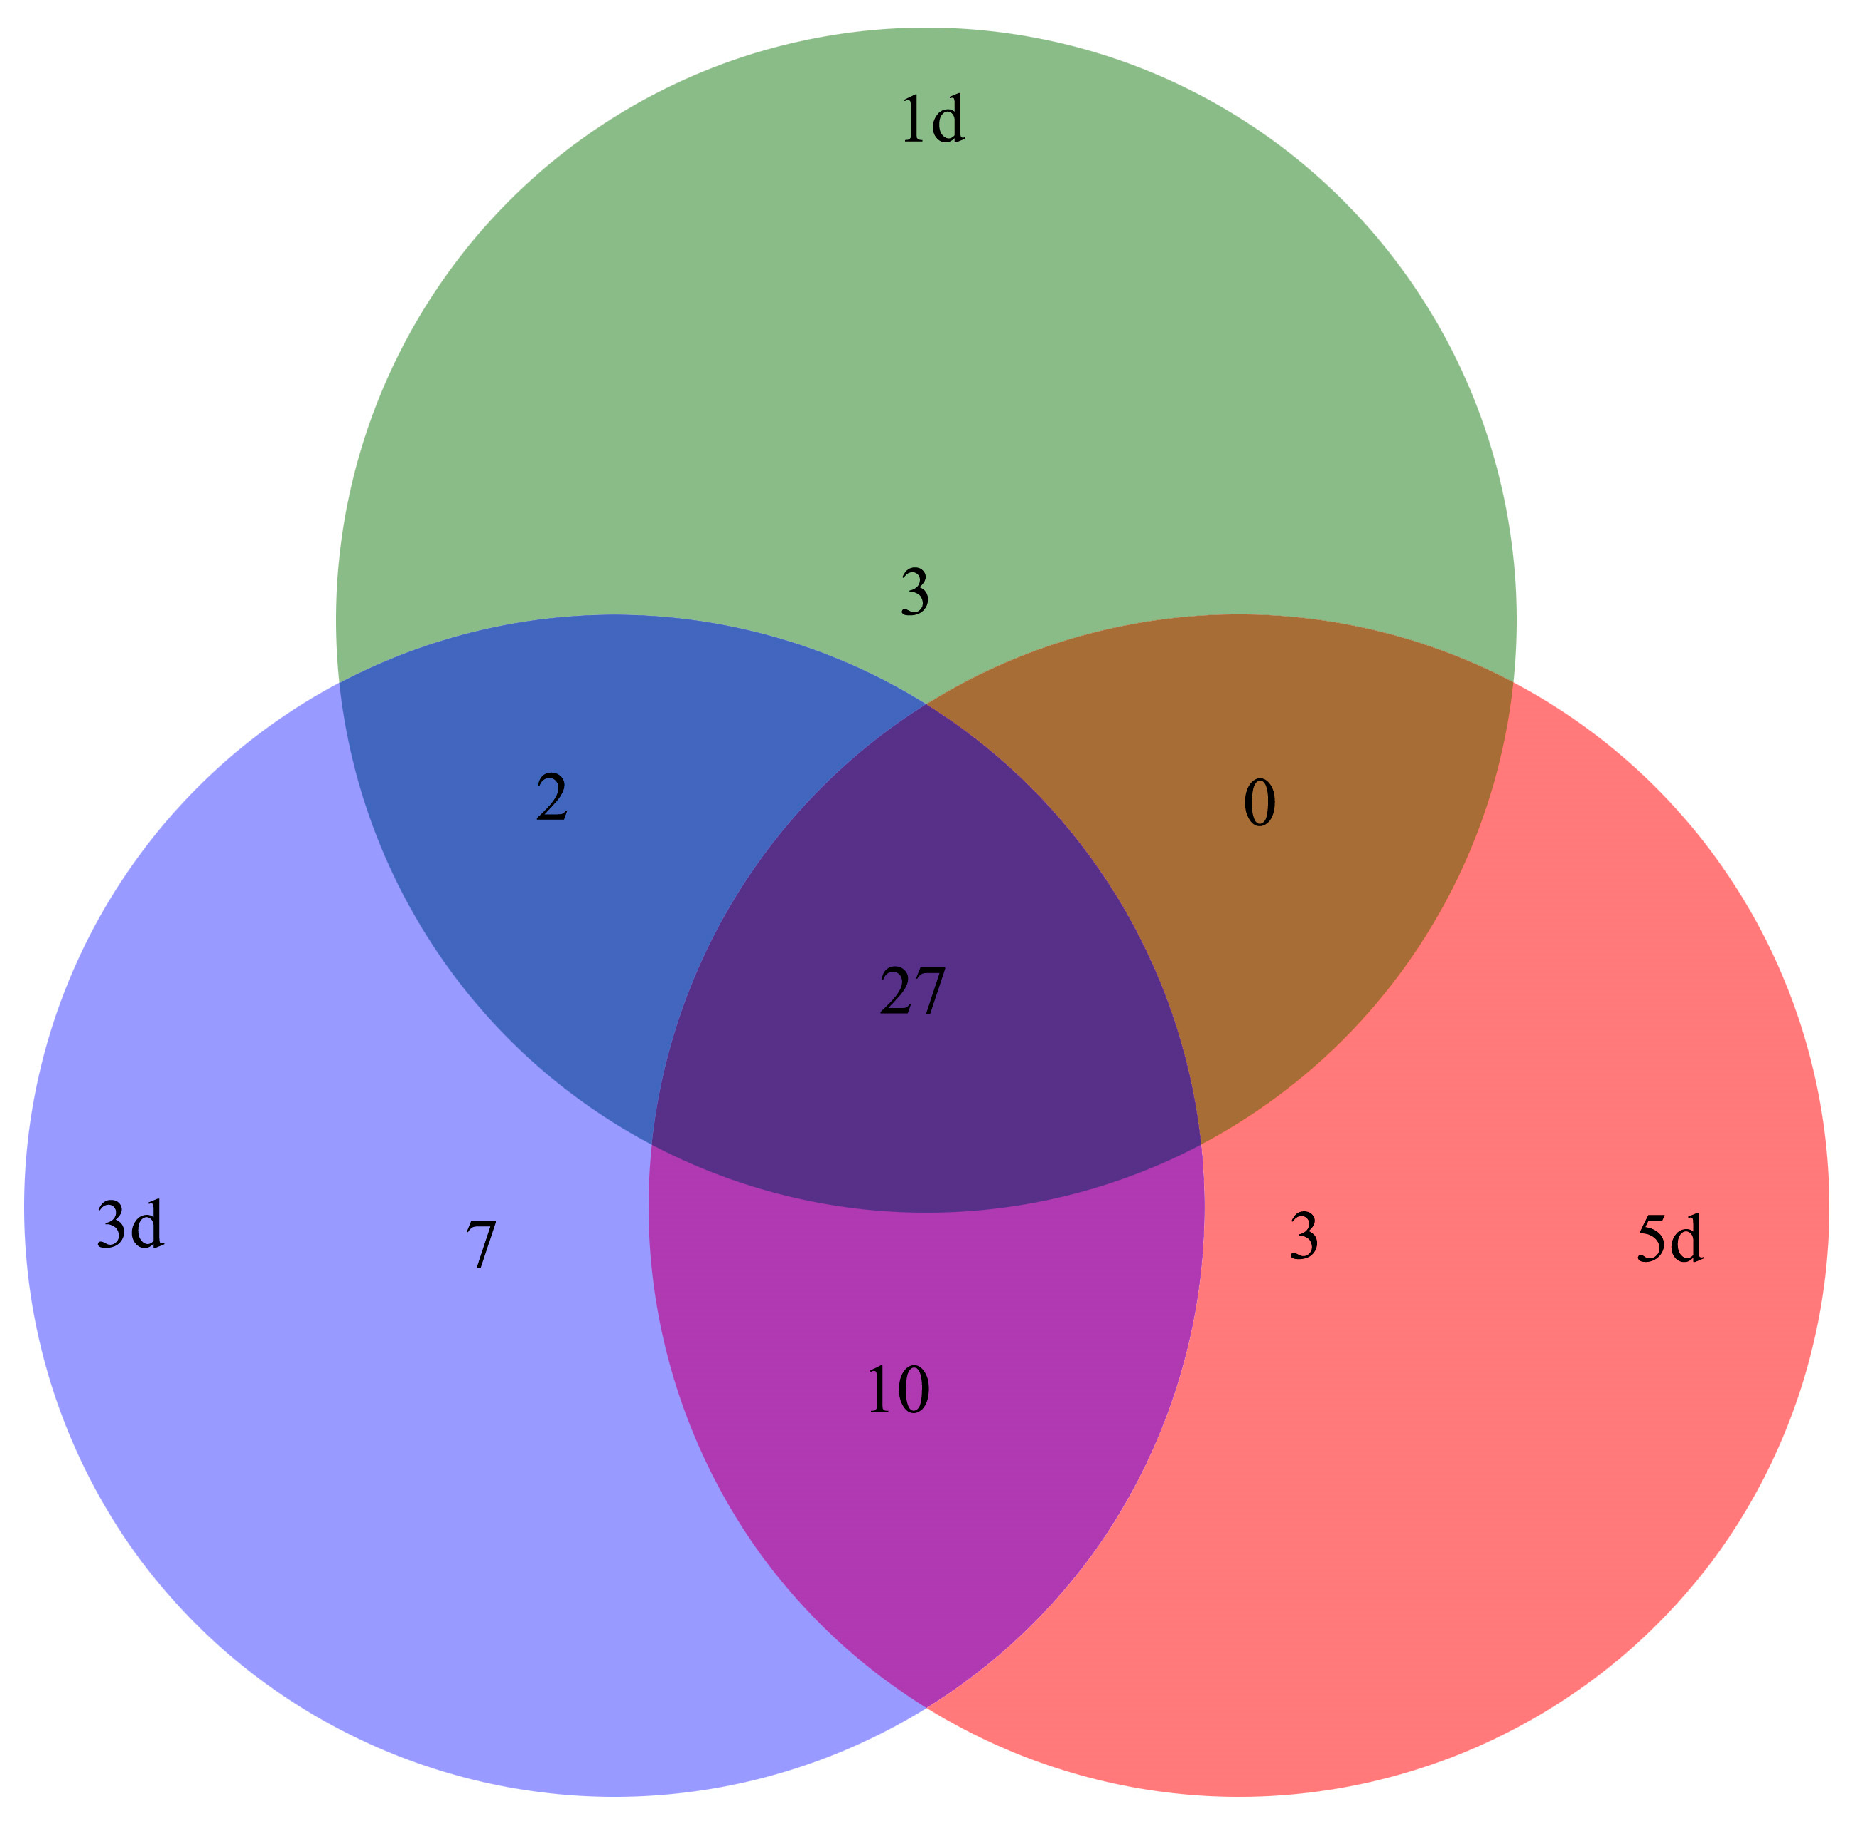
2.2. Protein Identification and Functional Classification

As shown in Supplementary Materials, 60 spots of the differentially abundant proteins were screened out. Figure 1 and 52 proteins were identified in B. acuminata petals by matrix-assisted laser desorption/ionization time-of-flight mass spectrometry (MALDI-TOF/TOF-MS) (Table 1). Among of which, 35 protein spots were significantly up-regulated and 17 protein spots were down-regulated. Of the 52 proteins successfully identified, some were identified as the same protein such as adenosine succinate syntheses (spot 3, spot 4), mitochondrial ATP synthase beta subunit (spot 32, spot 45), and anthocyanin 5-O-glucosyltransferase (5-GT, spot 17, spot 18). We found that 35 proteins were significantly up-regulated at day 5. Many of them had 2-fold or more in abundance. The six proteins (spot 25, spot 40, spot 46, spot 53, spot 27, spot 47) appeared at day 3 (Figure S2). Among of which, three new proteins (spot 27, spot 46, spot 47) showed a sudden increase in expression at day 3.
The visualization of differential abundance of the identified 52 proteins was showed in Figure 3. It can be classified into eight groups: Carbohydrate and energy metabolism pathway (20%), anthocyanin metabolic pathway (6%), lignin biosynthesis pathway (4%), stress defense and senescence proteins (34%), floral scent metabolic pathway (10%), signaling and photosynthesis (8%), cytoskeleton and chaperone (12%), and unclassified protein (6%) (Figure 4). It is interesting to find that all the proteins involved in floral scent metabolic pathway, lignin biosynthesis pathways and cytoskeleton and chaperon were up-regulated, while all anthocyanin metabolic proteins were down-regulated (Figure 4).

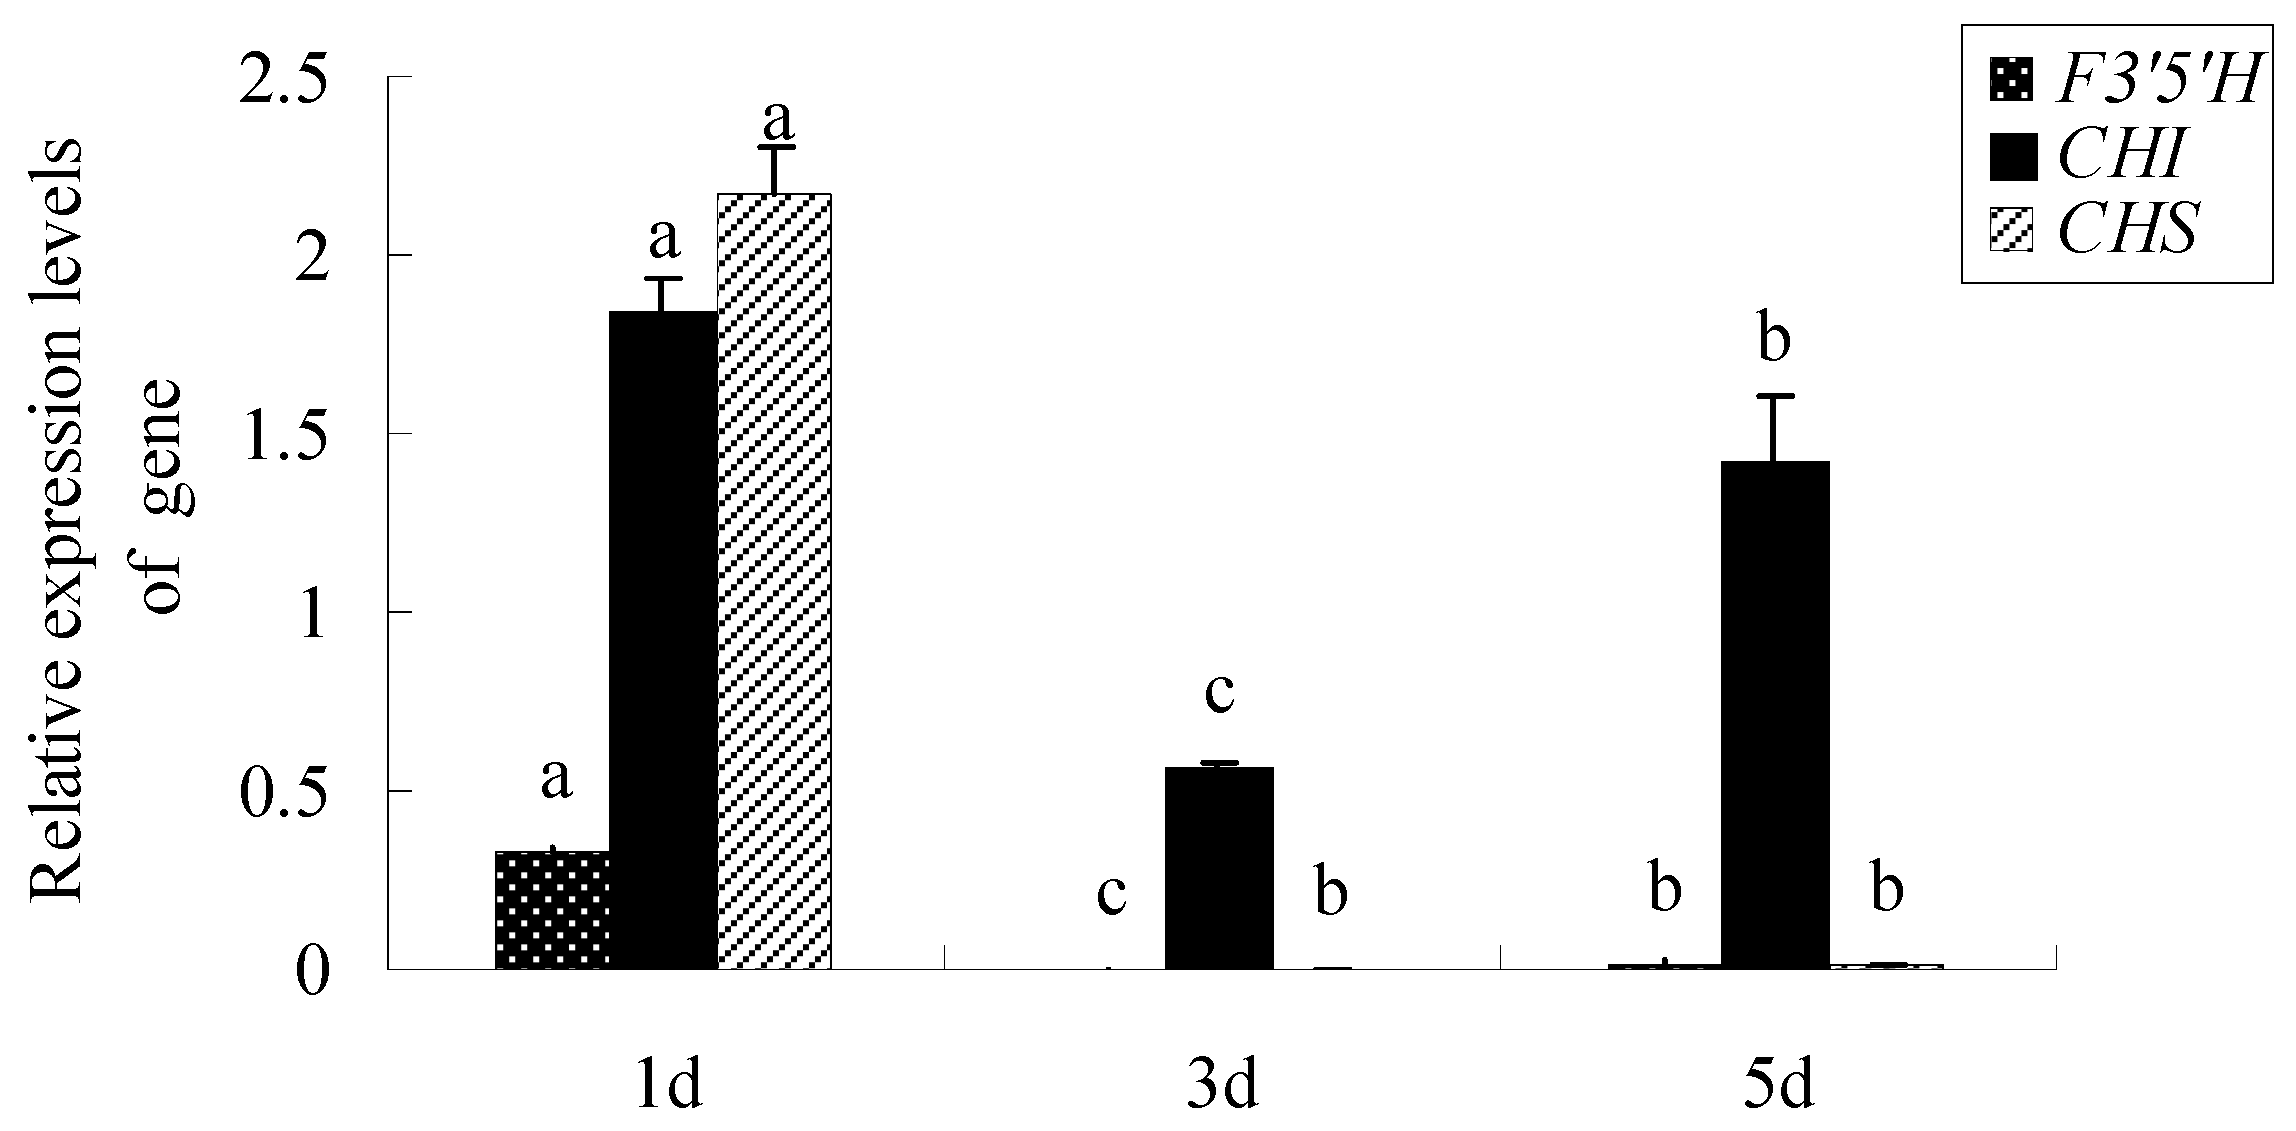
2.3. The Expression Levels of Key Genes Encoding Anthocyanin Synthesis in Different Days

The key genes of anthocyanins biosynthesis genes encoding proteins, namely, chalcone isomerase (CHI), flavonoid 3′5′-hydroxylase (F3′5′H), and CHS were examined to ascertain whether the protein differential abundance levels correlated with their mRNA content. Figure 5 showed that the expression levels of CHS and F3′5′H were remarkably down-regulated in different days. These results were consistent with trends in changes in color-related proteins. CHI has an upward trend in the later stage at day 5, which is likely to participate in other metabolic pathways.

2.4. Analysis of Volatiles

A total of 52 kinds of volatile components detected in different days of B. acuminata by GC-TOF-MS were classified into included terpenes, alcohols, aldehydes, esters, and so forth. At day 1, day 3, and day 5, 32, 46, and 40 components were detected in petals, respectively (Figure 6, Table S2). In Table 2, eight kinds of terpenoid with similarity greater than 800 and relative content greater than 5% is listed, and other volatiles are shown in Table S2. The volatile components of petals at day 1 are mainly linalool, and benzaldehyde and at day 3 are mainly including linalool, 2-hexenal, (E)-, trans-Linalool oxide (furanoid), where relative content of the compound is more than 10%. The relatively high content of the components at day 5 was linalool, 1-hexanol, benzeneacetaldehyde, which were 19.24%, 12.53%, and 11.40%, respectively.

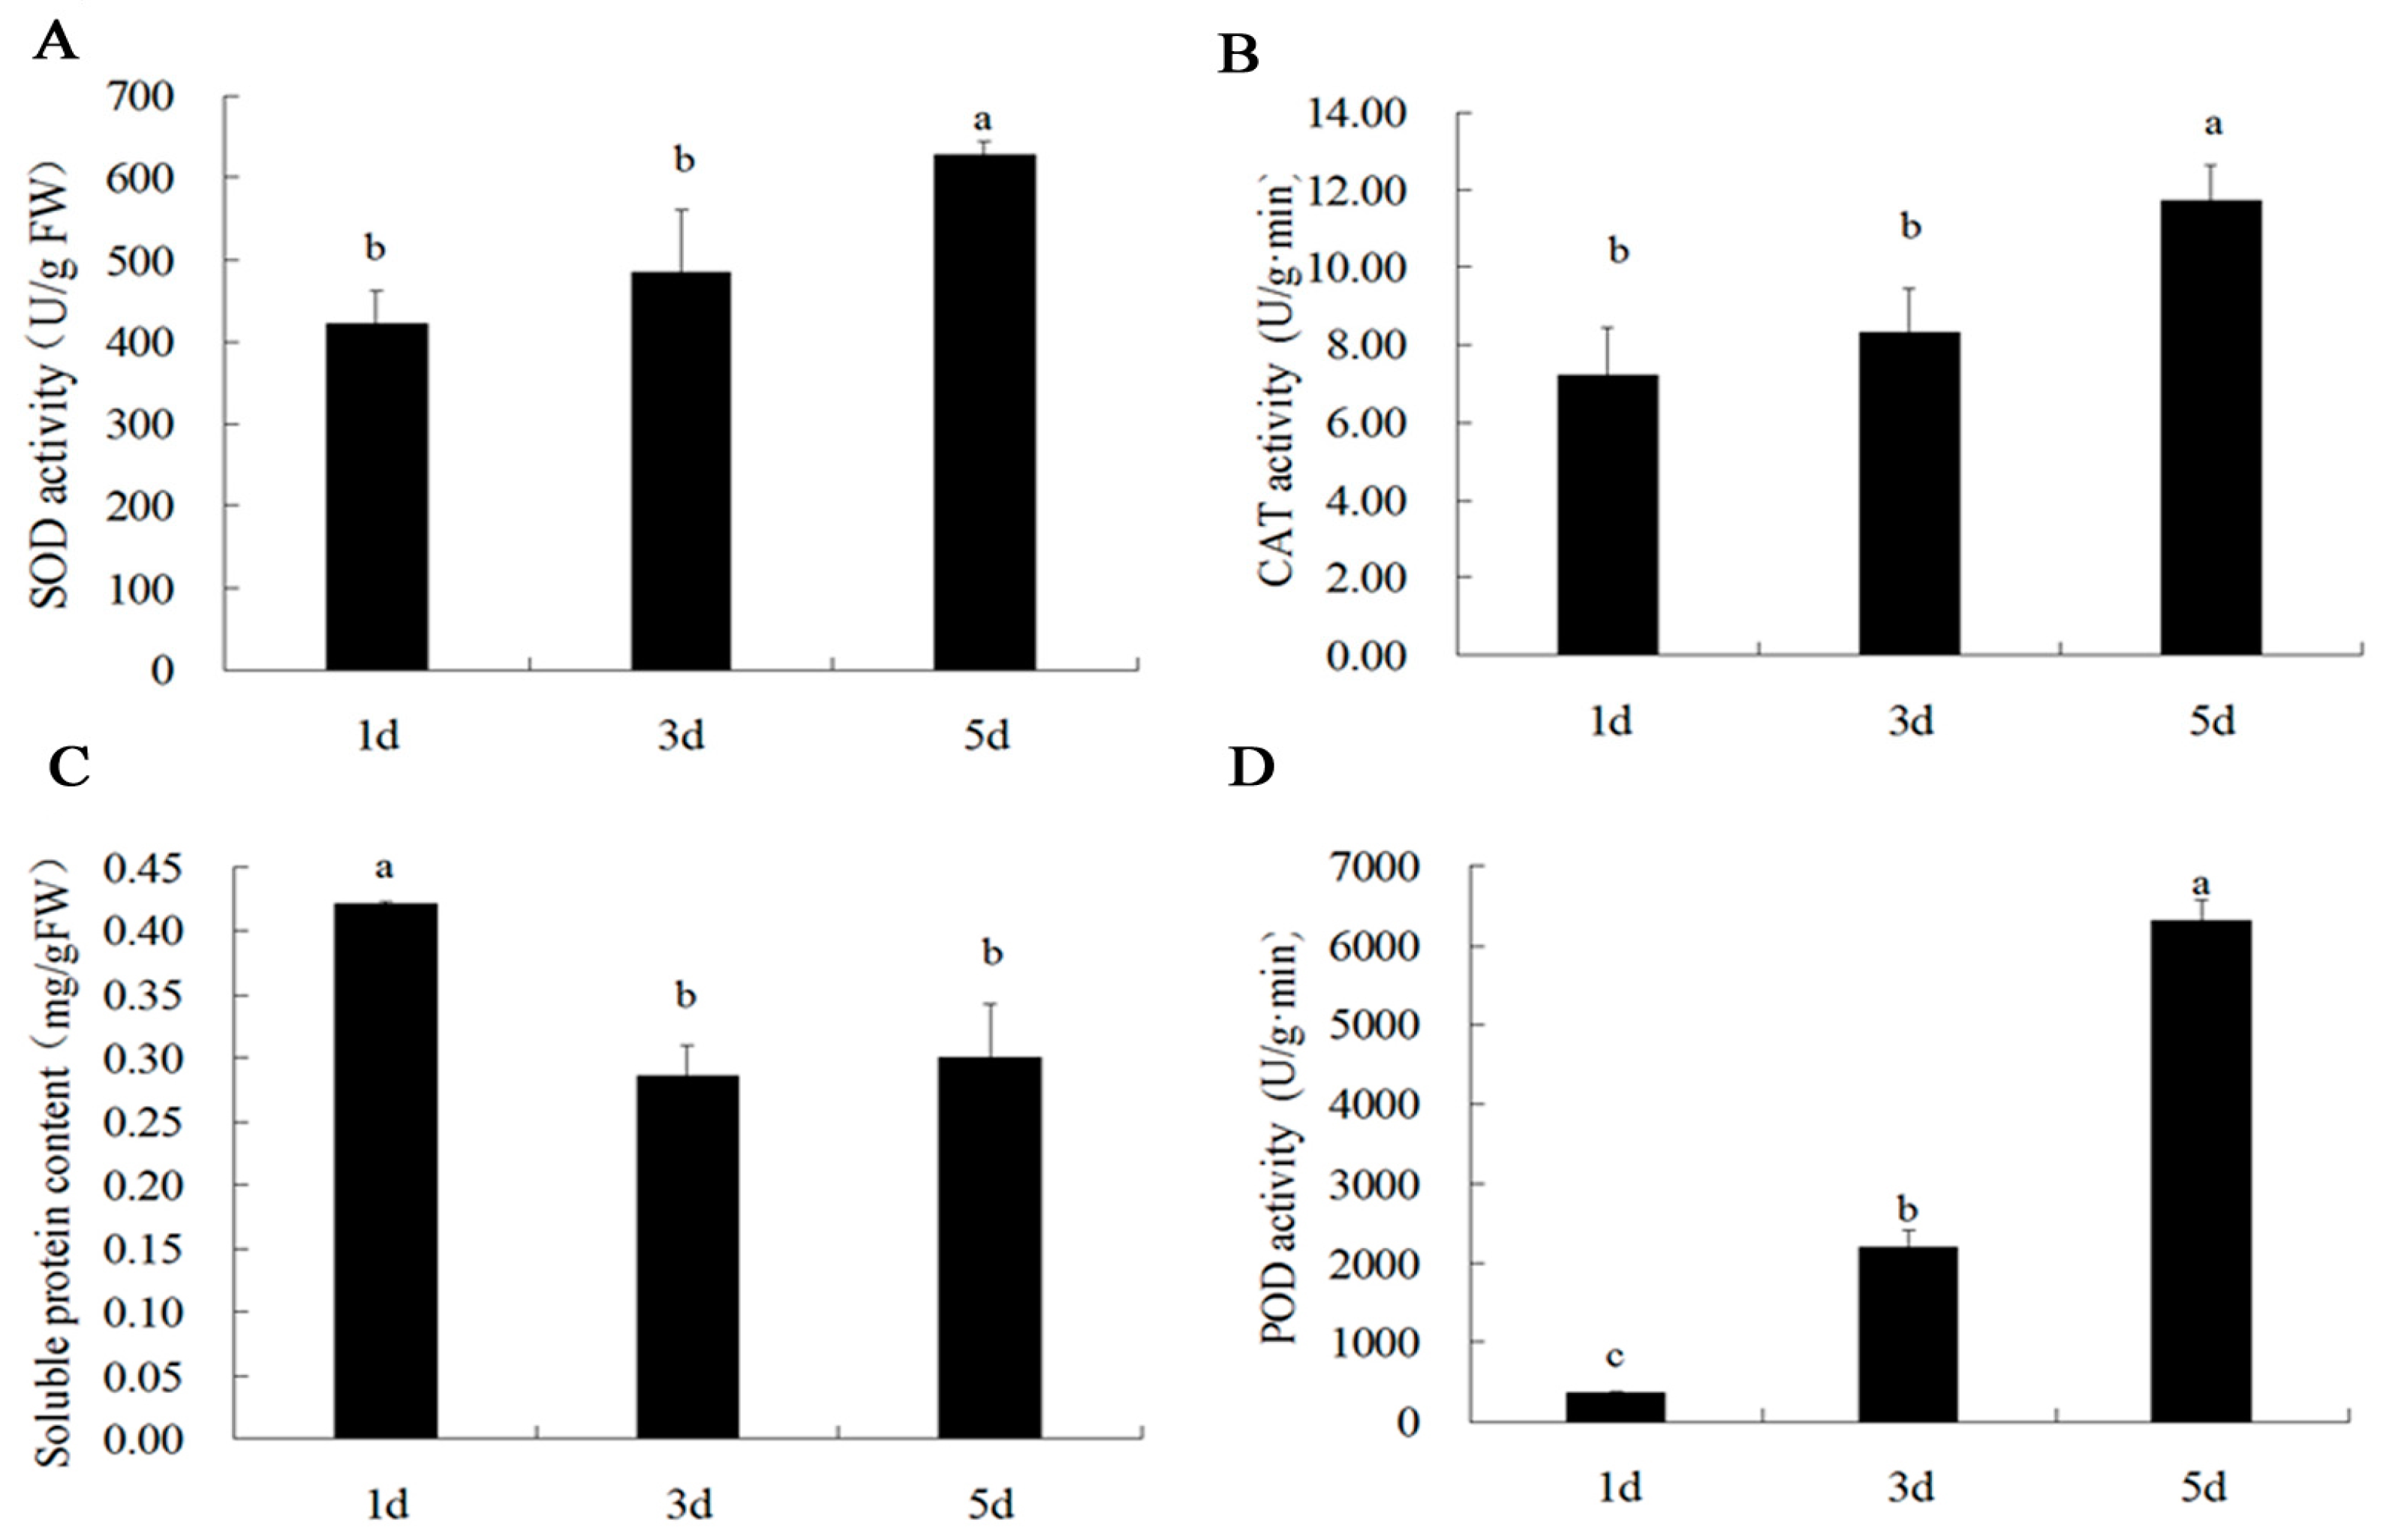
2.5. SOD, CAT, POD Activity and Soluble Protein Content in Petals of B. acuminata

Superoxide dismutase (SOD) and catalase (CAT) activity in the petals at day 5 were significantly higher than those at day 1 (Figure 7A,B). However, the soluble protein content (Figure 7C) in the petals decreased significantly from day 1 to day 5. The content had no significant difference between day 3 and day 5. Interestingly, the peroxidase (POD) activity increased significantly from day 1 to day 5 during blooming (Figure 7D).

3. Discussion

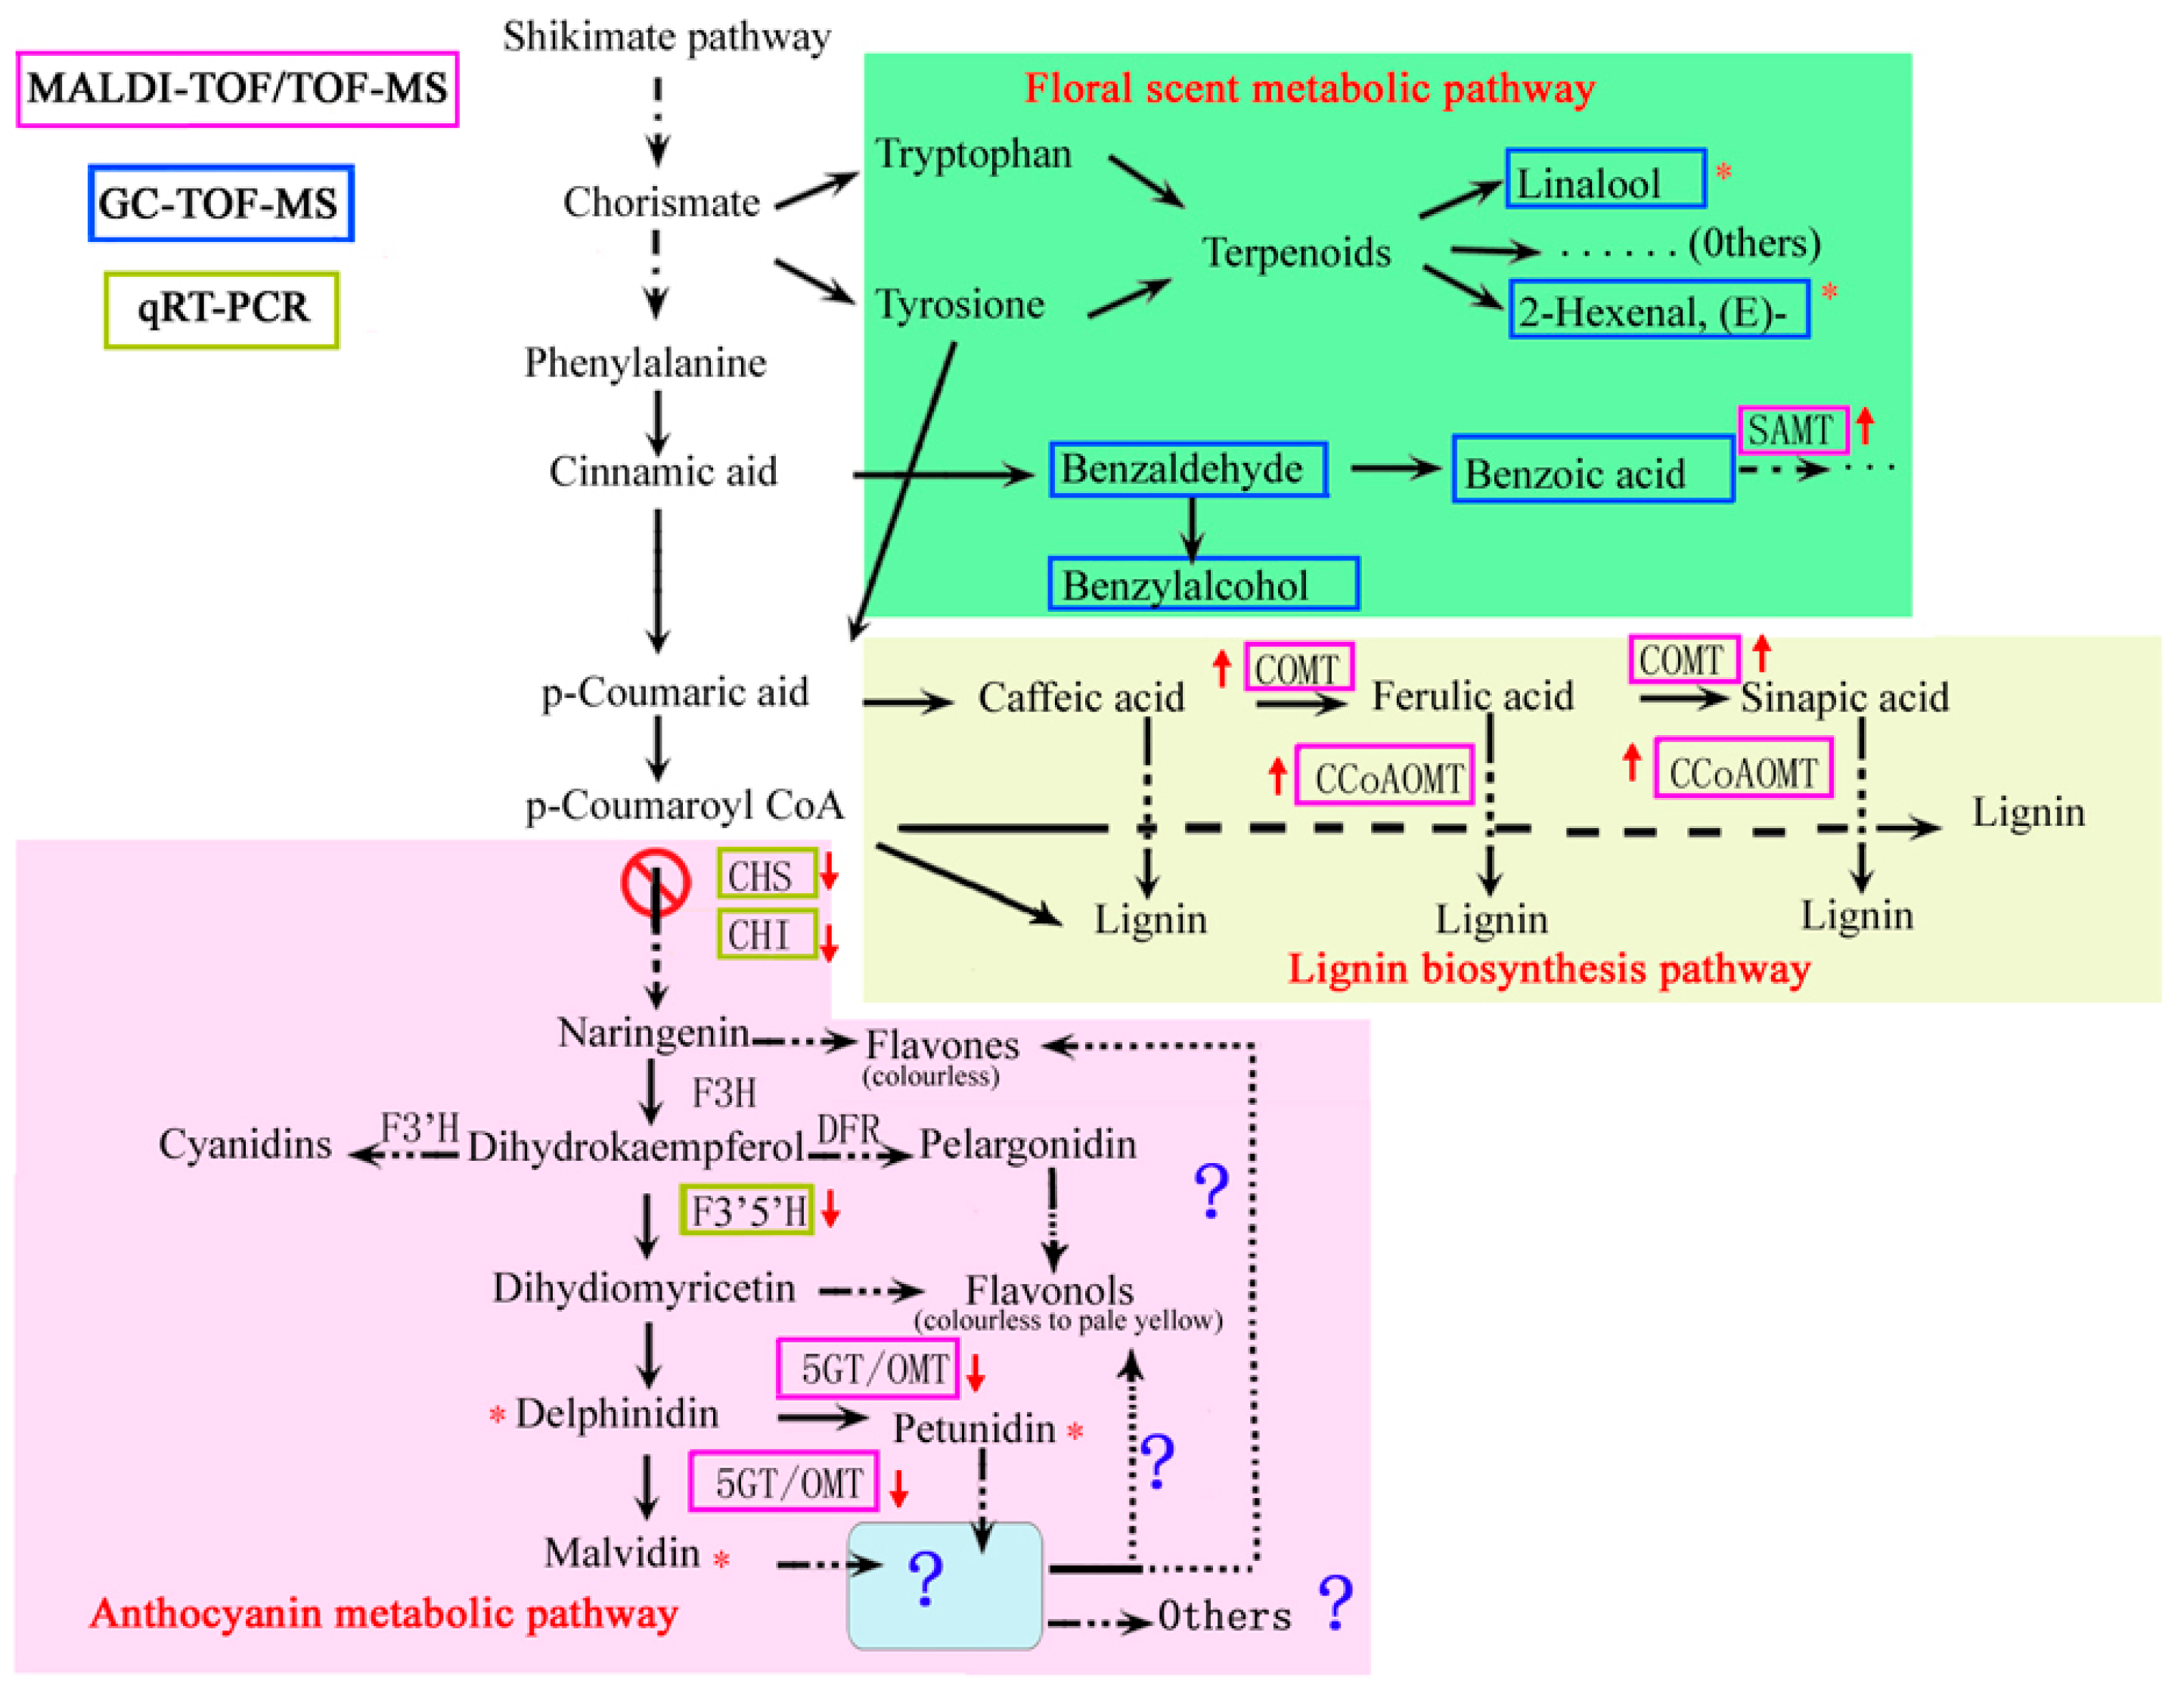
3.1. Main Proteins and Genes Related to Anthocyanin Synthesis

The appearance of plant color is closely related to the content of anthocyanin. In most cases, the color change is due to the induction of anthocyanin synthesis, but the color change of B. acuminata petal during anthesis is the exact opposite of Viola cornuta cv. yesterday, today, and tomorrow [23]. In the process of B. acuminata flowering, anthocyanin biosynthesis in the early opening petal of B. acuminata is the most exuberant, resulting in the deepest color. The anthocyanin degraded gradually, resulting in a change of flower color from deep purple to white. The color change of the petal is a complex process, from flower formation to degradation, requiring the participation of many enzymes and genes.
The enzymatic degradation of anthocyanin in plant tissues can play an important role in the regulation of plant pigments. Two proteins namely, anthocyanin-5-O-glucosyltransferase (5-GT) and anthocyanin-O-methyl transferase (OMT) related to the metabolic pathway of anthocyanin were identified and analyzed in three different periods of discoloration of B. acuminata petals (Table 1, Figure 3). 5-GT (spot 17, spot 18) is an enzyme that forms anthocyanin-3,5-O-diglucoside from anthocyanin-3-O-glucoside, which is responsible for the modification of anthocyanins to more stable molecules in complexes for co-pigmentation, supposedly resulting in a purple hue [24]. In our study, the expression level of 5-GT was higher in purple petals (day 1, 1d) than that in white petals (day 5, 5d) (Figure 3). OMT (spot 14) is one of the key enzymes for anthocyanin modification and flower pigmentation [25]. Many OMT genes are involved in the formation of methylated anthocyanins [25]. OMT was down-regulated and may not be able to methylate to form anthocyanins. Furthermore, all anthocyanin metabolic proteins were down-regulated, and many anthocyanin-modifying enzymes involved in the anthocyanin synthesis pathway were not activated during the petals changing from purple to white.
CHS, CHI, and F3′5′H are important enzymes for the formation of flower colors [26]. F3′5′H is a key enzyme for the synthesis of blue-purple pigments [27]. The expression levels of CHS and F3′5′H are both down-regulated in the process of flowering, consistent with protein differential abundance trends (Figure 5, Table 1). This result was supported by our previous work that the striking color change from dark purple to pure white resulted from a decline in anthocyanin content of the petals and was preceded by a decrease in the expression of BaCHS [28]. However, CHI expression differed from them, which has an upward trend in the later stage at day 5. Chalcone isomerase (CHI) converts yellow chalcone to colorless naringenin, which expression level directly affects the accumulation of yellow chalcone, a colorless phenotype, and flavanol compounds [29,30]. Maybe CHI is involved in other metabolic pathways, and the expression level will decrease later.

3.2. Other Protein Associated with Anthocyanin Synthesis

The shikimate pathway is induced at later stages in the flower of B. acuminata, linking carbohydrate metabolism to the precursors for the synthesis of anthocyanins, benzenoids, and lignin [31,32] (Figure 8). As a class of floral substances in plants, terpenoids have similar synthetic pathway with anthocyanins and carotenoids [33]. In our study, we found that four proteins are terpenoid-related and up-regulated during the flowering. Methyl salicylate is a volatile plant component, but also an important substance in the defense mechanism of plants [34]. The methylation of salicylic acid is performed by salicylate carboxymethyltransferase (SAMT, spot 39) [34]. 1-hydroxy-2-methyl-2-(E)-butenyl 4-diphosphate reductase (IDS, spot 33), and 1-deoxy-D-xylulose-5-phosphate reductoisomerase (DXR, spot 34) were significantly up-regulated, indicating that terpenoids continue to increase from day 1 to day 5. The putative salicylic acid carboxyl methyltransferase (spot 40, spot 42) is a new protein related to floral scent and lignin pathway and is also up-regulated. In the process of petal scent release, the black pigmentation is reduced and finally disintegrated (Figure 2). It can be speculated that the function of the black pigmentations is a reservoir of aroma precursors or energy in B. acuminata. This black pigmentation is similar to the description of the epidermal cells of jasmine petals described by Zhang [35]. In the B. acuminata petals, the expression levels of caffeoyl O-methyltransferase (COMT, spot 41) and caffeoyl-CoA O-methyltransferase (CCoAOMT, spot 47) were significantly up-regulated. Both are involved in the synthesis of the volatile compounds in Brunfelsia [31]. A similar result has been reported that multifunctional CCoAOMTs play roles in catalyzing the 3′or 3′-5′ O-methylation of their B ring of flavonoid substrates [36]. Glutathione S-transferase is associated with the formation of color, which can transport anthocyanins into vacuoles. 14-3-3-like protein GF14 Psi (spot 22) is associated with the shikimic acid pathway, which participates in the synthesis of aromatic compounds and indirectly affects the color changes [37]. GST and Glutamine synthetase 1, 4 (GS1, 4, spot 27) showed a significant upward trend in B. acuminata petals.
Lignin biosynthesis is the second metabolic pathway of the phenylpropane pathway branch, which is induced during petal expansion in the opening Brunfelsia flower [31]. Both anthocyanins and benzoic acid are derived from benzoic acid metabolic pathways, and there is a competitive effect between them [38]. Inhibition of other competitive biosynthetic pathways in the synthesis of floral substances can improve the synthesis of plant floral compounds such as anthocyanin biosynthetic pathway [38]. In our experiment, lignin synthesis enzymes and floral synthesis-related proteins were up-regulated, while anthocyanin synthesis-related proteins showed down-regulation, which may be the key reason to color changes. The dramatic changes in color are accompanied by the synthesis of aromatic phenol volatiles in the petal of B. acuminata. Anthocyanin degradation and the synthesis of aromatic benzene compounds may be pollinators’ signals [1,31]. Further studies may reveal a network of B. acuminata and related species of volatile and pigment phenolic metabolism.
The anthocyanin biosynthetic pathway belongs to a branch of the flavonoid biosynthetic pathway. Based on flavanones, all other flavonoid-classes are generated, including isoflavones, flavanols, anthocyanidins, flavanols, and flavones [39]. The anthocyanin content dropped significantly (Figure 1B), while the contents of flavonoid and total phenolic in the petals of B. acuminata increased significantly from day 1 to day 3 (Figure 1C). Thus, we speculated that the competition in the precursors of metabolic pathways occurs and causes the metabolite flow to the pathways of floral scent and lignin both derived from the shikimate pathway (Figure 8).

3.3. The Proteins Associated with Other Metabolic Pathways

In plants, there are many enzymes involved in sucrose metabolism, among which invertase is one of the key enzymes involved in plant sucrose metabolism [40]. Vacuolar invertase 2 (spot 29) can be the one in vacuole hydrolyzing glucose and fructose to regulate the concentration of intracellular sucrose. In this study, the water content of B. acuminata petals at day 3 went up significantly and it kept stable in the petals at day 5 (Figure 1A,B), and the vacuolar invertase was up-regulated from day 1 to day 5, promoting the expansion and enlargement of the petals.
Soluble acid invertase 2 (spot 24) is also a key enzyme in the process of carbohydrate metabolism, mainly in the vacuole. Highly active soluble acid invertase is closely related to the growth of the young parts of the plant and the rapid expansion of the storage organs [41].
With the growth of B. acuminata petals, respiration will become faster to provide the energy and raw materials necessary for plant life activities. Malate dehydrogenase, cytoplasmic-like (MDH, spot 5) is present. In this study, the protein differential abundance of MDH decreased from purple to white in the petals (Figure 3). It is possible that the petals are about to enter the aging period and the petal respiration and energy metabolism begin to weaken on day 5 of bloom. The ATP synthase β subunit (spot 49) was up-regulated in the B. acuminata petals, which indirectly provided energy for petal growth and development.
It is worth noting that Phosphoenolpyruvate carboxylase kinase1 (PpcK1, spot 46) and Glutamine synthetase (GS, spot 27) showed a sudden increase in expression at day 3. Two novel proteins, ASR1 (spot 25) and plastid-lipid-associated (spot 53) are related to stress defense proteins, which also appeared and up-regulated at day 3 (Figure S2). Phosphoenolpyruvate carboxykinase (PEPCK) is only known to be located in the cytosol in flowering plants [42]. In CAM plants, it is an important metabolic regulated and Ca2+-independent protein related to light, and the shift of kinase phosphorylation signal transduction pathway [43]. GS is a crucial enzyme in the network of N metabolism and also involved in N recycling in the plant [44]. ASR1 belongs to a family of hydrophilic proteins in responses to abiotic stresses as well as signaling molecules [45]. Plastid lipid-associated proteins are known to accumulate in fibrillar-type chromoplasts such as in leaf chloroplasts from Solanaceae plants under abiotic stress conditions [46] and involved in the pigment accumulation during fruit development [47]. The majority of these proteins associated with stress defense and senescence proteins were up-regulated indicating that the petal of B. acuminata at day 5 might be at the beginning of aging (Figure 4). This hypothesis is supported by the data that the activities of POD, SOD, and CAT in the petals at day 5 were significantly higher than those at day 3 and day 1 to prevent ageing (Figure 7) [48,49], and that all the protein involved in cytoskeleton and chaperon were up-regulated (Figure 4). The cytoskeleton constitutes the structural support of the living matter. Molecular chaperones are housekeeping factors of the cytoskeleton network [50].
In conclusion, the color change of B. acuminata flower is a complicated process involving numerous factors. The competition in the precursors of metabolic pathways occurs and causes the metabolite flow to the pathways of floral scent and lignin both derived from the shikimate pathway. Meanwhile, the decline of expression levels of CHS, CHI, and F3′5′H resulted in down-regulation of anthocyanin metabolic proteins. Therefore, the anthocyanin content decreased, and petal color change from deep purple to white (Figure 1). This work provides new proteomic and GC-TOF-MS insights of color change of flower in plants.

4. Materials and Methods

4.1. Plant Materials and Morphological Indicators

Flowers opened with purple petals (day 1,1d) that changed to light purple and white (day 3,3d), and pure white (day 5,5d) during a 5-day lifespan. B. acuminata petals in the different stages (1d, 3d, 5d) were collected from the greenhouse of Fujian Agriculture and Forestry University, Fuzhou, China (Figure 1A). The plants were grown at 20–25 °C/12–15 °C (day/night) temperature conditions, and 60%–80% humidity, and 14/10 h (day/night) with 100 mol·m−2·s−1 photosynthetically active radiation (PAR). Three replicate samples were collected at random from individual plants and immediately kept in liquid nitrogen, and stored at −80 °C for proteomic, quantitative real-time (qRT-PCR), and GC-TOF-MS analysis.
The petals of B. acuminata were randomly selected to observe their morphological changes and measure their flower diameter and water content. Vernier caliper was used to measure corolla diameter. Petal water content was determined as the percentage of total petal weight ((FW-DW)/FW·100) by weighing samples of 5 outer flower petals, before and after their drying in a drying box at 60 °C for 20 min. Each measurement was repeated with 5 flowers [51].

4.2. Observation of Petal Epidermal Cells Structure and Ultra-Structure

The petals were washed with distilled water. The longitudinal section of the petal was made by double-blade cutting to determine the internal structure of the petal and the distribution of pigment. A temporary water-filled sheet was prepared to observe the shape of the epidermis cells of the petals and whether the epidermis had a pigment distribution by optical microscope (Nikon, Tokyo, Japan). The photographs were taken under a microscope magnified 20 times. Transmission electron microscope (TEM, Hitachi, Tokyo, Japan) was used to observe the changes of epidermal cell ultra-structure of a flower in different days. The middle part of the fresh flowers were cut into pieces (about 1 mm2), and these fragments of flower were used for transmission electron microscopy in accordance to the described method by Meng [52].

4.3. Preparation of Total Protein Extraction

Proteins samples were prepared by phenol extraction in accordance with the methods of Wang [53]. The protein sample was dried at −20 °C and stored at −80 °C until used.

4.4. 2-DE and MALDI-TOF/TOF Analysis

The protein powder was mixed with a lysis buffer, containing 7 M urea, 2 M thiourea, and 4% CHAPS, 2% Pharmalyte3-10, and 40 mM DTT, and ultrasonically shaken for 20 min. After the protein powder was completely dissolved, it was placed in a water bath at 37 °C for 2.5 h, centrifuged at 20,000× g for 15 min at room temperature. The supernatant was transferred to a new centrifuge tube after centrifugation. The protein content was determined according to the Bradford method [54]. The steps of two-dimensional electrophoresis are in accordance with Wang et al [53]. A volume of 1.5 mg aliquots of protein was added to a 24 cm linear gradient Immobilized pH gradient (IPG) strip at pH 4–7 and hydrated for 12 h. The isoelectric focusing procedure: 200 V (l h)–500 V (l h)–1000 V (l h) -Gradient–8000 V (0.5 h)–8000 V (6 h)–1000 V (2 h). The maximum current for each strip is 50 mA. The operating conditions were 20 °C.
After the first isoelectric focusing, the strips were equilibrated in equilibrium solution I (50 mM Tris-HCl (pH 8.8), 6 M urea, 30% v/v glycerol, 2% w/v SDS, 1% DTT) for 15 min and transferred to equilibrium solution II (50 mM Tris-HCl (pH 8.8), 6 M urea, 30% v/v glycerol, 2% w/v SDS, 2.5% iodoacetamide) for 15 min. After the end of the two balances, the strips were removed, and the surface of the strip was washed again with electrophoresis buffer and transferred to a 12% sodium dodecyl sulfate polyacrylamide gel electrophoresis (SDS-PAGE) in Ettan DALT-six System (GE Healthcare Bio-Sciences, Uppsala, Sweden) at 18 °C.
The electrophoresis was terminated when the bromophenol blue band reached the bottom of the gel. After electrophoresis, staining was performed by Coomassie brilliant blue staining (CBB-R250) and shaking for 2 h. After staining, the stained liquid drained, the gels washed with distilled water and then added the right amount of bleaching solution for decolorization, until the gel background cleared up. After the decolorization was completed, the Epson scanner 11000XL-USB (EPSON, Tokyo, Japan) was used to perform gel image scanning. Gel image analysis was performed using Image MasterTM 2D Platinum Software Version 5.0 software (BioRad, Hercules, CA, USA).
The differential protein spots were excised carefully from the gels from the preparative 2D gels. In-gel digestion by trypsin and analysis by MS analysis in an AB SCIEX MALDI TOF-TOF™ 5800 analyzer (AB SCIEX, Foster City, CA, USA), was performed in accordance with the method described by Wang [53]. According to the results of mass spectrometry analysis, the data were selected using GPS Explorer (V3.6, Applied Biosystems) and the search engine MASCOT (2.1, MatrixScience, London, UK) with the following parameters: National Center for Biotechnology Information green plants (release date: 2015. 04. 01); MS tolerance was set at 100 ppm; MS/MS tolerance of 0.8 Da. Proteins were considered statistically significant (p < 0.05 and Ratio > 1.5) confident identifications with scores greater than 75. Individual raw MS and MS/MS spectra were accepted if at least two identified peptides having a probability of 95% correct match were found.

4.5. GC-TOF-MS Analysis

The flower volatile compounds were carried out on an Agilent 7890 gas chromatography (Agilent, Santa Clara, CA, USA) unit and Gerstel Autosampler (Gerstel, Muhlheim, Germany), and a LECO Pegasus HT time of flight mass spectrometer (LECO, St. Joseph, MI, USA) as described by Barakiva [31]. Individual flowers collected from day 1 to day 5 were placed in a 10 mL glass, sealed, and incubated under ambient conditions.
The identification of individual compounds was detected and identified by comparison with the mass spectra library from National Institute of Standards and Technology (NIST, Gaithersburg, MD, USA) and Fiehn Retention Time Lock (Agilent, Santa Clara, CA, USA) library. All the available data acquisition and processing were conducted using Chroma TOF-GC software version 4.51.6.0 (Leco, MI, USA) and performed ANOVA statistical analysis for significance and principal component analysis with a similarity greater than 800.

4.6. Quantitative Real-Time (qRT-PCR) Analysis

The qRT-PCR analysis in accordance with the method described by Li et al. [28] The CHS, CHI, and F3′5′H genes sequences for primer design were obtained from GenBank (Genbank accession number: JN966986, JN887637, JQ678765), respectively. All of the primers used are shown in Table S1. Relative transcription levels were calculated using the 2−ΔCTΔCT method.

4.7. Analysis of Physiological Parameters

Total contents of anthocyanin and flavonoid were determined according to the method of Zhang [55] with slight modifications. In brief, 0.1 g of each tissue was ground in liquid nitrogen and total anthocyanins were extracted with HCl/methanol (1:99, v/v) at dark for 4 h. The supernatants were determined using UV spectrophotometry at 535 nm and 657 nm. Total phenolic content was determined according to Mitra [56]. Soluble protein content was determined by Coomassie brilliant blue staining method, SOD, POD and CAT activity was quantified according to Wang [57].

4.8. Bioinformatic Analysis of Identified Proteins

The clustering analysis and heat map of protein differential abundance were carried out using the expression values and generated with MultiExperiment Viewer version 4.8 software (MeV; http://www.tm4.org/mev/). The results were viewed using Java TreeView. The GO analysis and classification are based on KEGG (http://www.kegg.jp/kegg/pathway.html).

4.9. Statistical Analysis

All the indexes were analyzed and plotted by Excel 2003 (Microsoft Corporation, Seattle, WA, USA) and the difference was statistically analyzed by SPSS 19 software (IBM, Armonk, NY, USA). Duncan’s multiple range tests were considered statistically significant at p ≤ 0.05. The samples were measured from different plants, analyzed in triplicate (n = 3), and shown as mean ± SD.

Supplementary Materials

Supplementary materials can be found at https://www.mdpi.com/1422-0067/20/8/2000/s1.

Author Contributions

M.L. planned, designed, and conducted the experiment and prepared the manuscript. Y.S. and X.L. collected the samples and helped in the analysis of the data. B.D. and S.M. revised the manuscript. D.Q. conceived and guided the experiment and revised the manuscript.

Funding

This work was supported by The Construction Fund of Plateau Discipline of Fujian Province and Fujian Agriculture and Forestry University Outstanding Doctoral Thesis Fund, China (102/712018011).

Acknowledgments

We are grateful for the 2-DE technical support provided by the Proteomics Laboratory of the College of Life Sciences, Fujian Agriculture and Forestry University.

Conflicts of Interest

The authors declare no conflict of interest.

References

  1. Vaknin, H.; Barakiva, A.; Ovadia, R.; Nissimlevi, A.; Forer, I.; Weiss, D.; Orenshamir, M. Active anthocyanin degradation in Brunfelsia calycina (yesterday–today–tomorrow) flowers. Planta 2005, 222, 19–26. [Google Scholar] [CrossRef] [PubMed]
  2. Michal, O.S. Does anthocyanin degradation play a significant role in determining pigment concentration in plants. Plant Sci. 2009, 177, 310–316. [Google Scholar]
  3. Markham, K.R.; Ryan, K.G.; Gould, K.S.; Rickards, G.K. Cell wall sited flavonoids in lisianthus flower petals. Phytochemistry 2000, 54, 681–687. [Google Scholar] [CrossRef]
  4. Kay, Q.O.N.; Daoud, H.S.; Stirton, C.H. Pigment distribution, light reflection and cell structure in petals. Bot. J. Linn. Soc. 2008, 83, 57–83. [Google Scholar] [CrossRef]
  5. Li, M.; Luo, Y.T.; Lu, X.C.; Sun, Y.T.; Qiu, D.L. Changes in Composition of Anthocyanins in Brunfelsia acuminata Flowers. J. Trop. Subtrop. Bot. 2018, 26, 627–632. [Google Scholar]
  6. Miller, R.; Owens, S.J.; Rørslett, B. Plants and colour: Flowers and pollination. Opt. Laser Technol. 2011, 43, 282–294. [Google Scholar] [CrossRef]
  7. Akifumi, A.; Hiroshi, Y.; Sato, A. Postharvest light irradiation and appropriate temperature treatment increase anthocyanin accumulation in grape berry skin. Postharvest Biol. Technol. 2019, 147, 89–99. [Google Scholar]
  8. Welch, C.R.; Wu, Q.; Simon, J.E. Recent Advances in Anthocyanin Analysis and Characterization. Curr. Anal. Chem. 2008, 4, 75. [Google Scholar] [CrossRef]
  9. Cheynier, V. Phenolic compounds: From plants to foods. Phytochem. Rev. 2012, 11, 153–177. [Google Scholar] [CrossRef]
  10. Wangia, C.; Orwa, J.; Muregi, F.; Kareru, P.; Cheruiyot, K.; Kibet, J. Comparative Anti-oxidant Activity of Aqueous and Organic Extracts from Kenyan Ruellia linearibracteolata and Ruellia bignoniiflora. Eur. J. Med. Plants 2016, 17, 1–7. [Google Scholar] [CrossRef]
  11. Liu, F.; Wang, M.; Wang, M. Phenolic compounds and antioxidant activities of flowers, leaves and fruits of five crabapple cultivars (Malus Mill. species). Sci. Hortic. 2018, 235, 460–467. [Google Scholar] [CrossRef]
  12. Nascimento, L.B.D.S.; Leal-Costa, M.V.; Menezes, E.A.; Lopes, V.R.; Muzitano, M.F.; Costa, S.S.; Tavares, E.S. Ultraviolet-B radiation effects on phenolic profile and flavonoid content of Kalanchoe pinnata. J. Photochem. Photobiol. B 2015, 148, 73–81. [Google Scholar] [CrossRef] [PubMed]
  13. Vera, H.; Angela, D.; Bernhard, E.; Richard, L.; Stefan, M.; Michael, A. Characterization and structural features of a chalcone synthase mutation in a white-flowering line of Matthiola incana R. Br. (Brassicaceae). Plant Mol. Biol. 2004, 55, 455–465. [Google Scholar]
  14. Zhang, X.; Liang, Z. Morphology, structure and ultrastructure of staminal nectary in Lamprocapnos (Fumarioideae, Papaveraceae). Flora 2018, 242, 128–136. [Google Scholar] [CrossRef]
  15. Avalos, A.A.; Lattar, E.C.; Galati, B.G.; Ferrucci, M.S. Nectary structure and ultrastructure in two floral morphs of Koelreuteria elegans subsp. formosana (Sapindaceae). Flora 2017, 226, 29–37. [Google Scholar] [CrossRef]
  16. Cao, Y.T.; Qiu, D.L. Cloning and Sequence Analysis of Chalcone Isomerase Gene (CHI) from Brunfelsia acuminata Flowers. Master’s Thesis, Fujian Agriculture and Forestry University, Fujian, China, April 2012. [Google Scholar]
  17. Naing, A.H.; Ai, T.N.; Su, M.J.; Park, K.I.; Lim, K.B.; Chang, K.K. Expression of RsMYB1 in chrysanthemum regulates key anthocyanin biosynthetic genes. Electron. J. Biotechnol. 2015, 18, 359–364. [Google Scholar] [CrossRef]
  18. Ai, T.N.; Naing, A.H.; Arun, M.; Su, M.J.; Chang, K.K. Expression of RsMYB1 in Petunia enhances anthocyanin production in vegetative and floral tissues. Sci. Hortic. 2017, 214, 58–65. [Google Scholar] [CrossRef]
  19. Yamagishi, M.; Uchiyama, H.; Handa, T. Floral pigmentation pattern in Oriental hybrid lily (Lilium spp.) cultivar ‘Dizzy’ is caused by transcriptional regulation of anthocyanin biosynthesis genes. J. Plant Physiol. 2018, 228, 85. [Google Scholar] [CrossRef] [PubMed]
  20. Zipor, G.; Duarte, P.; Carqueijeiro, I.; Shahar, L.; Ovadia, R.; Teper-Bamnolker, P.; Eshel, D.; Levin, Y.; Doron-Faigenboim, A.; Sottomayor, M. In planta anthocyanin degradation by a vacuolar class III peroxidase in Brunfelsia calycina flowers. New Phytol. 2015, 205, 653–665. [Google Scholar] [CrossRef]
  21. Wang, Z.Q.; Zhou, X.; Dong, L.; Guo, J.; Chen, Y.; Zhang, Y.; Wu, L.; Xu, M. iTRAQ-based analysis of the Arabidopsis proteome reveals insights into the potential mechanisms of anthocyanin accumulation regulation in response to phosphate deficiency. J. Proteomics 2018, 184, 39–53. [Google Scholar] [CrossRef]
  22. Li, X.; Jackson, A.; Xie, M.; Wu, D.; Tsai, W.C.; Zhang, S. Proteomic insights into floral biology. BBA Proteins Proteomics 2016, 1864, 1050–1060. [Google Scholar] [CrossRef]
  23. Farzad, M.; Griesbach, R.; Hammond, J.; Weiss, M.R.; Elmendorf, H.G. Differential expression of three key anthocyanin biosynthetic genes in a color-changing flower, Viola cornuta cv. Yesterday, Today and Tomorrow. Plant Sci. 2003, 165, 1333–1342. [Google Scholar] [CrossRef]
  24. Yamazaki, M.; Gong, Z.; Fukuchimizutani, M.; Fukui, Y.; Tanaka, Y.; Kusumi, T.; Saito, K. Molecular Cloning and Biochemical Characterization of a Novel Anthocyanin 5-O-Glucosyltransferase by mRNA Differential Display for Plant Forms Regarding Anthocyanin. J. Biol. Chem. 1999, 274, 7405. [Google Scholar] [CrossRef] [PubMed]
  25. Akita, Y.; Hase, Y.; Narumi, I.; Ishizaka, H.; Kondo, E.; Kameari, N.; Nakayama, M.; Tanikawa, N.; Morita, Y.; Tanaka, A. Isolation and characterization of the fragrant cyclamen -methyltransferase involved in flower coloration. Planta 2011, 234, 1127–1136. [Google Scholar] [CrossRef]
  26. Wei, K.; Wang, L.; Zhang, C.; Wu, L.; Li, H.; Zhang, F.; Cheng, H. Transcriptome Analysis Reveals Key Flavonoid 3′-Hydroxylase and Flavonoid 3′,5′-Hydroxylase Genes in Affecting the Ratio of Dihydroxylated to Trihydroxylated Catechins in Camellia sinensis. PLoS ONE 2015, 10, e0137925. [Google Scholar] [CrossRef]
  27. Seitz, C.; Ameres, S.; Schlangen, K.; Forkmann, G.; Halbwirth, H. Multiple evolution of flavonoid 3′,5′-hydroxylase. Planta 2015, 242, 561–573. [Google Scholar] [CrossRef] [PubMed]
  28. Li, M.; Cao, Y.T.; Ye, S.R.; Irshad, M.; Pan, T.F.; Qiu, D.L. Isolation of CHS Gene from Brunfelsia acuminata Flowers and Its Regulation in Anthocyanin Biosysthesis. Molecules 2016, 22, 44. [Google Scholar] [CrossRef] [PubMed]
  29. Wu, Y.Q.; Zhu, M.Y.; Jiang, Y.; Zhao, D.Q.; Tao, J. Molecular characterization of chalcone isomerase (CHI) regulating flower color in herbaceouspeony (PaeonialactifloraPall.). J. Integr. Agric. 2018, 17, 122–129. [Google Scholar] [CrossRef]
  30. Muir, S.R.; Collins, G.J.; Robinson, S.; Hughes, S.; Bovy, A.; de Vos, C.H.R.; van Tunen, A.J.; Martine, E.; Verhoeyen, M.E. Over expression of petunia chalcone isomerase in tomato results in fruit containing increased levels of flavonols. Nat. Biotechnol. 2001, 19, 470–474. [Google Scholar] [CrossRef] [PubMed]
  31. Barakiva, A.; Ovadia, R.; Rogachev, I.; Baror, C.; Bar, E.; Freiman, Z.; Nissimlevi, A.; Gollop, N.; Lewinsohn, E.; Aharoni, A. Metabolic networking in Brunfelsia calycina petals after flower opening. J. Exp. Bot. 2010, 61, 1393. [Google Scholar] [CrossRef]
  32. Liu, Y.; Tikunov, Y.; Schouten, R.E.; Marcelis, L.F.M.; Visser, R.G.F.; Bovy, A. Anthocyanin Biosynthesis and Degradation Mechanisms in SolanaceousVegetables: A Review. Front. Chem. 2018, 6, 1–17. [Google Scholar] [CrossRef]
  33. Zhang, Q.; Tian, Y.Y.; Meng, Y.E.; Li, Y.M.; Wang, H.J.; Wang, L.M.; Zhao, X.S. Research advance in genetic engineering of floral fragrance. J. Henan Agric. Sci. 2014, 43, 11–16. [Google Scholar]
  34. Gimenez, M.J.; Valverde, J.; Valero, D.; Diazmula, H.M.; Zapata, P.J.; Serrano, M.; Moral, J.M.; Castillo, S. Methyl salicylate treatments of sweet cherry trees improve fruit quality at harvest and during storage. Sci. Hortic. 2015, 197, 665–673. [Google Scholar] [CrossRef] [Green Version]
  35. Zhang, L.X.; Shi, Z.P. Research on the Cell Microstructure of Jasminum sambac’s Petal. J. Hunan Agric. Univ. 1999, 25, 108–111. [Google Scholar]
  36. Giordano, D.; Provenzano, S.; Ferrandino, A.; Vitali, M.; Pagliarani, C.; Roman, F.; Cardinale, F.; Castellarin, S.D.; Schubert, A. Characterization of a multifunctional caffeoyl-CoA O-methyltransferase activated in grape berries upon drought stress. Plant Physiol. Biochem. 2016, 101, 23. [Google Scholar] [CrossRef]
  37. Cui, N.; Yu, Z.H.; Han, M.L.; Dong, X.F.; Qu, B.; Li, T.L. Research Advancement of 14-3-3 Proteins in Plants. Acta Bot. Boreali Occident. Sin. 2012, 32, 843–851. [Google Scholar]
  38. Su, M.; Lv, J.H.; Zhang, Q.X. Research Advance in Floral Fragrance Genetic Engineering. J. Anhui Agric. Sci. 2007, 35, 3169–3171. [Google Scholar]
  39. Martens, S.; Mithöfer, A. Flavones and flavone synthases. Phytochemistry 2005, 66, 2399–2407. [Google Scholar] [CrossRef]
  40. Wang, L.; Zheng, Y.; Ding, S.; Zhang, Q.; Chen, Y.; Zhang, J. Molecular cloning, structure, phylogeny and expression analysis of the invertase gene family in sugarcane. BMC Plant Biol. 2017, 17, 109. [Google Scholar] [CrossRef]
  41. Wang, L.J. Advances on the studies of invertase on sucrose metabolism in higher plant. J. Agric. Sci. 2010, 31, 70–75. [Google Scholar]
  42. Walker, R.P.; Paoletti, A.; Leegood, R.C.; Famiani, F. Phosphorylation of phosphoenolpyruvate carboxykinase (PEPCK) and phosphoenolpyruvate carboxylase (PEPC) in the flesh of fruits. Plant Physiol. Biochem. 2016, 108, 323–327. [Google Scholar] [CrossRef]
  43. Chen, Z.; Xia, L.; He, Y.; Zhang, J.; Yan, T.; Liu, X. Physiological investigation of C4 -phosphoenolpyruvate-carboxylase-introduced rice line shows that sucrose metabolism is involved in the improved drought tolerance. Plant Physiol. Biochem. 2017, 115, 328–342. [Google Scholar]
  44. Silva, L.S.; Seabra, A.R.; Leitão, J.N.; Carvalho, H.G. Possible role of glutamine synthetase of the prokaryotic type (GSI-like) in nitrogen signaling in Medicago truncatula. Plant Sci. 2015, 240, 98–108. [Google Scholar] [CrossRef] [Green Version]
  45. Wang, L.; Hu, W.; Feng, J.; Yang, X.; Huang, Q.; Xiao, J.; Liu, Y.; Yang, G.; He, G. Identification of the ASR gene family from Brachypodium distachyon and functional characterization of BdASR1 in response to drought stress. Plant Cell Rep. 2016, 35, 1221–1234. [Google Scholar] [CrossRef]
  46. Langenkämper, G.; Manac’H, N.; Broin, M.; Cuiné, S.; Becuwe, N.; Kuntz, M.; Rey, P. Accumulation of plastid lipid-associated proteins (fibrillin/CDSP34) upon oxidative stress, ageing and biotic stress in Solanaceae and in response to drought in other species. J. Exp. Bot. 2001, 52, 1545. [Google Scholar] [CrossRef]
  47. Pan, Z.Y.; Liu, Q.; Yun, Z.; Rui, G.; Zeng, W.F.; Qiang, X.; Deng, X.X. Comparative proteomics of a lycopene-accumulating mutant reveals the important role of oxidative stress on carotenogenesis in sweet orange (Citrus sinensis [L.] Osbeck). Proteomics 2009, 9, 5455–5470. [Google Scholar] [CrossRef]
  48. Ihsan, U.; Bassam, O.A.J.; Khalid, M.S.A.G.; Hind, A.A.A.Z.; Yasir, A.; Ahmad, F.; Naser, A.K.; Mohammed, A.A. Endophytic bacteria isolated from Solanum nigrum L., alleviate cadmium (Cd) stress response by their antioxidant potentials, including SOD synthesis by sodA gene. Ecotoxicol. Environ. Saf. 2019, 174, 197–207. [Google Scholar]
  49. Faten, H.F.; Riadh, K.; Chedly, A. Total phenolic, flavonoid and tannin contents and antioxidant andantimicrobial activities of organic extracts of shoots of the plant Limonium delicatulum. J. Taibah Univ. Sci. 2014, 8, 216–224. [Google Scholar]
  50. Quintá, H.R.; Galigniana, N.M.; Erlejman, A.G.; Lagadari, M.; Piwien-Pilipuk, G.; Galigniana, M.D. Management of cytoskeleton architecture by molecular chaperones and immunophilins. Cell. Signal. 2011, 23, 1907–1920. [Google Scholar] [CrossRef] [Green Version]
  51. Orenshamir, M.O.M.; Dela, G.D.G.; Ovadia, R.O.R.; Nissimlevi, A.N.A.; Philosophhadas, S.P.S.; Meir, S.M.S. Differentiation between petal blueing and senescence of cut ‘Mercedes’ rose flowers. J. Hortic. Sci. Biotechnol. 2015, 76, 195–200. [Google Scholar]
  52. Meng, J.F.; Xu, T.F.; Wang, Z.Z.; Fang, Y.L.; Xi, Z.M.; Zhang, Z.W. The ameliorative effects of exogenous melatonin on grape cuttings under water-deficient stress: Antioxidant metabolites, leaf anatomy, and chloroplast morphology. J. Pineal Res. 2015, 57, 200–212. [Google Scholar] [CrossRef] [PubMed]
  53. Wang, S.; Pan, D.; Lv, X.; Song, X.; Qiu, Z.; Huang, C.; Huang, R.; Wei, C. Proteomic approach reveals that starch degradation contributes to anthocyanin accumulation in tuberous root of purple sweet potato. J. Proteomics 2016, 143, 298–305. [Google Scholar] [CrossRef]
  54. Bradford, M.M. A rapid and sensitive method for the quantitation of microgram quantities of protein utilizing the principle of protein-dye binding. Anal. Biochem. 1976, 72, 248–254. [Google Scholar] [CrossRef]
  55. Zhang, C.; Wang, W.; Wang, Y.; Gao, S.; Du, D.; Fu, J.; Dong, L. Anthocyanin biosynthesis and accumulation in developing flowers of tree peony (Paeonia suffruticosa) ‘Luoyang Hong’. Postharvest Biol. Technol. 2014, 97, 11–22. [Google Scholar] [CrossRef]
  56. Sangeeta, M.; Muhammad, I.; Biswojit, D.; Lu, X.C.; Li, M.; Chandra, K.D.; Hafiz, M.R.; Qiu, Z.P.; Qiu, D.L. Effect of vineyard soil variability on chlorophyll fluorescence, yield and quality of table grape as influenced by soil moisture, grown under double cropping system in protected condition. Peer J. 2018, 9, 9–25. [Google Scholar]
  57. Wang, W.X. Principles and Techniques of Plant Physiological Biochemical Experiments; Higher Education Press: Beijing, China, 2006; pp. 282–286. [Google Scholar]
Figure 1. Changes of corolla diameter, water content, anthocyanin content, flavonoid content, and total phenolic content of B. acuminata petals. The different petals during anthocyanin degradation and the corolla diameter and water content changes after flower opening in petals (A); the contents of total anthocyanin (B), flavonoid content (C), and total phenolic content (D) in the petals. Note: Values (mean ± SD) were determined from three independent experiments (n = 3). Different letters above the bars indicate a significant difference at p < 0.05.
Ijms 20 02000 g001
Figure 2. The pigment distribution and ultrastructure of epidermal cells in different days. Longitudinal section of the petal epidermis (A) and the petal upper epidermis under a microscope magnified 20 times (B); the petals of ultrastructure in upper epidermis of 10 µm (C).
Ijms 20 02000 g002
Figure 3. The heat map visualization of differential abundance of the identified 52 proteins in B. acuminata petals. The upregulated and downregulated proteins are indicated from red to green, respectively. The color scale is shown at the left of the cluster.
Ijms 20 02000 g003
Figure 4. Functional classification and expression of identified proteins in B. acuminata petals.
Ijms 20 02000 g004
Figure 5. The expression levels of key genes of anthocyanin synthesis in different days. Values (mean ± SD) were determined from three independent experiments (n = 3). Different letters above the bars indicate a significant difference at p < 0.05.
Ijms 20 02000 g005
Figure 6. Volatile components were detected in different days of B. acuminata petals.
Ijms 20 02000 g006
Figure 7. Activity of antioxidant-related enzymes, superoxide dismutase (SOD) (A), catalase (CAT) (B), soluble protein content (C), peroxidase (POD) (D), and in B. acuminata petals during blooming. Values (mean ± SD) were determined from three independent experiments (n = 3). Different letters above the bars indicate a significant difference at p < 0.05.
Ijms 20 02000 g007
Figure 8. A putative metabolic map described the pathway including the floral scent metabolic pathway and lignin pathway during the degradation of anthocyanins in B. acuminata petals. The diagram shows the different pathways. The diagram summarizes the results of qRT-PCR, MALDI-TOF/TOF and GC-TOF-MS analyses. The dashed black arrows represent several consecutive enzymatic steps. The color of the box indicates the method by which they were identified. The red arrow represents up or down and the symbol with * in the picture is expressed as an important substance identified in the petals. Enzymes: SAMT, salicylic acid carboxyl methyltransferase; COMT, catechol O-methyl transferase; CCoA-OMT, caffeoyl-CoA O-methyl; OMT, Anthocyanin-O-methyl transferase. Genes: CHS, chalcone synthase; CHI, chalcone isomerase; F3′5′H, flavonoid 3′5′-hydroxylase.
Ijms 20 02000 g008
Table 1. Identification of proteins from B. acuminata petals using MALDI-TOF/TOF-MS.
Spot No aProtein NameSpeciesAccession No.MW (kDa)/pI bScoreCov cFold Changes e
Carbohydrate and Energy Metabolism Pathway
D5 dmalate dehydrogenase, cytoplasmic-likeSolanum lycopersicumgi|46040452935.361/5.9123525%−2.33−1.55
D102,3-bisphosphoglycerate-independent phosphoglycerate mutase-likeGlycine maxgi|35656827060.799/5.5824711%−1.92−1.32
D193-isopropylmalate dehydrogenase, chloroplastic-likeSolanum lycopersicumgi|46038644043.396/6.0523214%−2.06−1.25
U23 dATP synthase beta subunitEleutherococcus senticosusgi|34341068539.790/5.7722735%1.201.18
U24soluble acid invertase 2Orobanche ramosagi|29461207261.628/5.2413319%2.071.51
U29vacuolar invertase 2Gossypium hirsutumgi|26852657069.303/5.141858%2.161.98
U32ATP synthase subunit beta, mitochondrial-likeSolanum lycopersicumgi|46038247459.825/5.9486945%2.261.46
U45ATP synthase subunit beta, mitochondrial-likeSolanum lycopersicumgi|46038247459.825/5.9431126%3.002.71
U46phosphoenolpyruvate carboxylase kinase 1Clusia minorgi|3984245128.716/6.388822%13.0910.67
U49ATP synthase beta subunitEleutherococcus senticosusgi|34341068539.790/5.7722729%2.402.26
U521,2-beta-fructan 1F-fructosyltransferaseHelianthus tuberosusgi|336769069.214/5.0212912%2.112.00
Anthocyanin Metabolic Pathway
D14Anthocyanin-O-methyl transferaseSolanum tuberosumgi|44143351526.282/5.699019%−7.04−1.04
D17Anthocyanin-5-O-glucosyltransferasePetunia x hybridagi|668305252.130/5.079813%−13.79−1.04
D18Anthocyanin-5-O-glucosyltransferasePetunia x hybridagi|668305252.130/5.071007%−3.94−1.36
Lignin Biosynthesis Pathway
U41caffeate-O-methyltransferaseLiquidambar styracifluagi|573200039.944/5.698022%4.703.77
U47caffeoyl-CoA O-methyltransferaseBroussonetia papyriferagi|4639446427.701/5.3141240%5.253.44
Stress Defense and Senescence Proteins
D1polyphenol oxidase E, chloroplastic-like isoform 2Solanum lycopersicumgi|46040103566.181/6.368318%−2.66−1.02
D2polyphenol oxidaseNicotiana tabacumgi|9291906857.748/5.9212613%−2.10−1.02
D6proteasome subunit alpha type-6-likeSolanum lycopersicumgi|46041261327.301/6.1110232%−4.08−1.37
U8glutathione S-transferaseSolanum commersoniigi|14861616223.843/5.988230%1.341.53
D13lactoylglutathione lyase-likeSolanum lycopersicumgi|46037380732.839/5.9528332%−2.00−1.07
U25ASR1 proteinSolanum ochranthumgi|32115541712.547/6.4830734%31.3323.55
U28CLPCTheobroma cacaogi|508775360102.257/6.3637327%3.451.12
U35S-adenosyl methionine synthase-likeSolanum tuberosumgi|7819144243.189/5.5246640%2.112.01
U43glutathione S-transferase L3-likeCicer arietinumgi|50212179527.092/5.799115%1.591.51
U44putative glutathione S-transferase zeta-class 2Brassica napusgi|33025047825.336/5.538224%2.141.49
D3Adenylosuccinate synthetase, chloroplastic-likeSolanum lycopersicumgi|46040766955.408/7.558714%−2.39−1.04
D4Adenylosuccinate synthetase1, chloroplastic-likeSolanum lycopersicumgi|46040766955.408/7.559318%−2.11−1.38
D15Aspartic proteinaseTheobroma cacaogi|50871987454.428/5.56553%−7.85−1.08
D16endochitinase precursorHumulus lupulusgi|496004933.508/7.421094%−3.09−1.10
U20Small ubiquitin-related modifier 1Arabidopsis thalianagi|2154246210.969/4.917748%9.191.68
U26annexin p34-like protein-likeSolanum tuberosumgi|8107412735.909/5.5417424%2.011.59
U27Glutamine synthetase 1,4Theobroma cacaogi|50870724739.098/6.0216018%5.212.86
U51heat shock 70 proteinSpinacia oleraceagi|277305076.094/5.1955425%2.021.07
U53Plastid-lipid-associated protein, chloroplast precursor, putativeRicinus communisgi|22353637134.979/4.8414824%2.061.78
Floral scent Metabolic Pathway
U331-hydroxy-2-methyl-2-(E)-butenyl 4-diphosphate reductaseIpomoea batatasgi|32555769051.682/5.9016327%2.582.20
U341-deoxy-D-xylulose-5-phosphate reductoisomeraseSolanum lycopersicumgi|35053752751.465/5.9426627%2.011.49
U39SAMTAnthocercis littoreagi|5820145632.353/4.7915122%2.111.62
U40Putative S-adenosyl-L-methionine:Salicylic acid carboxyl methyltransferasePisum sativumgi|3772594940.552/5.177819%15.057.00
U42putative S-adenosyl-L-methionine:Salicylic acid carboxyl methyltransferasePisum sativumgi|3772594940.552/5.17525%2.231.56
Signaling and Photosynthesis
D11inositol-3-phosphate synthaseSolanum lycopersicumgi|46038868156.526/5.4518923%−2.79−1.02
D12inositol-3-phosphate synthaseSolanum lycopersicumgi|46038868156.526/5.4531823%−2.84−1.51
U2214-3-3-like protein GF14 PsiEutrema salsugineumgi|30995205928.752/4.7816648%2.071.81
U31ruBisCO large subunit-binding protein subunit beta, chloroplastic-likeCicer arietinumgi|50212549962.800/5.8534822%2.151.26
Cytoskeleton and Chaperone
U30chaperonin CPN60-2, mitochondrial-likeSolanum lycopersicumgi|46040468261.521/5.5117518%2.371.99
U36beta-actinZoysia japonicagi|28415781041.697/5.2345935%2.212.11
U37actin 6Populus trichocarpagi|22286071340.592/5.0516627%1.851.43
U38actinGossypium hirsutumgi|3218690441.878/5.398227%2.52.25
U5060-kDa chaperonin-60 alpha-polypeptide precursor, partialBrassica napusgi|28936557.657/4.8440324%2.611.93
Unclassified Protein
D7predicted proteinPhyscomitrella patens subsp. Patensgi|16266796628.780/5.387911%−2.13−1.11
D9putative transcription factor BTF3-likeSolanum tuberosumgi|8262343117.472/6.3124034%−2.06−1.12
U48cp10-like proteinCP10Gossypium hirsutumgi|2178018726.761/7.771229%1.301.73
a Spot number corresponds to the 2-DE gel in Figure S1; b theoretical molecular mass (MW) and isoelectric point (pI) of the homologous protein calculated with a tool available at NCBInr database.; c sequence coverage; d D down-regulated proteins, U up-regulated proteins.; e ratio of protein levels compared to day 1 (left: Day 3/Day 1, right: Day 5/Day 1).
Table 2. Main terpenoids were detected in different days of B. acuminata petals.
NumberCompoundsRelative Contents (%)
1d3d5d
1Linalool37.59 ± 8.3931.27 ± 2.1219.24 ± 4.12
22-Hexenal, (E)-44.92 ± 5.1120.98 ± 1.29
3trans-Linalool oxide (furanoid)5.91 ± 1.4711.61 ± 1.588.27 ± 1.56
4(E)-4,8-Dimethylnona-1,3,7-triene9.62 ± 5.289.81 ± 1.0710.11 ± 6.31
52-Furanmethanol, 5-ethenyltetrahydro-à,à,5-trimethyl-, cis-3.47 ± 0.429.34 ± 1.606.07 ± 1.37
61-Hexanol5.22 ± 0.835.13 ± 1.2512.53 ± 5.98
7Benzeneacetaldehyde0.67 ± 0.204.15 ± 1.7011.40 ± 0.85
82-Hexenal0.74 ± 0.440.45 ± 0.1316.78 ± 1.43

