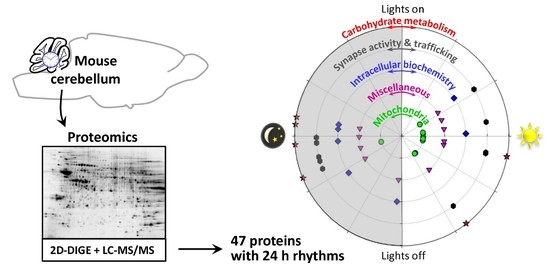
Circadian Analysis of the Mouse Cerebellum Proteome


 and
and
Abstract
1. Introduction
2. Results
3. Discussion
3.1. Rhythmic Proteins in Mitochondria of Cerebellar Cells
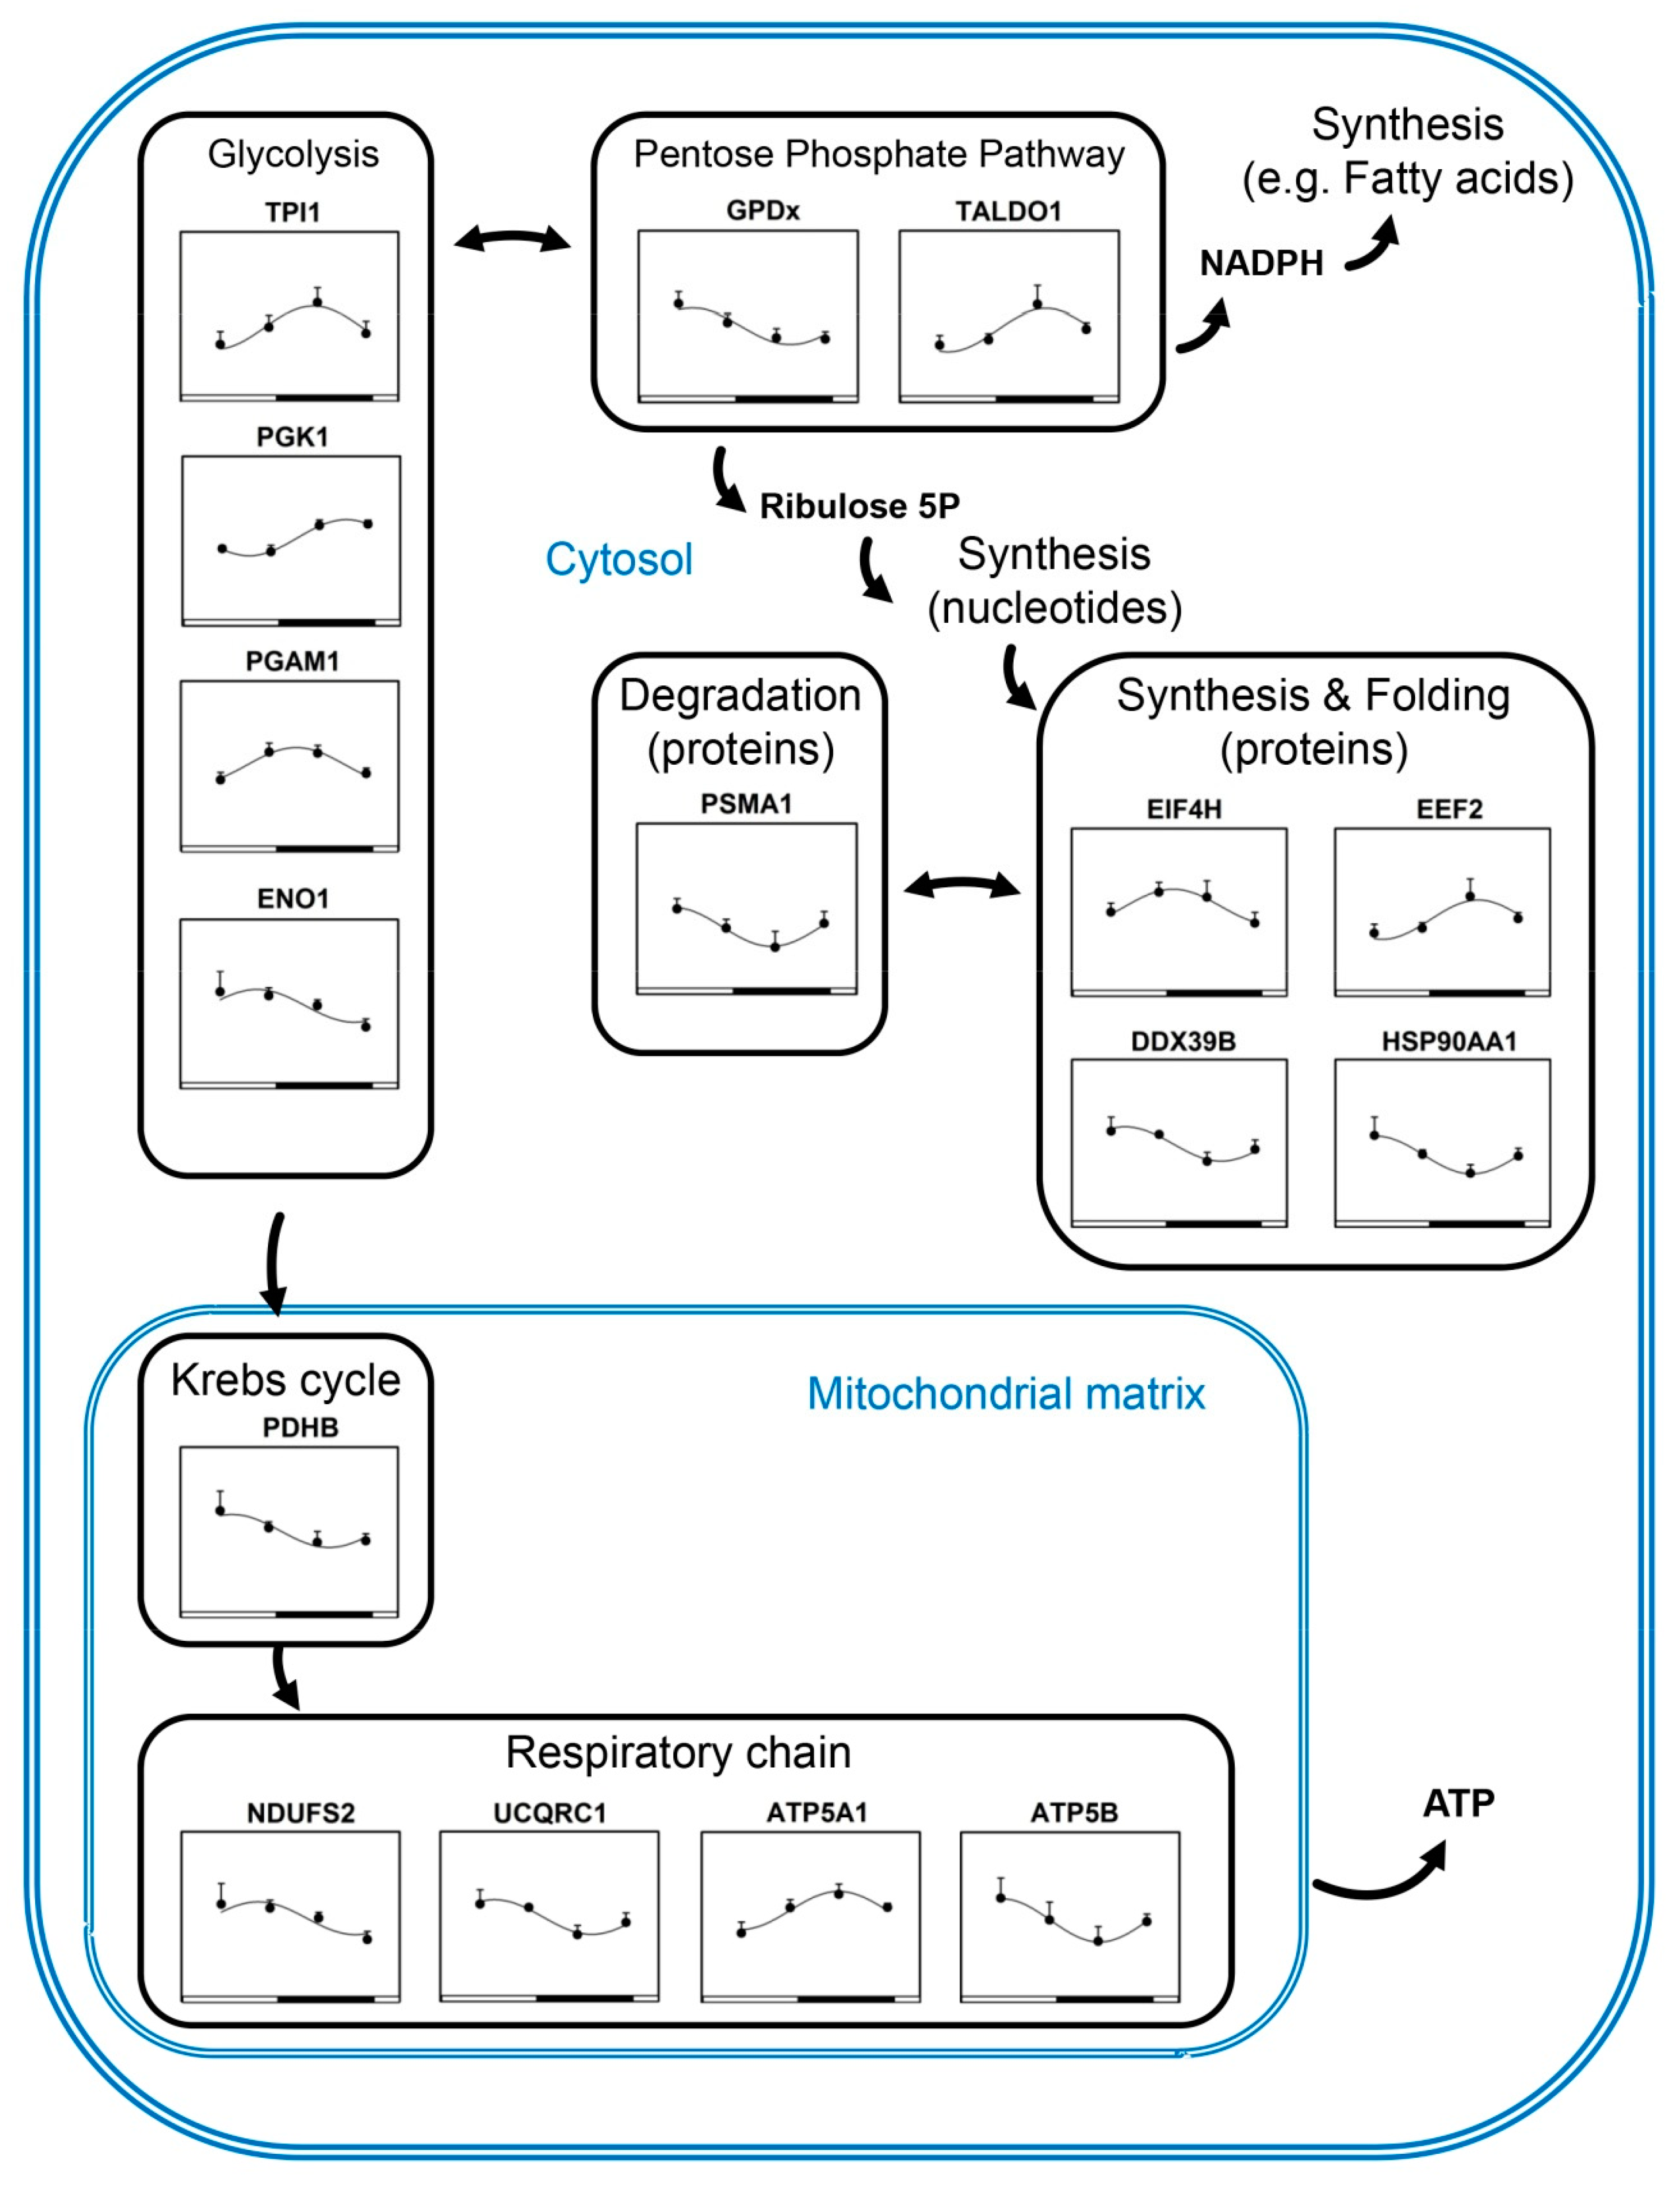
3.2. Rhythmic Proteins in the Cytosol of Cerebellar Cells
4. Materials and Methods
4.1. Ethical Statement
4.2. Animals and Study Design
4.3. Cerebellum 2D-DIGE-MS Analysis
4.4. Western-Blot Analyses
4.5. RNA Extraction and Real-Time qPCR Analysis
4.6. Statistical Analysis
5. Conclusions
Supplementary Materials
Author Contributions
Funding
Acknowledgments
Conflicts of Interest
Abbreviations
| 2D-DIGE | Two-dimensional difference in gel electrophoresis |
| CT | Circadian time (CT12 corresponding to activity onset in nocturnal mice housed in constant darkness) |
| HSP | Heat shock protein |
| MS | Mass spectrometry |
| qPCR | Quantitative polymerase chain reaction |
| SEM | Standard error of the mean |
| WT | Wild-type |
| ZT | Zeitgeber time (ZT0 and ZT12 corresponding to lights on and off, respectively) |
References
- Dibner, C.; Schibler, U.; Albrecht, U. The mammalian circadian timing system: Organization and coordination of central and peripheral clocks. Annu. Rev. Physiol. 2010, 72, 517–549. [Google Scholar] [CrossRef] [PubMed]
- Guilding, C.; Piggins, H.D. Challenging the omnipotence of the suprachiasmatic timekeeper: Are circadian oscillators present throughout the mammalian brain? Eur. J. Neurosci. 2007, 25, 3195–3216. [Google Scholar] [CrossRef] [PubMed]
- Takahashi, J.S. Transcriptional architecture of the mammalian circadian clock. Nat. Rev. Genet. 2017, 18, 164–179. [Google Scholar] [CrossRef] [PubMed]
- Preitner, N.; Damiola, F.; Lopez-Molina, L.; Zakany, J.; Duboule, D.; Albrecht, U.; Schibler, U. The orphan nuclear receptor REV-ERBalpha controls circadian transcription within the positive limb of the mammalian circadian oscillator. Cell 2002, 110, 251–260. [Google Scholar] [CrossRef]
- Guillaumond, F.; Dardente, H.; Giguere, V.; Cermakian, N. Differential control of Bmal1 circadian transcription by REV-ERB and ROR nuclear receptors. J. Biol. Rhythms 2005, 20, 391–403. [Google Scholar] [CrossRef]
- Crumbley, C.; Burris, T.P. Direct regulation of CLOCK expression by REV-ERB. PLoS ONE 2011, 6, e17290. [Google Scholar] [CrossRef] [PubMed]
- Hirano, A.; Fu, Y.H.; Ptacek, L.J. The intricate dance of post-translational modifications in the rhythm of life. Nat. Struct. Mol. Biol. 2016, 23, 1053–1060. [Google Scholar] [CrossRef]
- Robles, M.S.; Humphrey, S.J.; Mann, M. Phosphorylation Is a Central Mechanism for Circadian Control of Metabolism and Physiology. Cell. Metab. 2017, 25, 118–127. [Google Scholar] [CrossRef]
- Mendoza, J.; Pevet, P.; Felder-Schmittbuhl, M.P.; Bailly, Y.; Challet, E. The cerebellum harbors a circadian oscillator involved in food anticipation. J. Neurosci. 2010, 30, 1894–1904. [Google Scholar] [CrossRef]
- Rath, M.F.; Rohde, K.; Moller, M. Circadian oscillations of molecular clock components in the cerebellar cortex of the rat. Chronobiol. Int. 2012, 29, 1289–1299. [Google Scholar] [CrossRef]
- Siepka, S.M.; Yoo, S.H.; Park, J.; Song, W.; Kumar, V.; Hu, Y.; Lee, C.; Takahashi, J.S. Circadian mutant Overtime reveals F-box protein FBXL3 regulation of cryptochrome and period gene expression. Cell 2007, 129, 1011–1023. [Google Scholar] [CrossRef]
- Mendoza, J.; Graff, C.; Dardente, H.; Pevet, P.; Challet, E. Feeding cues alter clock gene oscillations and photic responses in the suprachiasmatic nuclei of mice exposed to a light/dark cycle. J. Neurosci. 2005, 25, 1514–1522. [Google Scholar] [CrossRef] [PubMed]
- Feillet, C.A.; Ripperger, J.A.; Magnone, M.C.; Dulloo, A.; Albrecht, U.; Challet, E. Lack of food anticipation in Per2 mutant mice. Curr. Biol. 2006, 16, 2016–2022. [Google Scholar] [CrossRef] [PubMed]
- Manto, M.; Bower, J.M.; Conforto, A.B.; Delgado-Garcia, J.M.; da Guarda, S.N.; Gerwig, M.; Habas, C.; Hagura, N.; Ivry, R.B.; Marien, P.; et al. Consensus paper: Roles of the cerebellum in motor control—The diversity of ideas on cerebellar involvement in movement. Cerebellum 2012, 11, 457–487. [Google Scholar] [CrossRef] [PubMed]
- Mauvoisin, D.; Wang, J.; Jouffe, C.; Martin, E.; Atger, F.; Waridel, P.; Quadroni, M.; Gachon, F.; Naef, F. Circadian clock-dependent and -independent rhythmic proteomes implement distinct diurnal functions in mouse liver. Proc. Natl. Acad. Sci. USA 2014, 111, 167–172. [Google Scholar] [CrossRef]
- Reddy, A.B.; Karp, N.A.; Maywood, E.S.; Sage, E.A.; Deery, M.; O’Neill, J.S.; Wong, G.K.; Chesham, J.; Odell, M.; Lilley, K.S.; et al. Circadian orchestration of the hepatic proteome. Curr. Biol. 2006, 16, 1107–1115. [Google Scholar] [CrossRef]
- Deery, M.J.; Maywood, E.S.; Chesham, J.E.; Sladek, M.; Karp, N.A.; Green, E.W.; Charles, P.D.; Reddy, A.B.; Kyriacou, C.P.; Lilley, K.S.; et al. Proteomic analysis reveals the role of synaptic vesicle cycling in sustaining the suprachiasmatic circadian clock. Curr. Biol. 2009, 19, 2031–2036. [Google Scholar] [CrossRef]
- Chiang, C.K.; Mehta, N.; Patel, A.; Zhang, P.; Ning, Z.; Mayne, J.; Sun, W.Y.; Cheng, H.Y.; Figeys, D. The proteomic landscape of the suprachiasmatic nucleus clock reveals large-scale coordination of key biological processes. PLoS Genet. 2014, 10, e1004695. [Google Scholar] [CrossRef]
- Namihira, M.; Honma, S.; Abe, H.; Tanahashi, Y.; Ikeda, M.; Honma, K. Daily variation and light responsiveness of mammalian clock gene, Clock and BMAL1, transcripts in the pineal body and different areas of brain in rats. Neurosci. Lett. 1999, 267, 69–72. [Google Scholar] [CrossRef]
- Gerstner, J.R.; Bremer, Q.Z.; Vander Heyden, W.M.; Lavaute, T.M.; Yin, J.C.; Landry, C.F. Brain fatty acid binding protein (Fabp7) is diurnally regulated in astrocytes and hippocampal granule cell precursors in adult rodent brain. PLoS ONE 2008, 3, e1631. [Google Scholar] [CrossRef]
- Schnell, A.; Chappuis, S.; Schmutz, I.; Brai, E.; Ripperger, J.A.; Schaad, O.; Welzl, H.; Descombes, P.; Alberi, L.; Albrecht, U. The nuclear receptor REV-ERBalpha regulates Fabp7 and modulates adult hippocampal neurogenesis. PLoS ONE 2014, 9, e99883. [Google Scholar] [CrossRef]
- Moller, M.; Sparre, T.; Bache, N.; Roepstorff, P.; Vorum, H. Proteomic analysis of day-night variations in protein levels in the rat pineal gland. Proteomics 2007, 7, 2009–2018. [Google Scholar] [CrossRef]
- Neufeld-Cohen, A.; Robles, M.S.; Aviram, R.; Manella, G.; Adamovich, Y.; Ladeuix, B.; Nir, D.; Rousso-Noori, L.; Kuperman, Y.; Golik, M.; et al. Circadian control of oscillations in mitochondrial rate-limiting enzymes and nutrient utilization by PERIOD proteins. Proc. Natl. Acad. Sci. USA 2016, 113, E1673–E1682. [Google Scholar] [CrossRef]
- Fustin, J.M.; Doi, M.; Yamada, H.; Komatsu, R.; Shimba, S.; Okamura, H. Rhythmic nucleotide synthesis in the liver: Temporal segregation of metabolites. Cell. Rep. 2012, 1, 341–349. [Google Scholar] [CrossRef]
- Schmitt, K.; Grimm, A.; Dallmann, R.; Oettinghaus, B.; Restelli, L.M.; Witzig, M.; Ishihara, N.; Mihara, K.; Ripperger, J.A.; Albrecht, U.; et al. Circadian Control of DRP1 Activity Regulates Mitochondrial Dynamics and Bioenergetics. Cell. Metab. 2018, 27, 657–666. [Google Scholar] [CrossRef]
- Tsuji, T.; Hirota, T.; Takemori, N.; Komori, N.; Yoshitane, H.; Fukuda, M.; Matsumoto, H.; Fukada, Y. Circadian proteomics of the mouse retina. Proteomics 2007, 7, 3500–3508. [Google Scholar] [CrossRef]
- Hurley, J.M.; Jankowski, M.S.; De Los Santos, H.; Crowell, A.M.; Fordyce, S.B.; Zucker, J.D.; Kumar, N.; Purvine, S.O.; Robinson, E.W.; Shukla, A.; et al. Circadian Proteomic Analysis Uncovers Mechanisms of Post-Transcriptional Regulation in Metabolic Pathways. Cell. Syst. 2018, 7, 613–626. [Google Scholar] [CrossRef]
- Harting, K.; Knoll, B. SIRT2-mediated protein deacetylation: An emerging key regulator in brain physiology and pathology. Eur. J. Cell. Biol. 2010, 89, 262–269. [Google Scholar] [CrossRef]
- Gomes, P.; Fleming Outeiro, T.; Cavadas, C. Emerging Role of Sirtuin 2 in the Regulation of Mammalian Metabolism. Trends Pharmacol. Sci. 2015, 36, 756–768. [Google Scholar] [CrossRef]
- Honrath, B.; Metz, I.; Bendridi, N.; Rieusset, J.; Culmsee, C.; Dolga, A.M. Glucose-regulated protein 75 determines ER-mitochondrial coupling and sensitivity to oxidative stress in neuronal cells. Cell Death Discov. 2017, 3, 17076. [Google Scholar] [CrossRef]
- Zuehlke, A.D.; Beebe, K.; Neckers, L.; Prince, T. Regulation and function of the human HSP90AA1 gene. Gene 2015, 570, 8–16. [Google Scholar] [CrossRef]
- Furay, A.R.; Murphy, E.K.; Mattson, M.P.; Guo, Z.; Herman, J.P. Region-specific regulation of glucocorticoid receptor/HSP90 expression and interaction in brain. J. Neurochem. 2006, 98, 1176–1184. [Google Scholar] [CrossRef]
- Awasthi, S.; Chakrapani, B.; Mahesh, A.; Chavali, P.L.; Chavali, S.; Dhayalan, A. DDX39B promotes translation through regulation of pre-ribosomal RNA levels. RNA Biol. 2018, 15, 1157–1166. [Google Scholar] [CrossRef]
- Parsyan, A.; Svitkin, Y.; Shahbazian, D.; Gkogkas, C.; Lasko, P.; Merrick, W.C.; Sonenberg, N. mRNA helicases: The tacticians of translational control. Nat. Rev. Mol. Cell. Biol. 2011, 12, 235–245. [Google Scholar] [CrossRef]
- Delaidelli, A.; Jan, A.; Herms, J.; Sorensen, P.H. Translational control in brain pathologies: Biological significance and therapeutic opportunities. Acta Neuropathol. 2019. [Google Scholar] [CrossRef]
- Nogradi, A.; Domoki, F.; Degi, R.; Borda, S.; Pakaski, M.; Szabo, A.; Bari, F. Up-regulation of cerebral carbonic anhydrase by anoxic stress in piglets. J. Neurochem. 2003, 85, 843–850. [Google Scholar] [CrossRef]
- Kernek, K.L.; Trofatter, J.A.; Mayeda, A.R.; Lahiri, D.K.; Hofstetter, J.R. A single copy of carbonic anhydrase 2 restores wild-type circadian period to carbonic anhydrase II-deficient mice. Behav. Genet. 2006, 36, 301–308. [Google Scholar] [CrossRef]
- Hofstetter, J.R.; Gifford, K.L.; Trofatter, J.A.; Mayeda, A.R. Altered circadian period of locomotor activity in carbonic anhydrase II-deficient mice. Biol. Rhythm. Res. 1999, 30, 517–528. [Google Scholar] [CrossRef]
- Welsh, D.K.; Takahashi, J.S.; Kay, S.A. Suprachiasmatic nucleus: Cell autonomy and network properties. Annu. Rev. Physiol. 2010, 72, 551–577. [Google Scholar] [CrossRef]
- Gillette, M.U.; Reppert, S.M. The hypothalamic suprachiasmatic nuclei: Circadian patterns of vasopressin secretion and neuronal activity in vitro. Brain Res. Bull. 1987, 19, 135–139. [Google Scholar] [CrossRef]
- Mordel, J.; Karnas, D.; Pevet, P.; Isope, P.; Challet, E.; Meissl, H. The output signal of Purkinje cells of the cerebellum and circadian rhythmicity. PLoS ONE 2013, 8, e58457. [Google Scholar] [CrossRef]
- Servais, L.; Bearzatto, B.; Schwaller, B.; Dumont, M.; De Saedeleer, C.; Dan, B.; Barski, J.J.; Schiffmann, S.N.; Cheron, G. Mono- and dual-frequency fast cerebellar oscillation in mice lacking parvalbumin and/or calbindin D-28k. Eur. J. Neurosci. 2005, 22, 861–870. [Google Scholar] [CrossRef] [PubMed]
- Rosahl, T.W.; Spillane, D.; Missler, M.; Herz, J.; Selig, D.K.; Wolff, J.R.; Hammer, R.E.; Malenka, R.C.; Sudhof, T.C. Essential functions of synapsins I and II in synaptic vesicle regulation. Nature 1995, 375, 488–493. [Google Scholar] [CrossRef] [PubMed]
- Lin, R.C.; Scheller, R.H. Mechanisms of synaptic vesicle exocytosis. Annu. Rev. Cell. Dev. Biol. 2000, 16, 19–49. [Google Scholar] [CrossRef] [PubMed]
- Zheng, B.; Albrecht, U.; Kaasik, K.; Sage, M.; Lu, W.; Vaishnav, S.; Li, Q.; Sun, Z.S.; Eichele, G.; Bradley, A.; et al. Nonredundant roles of the mPer1 and mPer2 genes in the mammalian circadian clock. Cell 2001, 105, 683–694. [Google Scholar] [CrossRef]
- Zheng, B.; Larkin, D.W.; Albrecht, U.; Sun, Z.S.; Sage, M.; Eichele, G.; Lee, C.C.; Bradley, A. The mPer2 gene encodes a functional component of the mammalian circadian clock. Nature 1999, 400, 169–173. [Google Scholar] [CrossRef]
- Plumel, M.I.; Stier, A.; Thierse, D.; van Dorsselaer, A.; Criscuolo, F.; Bertile, F. Litter size manipulation in laboratory mice: An example of how proteomic analysis can uncover new mechanisms underlying the cost of reproduction. Front. Zool. 2014, 11, 41. [Google Scholar] [CrossRef][Green Version]
- Carapito, C.; Burel, A.; Guterl, P.; Walter, A.; Varrier, F.; Bertile, F.; Van Dorsselaer, A. MSDA, a proteomics software suite for in-depth Mass Spectrometry Data Analysis using grid computing. Proteomics 2014, 14, 1014–1019. [Google Scholar] [CrossRef]
- Vizcaino, J.A.; Csordas, A.; del-Toro, N.; Dianes, J.A.; Griss, J.; Lavidas, I.; Mayer, G.; Perez-Riverol, Y.; Reisinger, F.; Ternent, T.; et al. 2016 update of the PRIDE database and its related tools. Nucleic Acids Res. 2016, 44, D447–D456. [Google Scholar] [CrossRef]
- R Development Core Team. R: A Language and Environment for Statistical Computing; R Foundation for Statistical Computing: Vienna, Austria, 2008. [Google Scholar]


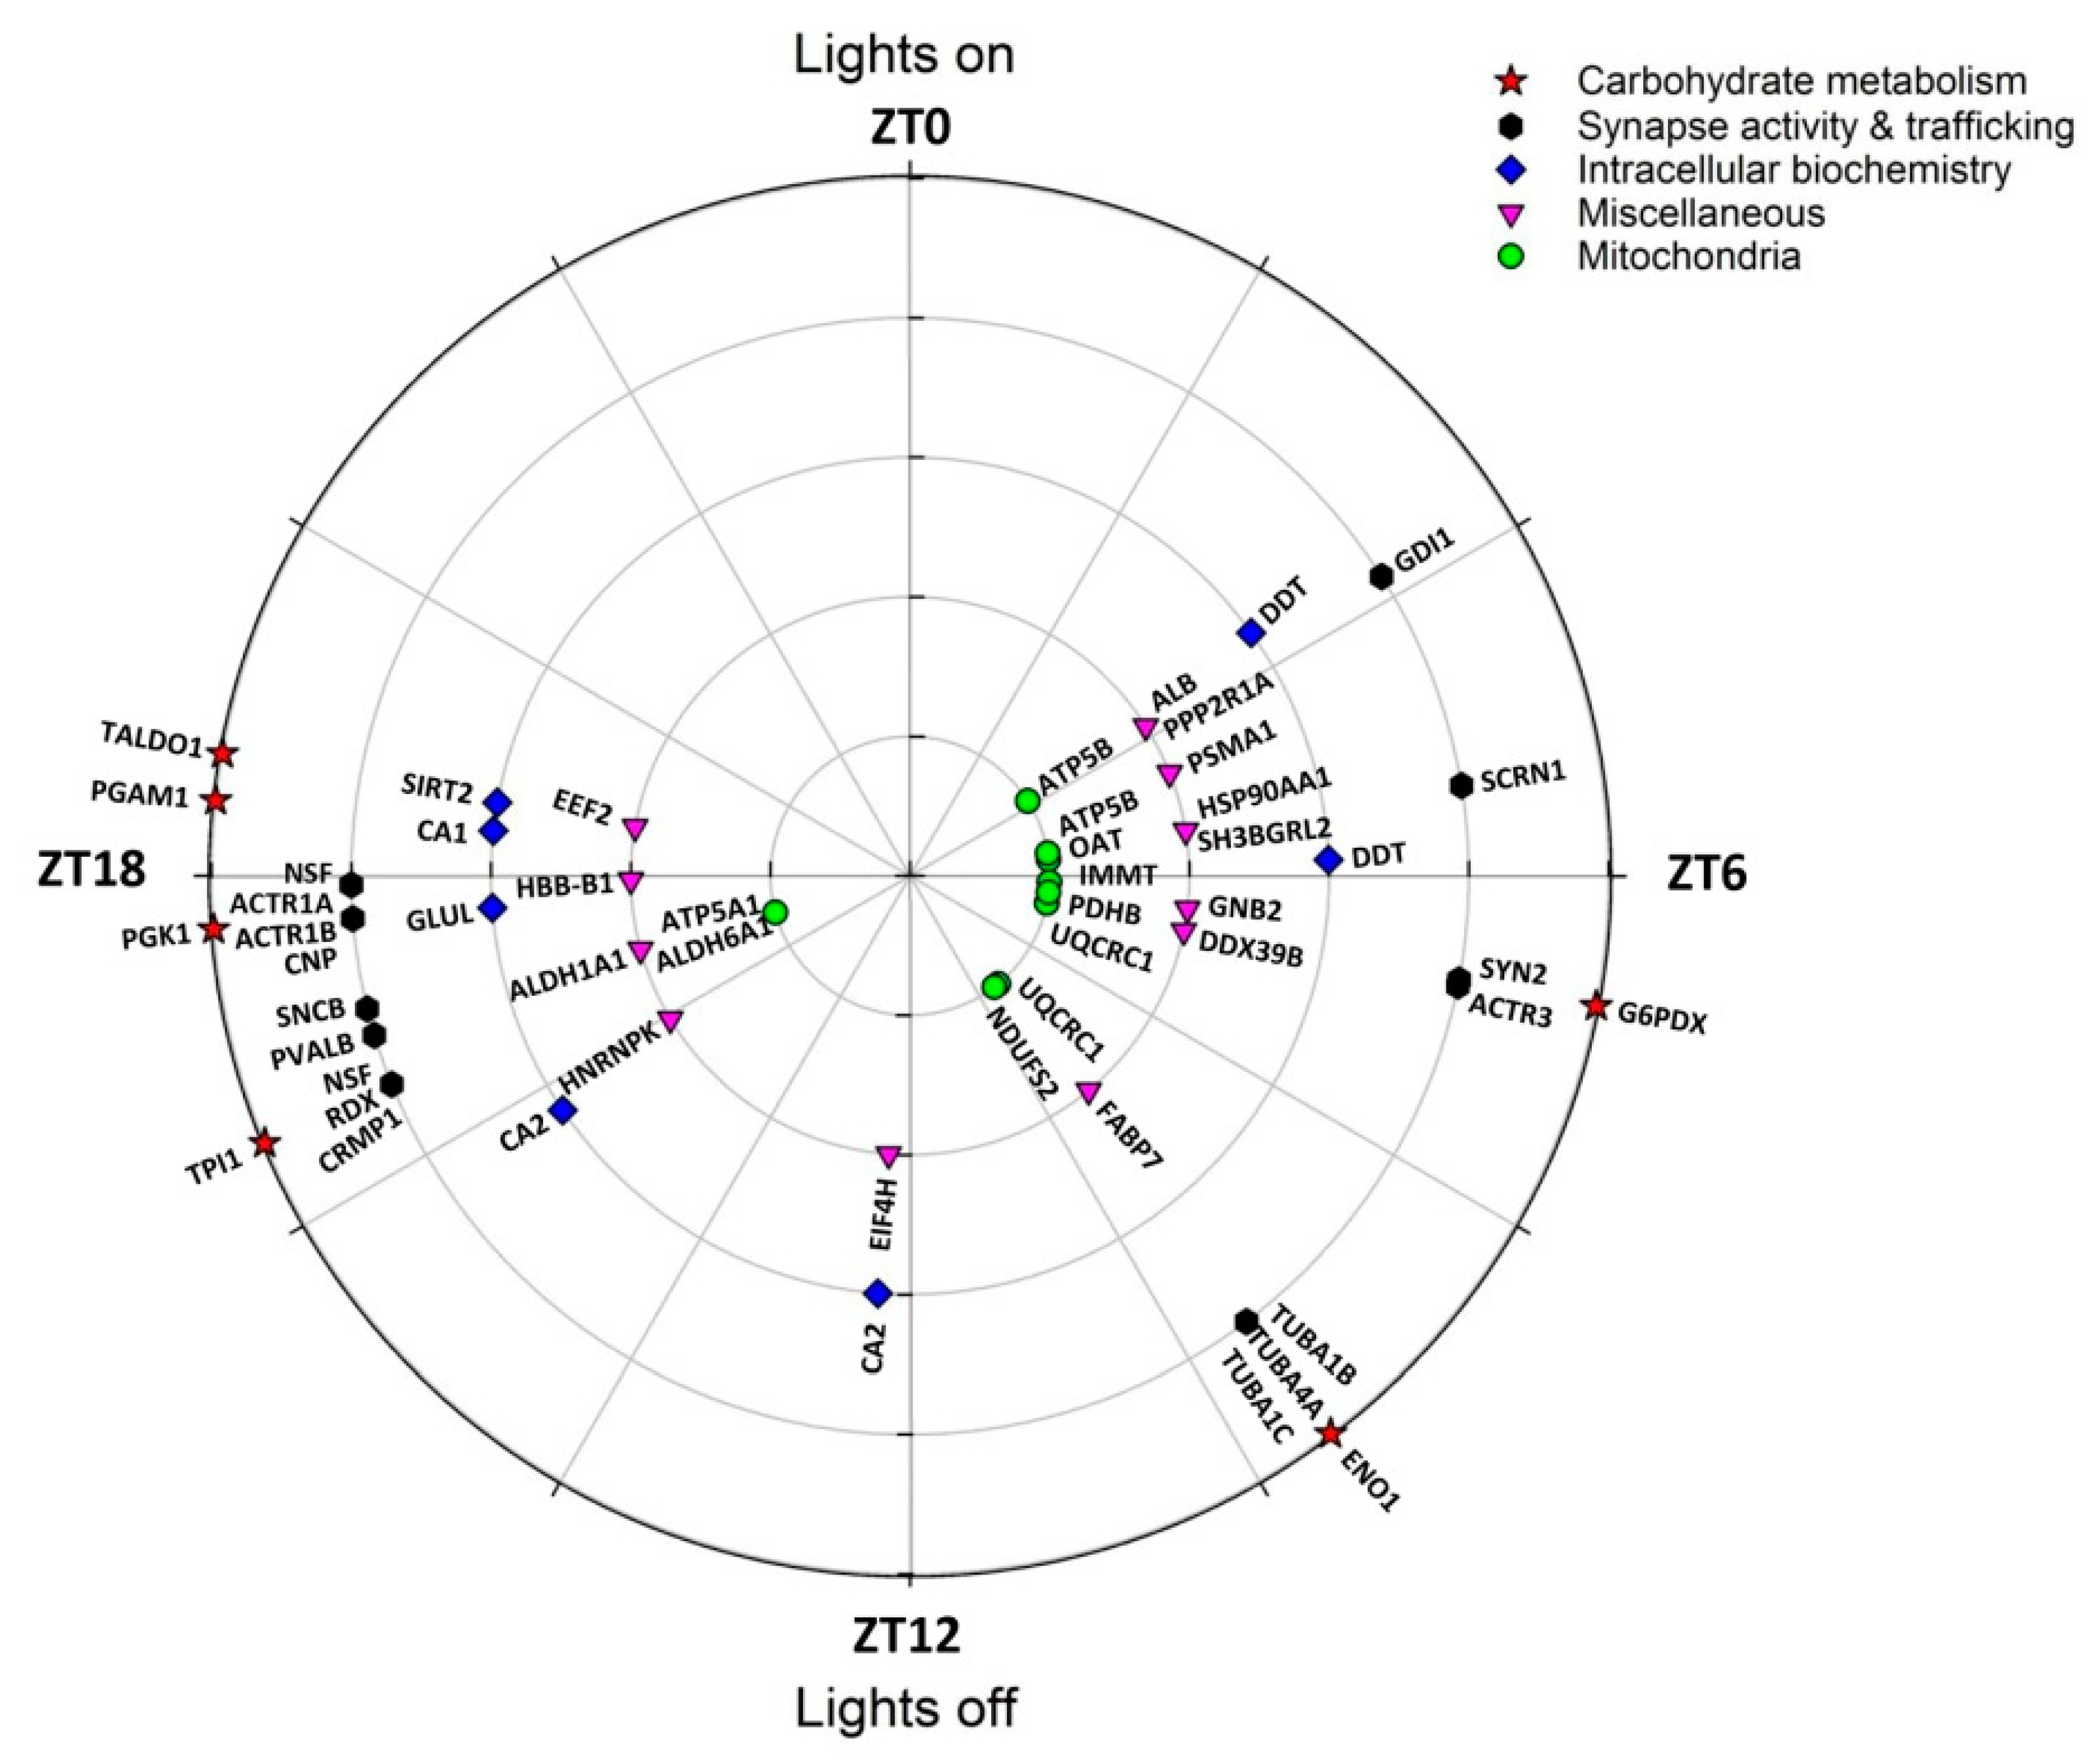
| Spot N° | Protein Name | Gene Name | Subcellular Location | Related Functions | Peak Phase (ZT) |
|---|---|---|---|---|---|
| 512 | Glucose-6-phosphate 1-dehydrogenase X | G6pdx | Cytosol, nucleus | Carbohydrate metab | 6.7 |
| 1056 | α-enolase | Eno1 | Cell membrane, cytoplasm | Carbohydrate metab | 9.5 |
| 167 | Triosephosphate isomerase | Tpi1 | Cytosol | Carbohydrate metab | 16.5 |
| 382 | Phosphoglycerate kinase 1 | Pgk1 | Cytoplasm | Carbohydrate metab | 17.7 |
| 198 | Phosphoglycerate mutase 1 | Pgam1 | Cytosol, nucleus | Carbohydrate metab | 18.4 |
| 315 | Transaldolase | Taldo1 | Cytoplasm | Carbohydrate metab | 18.7 |
| 540, 1224 | ATP synthase subunit β | Atp5b | Mitochondrion | Mitochondrial function | 3.8, 5.4 |
| 401 | Ornithine aminotransferase | Oat | Mitochondrion | Mitochondrial function | 5.6 |
| 677 | MICOS complex subunit Mic60 | Immt | Mitochondrion | Mitochondrial function | 6.2 |
| 1060 | Pyruvate dehyd. E1 component subunit β 1 | Pdhb | Mitochondrion | Mitochondrial function | 6.5 |
| 412, 417 | Cytochrome b-c1 complex subunit 1 | Uqcrc1 | Mitochondrion | Mitochondrial function | 6.8, 9.4 |
| 1056 | NADH dehyd. [ubiquinone] iron-sulfur prot 2 | Ndufs2 | Mitochondrion | Mitochondrial function | 9.5 |
| 1330 | ATP synthase subunit α | Atp5a1 | Mitochondrion | Mitochondrial function | 17.0 |
| 1330 | Methylmalonate-semialdehyde dehydrogenase | Aldh6a1 | Mitochondrion | Mitochondrial function | 17.0 |
| 219 | Proteasome subunit α type-1 | Psma1 | Cytoplasm, nucleus | Protein metabolism | 4.6 |
| 1224 | Heat shock protein HSP 90-α | Hspaa1 | Membrane, cytoplasm | Protein metabolism | 5.4 |
| 412 | Spliceosome RNA helicase Ddx39b | Ddx39b | Cytoplasm, nucleus | Protein metabolism | 6.8 |
| 216 | Eukaryotic translation initiation factor 4H | Eif4h | Cytoplasm (perinuclear) | Protein metabolism | 12.3 |
| 554 | Heterogeneous nuclear ribonucleoprotein K | Hnrnpk | Cytoplasm, nucleus | Protein metabolism | 15.9 |
| 315 | Elongation factor 2 | Eef2 | Cytoplasm | Protein metabolism | 18.7 |
| 540 | Rab GDP dissociation inhibitor α | Gdi1 | Cytoskeleton, Golgi | Synapse & trafficking | 3.8 |
| 1224 | Secernin-1 | Scrn1 | Cytoplasm | Synapse & trafficking | 5.4 |
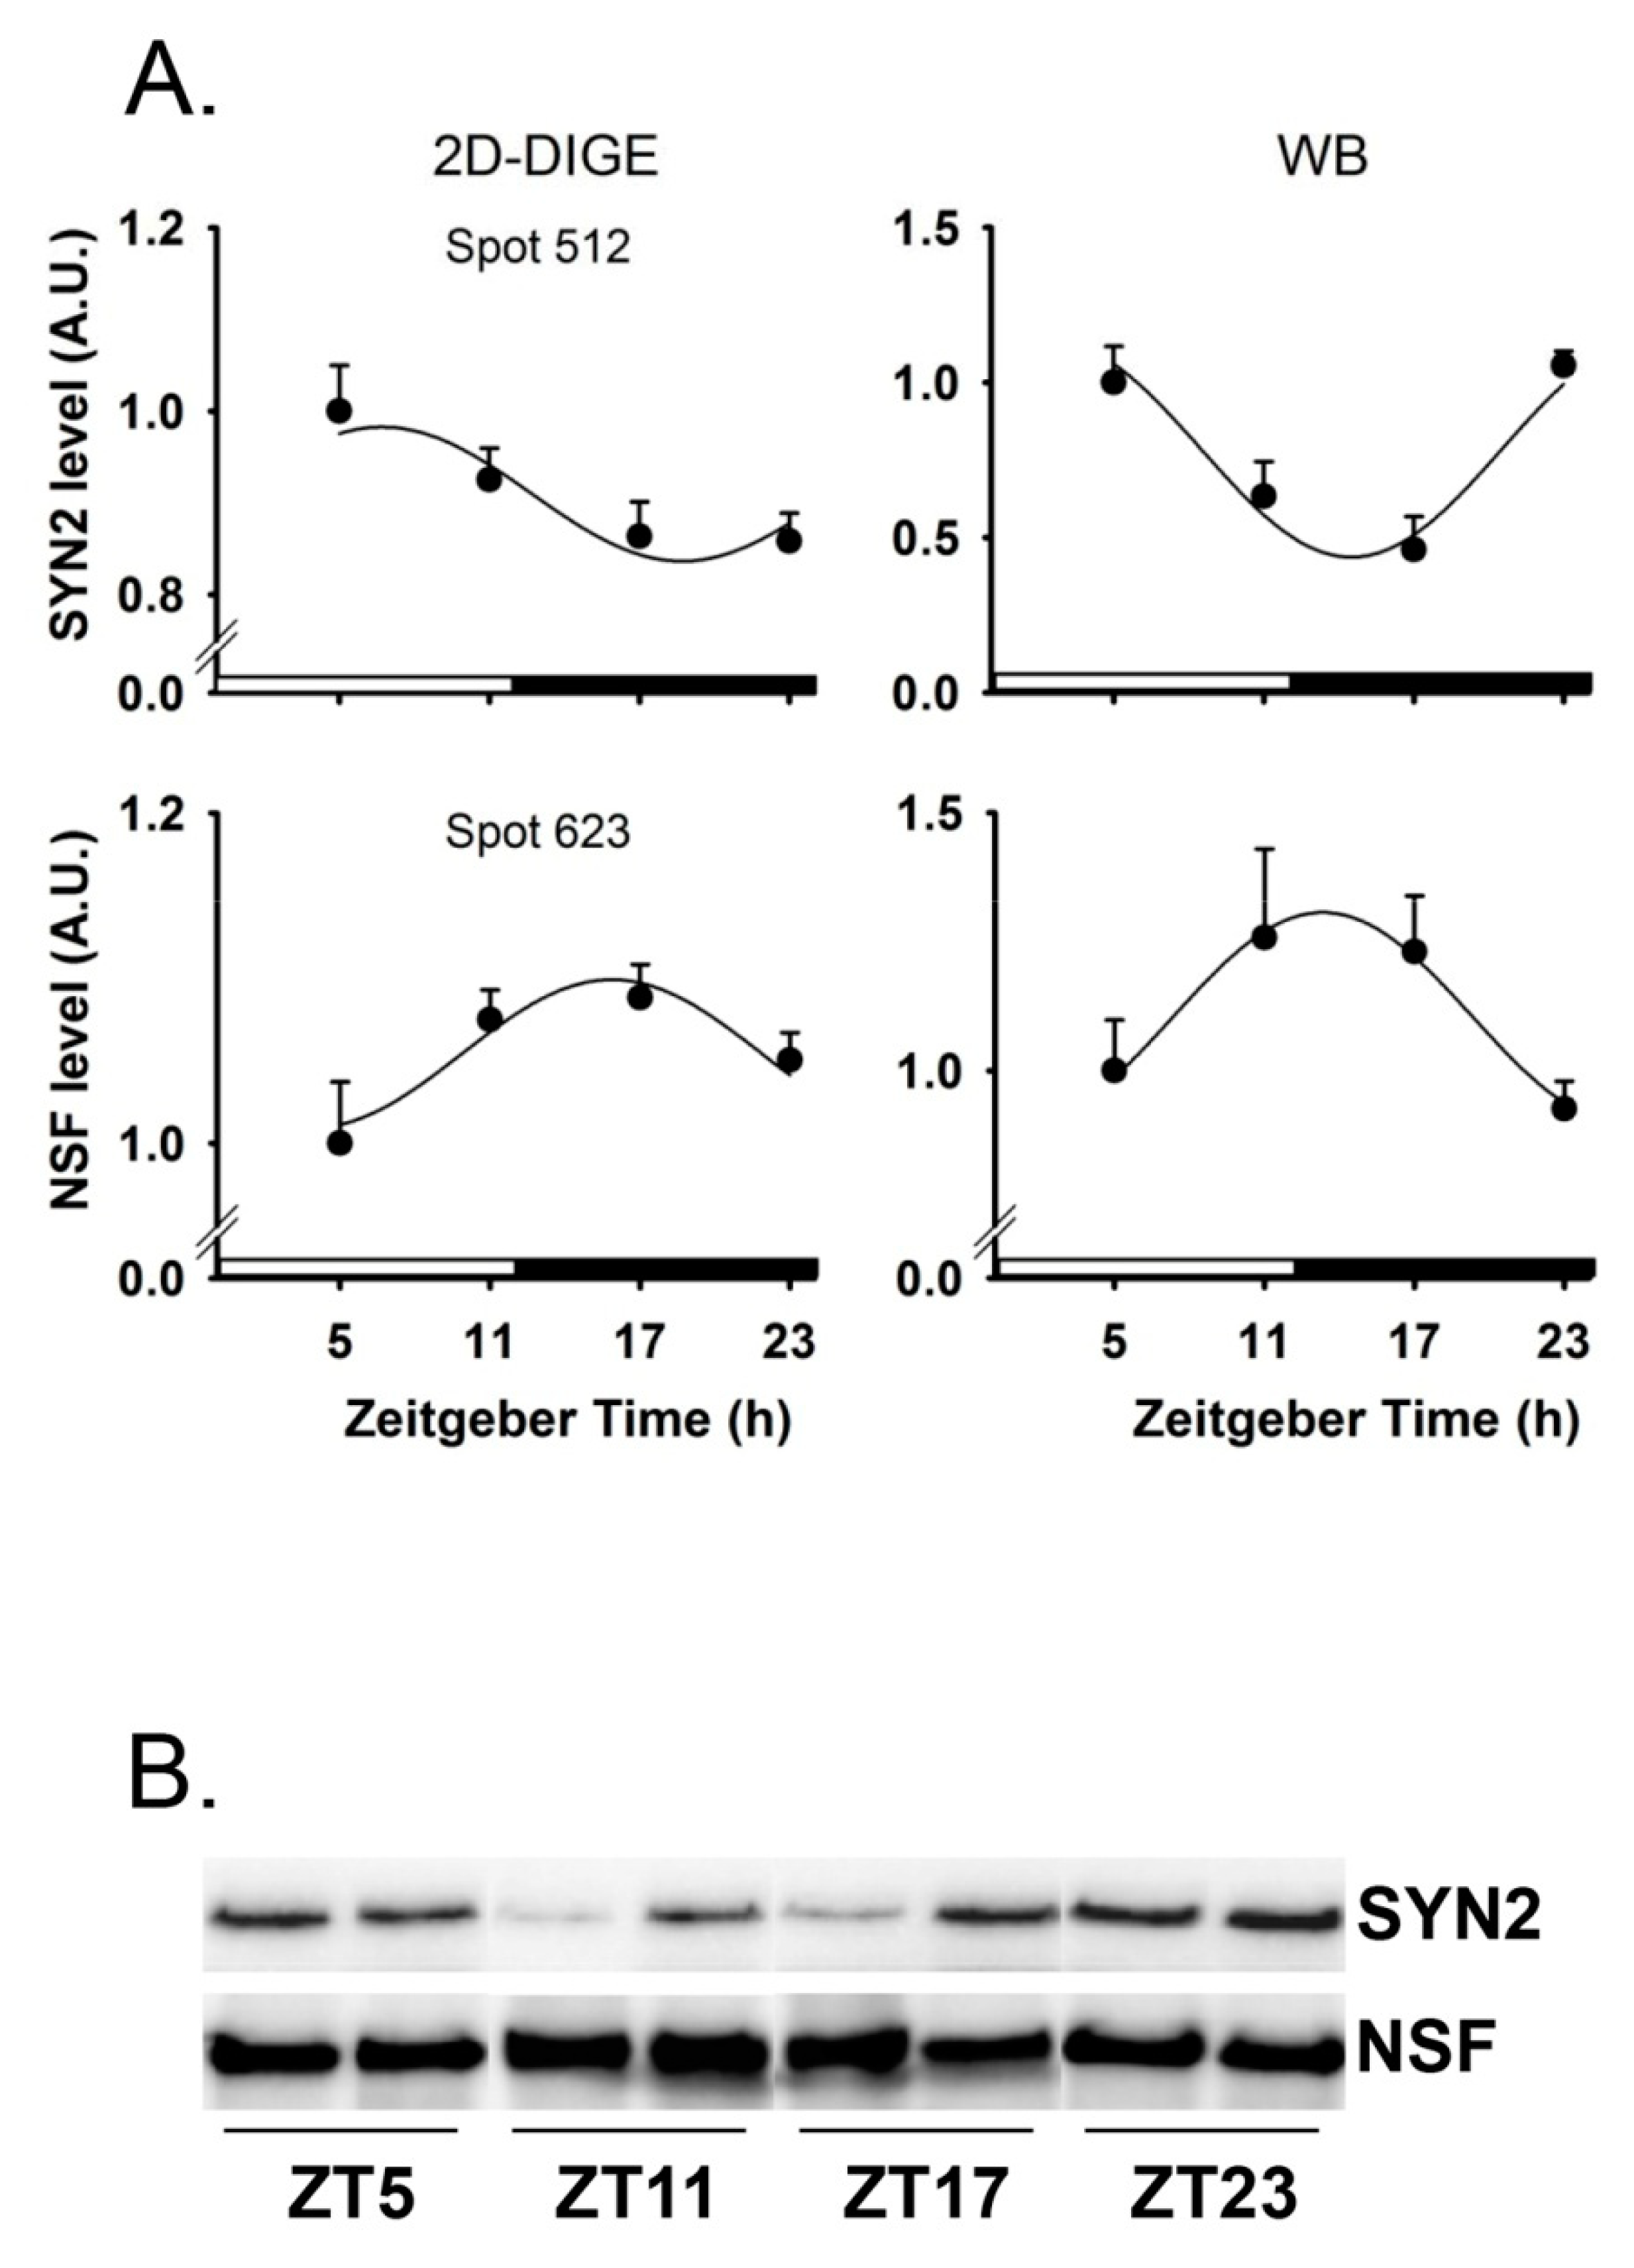
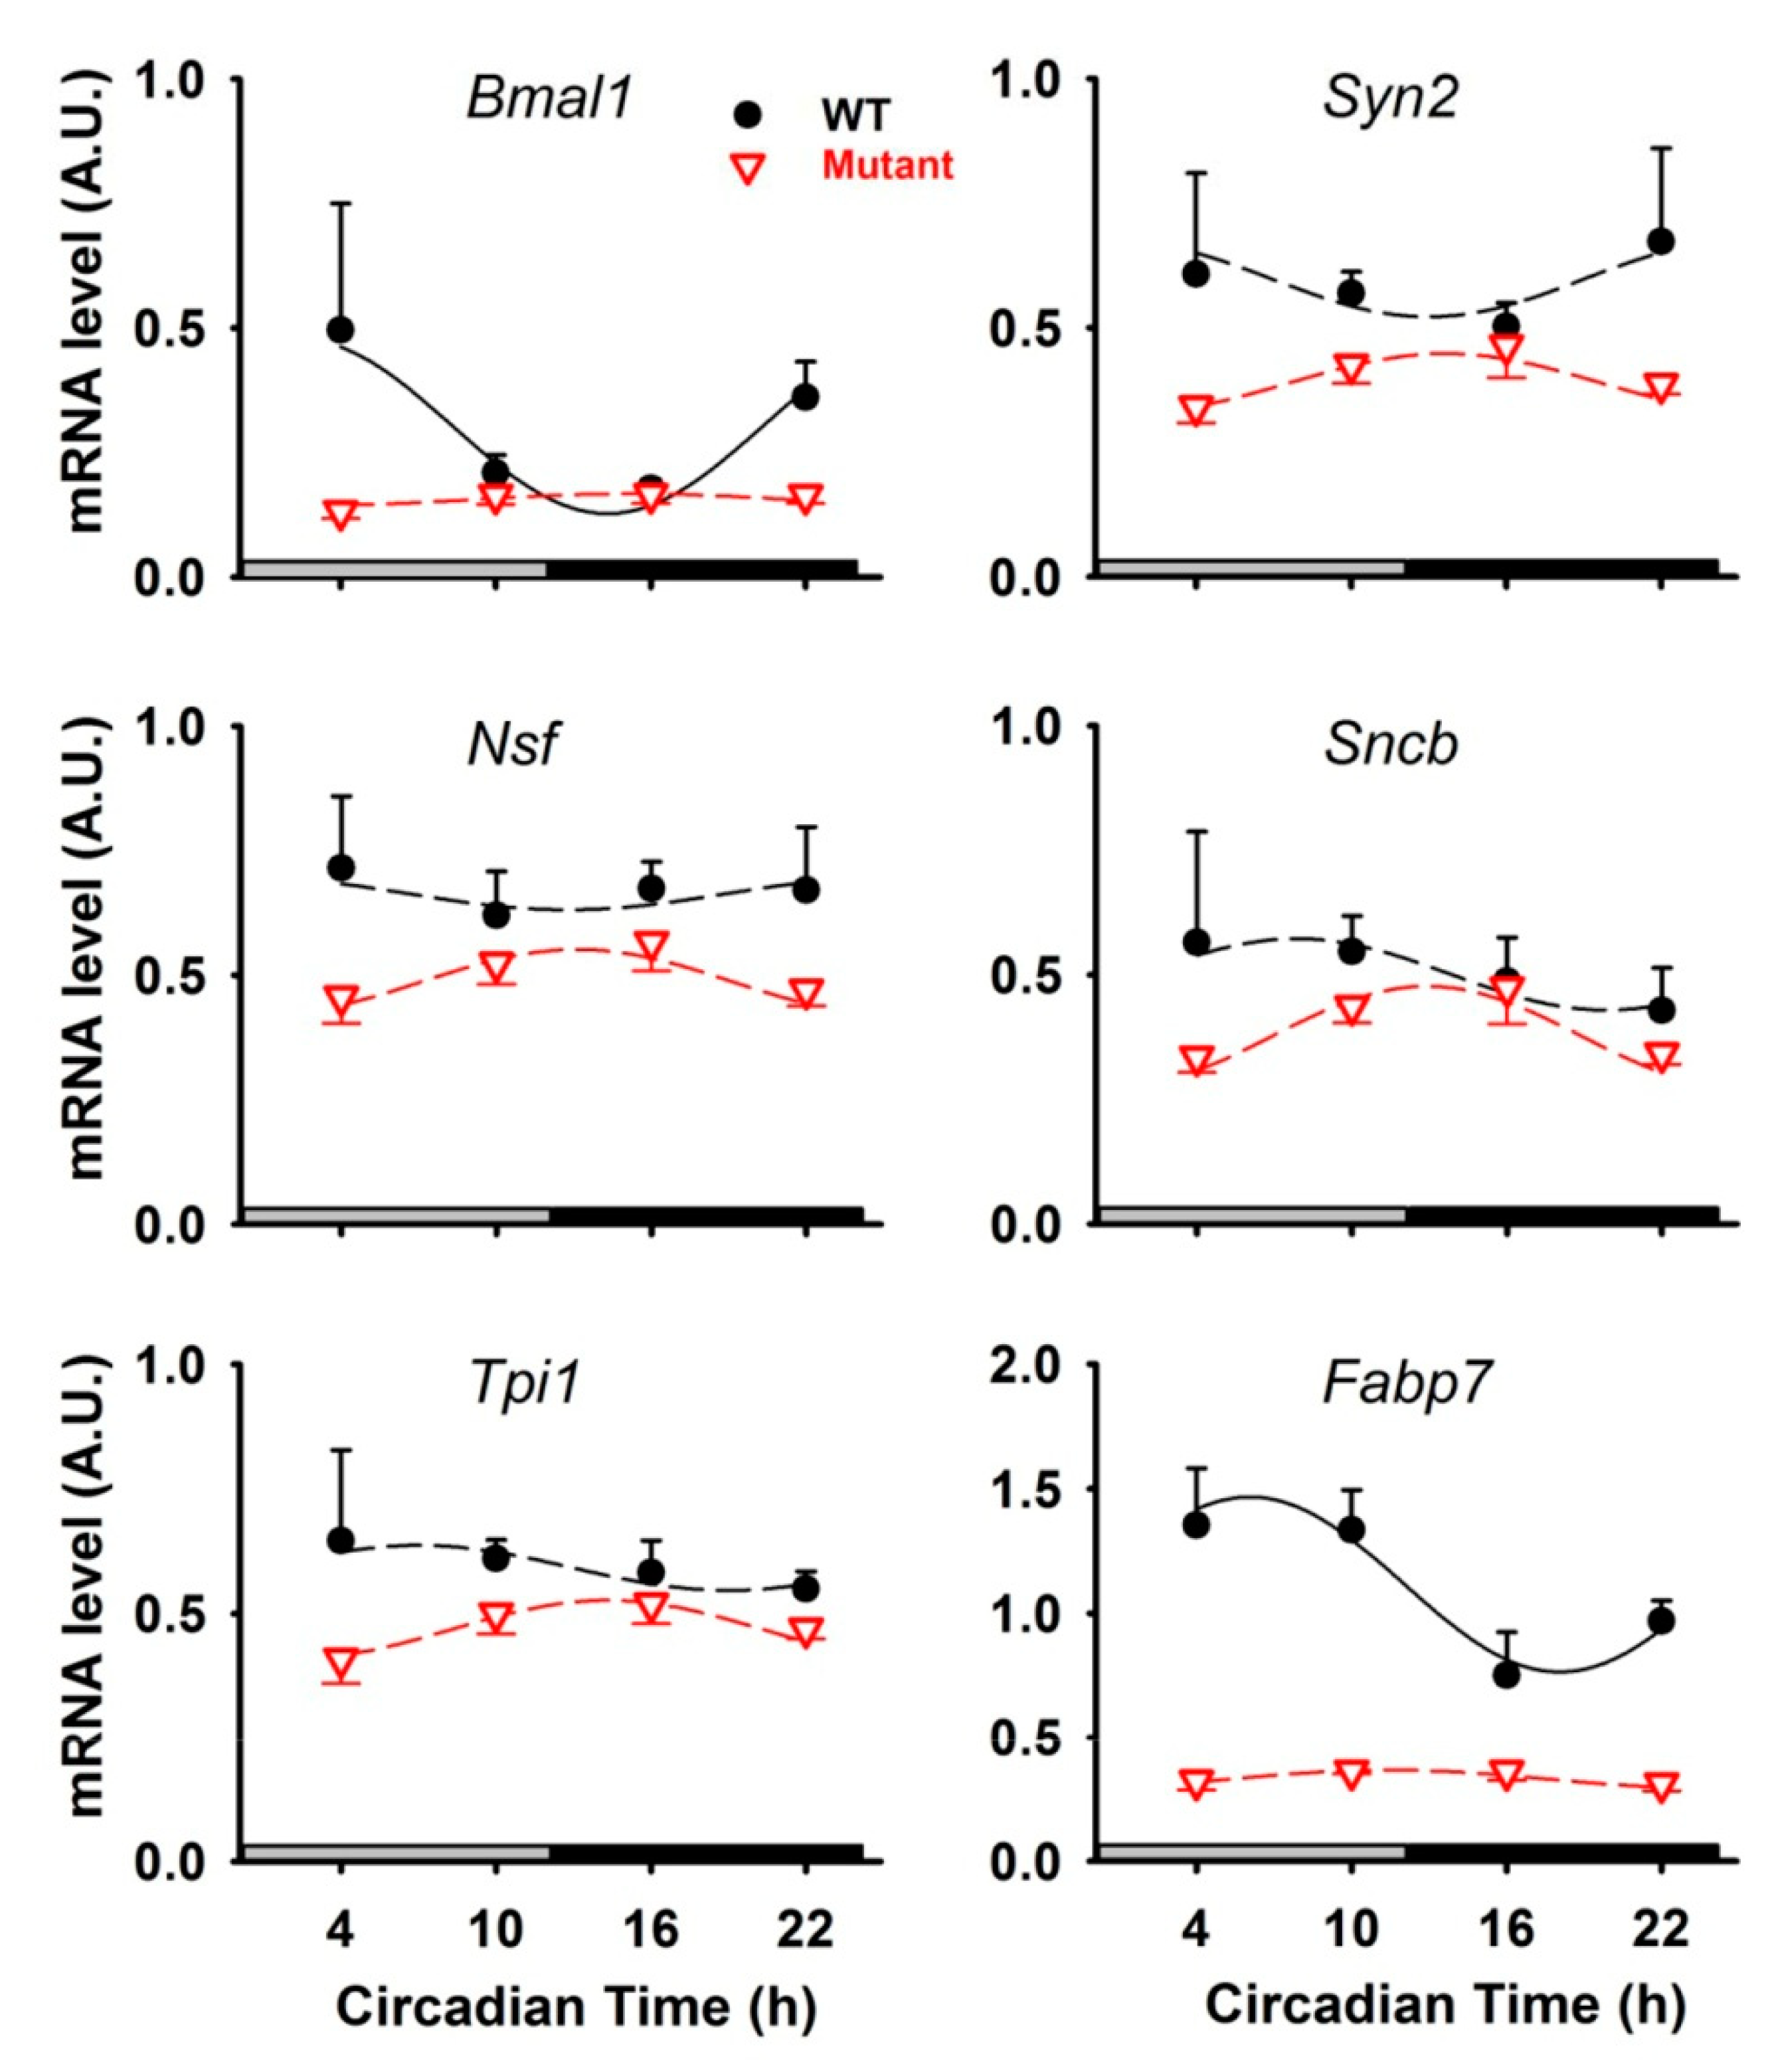
| 512 | Synapsin-2 | Syn2 | Cytoskeleton, nucleus | Synapse & trafficking | 6.7 |
| 412 | Actin-related protein 3 | Actr3 | Cytoskeleton | Synapse & trafficking | 6.8 |
| 1056 | Tubulin α-1B chain | Tuba1b | Cytoskeleton | Synapse & trafficking | 9.5 |
| 1056 | Tubulin α-4A | Tuba4a | Cytoskeleton | Synapse & trafficking | 9.5 |
| 1056 | Tubulin α-1C chain | Tuba1c | Cytoskeleton | Synapse & trafficking | 9.5 |
| 630, 623 | Vesicle-fusing ATPase | Nsf | Cytoplasm | Synapse & trafficking | 16.5, 17.9 |
| 630 | Radixin | Rdx | Membrane, cytoskeleton | Synapse & trafficking | 16.5 |
| 630 | Dihydropyrimidinase-related protein 1 | Crmp1 | Cytoplasm, cytoskeleton | Synapse & trafficking | 16.5 |
| 36 | Parvalbumin α | Pvalb | Cytoplasm, nucleus | Synapse & trafficking | 16.9 |
| 82 | β-synuclein | Sncb | Cytoplasm, synapse | Synapse & trafficking | 17.1 |
| 382 | α -centractin | Actr1a | Cytoskeleton | Synapse & trafficking | 17.7 |
| 382 | β-centractin | Actr1b | Cytoskeleton | Synapse & trafficking | 17.7 |
| 382 | 2′,3′-cyclic-nucleotide 3′-phosphodiesterase | Cnp | Cytoskeleton | Synapse & trafficking | 17.7 |
| 21, 22 | D-dopachrome decarboxylase | Ddt | Cytoplasm | Miscellaneous | 3.6, 5.9 |
| 540 | PP2A subunit A isoform PR65-alpha | Ppp2r1a | Membrane, cytoplasm | Miscellaneous | 3.8 |
| 582 | Serum albumin | Alb | [Extracellular, secreted] | Miscellaneous | 3.5 |
| 22 | SH3 domain-binding glutamic acid-rich-like prot 2 | Sh3bgrl2 | Nucleus | Miscellaneous | 5.9 |
| 1060 | Guanine nucleotide-binding protein subu β-2 | Gnb2 | Cytoplasm (perinuclear) | Miscellaneous | 6.5 |
| 216, 212 | Carbonic anhydrase 2 | Ca2 | Membrane, cytoplasm | Miscellaneous | 12.3, 15.7 |
| 1330 | Retinal dehydrogenase 1 | Aldh1a1 | Cytoplasm | Miscellaneous | 17.0 |
| 382 | Glutamine synthetase | Glul | Cytoplasm (mainly) | Miscellaneous | 17.7 |
| 1019 | Hemoglobin subunit β-1 | Hbb-b1 | [Red blood cells] | Miscellaneous | 17.9 |
| 198 | Carbonic anhydrase 1 | Ca1 | Cytoplasm | Miscellaneous | 18.4 |
| 315 | NAD-dependent protein deacetylase sirtuin-2 | Sirt2 | Cytoplasm (mainly) | Miscellaneous | 18.7 |
| 42 | Fatty acid-binding protein, brain 2 | Fabp7 | Cytoplasm | Lipid transp., PPAR signal. | (9.3) |
© 2019 by the authors. Licensee MDPI, Basel, Switzerland. This article is an open access article distributed under the terms and conditions of the Creative Commons Attribution (CC BY) license (http://creativecommons.org/licenses/by/4.0/).
Share and Cite
Plumel, M.; Dumont, S.; Maes, P.; Sandu, C.; Felder-Schmittbuhl, M.-P.; Challet, E.; Bertile, F. Circadian Analysis of the Mouse Cerebellum Proteome. Int. J. Mol. Sci. 2019, 20, 1852. https://doi.org/10.3390/ijms20081852
Plumel M, Dumont S, Maes P, Sandu C, Felder-Schmittbuhl M-P, Challet E, Bertile F. Circadian Analysis of the Mouse Cerebellum Proteome. International Journal of Molecular Sciences. 2019; 20(8):1852. https://doi.org/10.3390/ijms20081852
Chicago/Turabian StylePlumel, Marine, Stéphanie Dumont, Pauline Maes, Cristina Sandu, Marie-Paule Felder-Schmittbuhl, Etienne Challet, and Fabrice Bertile. 2019. "Circadian Analysis of the Mouse Cerebellum Proteome" International Journal of Molecular Sciences 20, no. 8: 1852. https://doi.org/10.3390/ijms20081852
APA StylePlumel, M., Dumont, S., Maes, P., Sandu, C., Felder-Schmittbuhl, M.-P., Challet, E., & Bertile, F. (2019). Circadian Analysis of the Mouse Cerebellum Proteome. International Journal of Molecular Sciences, 20(8), 1852. https://doi.org/10.3390/ijms20081852