Positive Impact of Pulsed Electric Field on Lactic Acid Removal, Demineralization and Membrane Scaling during Acid Whey Electrodialysis


Abstract
:1. Introduction
2. Results and Discussion
2.1. Whey and Recovery Solutions Analysis
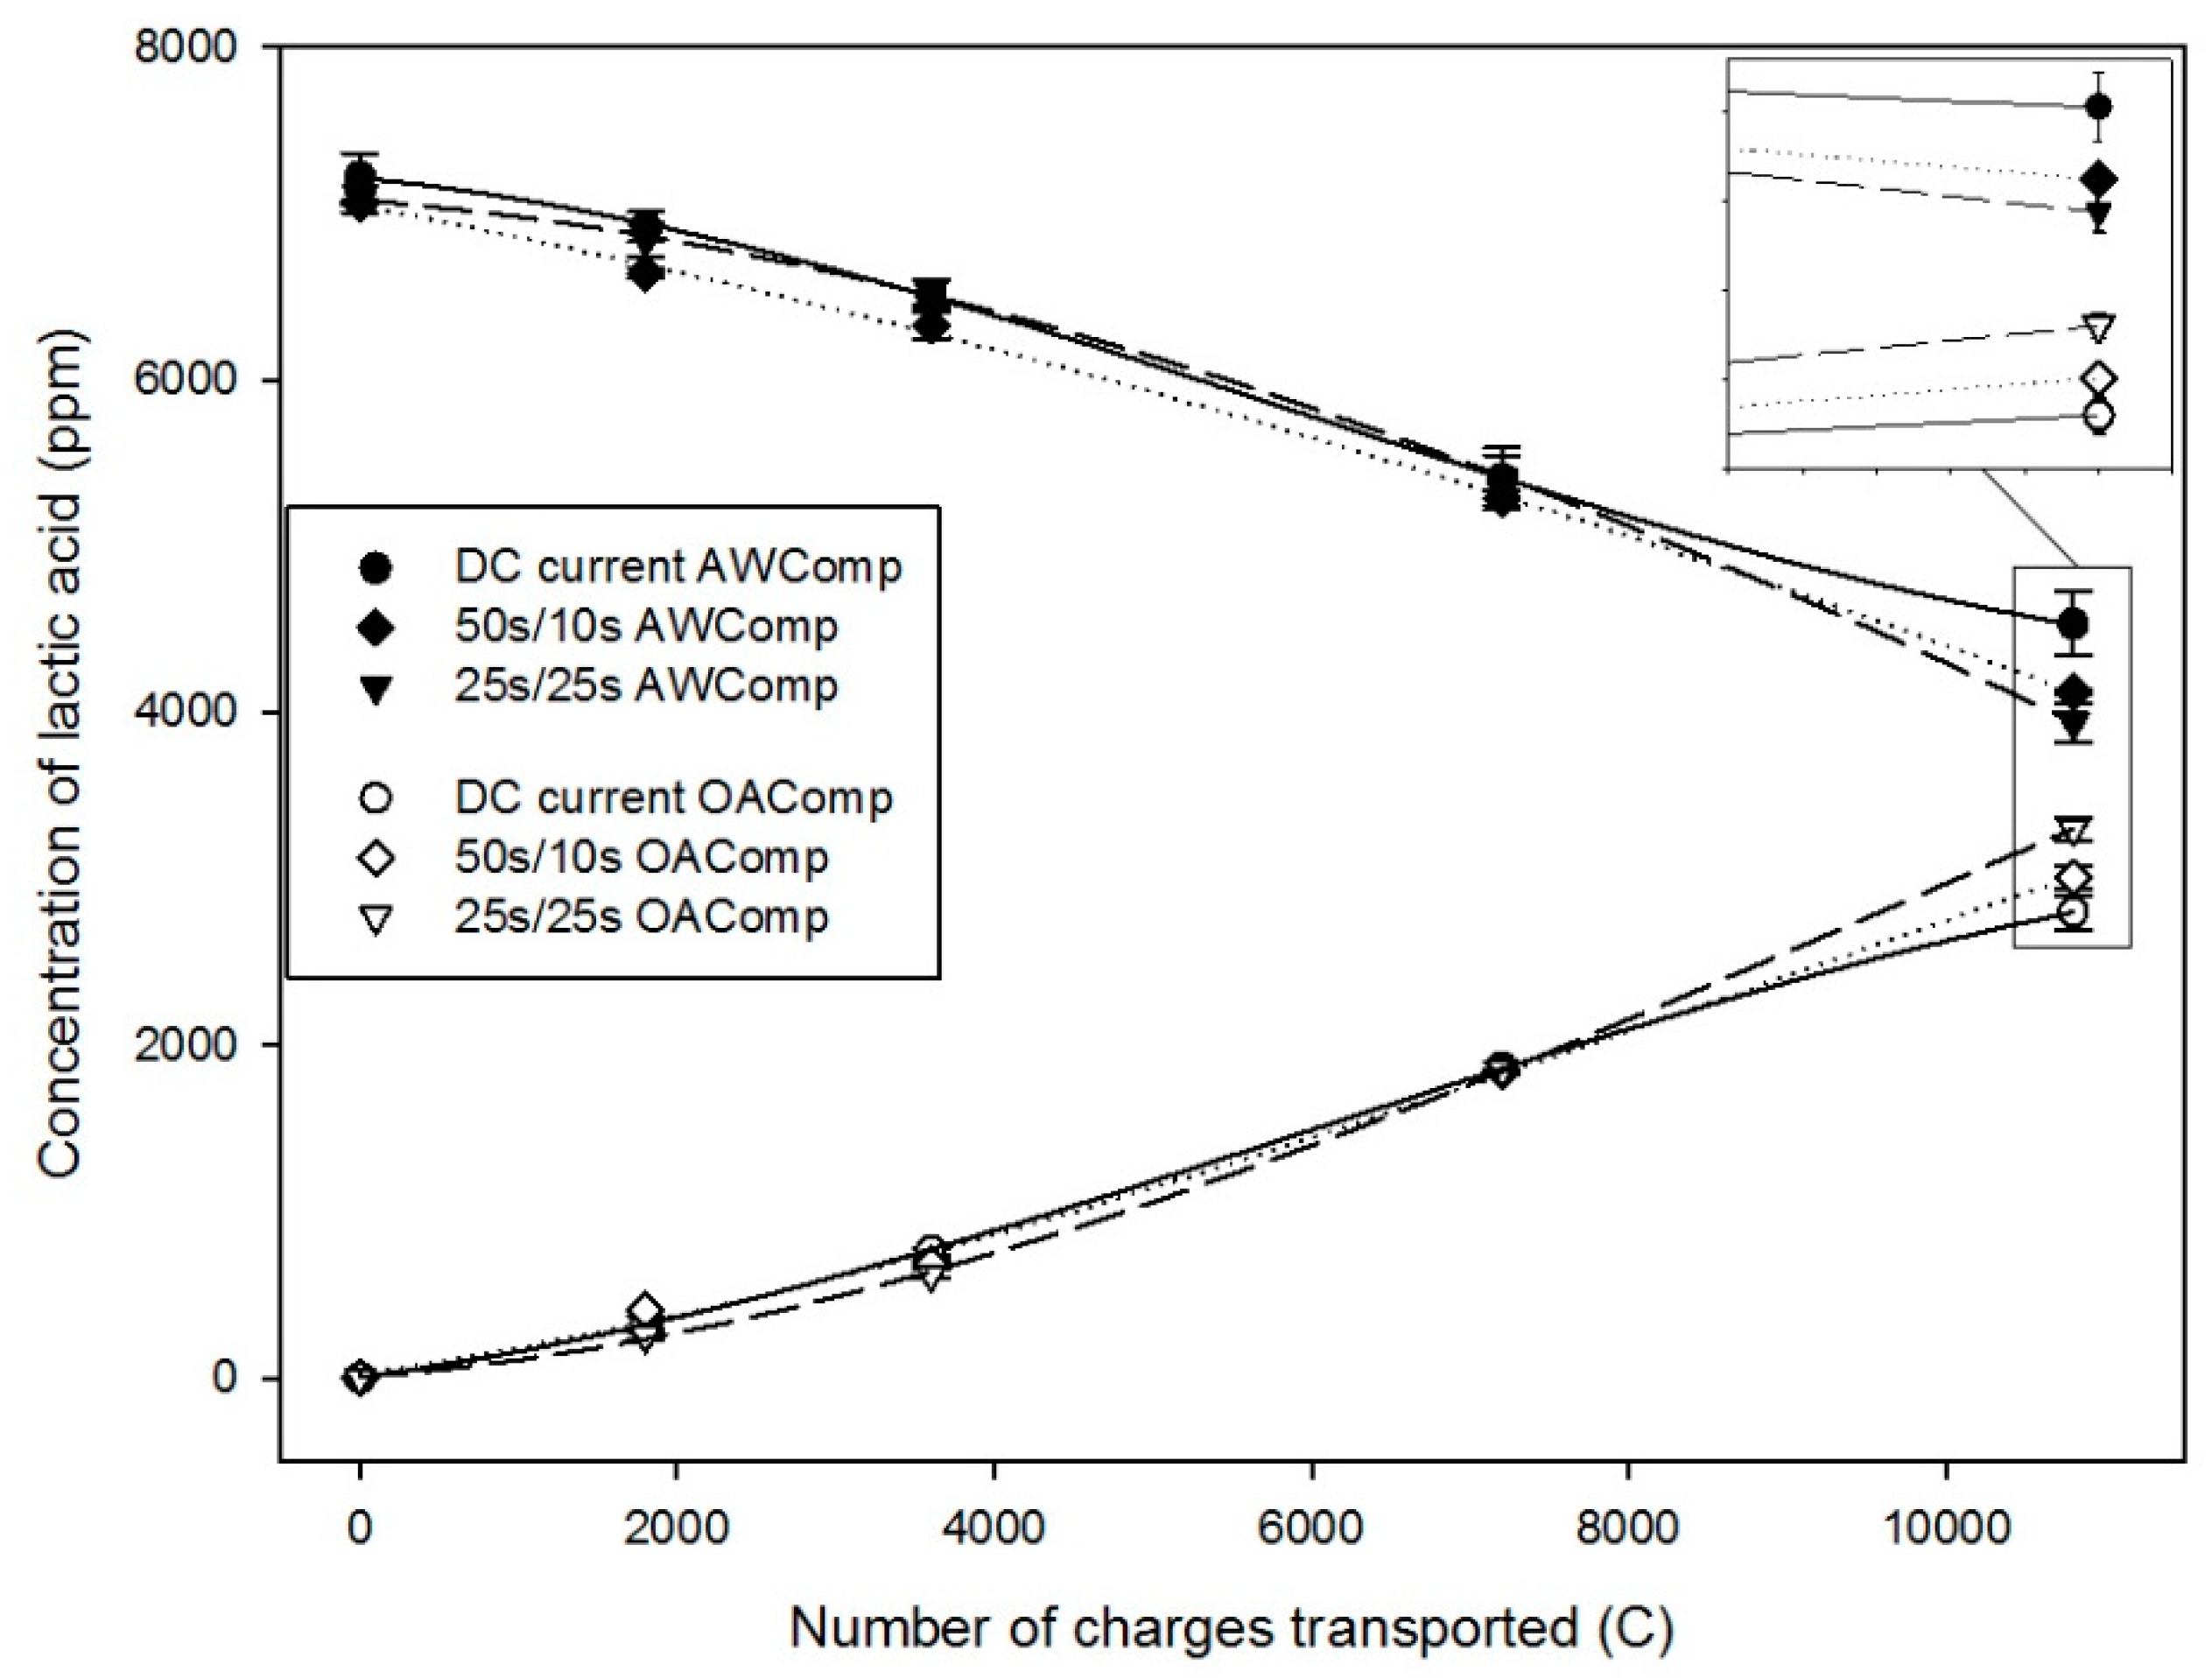
2.1.1. Lactate Migration
2.1.2. Protein Content
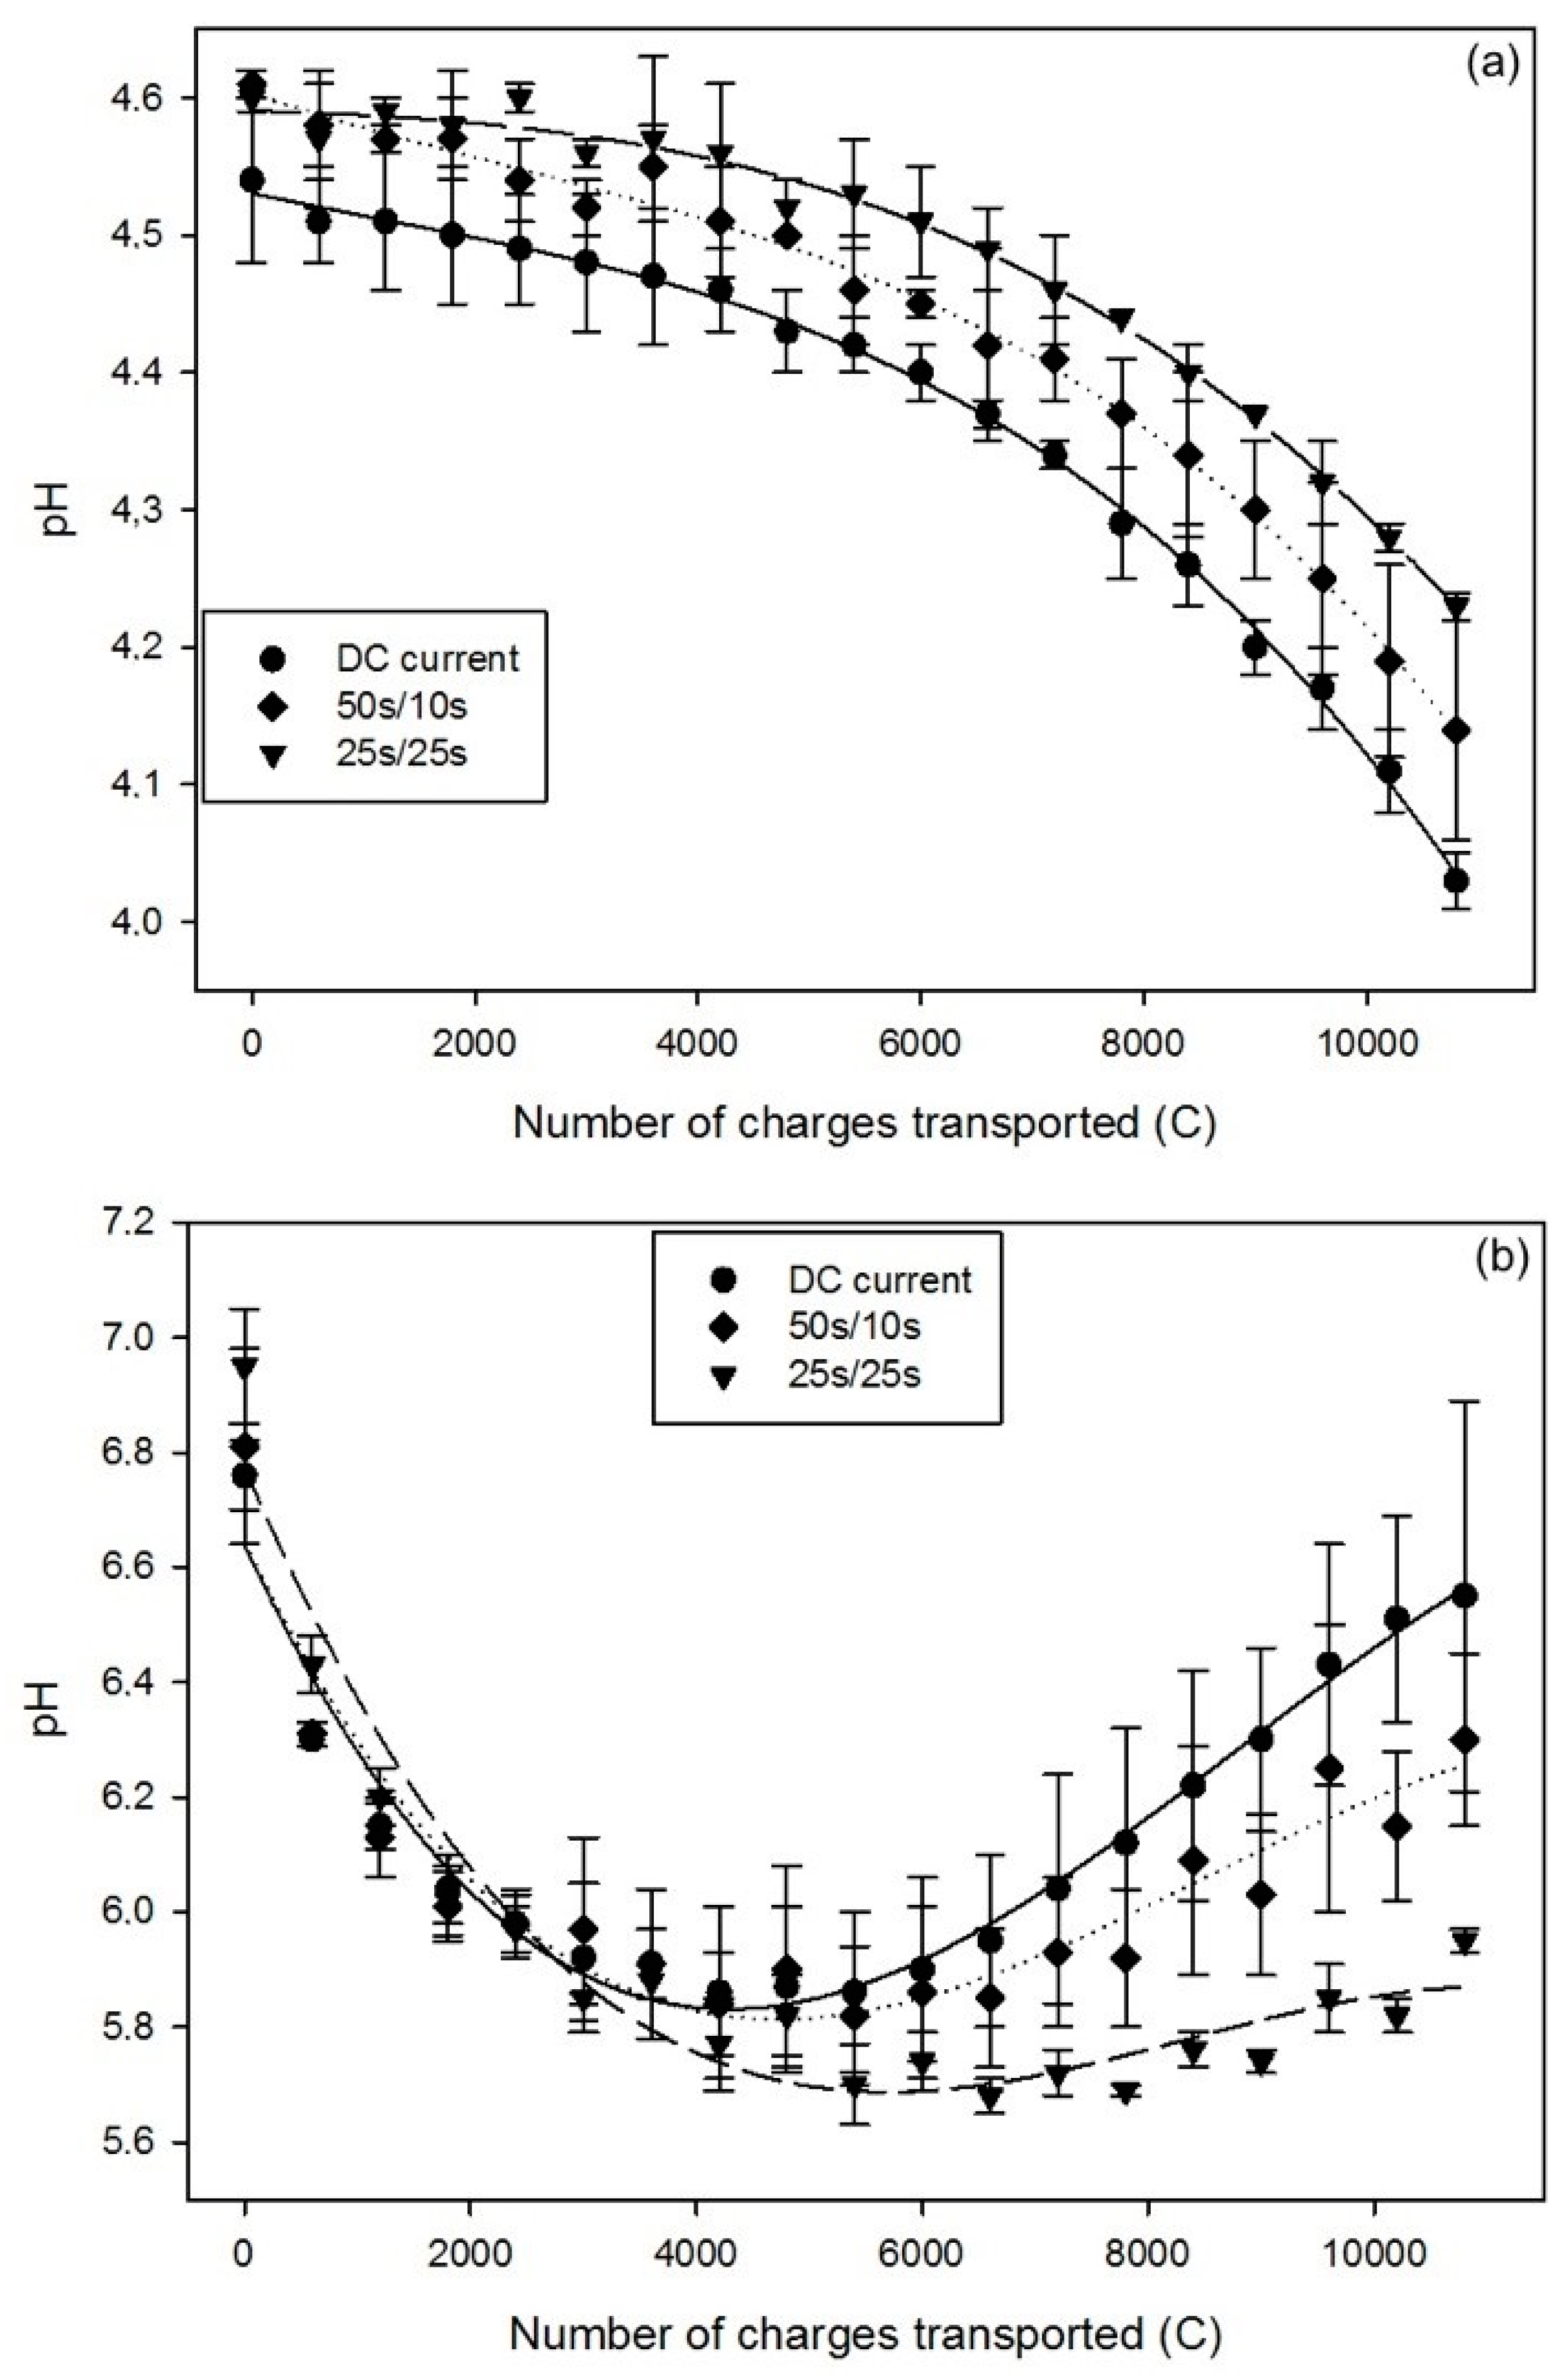
2.1.3. pH
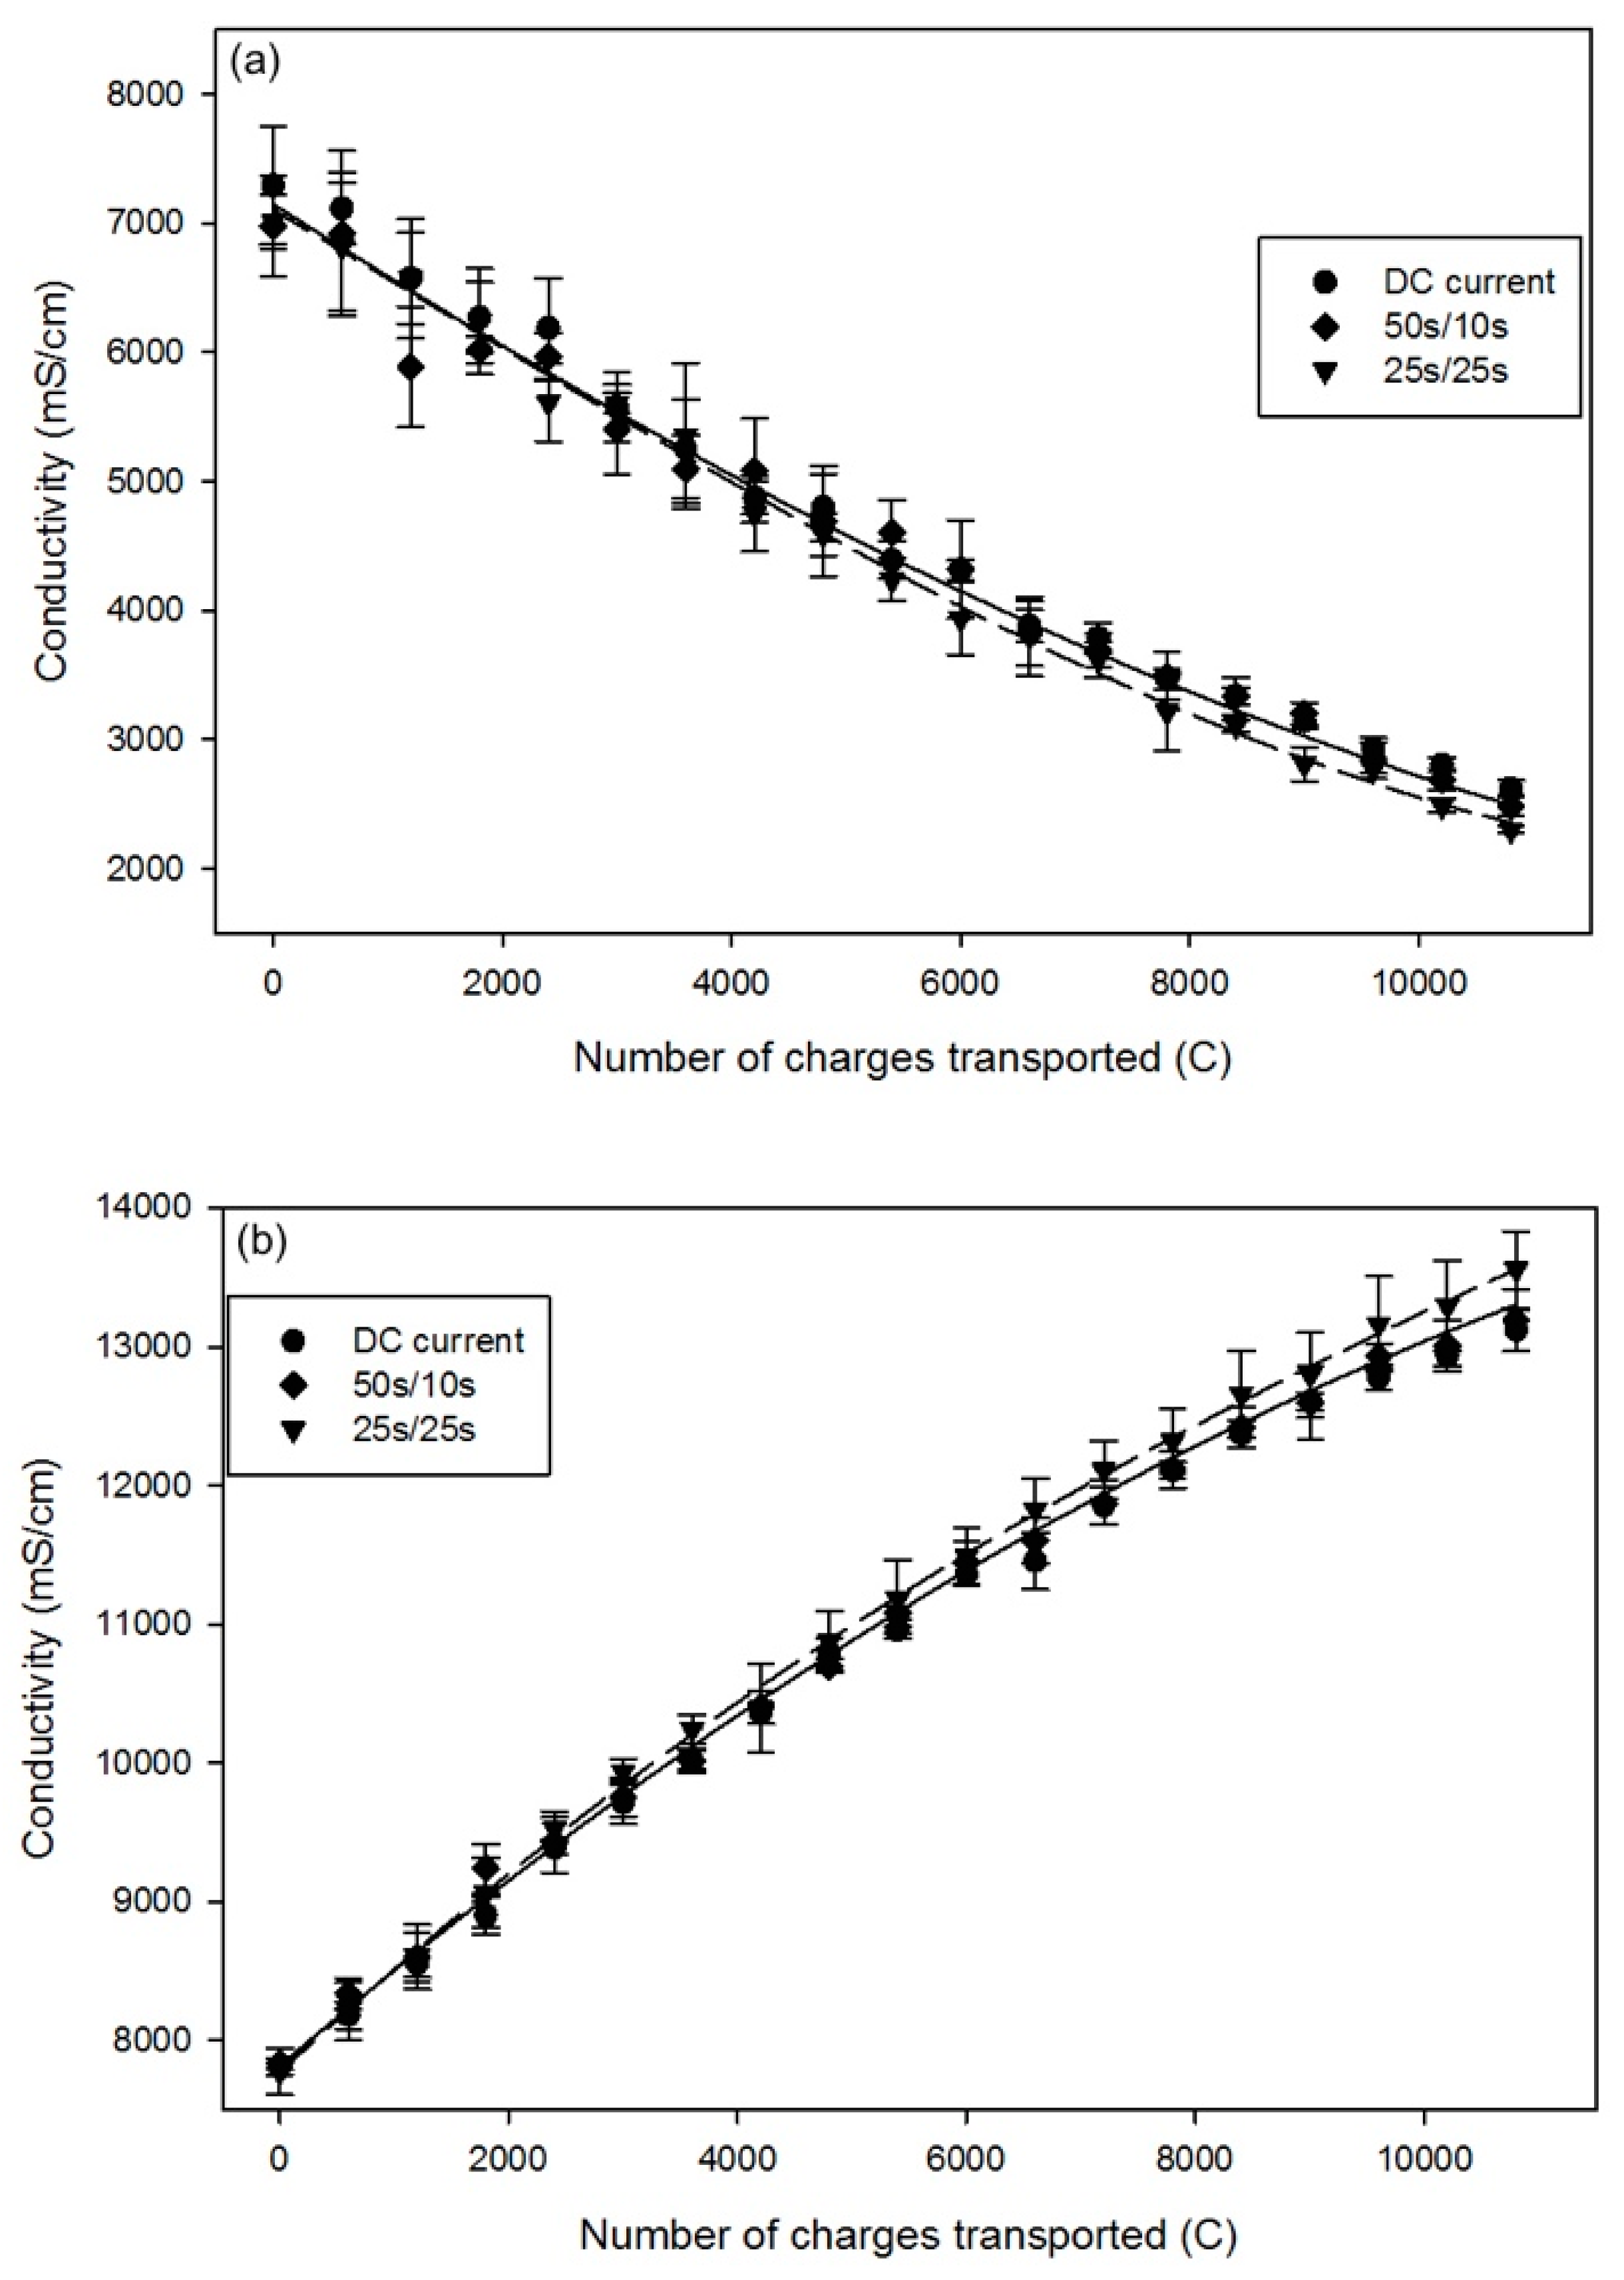
2.1.4. Conductivity
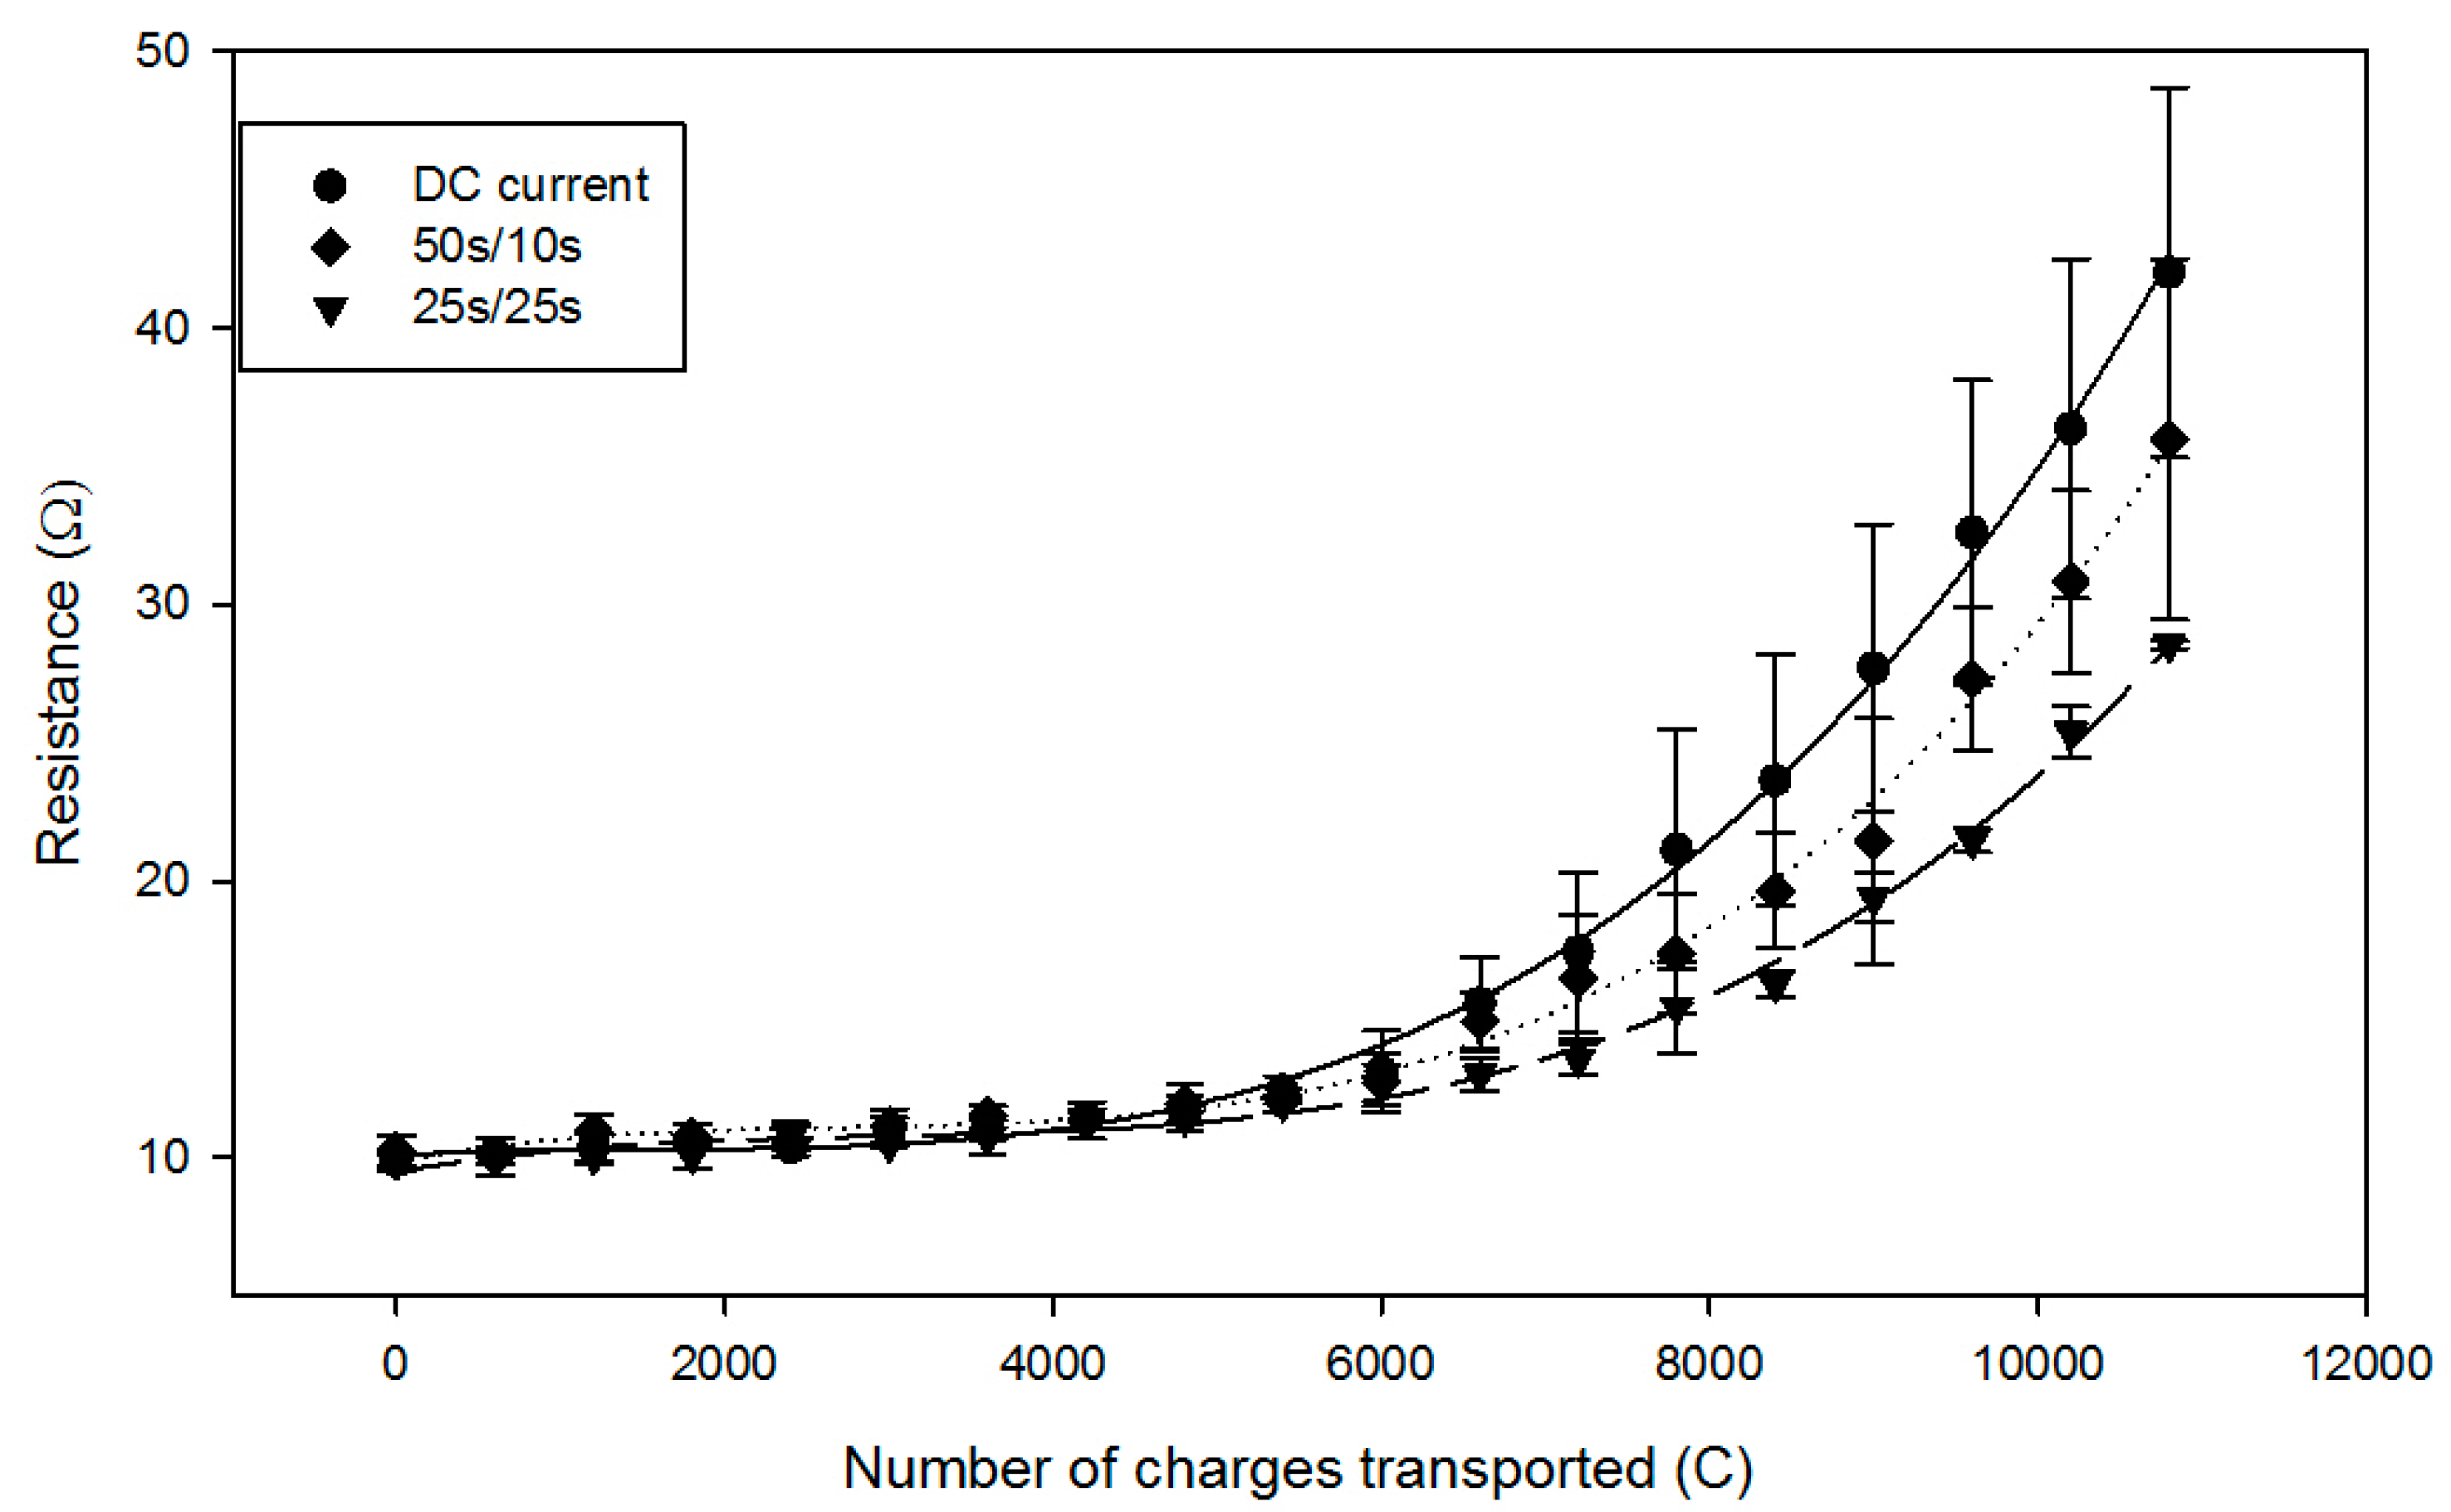
2.2. Global System Resistance and Relative Energy Consumption
2.3. Membrane Analysis
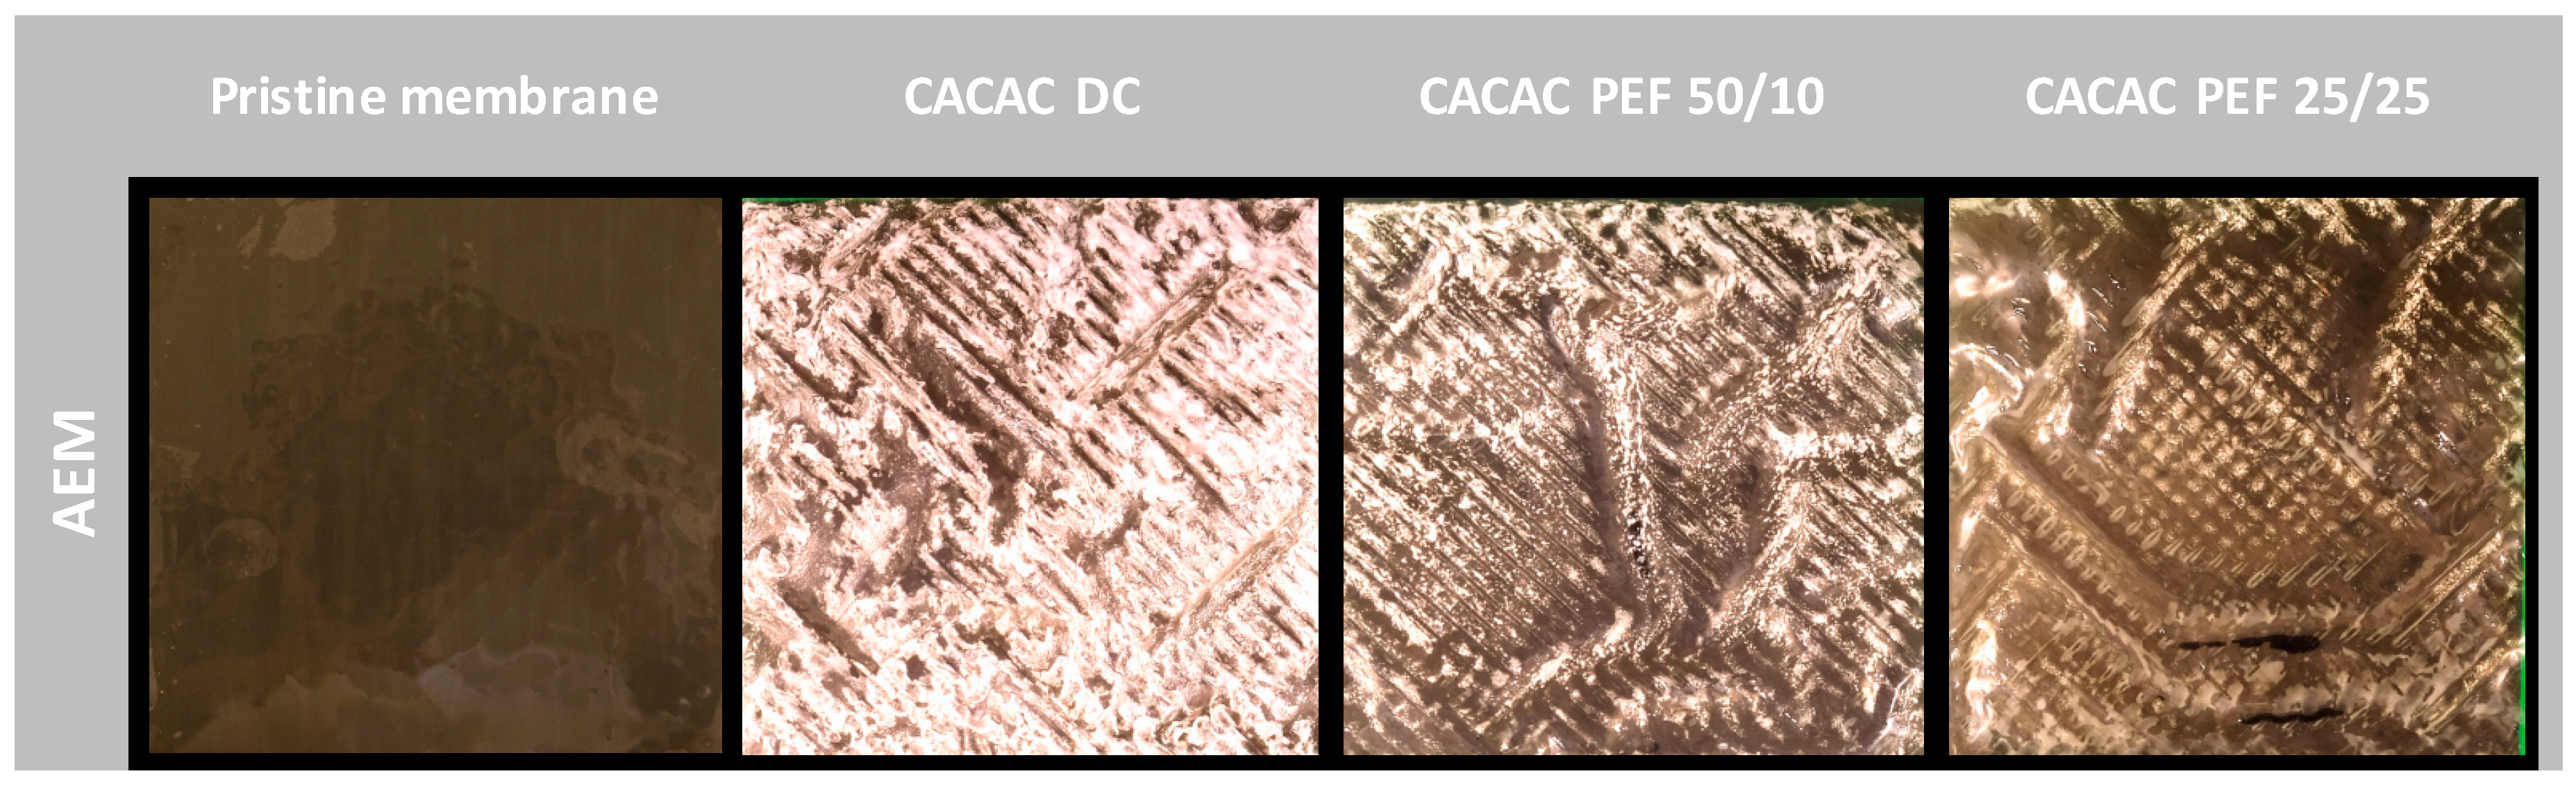
2.3.1. Membrane Photographs
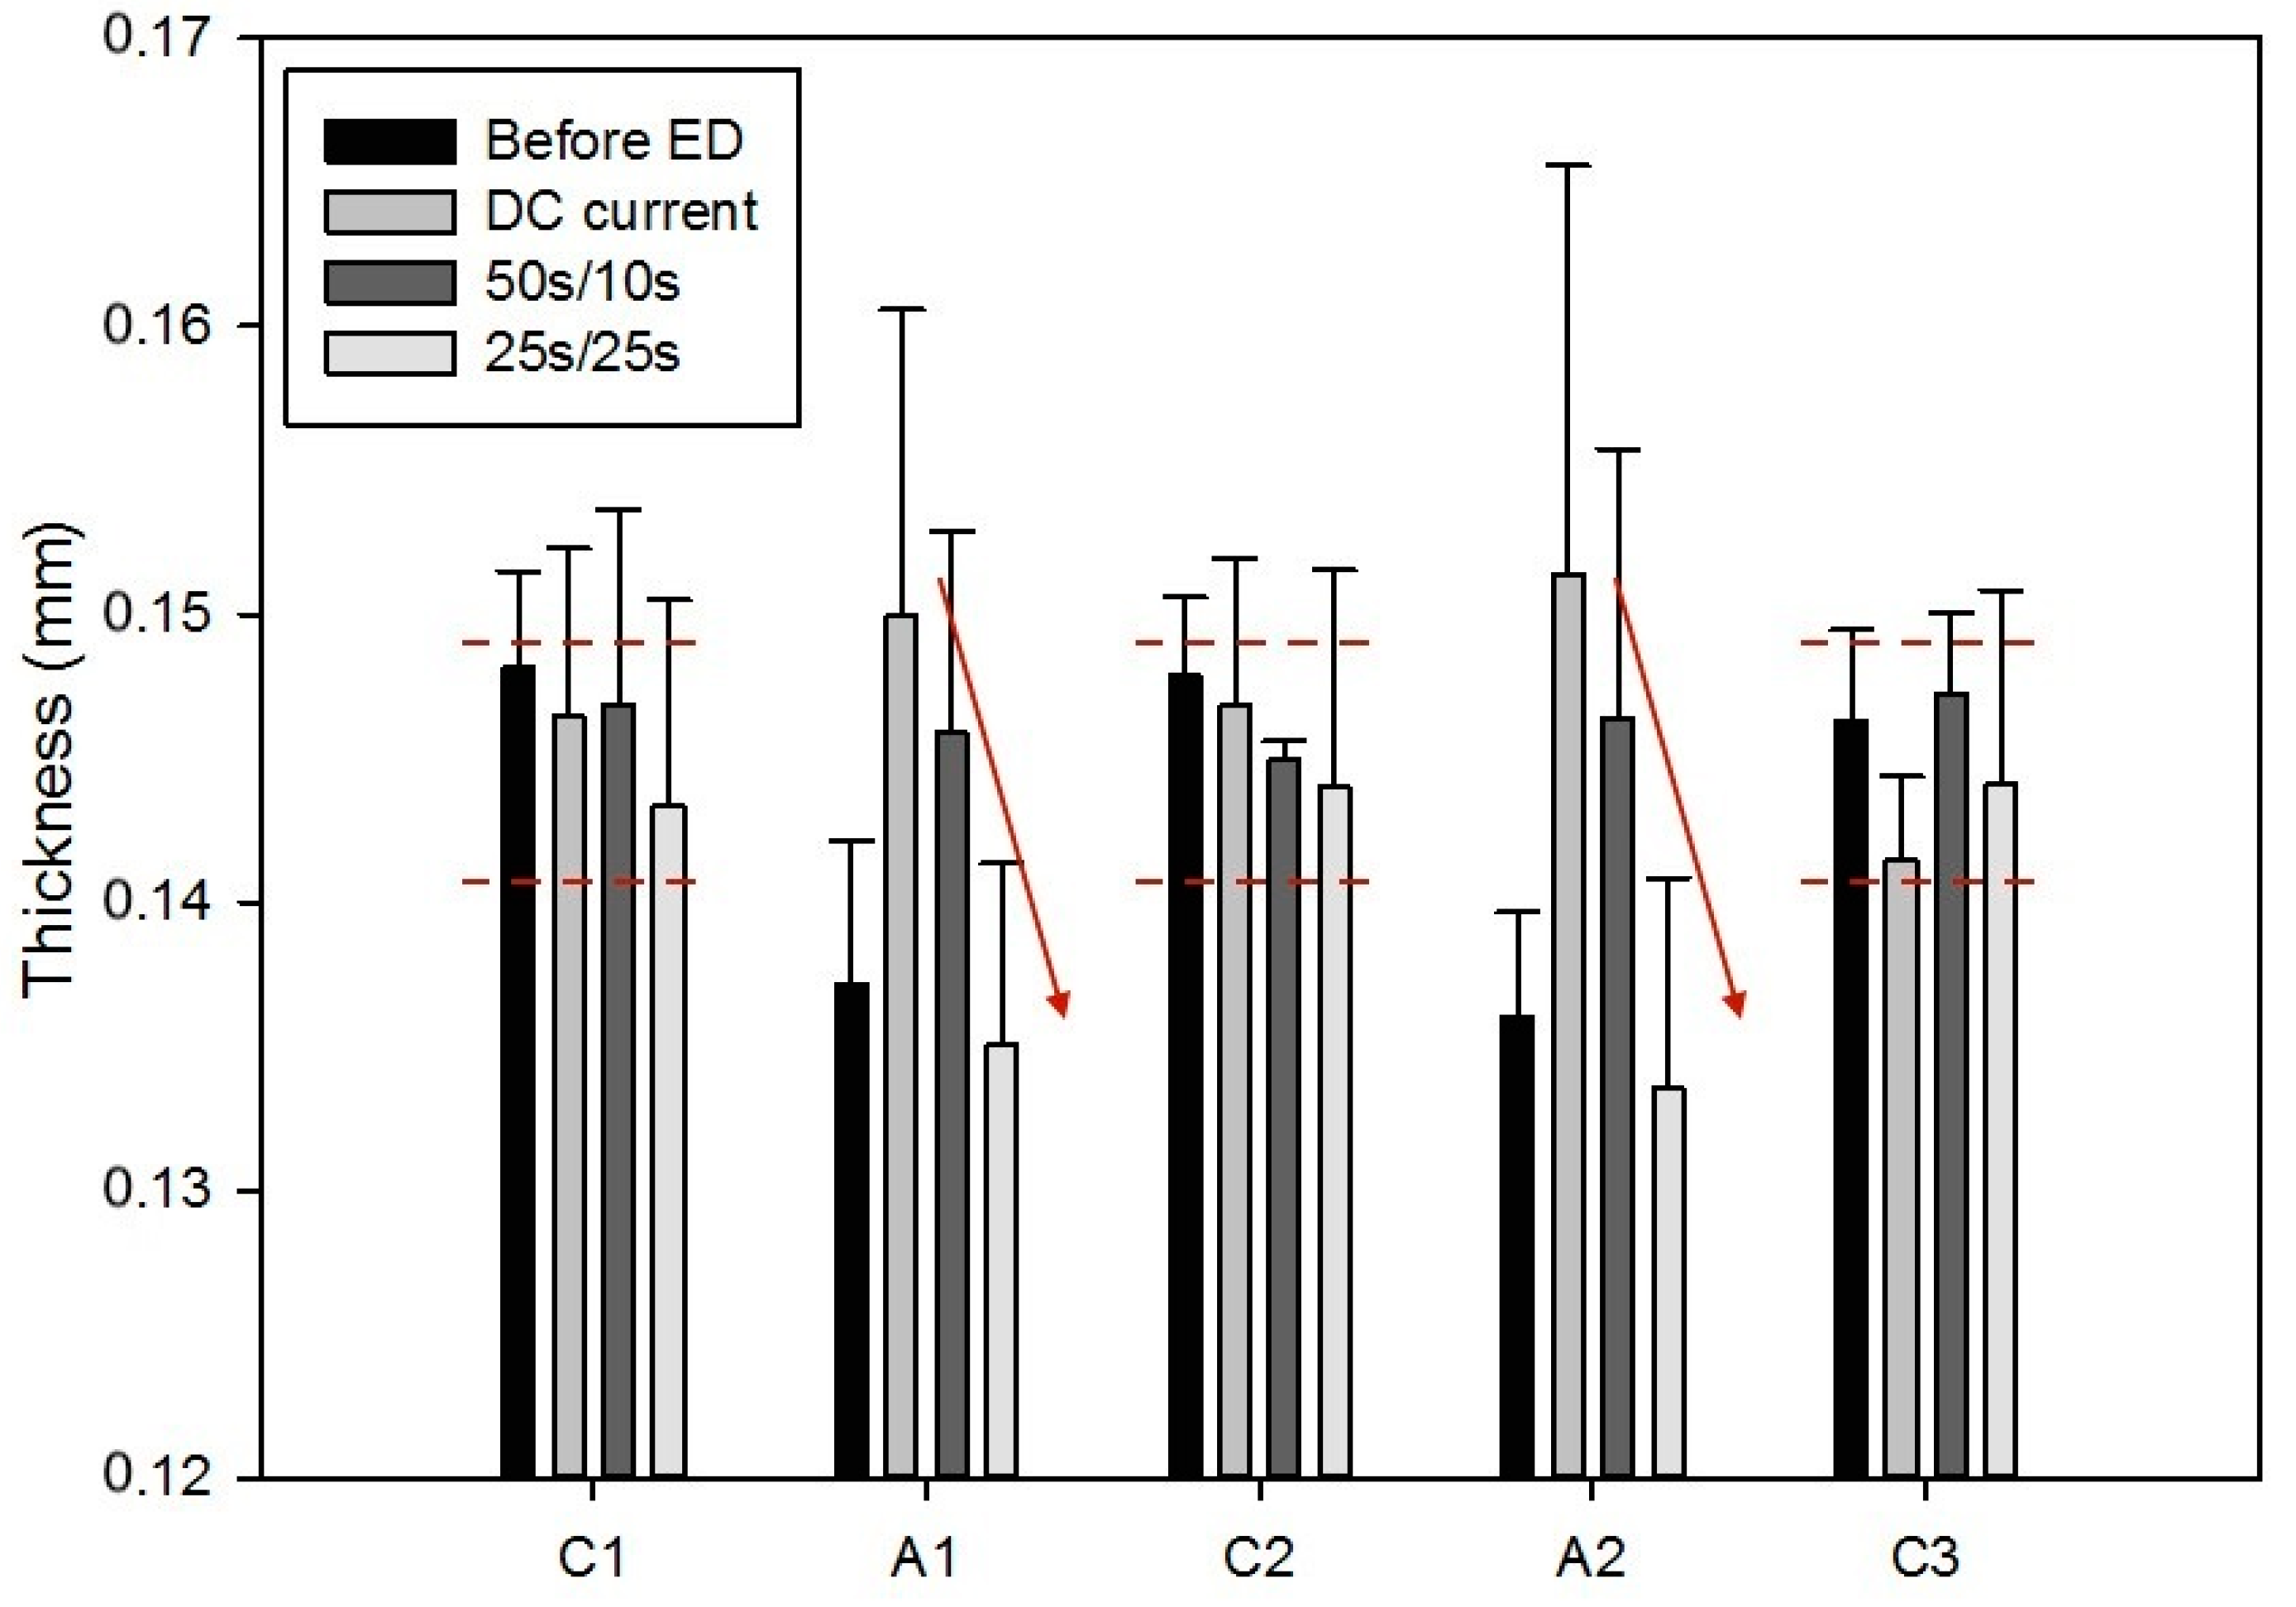
2.3.2. Membrane Thickness and Conductivity
2.4. Scaling Characterization
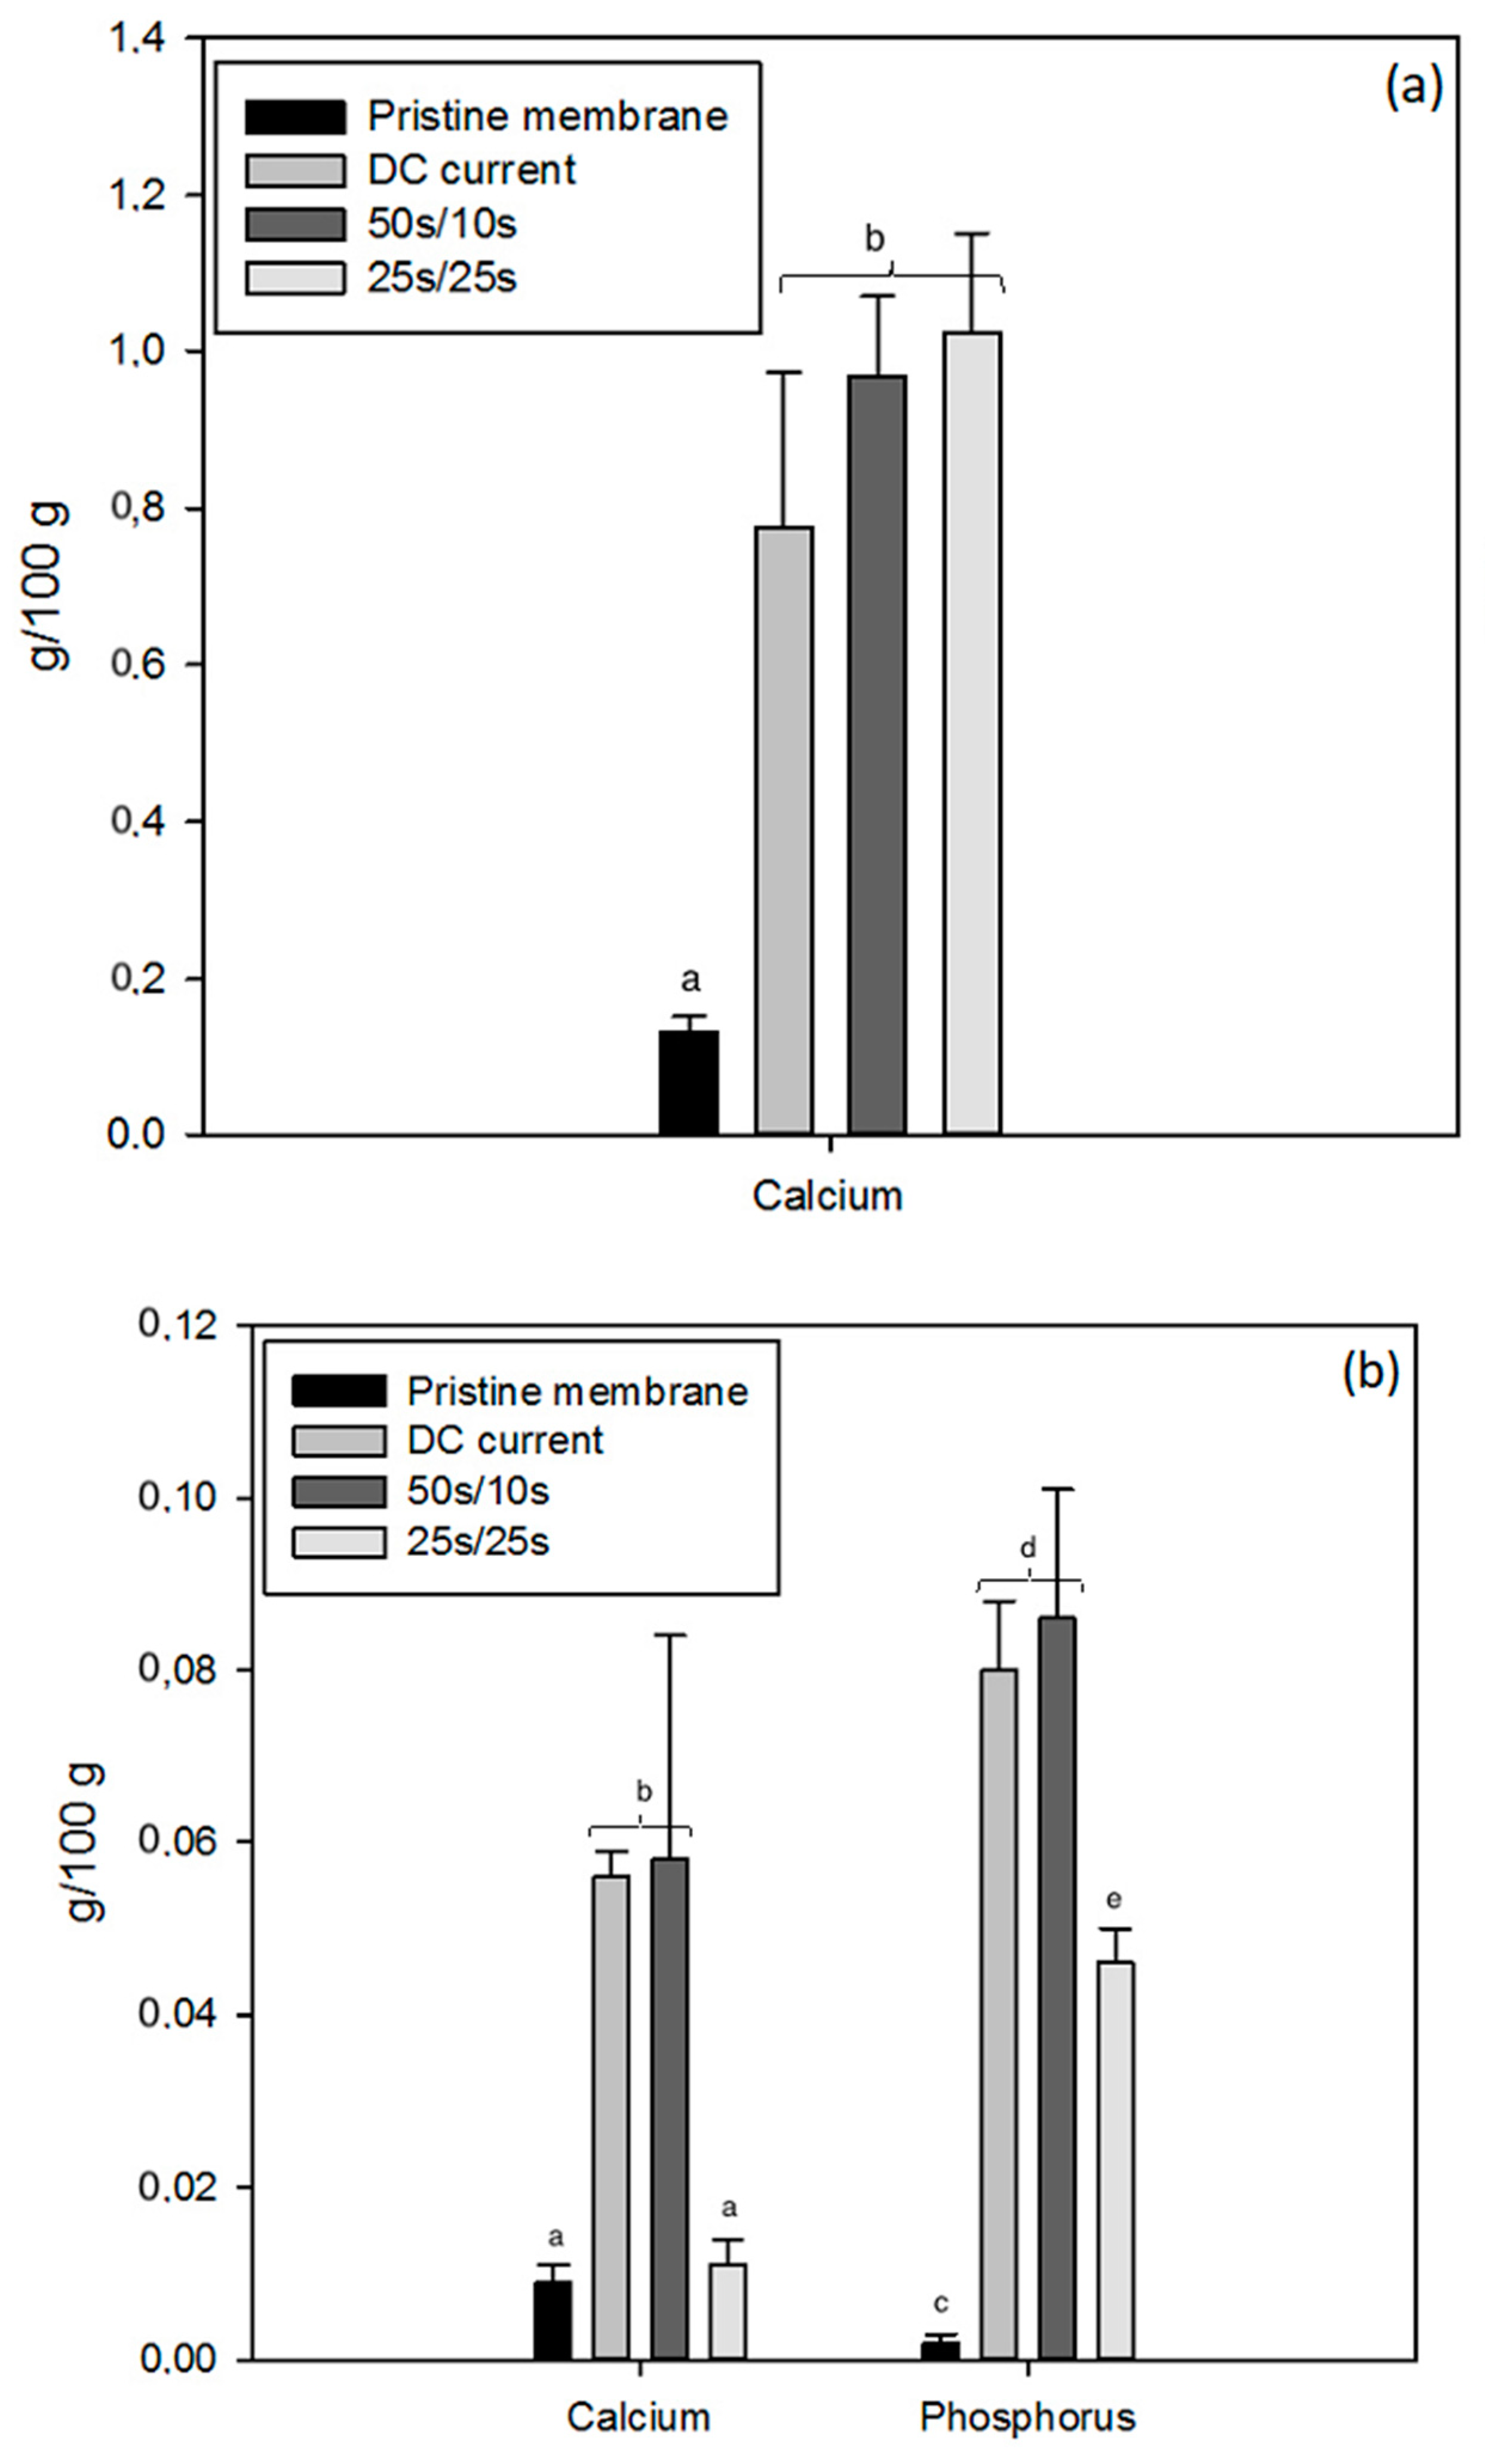
2.4.1. Mineral Content
2.4.2. Scanning Electron Microscopy (SEM), Energy Dispersive Spectroscopy (EDS), and X-ray Diffraction (XRD) Analyses
3. Materials and Methods
3.1. Whey
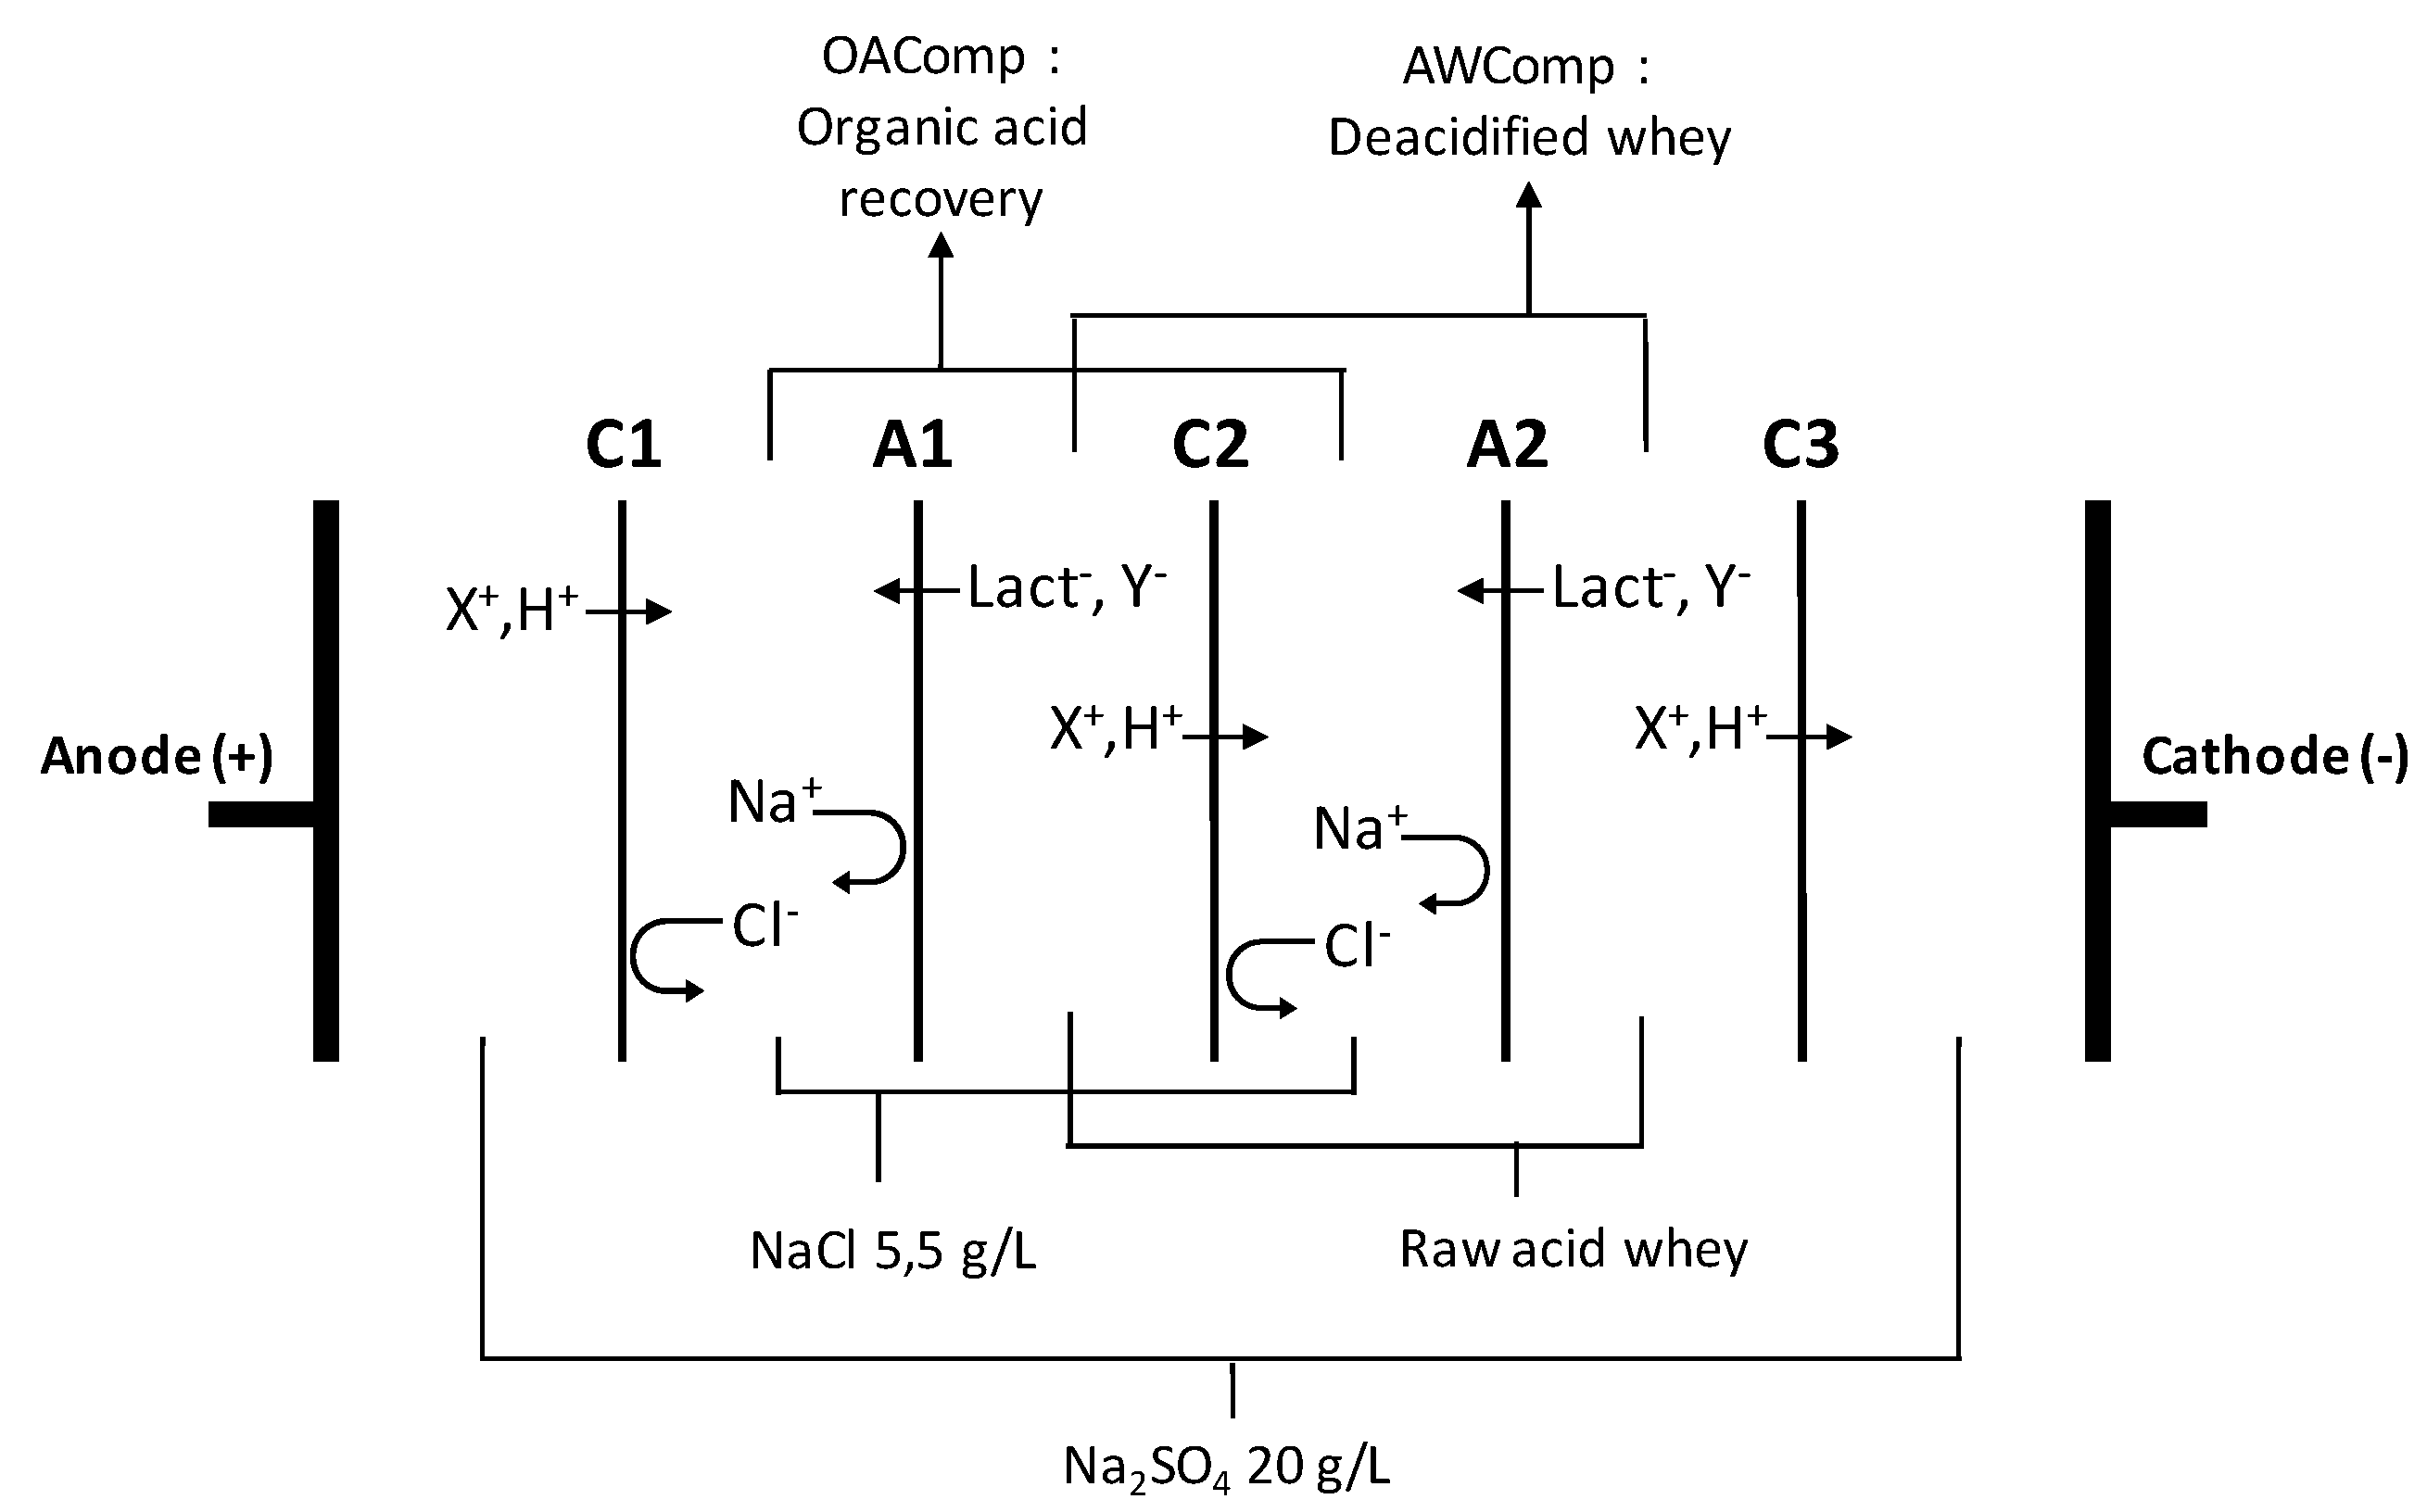
3.2. Electrodialytic Configuration
3.3. Protocol
3.4. Analyses
4. Conclusions
Supplementary Materials
Author Contributions
Funding
Acknowledgments
Conflicts of Interest
References
- Prazeres, A.R.; Carvalho, F.; Rivas, J. Cheese whey management: A review. J. Environ. Manag. 2012, 110, 48–68. [Google Scholar] [CrossRef] [PubMed]
- Ganju, S.; Gogate, P.R. A review on approaches for efficient recovery of whey proteins from dairy industry effluents. J. Food Eng. 2017, 215, 84–96. [Google Scholar] [CrossRef]
- Saffari, M.; Langrish, T. Effect of lactic acid in-process crystallization of lactose/protein powders during spray drying. J. Food Eng. 2014, 137, 88–94. [Google Scholar] [CrossRef]
- Chandrapala, J.; Vasiljevic, T. Properties of spray dried lactose powders influenced by presence of lactic acid and calcium. J. Food Eng. 2017, 198, 63–71. [Google Scholar] [CrossRef]
- Houldsworth, D.W. Whey technology Demineralization of whey by means of ion exchange and electrodialysis. Int. J. Dairy Technol. 1980, 33, 45–51. [Google Scholar] [CrossRef]
- Hoppe, G.K.; Higgins, J.J. Demineralization. In Whey and Lactose Processing; Zadow, J.G., Ed.; Springer: Dordrecht, The Netherlands, 1992; pp. 91–131. [Google Scholar] [CrossRef]
- Greiter, M.; Novalin, S.; Wendland, M.; Kulbe, K.D.; Fischer, J. Desalination of whey by electrodialysis and ion exchange resins: Analysis of both processes with regard to sustainability by calculating their cumulative energy demand. J. Membr. Sci. 2002, 210, 91–102. [Google Scholar] [CrossRef]
- Chandrapala, J.; Chen, G.Q.; Kezia, K.; Bowman, E.G.; Vasiljevic, T.; Kentish, S.E. Removal of lactate from acid whey using nanofiltration. J. Food Eng. 2016, 177, 59–64. [Google Scholar] [CrossRef]
- Bédas, M.; Tanguy, G.; Dolivet, A.; Méjean, S.; Gaucheron, F.; Garric, G.; Senard, G.; Jeantet, R.; Schuck, P. Nanofiltration of lactic acid whey prior to spray drying: Scaling up to a semi-industrial scale. LWT Food Sci. Technol. 2017, 79, 355–360. [Google Scholar] [CrossRef]
- Chen, G.Q.; Eschbach, F.I.I.; Weeks, M.; Gras, S.L.; Kentish, S.E. Removal of lactic acid from acid whey using electrodialysis. Sep. Purif. Technol. 2016, 158, 230–237. [Google Scholar] [CrossRef]
- Dufton, G.; Mikhaylin, S.; Gaaloul, S.; Bazinet, L. How electrodialysis configuration influences the acid whey deacidification and membrane scaling. J. Dairy Sci. 2018, 101, 7833–7850. [Google Scholar] [CrossRef]
- Balster, J.; Krupenko, O.; Pünt, I.; Stamatialis, D.F.; Wessling, M. Preparation and characterisation of monovalent ion selective cation exchange membranes based on sulphonated poly(ether ether ketone). J. Membr. Sci. 2005, 263, 137–145. [Google Scholar] [CrossRef]
- Casademont, C.; Pourcelly, G.; Bazinet, L. Effect of magnesium/calcium ratios in solutions treated by electrodialysis: Morphological characterization and identification of anion-exchange membrane fouling. J. Colloid Interface Sci. 2008, 322, 215–223. [Google Scholar] [CrossRef] [PubMed]
- Mikhaylin, S.; Bazinet, L. Fouling on ion-exchange membranes: Classification, characterization and strategies of prevention and control. Adv. Colloid Interface Sci. 2016, 229, 34–56. [Google Scholar] [CrossRef] [PubMed]
- Cifuentes-Araya, N.; Pourcelly, G.; Bazinet, L. Impact of pulsed electric field on electrodialysis process performance and membrane fouling during consecutive demineralization of a model salt solution containing a high magnesium/calcium ratio. J. Colloid Interface Sci. 2011, 361, 79–89. [Google Scholar] [CrossRef] [PubMed]
- Andreeva, M.A.; Gil, V.V.; Pismenskaya, N.D.; Dammak, L.; Kononenko, N.A.; Larchet, C.; Grande, D.; Nikonenko, V.V. Mitigation of membrane scaling in electrodialysis by electroconvection enhancement, pH adjustment and pulsed electric field application. J. Membr. Sci. 2018, 549, 129–140. [Google Scholar] [CrossRef]
- Mikhaylin, S.; Nikonenko, V.; Pourcelly, G.; Bazinet, L. Intensification of demineralization process and decrease in scaling by application of pulsed electric field with short pulse/pause conditions. J. Membr. Sci. 2014, 468, 389–399. [Google Scholar] [CrossRef]
- Mishchuk, N.A.; Koopal, L.K.; Gonzalez-Caballero, F. Intensification of electrodialysis by applying a non-stationary electric field. Colloids Surf. A Physicochem. Eng. Asp. 2001, 176, 195–212. [Google Scholar] [CrossRef]
- Malek, P.; Ortiz, J.M.; Richards, B.S.; Schäfer, A.I. Electrodialytic removal of NaCl from water: Impacts of using pulsed electric potential on ion transport and water dissociation phenomena. J. Membr. Sci. 2013, 435, 99–109. [Google Scholar] [CrossRef]
- Sistat, P.; Huguet, P.; Ruiz, B.; Pourcelly, G.; Mareev, S.A.; Nikonenko, V.V. Effect of pulsed electric field on electrodialysis of a NaCl solution in sub-limiting current regime. Electrochim. Acta 2015, 164, 267–280. [Google Scholar] [CrossRef]
- Pelletier, S.; Serre, É.; Mikhaylin, S.; Bazinet, L. Optimization of cranberry juice deacidification by electrodialysis with bipolar membrane: Impact of pulsed electric field conditions. Sep. Purif. Technol. 2017, 186, 106–116. [Google Scholar] [CrossRef]
- Zabolotskii, V.I.; Bugakov, V.V.; Sharafan, M.V.; Chermit, R.K. Transfer of electrolyte ions and water dissociation in anion-exchange membranes under intense current conditions. Russ. J. Electrochem. 2012, 48, 650–659. [Google Scholar] [CrossRef]
- Krol, J.J.; Wessling, M.; Strathmann, H. Concentration polarization with monopolar ion exchange membranes: Current-voltage curves and water dissociation. J. Membr. Sci. 1999, 162, 145–154. [Google Scholar] [CrossRef]
- Lin Teng Shee, F.; Arul, J.; Brunet, S.; Bazinet, L. Performing a three-step process for conversion of chitosan to its oligomers using a unique bipolar membrane electrodialysis system. J. Agric. Food Chem. 2008, 56, 10019–10026. [Google Scholar] [CrossRef] [PubMed]
- Cifuentes-Araya, N.; Pourcelly, G.; Bazinet, L. Water splitting proton-barriers for mineral membrane fouling control and their optimization by accurate pulsed modes of electrodialysis. J. Membr. Sci. 2013, 447, 433–441. [Google Scholar] [CrossRef]
- Firdaous, L.; Malériat, J.P.; Schlumpf, J.P.; Quéméneur, F. Transfer of monovalent and divalent cations in salt solutions by electrodialysis. Sep. Sci. Technol. 2007, 42, 931–948. [Google Scholar] [CrossRef]
- Destainville, A.; Champion, E.; Laborde, E. Synthesis, characterization and thermal behavior of apatitic tricalcium phosphate. Mater. Chem. Phys. 2003, 80, 269–277. [Google Scholar] [CrossRef]
- Dorozhkin, S.V. Amorphous calcium (ortho)phosphates. Acta Biomater. 2010, 6, 4457–4475. [Google Scholar] [CrossRef]
- Dorozhkin, S.V. Biphasic, Triphasic, and Multiphasic Calcium Orthophosphates. In Advanced Ceramic Materials; John Wiley & Sons: Hoboken, NJ, USA, 2016; pp. 33–95. [Google Scholar] [CrossRef]
- Panesar, P.S.; Kennedy, J.F.; Gandhi, D.N.; Bunko, K. Bioutilisation of whey for lactic acid production. Food Chem. 2007, 105, 1–14. [Google Scholar] [CrossRef]
- Cowan, D.A.; Brown, J.H. Limiting Current in Electrodialysis Cells. Ind. Eng. Chem. 1959, 51, 1445–1448. [Google Scholar] [CrossRef]
- Lteif, R.; Dammak, L.; Larchet, C.; Auclair, B. Conductivitéélectrique membranaire: Étude de l’effet de la concentration, de la nature de l’électrolyte et de la structure membranaire. Eur. Polym. J. 1999, 35, 1187–1195. [Google Scholar] [CrossRef]
- Lebrun, L.; da Silva, E.; Pourcelly, G.; Métayer, M. Elaboration and characterisation of ion-exchange films used in the fabrication of bipolar membranes. J. Membr. Sci. 2003, 227, 95–111. [Google Scholar] [CrossRef]


| Time | DC | PEF 50 s/10 s | PEF 25 s/25 s |
|---|---|---|---|
| Before ED | 9.70 ± 2.22a | 7.56 ± 2.00a | 7.35 ± 1.02a |
| After ED | 7.67 ± 0.84a | 6.35 ± 1.72a | 6.84 ± 1.58a |
| Composition | Unit | Acid Whey | Acid Whey from First Study [11] | Values Reported in the Literature [3,9,10,30] |
|---|---|---|---|---|
| Total solids | g/L | 57.2 ± 1.5 | 59.8 ± 4.2 | 50.0–70.0 |
| Total protein | g/L | 7.5 ± 1.1 | 6.5 ± 0.7 | 4.2–10.0 |
| Lactose | g/L | 34.9 ± 1.0 | 41.2 ± 0.9 | 38–49 |
| Minerals | g/L | 6.9 ± 0.1 | 5.1 ± 1.1 | 4.7–7.0 |
| P | g/L | 0.76 ± 0.02 | 0.55 ± 0.01 | 0.44–0.90 |
| Ca | g/L | 1.08 ± 0.02 | 0.86 ± 0.02 | 0.43–1.60 |
| K | g/L | 1.65 ± 0.03 | 1.26 ± 0.05 | 1.28–1.82 |
| Mg | g/L | 0.10 ± 0.00 | 0.09 ± 0.00 | 0.09–0.19 |
| Na | g/L | 0.53 ± 0.02 | 0.39 ± 0.03 | 0.40–0.61 |
| Lactate | g/L | 7.12 ± 0.11 | 7.00 ± 0.14 | 5.18–8.00 |
| Ratio Lactate/Lactose | No unit | 0.20 | 0.17 | 0.12–0.15 |
| pH | No unit | 4.6 | 4.4 | 4.0–4.6 |
| Conductivity | mS/cm2 | 7.09 ± 0.35 | 7.05 ± 0.24 | 8.27 ± 0.42 |
© 2019 by the authors. Licensee MDPI, Basel, Switzerland. This article is an open access article distributed under the terms and conditions of the Creative Commons Attribution (CC BY) license (http://creativecommons.org/licenses/by/4.0/).
Share and Cite
Dufton, G.; Mikhaylin, S.; Gaaloul, S.; Bazinet, L. Positive Impact of Pulsed Electric Field on Lactic Acid Removal, Demineralization and Membrane Scaling during Acid Whey Electrodialysis. Int. J. Mol. Sci. 2019, 20, 797. https://doi.org/10.3390/ijms20040797
Dufton G, Mikhaylin S, Gaaloul S, Bazinet L. Positive Impact of Pulsed Electric Field on Lactic Acid Removal, Demineralization and Membrane Scaling during Acid Whey Electrodialysis. International Journal of Molecular Sciences. 2019; 20(4):797. https://doi.org/10.3390/ijms20040797
Chicago/Turabian StyleDufton, Guillaume, Sergey Mikhaylin, Sami Gaaloul, and Laurent Bazinet. 2019. "Positive Impact of Pulsed Electric Field on Lactic Acid Removal, Demineralization and Membrane Scaling during Acid Whey Electrodialysis" International Journal of Molecular Sciences 20, no. 4: 797. https://doi.org/10.3390/ijms20040797
APA StyleDufton, G., Mikhaylin, S., Gaaloul, S., & Bazinet, L. (2019). Positive Impact of Pulsed Electric Field on Lactic Acid Removal, Demineralization and Membrane Scaling during Acid Whey Electrodialysis. International Journal of Molecular Sciences, 20(4), 797. https://doi.org/10.3390/ijms20040797