A Phase II, Double-Blind, Randomized, Placebo-Controlled, Multicenter Study Evaluating the Efficacy and Safety of Alpha-1 Antitrypsin (AAT) (Glassia®) in the Treatment of Recent-Onset Type 1 Diabetes

 , , ,
, , ,
Abstract
1. Introduction
2. Results
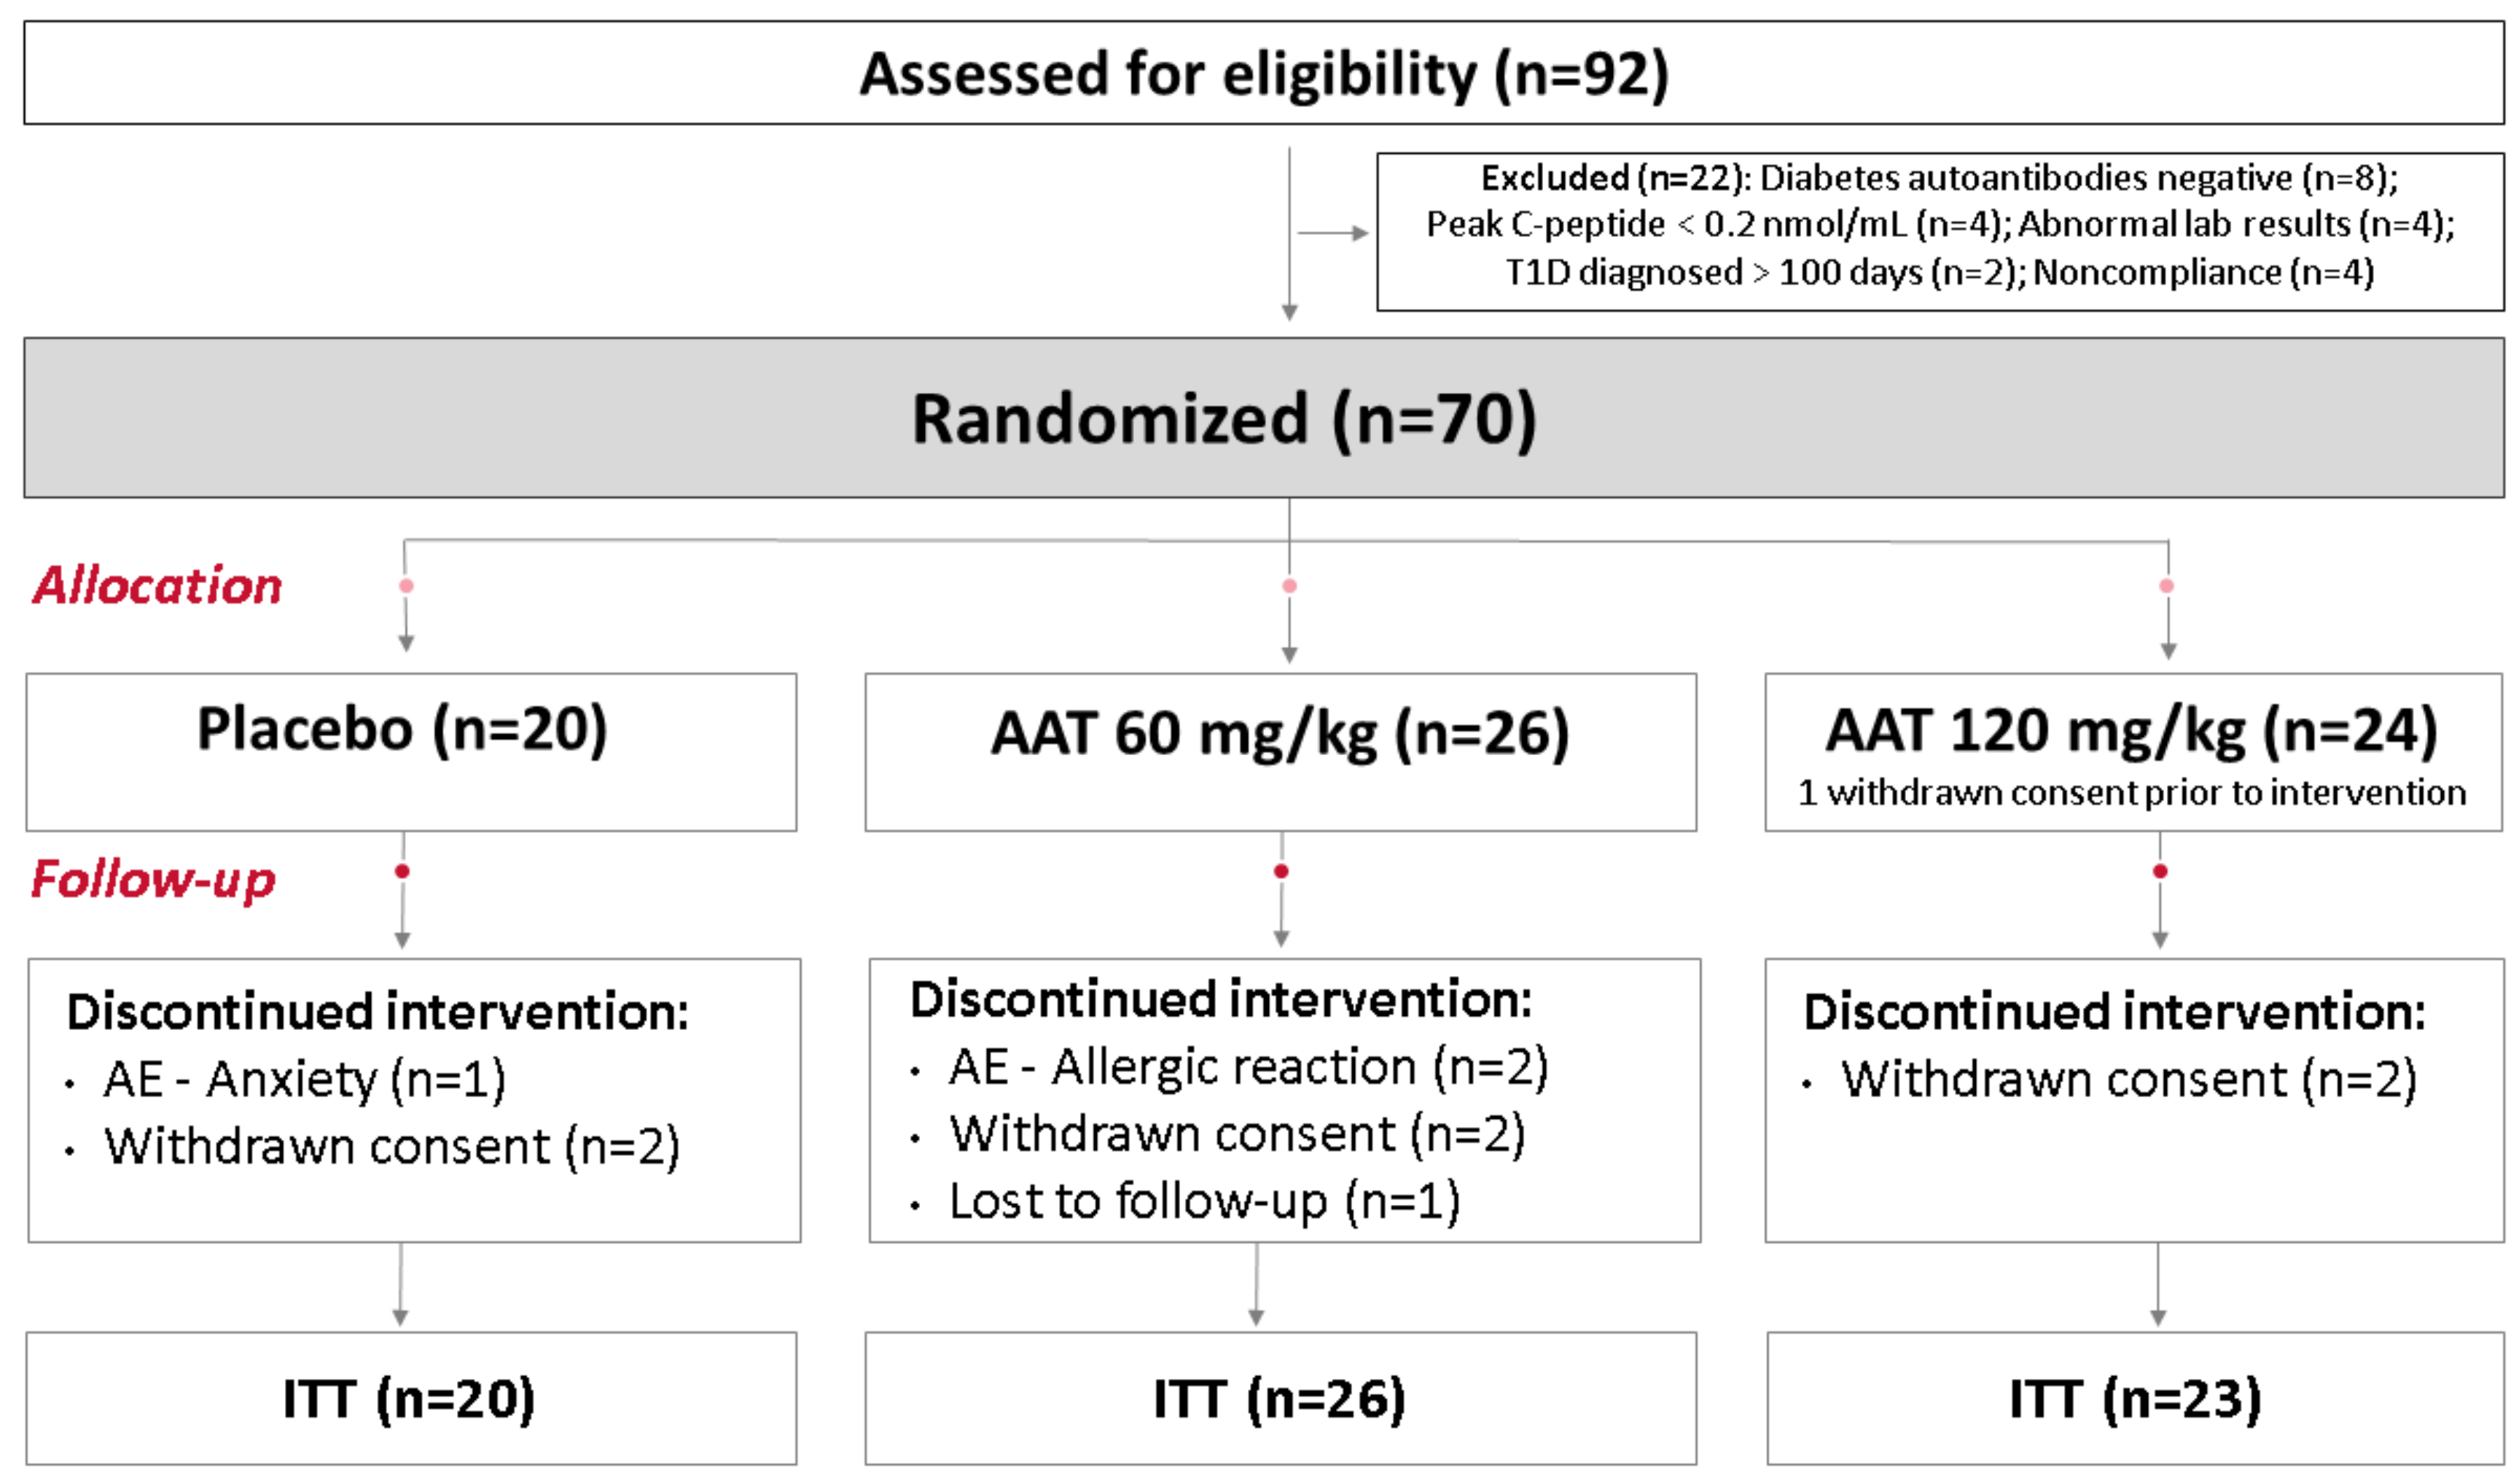
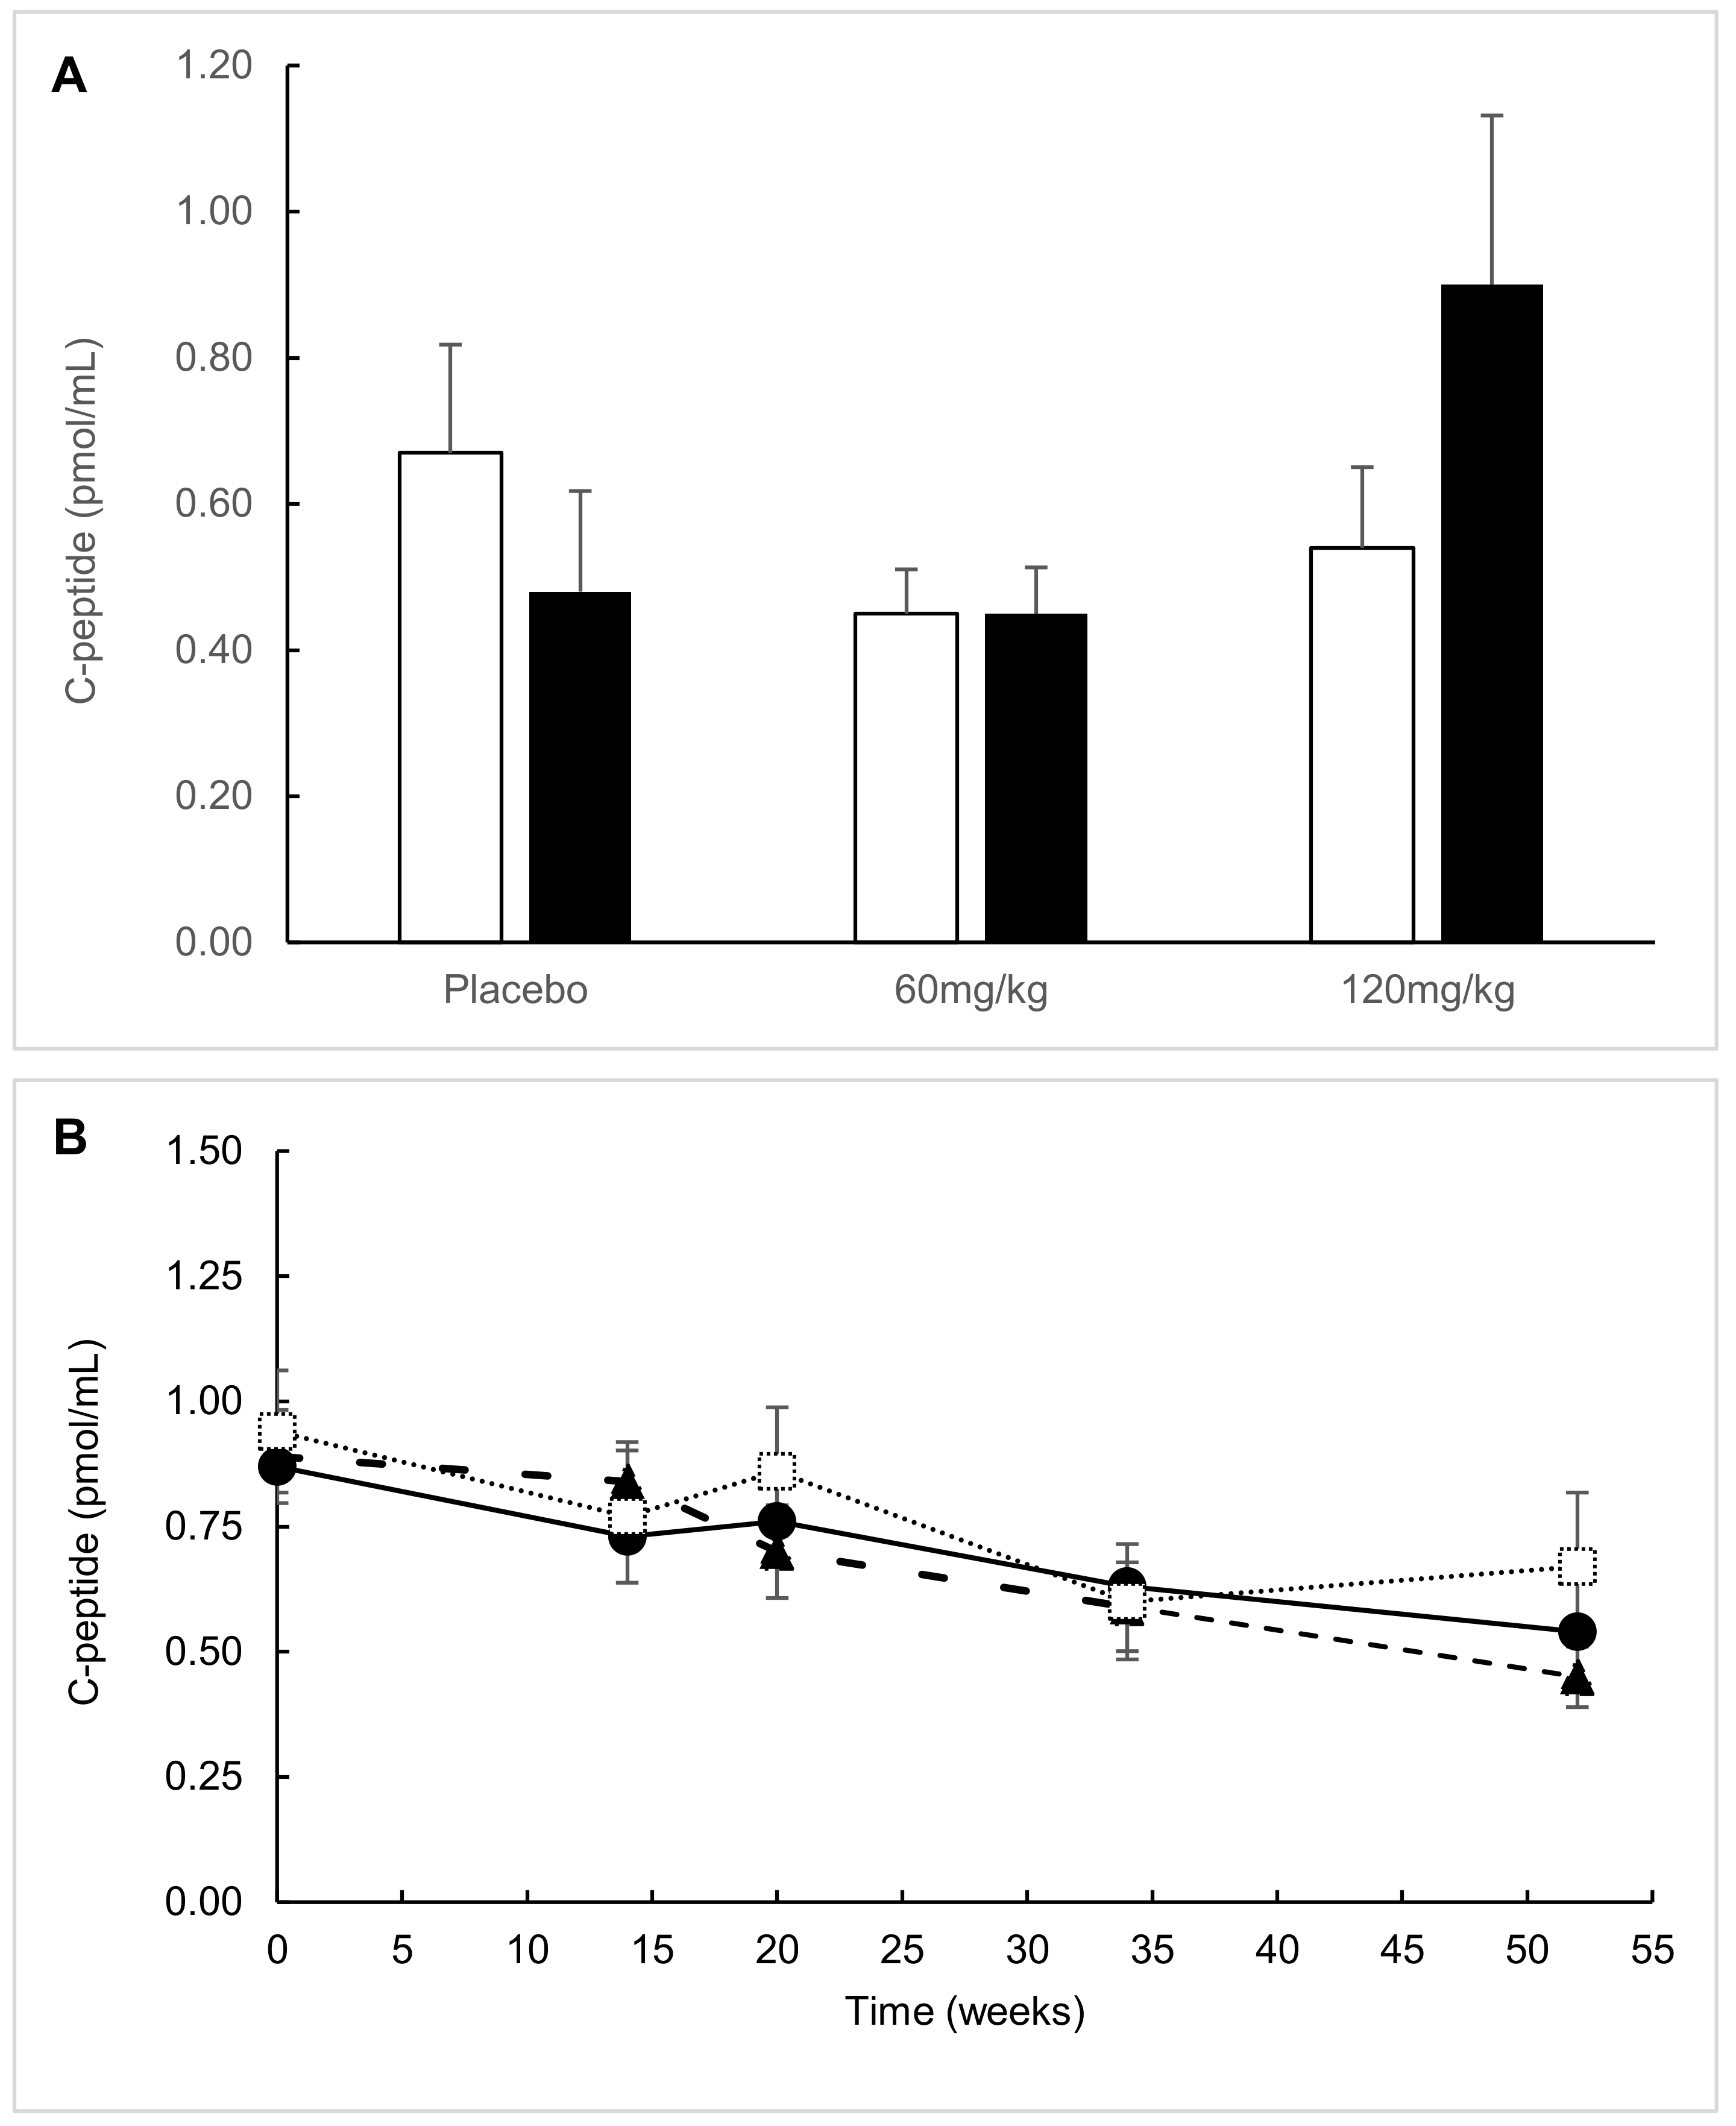
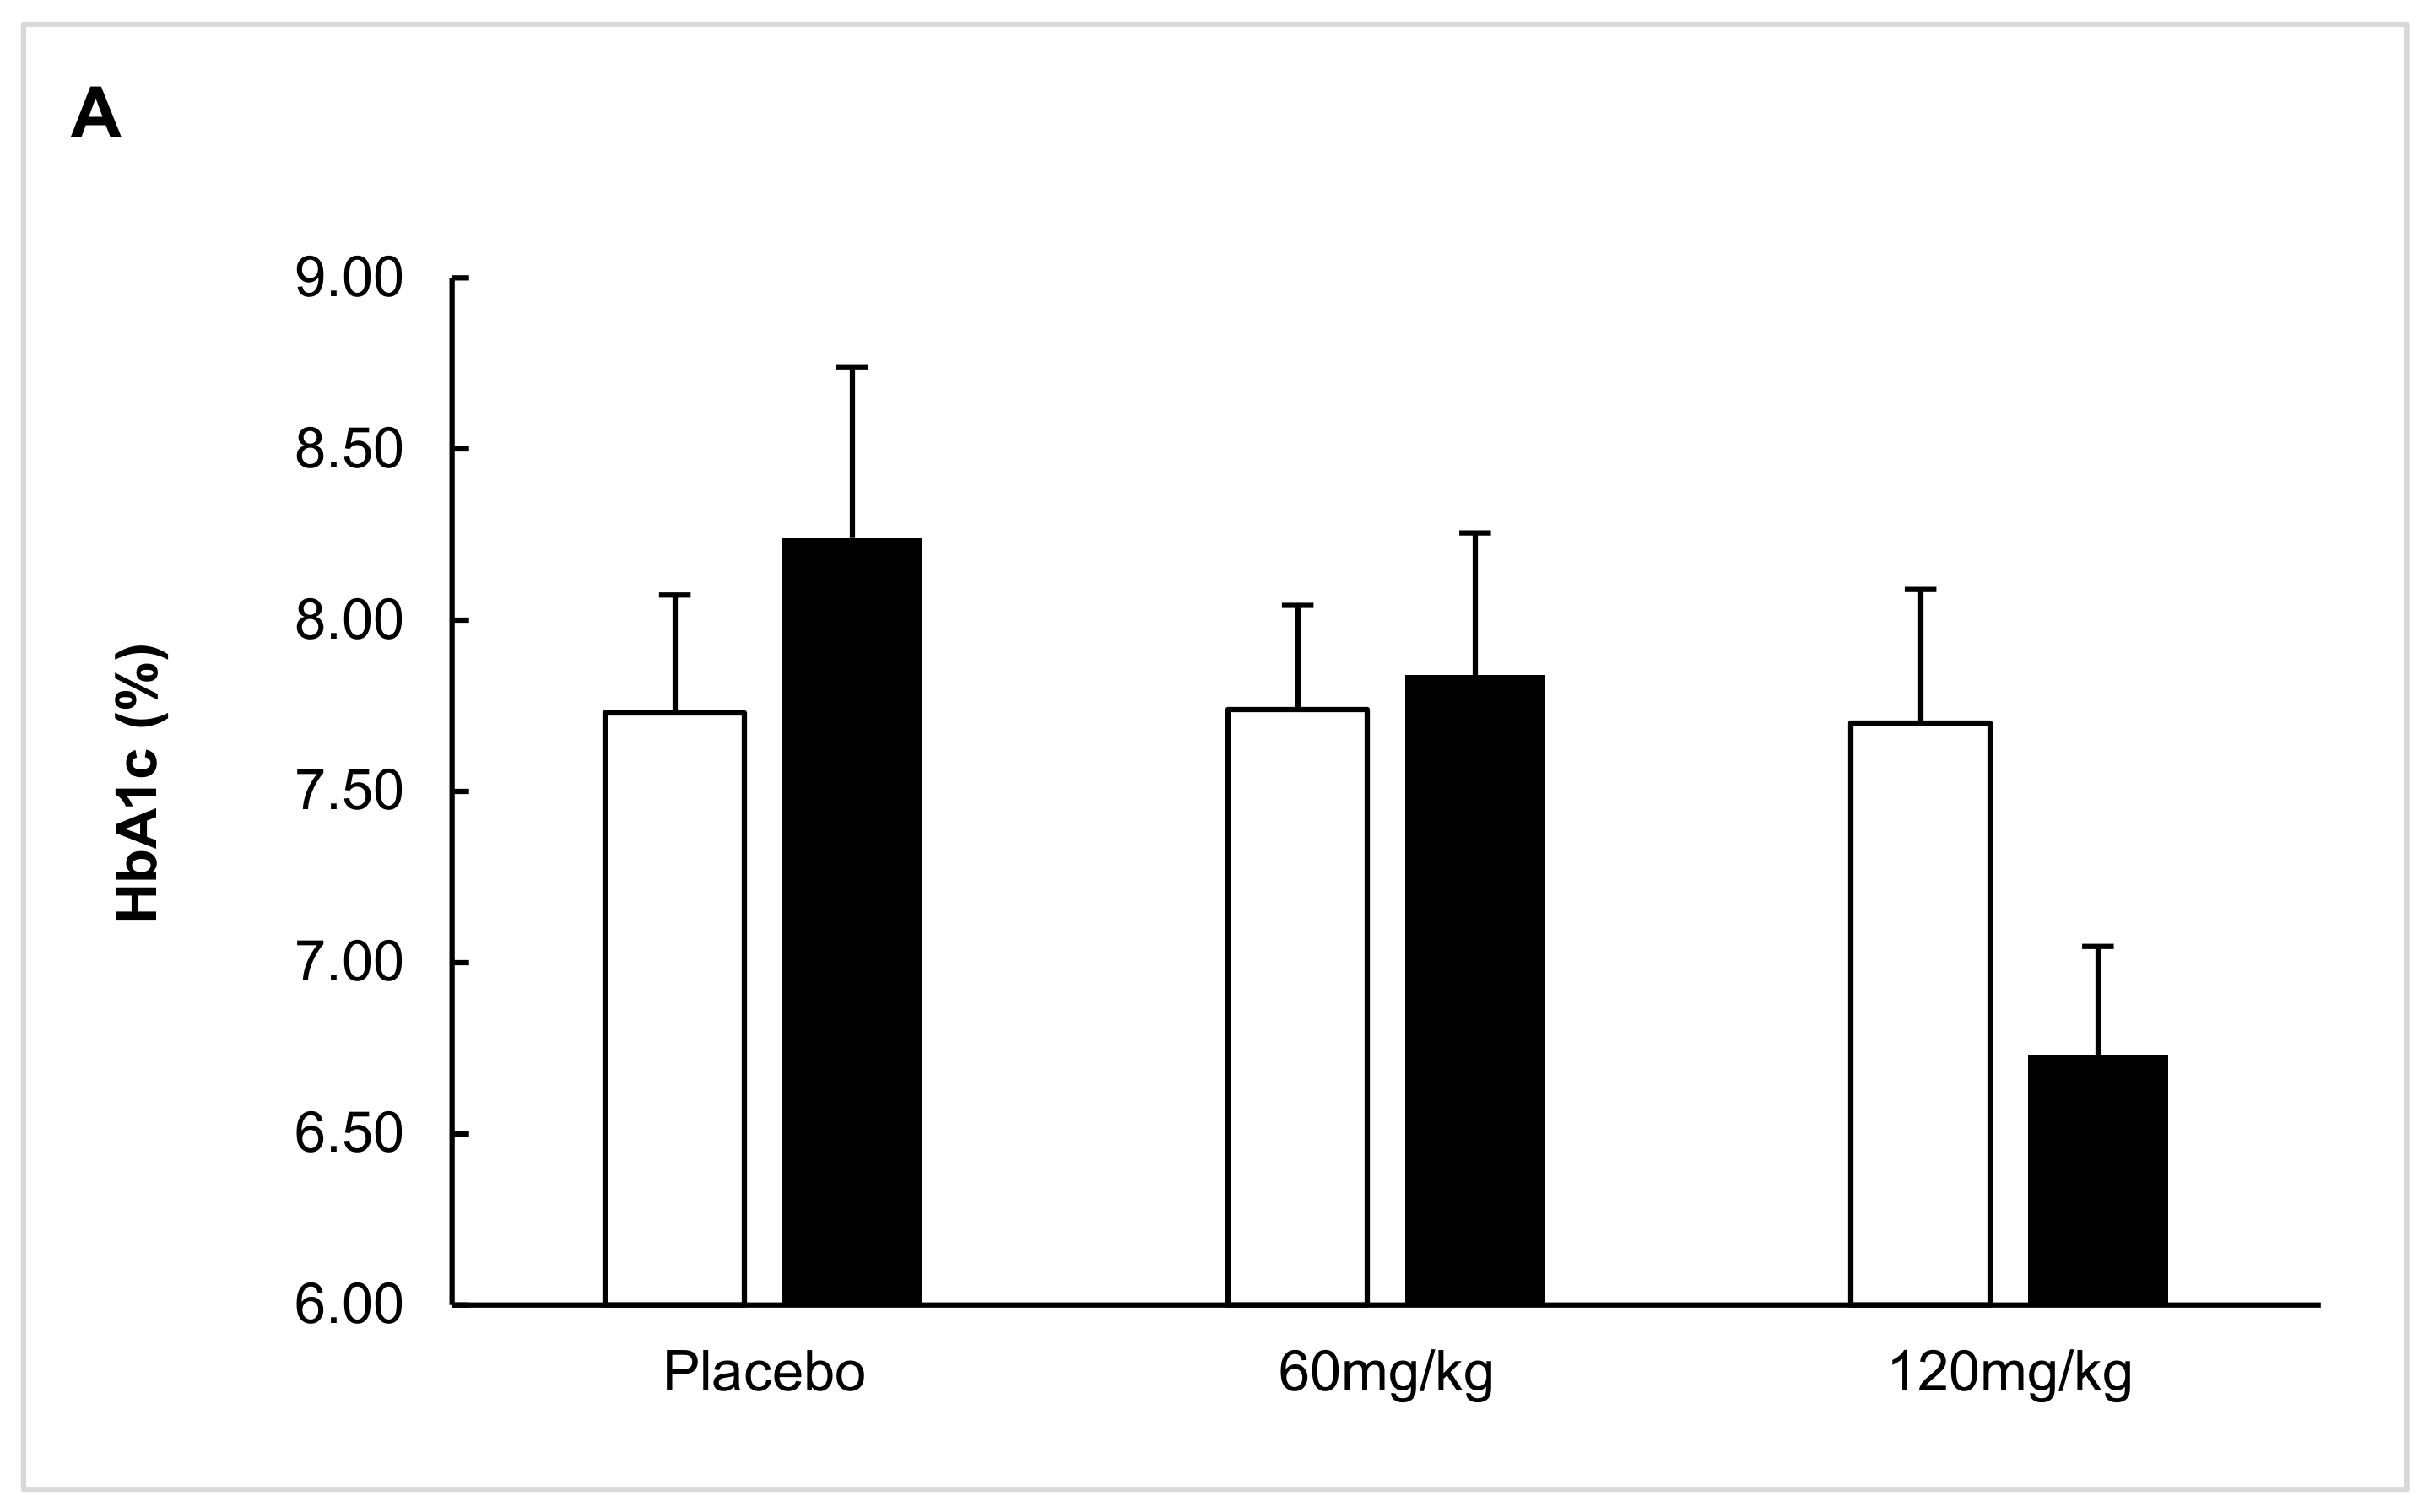
2.1. ITT Analysis
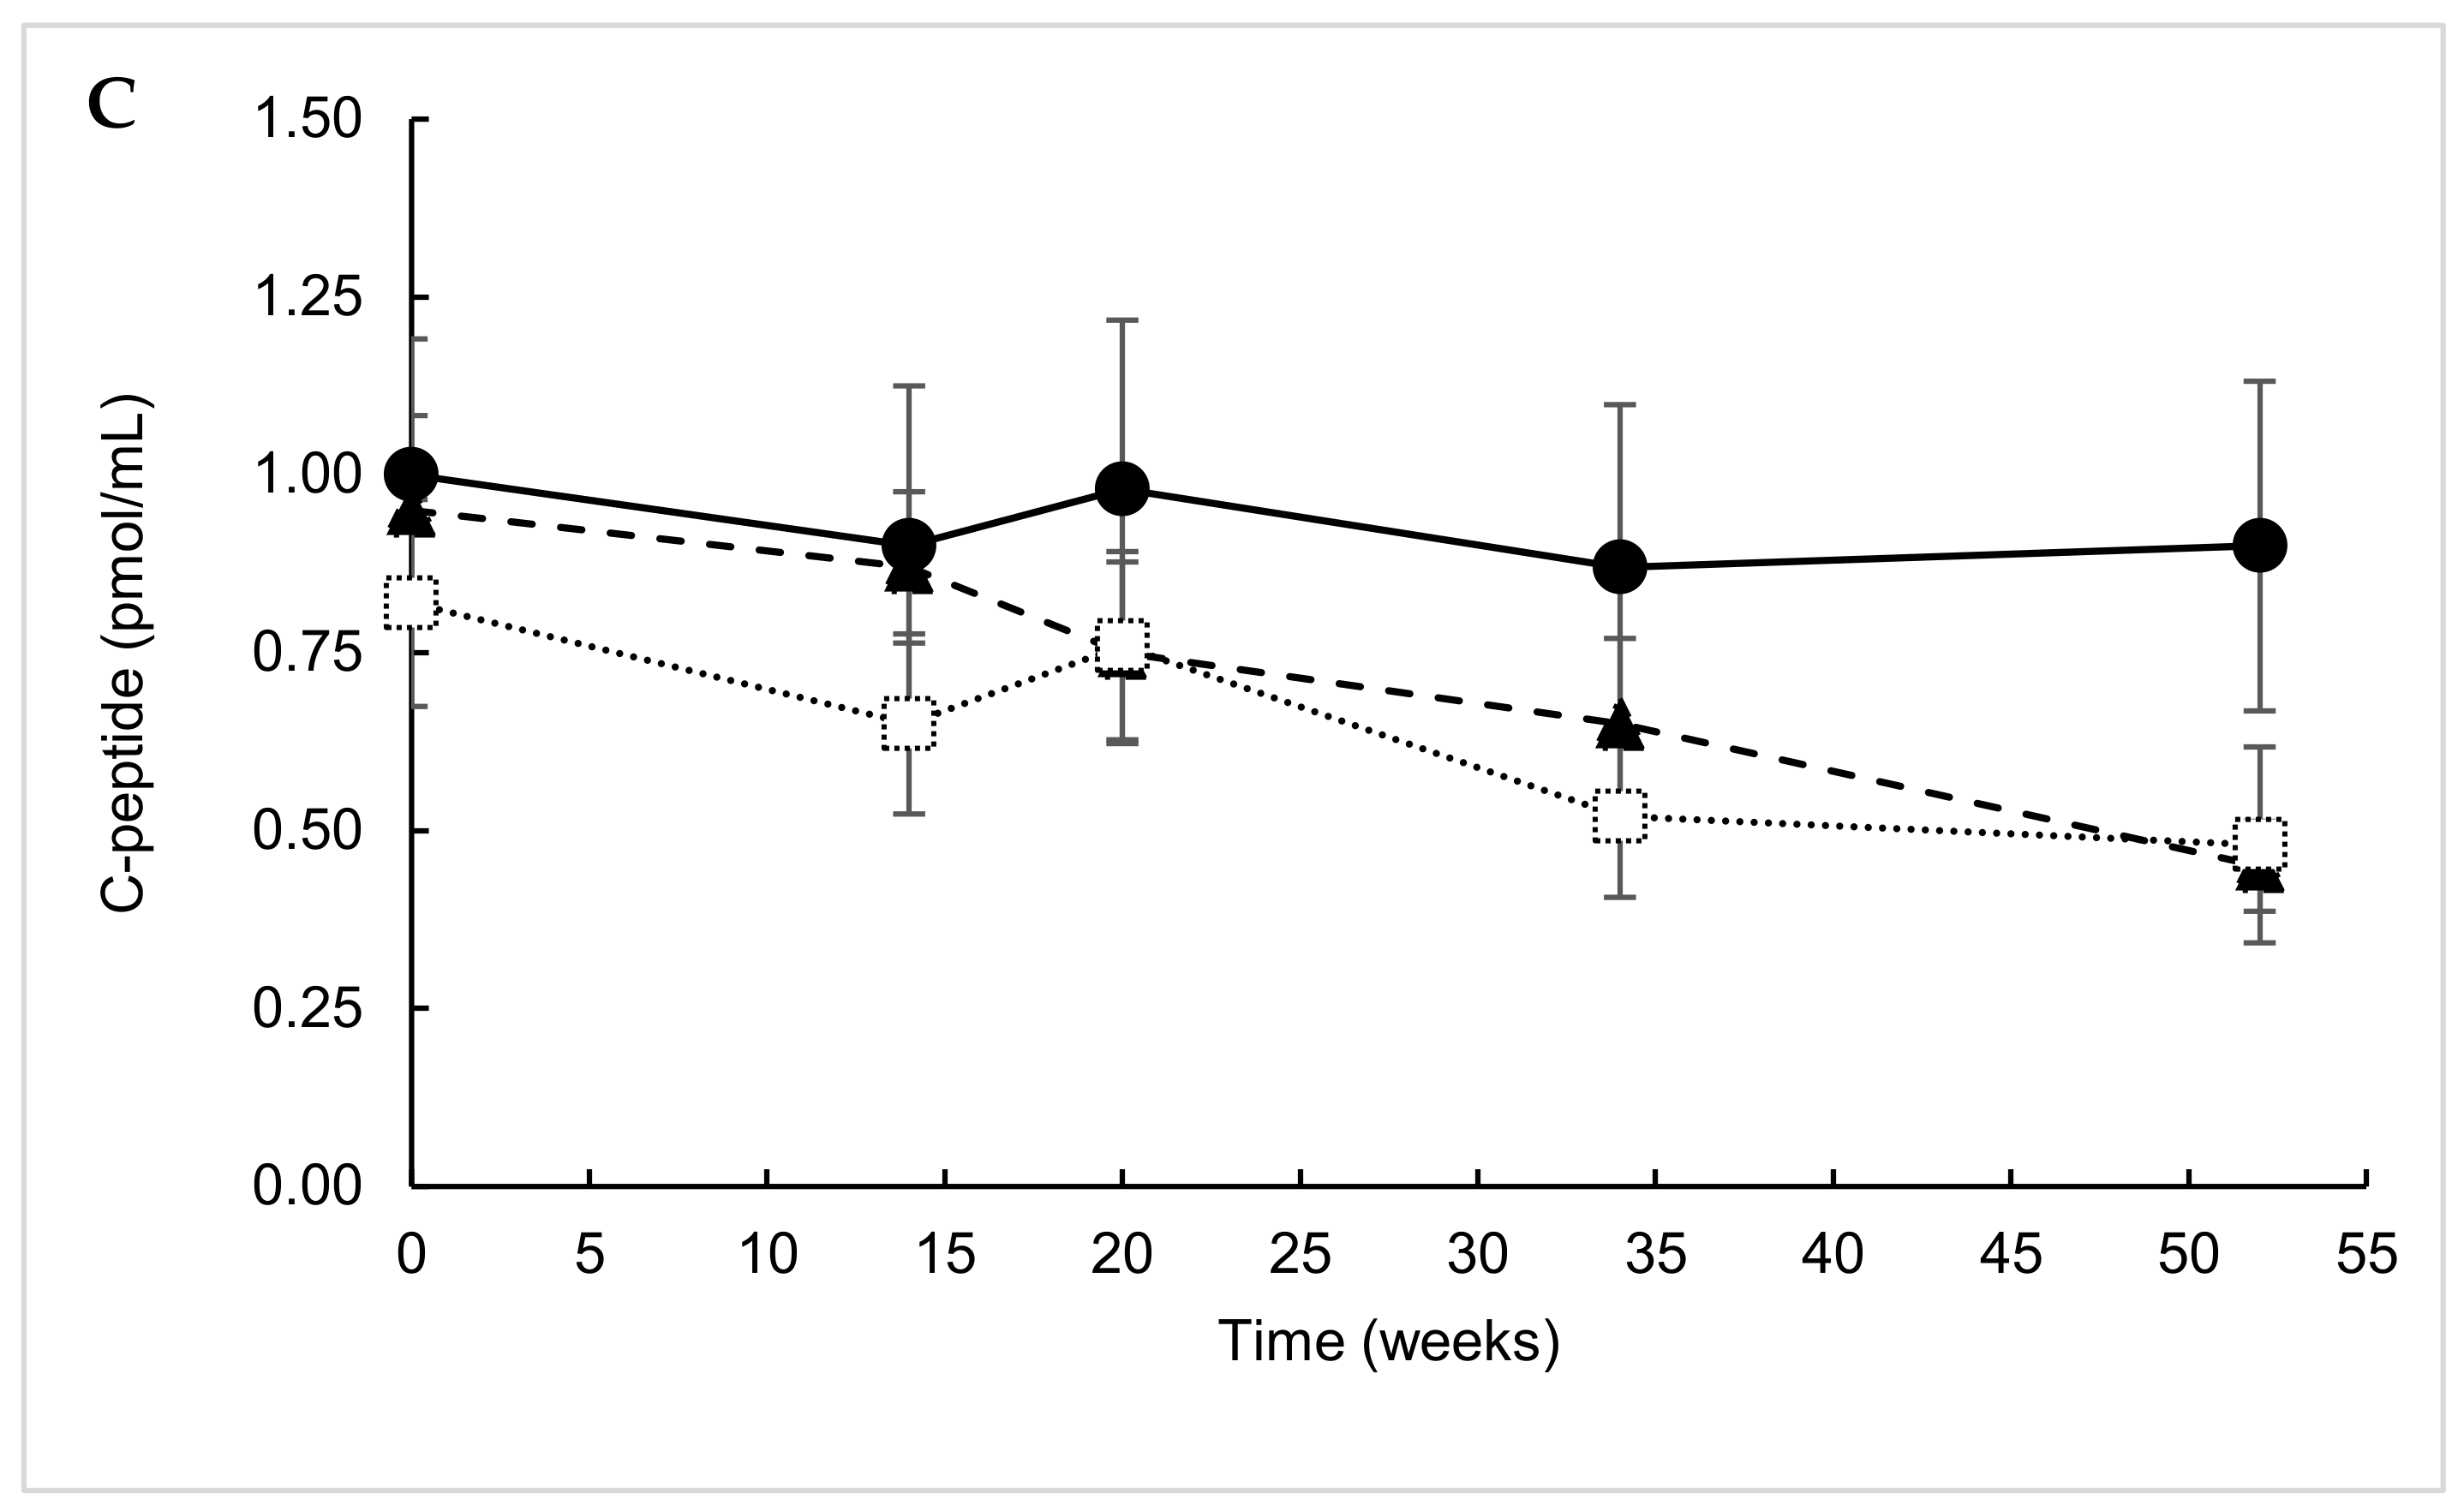
2.2. Predefined Subgroup Analysis
2.3. Responders’ Analysis
2.4. Exploratory Analysis
2.5. Post Hoc Parametric Multivariate Analysis
2.6. Safety Parameters
3. Discussion
4. Research Design and Methods
4.1. Participants
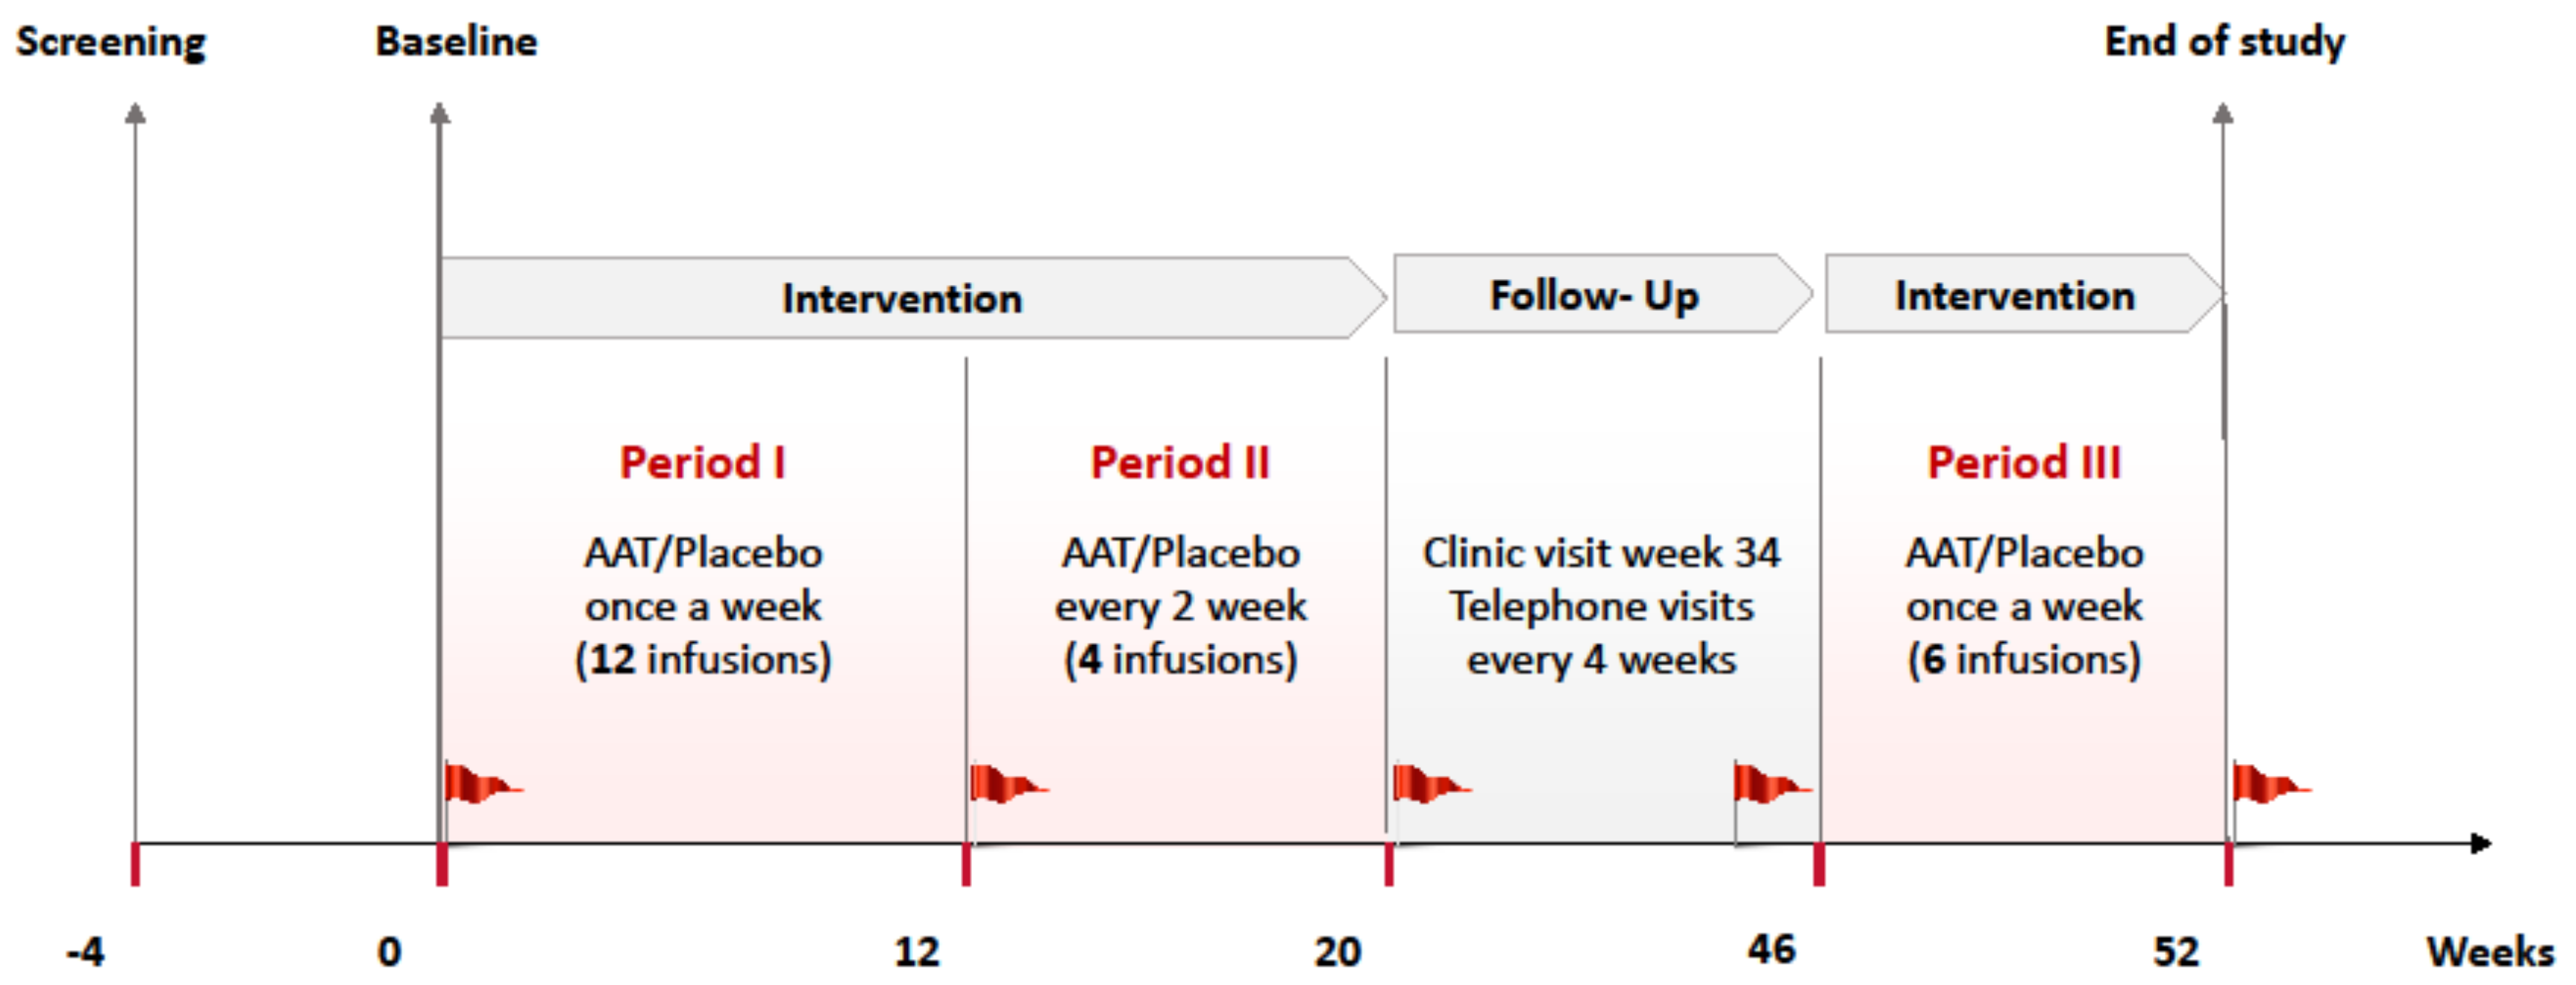
4.2. Randomization and Study Intervention
4.3. Laboratory Measurements
4.4. Outcomes
4.5. Sample Size, Data Management and Statistical Analysis
5. Conclusions
Author Contributions
Funding
Acknowledgments
Conflicts of Interest
Appendix A

| Treatment: | Placebo | AAT-60 mg/kg | AAT-120 mg/kg | |||
|---|---|---|---|---|---|---|
| Population: | ITT | 12–18 years | ITT | 12–18 years | ITT | 12–18 years |
| IL-1 Ra (pg/mL) | ||||||
| Mean (SD) | 35.07 (344.94) | 6.38 (451.79) | −42.11 (218.51) | 7.85 (140.44) | −90.88 (161.02) | −169.29 (178.98) |
| Median (IQR) | −25.00 (205.75) | −69.50 (265.00) | 6.00 (181.5) | 31.00 (208.00) | −87.00 (208.00) | −162.00 (102.50) |
| p-value | 0.47 | 0.99 | 0.22 | 0.34 | ||
| IL-10 (pg/mL) | ||||||
| Mean (SD) | 0.14 (0.57) | 0.20 (0.77) | −0.05 (0.18) | −0.02 (0.15) | 0.03 (0.19) | 0.06 (0.25) |
| Median (IQR) | 0.09 (0.26) | 0.15 (0.57) | −0.01 (0.17) | 0.04 (0.19) | 0.00 (0.22) | −0.06 (0.31) |
| p-value | 0.25 | 0.45 | 0.51 | 0.65 | ||
| IFNγ (pg/mL) | ||||||
| Mean (SD) | 13.50 (27.91) | 16.85 (32.81) | −2.10 (8.98) | −3.09 (10.73) | −1.34 (3.40) | −1.13 (2.18) |
| Median (IQR) | 0.50 (0.57) | 0.50 (18.58) | −0.30 (4.8) | −0.30 (6.00) | −1.20 (4.63) | −1.70 (2.8) |
| p-value | 0.06 | 0.13 | 0.07 | 0.17 | ||
| TNFα (pg/mL) | ||||||
| Mean (SD) | 0.51 (1.26) | 0.69 (1.59) | 1.24 (4.07) | 1.86 (4.79) | 0.14 (0.94) | −0.07 (1.31) |
| Median (IQR) | 0.40 (0.70) | 0.40 (0.83) | 0.40 (0.98) | 0.41 (0.80) | 0.30 (0.66) | 0.10 (0.90) |
| p-value | 0.47 | 0.43 | 0.37 | 0.33 | ||
References
- Diabetes Control and Complications Trial Research Group. Effect of intensive therapy on residual beta-cell function in patients with type 1 diabetes in the diabetes control and complications trial. A randomized, controlled trial. The Diabetes Control and Complications Trial Research Group. Ann. Intern. Med. 1998, 128, 517–523. [Google Scholar] [CrossRef] [PubMed]
- Lehuen, A.; Diana, J.; Zaccone, P.; Cooke, A. Immune cell crosstalk in type 1 diabetes. Nat. Rev. Immunol. 2010, 10, 501–513. [Google Scholar] [CrossRef] [PubMed]
- Creusot, R.J.; Postigo-Fernandez, J.; Teteloshvili, N. Altered Function of Antigen-Presenting Cells in Type 1 Diabetes: A Challenge for Antigen-Specific Immunotherapy? Diabetes 2018, 67, 1481–1494. [Google Scholar] [CrossRef] [PubMed]
- Kalsheker, N.; Morley, S.; Morgan, K. Gene regulation of the serine proteinase inhibitors alpha1-antitrypsin and alpha1-antichymotrypsin. Biochem. Soc. Trans. 2002, 30, 93–98. [Google Scholar] [CrossRef]
- Vergnolle, N. Protease-activated receptors as drug targets in inflammation and pain. Pharmacol. Ther. 2009, 123, 292–309. [Google Scholar] [CrossRef]
- Pott, G.B.; Chan, E.D.; Dinarello, C.A.; Shapiro, L. Alpha-1-antitrypsin is an endogenous inhibitor of proinflammatory cytokine production in whole blood. J. Leukoc. Biol. 2009, 85, 886–895. [Google Scholar] [CrossRef]
- Janciauskiene, S.M.; Nita, I.M.; Stevens, T. Alpha1-antitrypsin, old dog, new tricks. Alpha1-antitrypsin exerts in vitro anti-inflammatory activity in human monocytes by elevating cAMP. J. Biol. Chem. 2007, 282, 8573–8582. [Google Scholar] [CrossRef]
- Abecassis, A.; Schuster, R.; Shahaf, G.; Ozeri, E.; Green, R.; Ochayon, D.E.; Rider, P.; Lewis, E.C. α1-antitrypsin increases interleukin-1 receptor antagonist production during pancreatic islet graft transplantation. Cell. Mol. Immunol. 2014, 11, 377–386. [Google Scholar] [CrossRef]
- Marcondes, A.M.; Hockenbery, D.; Lesnikova, M.; Dinarello, C.A.; Woolfrey, A.; Gernsheimer, T.; Loghman-Adham, M.; Gelmont, D.; Storer, B.; Hansen, J.A.; et al. Response of Steroid-Refractory Acute GVHD to α1-Antitrypsin. Biol. Blood Marrow Transplant. 2016, 22, 1596–1601. [Google Scholar] [CrossRef]
- Tawara, I.; Sun, Y.; Lewis, E.C.; Toubai, T.; Evers, R.; Nieves, E.; Azam, T.; Dinarello, C.A.; Reddy, P. Alpha-1-antitrypsin monotherapy reduces graft-versus-host disease after experimental allogeneic bone marrow transplantation. Proc. Natl. Acad. Sci. USA 2012, 109, 564–569. [Google Scholar] [CrossRef]
- Cabezas-Llobet, N.; Camprubí, S.; García, B.; Alberch, J.; Xifró, X. Human alpha 1-antitrypsin protects neurons and glial cells against oxygen and glucose deprivation through inhibition of interleukins expression. Biochim. Biophys. Acta 2018, 1862, 1852–1861. [Google Scholar] [CrossRef] [PubMed]
- Guttman, O.; Freixo-Lima, G.S.; Kaner, Z.; Lior, Y.; Rider, P.; Lewis, E.C. Context-Specific and Immune Cell-Dependent Antitumor Activities of α1-Antitrypsin. Front. Immunol. 2016, 7, 559. [Google Scholar] [CrossRef] [PubMed]
- Koulmanda, M.; Bhasin, M.; Hoffman, L.; Fan, Z.; Qipo, A.; Shi, H.; Bonner-Weir, S.; Putheti, P.; Degauque, N.; Libermann, T.A.; et al. Curative and beta cell regenerative effects of alpha1-antitrypsin treatment in autoimmune diabetic NOD mice. Proc. Natl. Acad. Sci. USA 2008, 105, 16242–16247. [Google Scholar] [CrossRef] [PubMed]
- Ma, H.; Lu, Y.; Li, H.; Campbell-Thompson, M.; Parker, M.; Wasserfall, C.; Haller, M.; Brantly, M.; Schatz, D.; Atkinson, M.; et al. Intradermal alpha1-antitrypsin therapy avoids fatal anaphylaxis, prevents type 1 diabetes and reverses hyperglycaemia in the NOD mouse model of the disease. Diabetologia 2010, 53, 2198–2204. [Google Scholar] [CrossRef]
- Lewis, E.C.; Shapiro, L.; Bowers, O.J.; Dinarello, C.A. Alpha1-antitrypsin monotherapy prolongs islet allograft survival in mice. Proc. Natl. Acad. Sci. USA 2005, 102, 12153–12158. [Google Scholar] [CrossRef]
- Lewis, E.C.; Mizrahi, M.; Toledano, M.; Defelice, N.; Wright, J.L.; Churg, A.; Shapiro, L.; Dinarello, C.A. α-Antitrypsin monotherapy induces immune tolerance during islet allograft transplantation in mice. Proc. Natl. Acad. Sci. USA 2008, 105, 16236–16241. [Google Scholar] [CrossRef]
- Weir, G.C.; Ehlers, M.R.; Harris, K.M.; Kanaparthi, S.; Long, A.; Phippard, D.; Weiner, L.J.; Jepson, B.; McNamara, J.G.; Koulmanda, M.; et al. Alpha-1 antitrypsin treatment of new-onset type 1 diabetes: An open-label, phase I clinical trial (RETAIN) to assess safety and pharmacokinetics. Pediatr. Diabetes 2018, 19, 945–954. [Google Scholar] [CrossRef]
- Gottlieb, P.A.; Alkanani, A.K.; Michels, A.W.; Lewis, E.C.; Shapiro, L.; Dinarello, C.A.; Zipris, D. α1-Antitrypsin therapy downregulates toll-like receptor-induced IL-1β responses in monocytes and myeloid dendritic cells and may improve islet function in recently diagnosed patients with type 1 diabetes. J. Clin. Endocrinol. Metab. 2014, 99, E1418–E1426. [Google Scholar] [CrossRef]
- Rachmiel, M.; Strauss, P.; Dror, N.; Benzaquen, H.; Horesh, O.; Tov, N.; Weintrob, N.; Landau, Z.; Ben-Ami, M.; Haim, A.; et al. Alpha-1 antitrypsin therapy is safe and well tolerated in children and adolescents with recent onset type 1 diabetes mellitus. Pediatr. Diabetes 2016, 17, 351–359. [Google Scholar] [CrossRef]
- Brener, A.; Lebenthal, Y.; Interator, H.; Horesh, O.; Leshem, A.; Weintrob, N.; Loewenthal, N.; Shalitin, S.; Rachmiel, M. Long-term safety of α-1 antitrypsin therapy in children and adolescents with Type 1 diabetes. Immunotherapy 2018, 10, 1137–1148. [Google Scholar] [CrossRef]
- Greenbaum, C.J.; Beam, C.A.; Boulware, D.; Gitelman, S.E.; Gottlieb, P.A.; Herold, K.C.; Lachin, J.M.; McGee, P.; Palmer, J.P.; Pescovitz, M.D.; et al. Type 1 Diabetes TrialNet Study Group. Fall in C-peptide during first 2 years from diagnosis: Evidence of at least two distinct phases from composite Type 1 Diabetes. TrialNet data. Diabetes 2012, 61, 2066–2073. [Google Scholar] [CrossRef] [PubMed]
- Ludvigsson, J.; Carlsson, A.; Deli, A.; Forsander, G.; Ivarsson, S.A.; Kockum, I.; Lindblad, B.; Marcus, C.; Lernmark, A.; Samuelsson, U. Decline of C-peptide during the first year after diagnosis of Type 1 diabetes in children and adolescents. Diabetes Res. Clin. Pract. 2013, 100, 203–209. [Google Scholar] [CrossRef] [PubMed]
- Baranovski, B.M.; Ozeri, E.; Shahaf, G.; Ochayon, D.E.; Schuster, R.; Bahar, N.; Kalay, N.; Cal, P.; Mizrahi, M.I.; Nisim, O.; et al. Exploration of α1-antitrypsin treatment protocol for islet transplantation: Dosing plan and route of administration. J. Pharmacol. Exp. Ther. 2016, 359, 482–490. [Google Scholar] [CrossRef] [PubMed]
- Mogg, R.; Mehrotra, D.V. Analysis of antiretroviral immunotherapy trials with potentially non-normal and incomplete longitudinal data. Stat. Med. 2007, 26, 484–497. [Google Scholar] [CrossRef] [PubMed]
- Herold, K.C.; Hagopian, W.; Auger, J.A.; Poumian-Ruiz, E.; Taylor, L.; Donaldson, D.; Gitelman, S.E.; Harlan, D.M.; Xu, D.; Zivin, R.A.; et al. Anti-CD3 monoclonal antibody in new-onset type 1 diabetes mellitus. N. Engl. J. Med. 2002, 346, 1692–1698. [Google Scholar] [CrossRef] [PubMed]


| Variable | Placebo (n = 20) | AAT-60 mg/kg (n = 26) | AAT-120 mg/kg (n = 23) |
|---|---|---|---|
| Male sex | 12 (60.0) | 12 (46.1) | 13 (56.5) |
| Age (years) | 14 (4.8) | 12.8 (3.3) | 12.7 (4.3) |
| Children (8–11 years) | 7 (5.0) | 8 (30.8) | 12 (52.2) |
| Adolescents (12–18 years) | 9 (45.0) | 17 (65.4) | 9 (39.1) |
| Young adults (19–25 years) | 4 (20.0) | 1 (3.8) | 2 (8.7) |
| BMI (kg/m2) | 19.5 (3.8) | 19.2 (2.8) | 19.3 (4.0) |
| BMI-SDS (8–19 years) | 0.10 (1.39) | 0.22 (0.91) | 0.22 (1.15) |
| Time since diagnosis (days) | 67.1 (23.7) | 71.7 (26.2) | 75.1 (28.6) |
| Diabetic ketoacidosis at diagnosis | 11 (55.0) | 9 (34.6) | 11 (47.8) |
| HbA1c (%) | 8.5 (1.5) | 8.5 (2.2) | 8.7 (1.8) |
| HbA1c (mmol/mol) | 69 (16) | 69 (23) | 72 (19) |
| C-peptide, fasting (pmol/mL) | 0.24 (0.14) | 0.20 (0.11) | 0.22 (0.13) |
| C-peptide, stimulated (pmol/mL) | 0.68 (0.39) | 0.63 (0.35) | 0.59 (0.34) |
| Glutamic acid decarboxylase autoantibodies | 19 (95) | 24 (92) | 22 (96) |
| Islet-cell autoantibodies | 9 (45) | 15 (58) | 12 (52) |
| Positive for two autoantibodies | 8 (40) | 14 (54) | 11 (48) |
| System Organ Class Preferred Term | Placebo | AAT-60 mg/kg | AAT-120 mg/kg | |||
|---|---|---|---|---|---|---|
| No. Patients | No. Events | No. Patients | No. Events | No. Patients | No. Events | |
| Infections: nasopharyngitis, gastroenteritis, viral infections, upper respiratory tract infections | 17 | 51 | 20 | 57 | 21 | 63 |
| Nervous system: headaches and dizziness | 10 | 78 | 20 | 91 | 18 | 117 |
| Gastrointestinal: abdominal pain, diarrhea, vomiting, dyspepsia | 12 | 56 | 16 | 59 | 14 | 91 |
| General disorders and administration site conditions | 10 | 43 | 16 | 50 | 12 | 43 |
| Respiratory, thoracic, and mediastinal | 7 | 11 | 15 | 18 | 9 | 33 |
| Musculoskeletal and connective tissue | 5 | 7 | 7 | 11 | 6 | 13 |
| Skin and subcutaneous tissue | 3 | 8 | 7 | 7 | 5 | 11 |
| Eye disorders: blurred vision, eye pain, or swelling | 3 | 4 | 2 | 3 | 4 | 4 |
| Injury or poisoning | 5 | 7 | 4 | 6 | 4 | 5 |
| Renal and urinary tract: dysuria, ketonuria, microalbuminuria | 0 | 0 | 0 | 0 | 3 | 3 |
| Reproductive system: dysmenorrhea, menstrual discomfort | 2 | 2 | 2 | 4 | 2 | 31 |
| Metabolism and nutrition | 4 | 5 | 5 | 9 | 2 | 2 |
| Blood and lymphatic system | 2 | 2 | 1 | 1 | 2 | 2 |
| Psychiatric disorders: anxiety | 2 | 3 | 1 | 1 | 2 | 2 |
| Endocrine disorders: thyroiditis, hypothyroidism | 0 | 0 | 0 | 0 | 2 | 2 |
© 2019 by the authors. Licensee MDPI, Basel, Switzerland. This article is an open access article distributed under the terms and conditions of the Creative Commons Attribution (CC BY) license (http://creativecommons.org/licenses/by/4.0/).
Share and Cite
Lebenthal, Y.; Brener, A.; Hershkovitz, E.; Shehadeh, N.; Shalitin, S.; Lewis, E.C.; Elias, D.; Haim, A.; Barash, G.; Loewenthal, N.; et al. A Phase II, Double-Blind, Randomized, Placebo-Controlled, Multicenter Study Evaluating the Efficacy and Safety of Alpha-1 Antitrypsin (AAT) (Glassia®) in the Treatment of Recent-Onset Type 1 Diabetes. Int. J. Mol. Sci. 2019, 20, 6032. https://doi.org/10.3390/ijms20236032
Lebenthal Y, Brener A, Hershkovitz E, Shehadeh N, Shalitin S, Lewis EC, Elias D, Haim A, Barash G, Loewenthal N, et al. A Phase II, Double-Blind, Randomized, Placebo-Controlled, Multicenter Study Evaluating the Efficacy and Safety of Alpha-1 Antitrypsin (AAT) (Glassia®) in the Treatment of Recent-Onset Type 1 Diabetes. International Journal of Molecular Sciences. 2019; 20(23):6032. https://doi.org/10.3390/ijms20236032
Chicago/Turabian StyleLebenthal, Yael, Avivit Brener, Eli Hershkovitz, Naim Shehadeh, Shlomit Shalitin, Eli C. Lewis, Dana Elias, Alon Haim, Galia Barash, Neta Loewenthal, and et al. 2019. "A Phase II, Double-Blind, Randomized, Placebo-Controlled, Multicenter Study Evaluating the Efficacy and Safety of Alpha-1 Antitrypsin (AAT) (Glassia®) in the Treatment of Recent-Onset Type 1 Diabetes" International Journal of Molecular Sciences 20, no. 23: 6032. https://doi.org/10.3390/ijms20236032
APA StyleLebenthal, Y., Brener, A., Hershkovitz, E., Shehadeh, N., Shalitin, S., Lewis, E. C., Elias, D., Haim, A., Barash, G., Loewenthal, N., Zuckerman-Levin, N., Stein, M., Tov, N., & Rachmiel, M. (2019). A Phase II, Double-Blind, Randomized, Placebo-Controlled, Multicenter Study Evaluating the Efficacy and Safety of Alpha-1 Antitrypsin (AAT) (Glassia®) in the Treatment of Recent-Onset Type 1 Diabetes. International Journal of Molecular Sciences, 20(23), 6032. https://doi.org/10.3390/ijms20236032