iTRAQ-Based Proteomic Analysis Reveals Several Strategies to Cope with Drought Stress in Maize Seedlings

Abstract
1. Introduction
2. Results
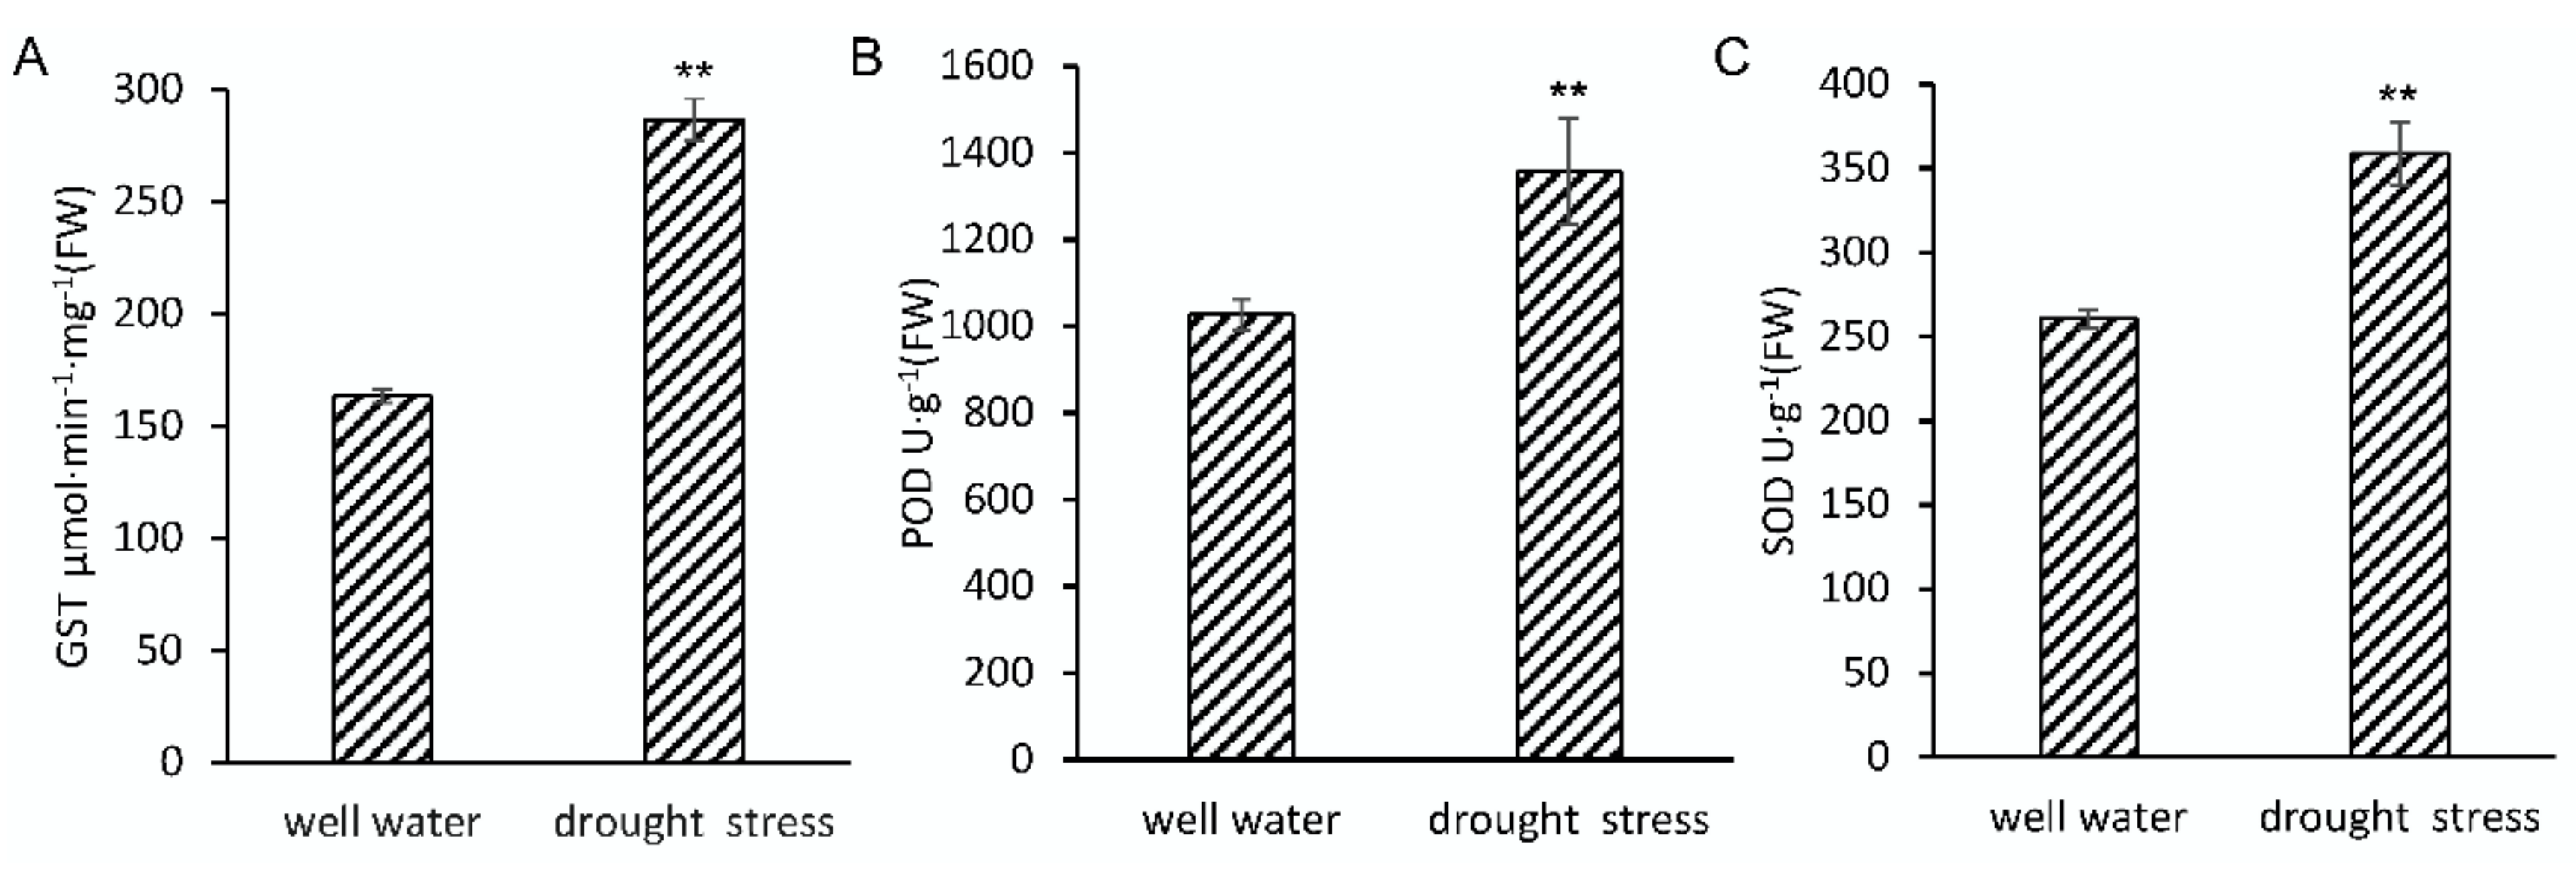
2.1. Phenotypic and Physiological Changes of Maize Seedlings in Response to Drought Stress
2.2. Identification of Differentially Accumulated Protein Species (DAPS) by iTRAQ
2.3. Bioinformatics Analysis of DAPS Identified by iTRAQ
2.4. qRT PCR Verification
3. Discussion
4. Materials and Methods
4.1. Plant Materials and Drought Stress Treatments
4.2. iTRAQ Analysis
4.3. qRT PCR Verification
4.4. Antioxidants Assays
5. Conclusions
Supplementary Materials
Author Contributions
Funding
Conflicts of Interest
References
- Rao, G.J.N.; Reddy, J.N.; Variar, M.; Mahender, A. Molecular Breeding to Improve Plant Resistance to Abiotic Stresses. In Advances in Plant Breeding Strategies: Agronomic, Abiotic and Biotic Stress Traits; Springer: Cincinnati, OH, USA, 2016; pp. 283–326. [Google Scholar]
- Min, H.; Chen, C.; Wei, S.; Shang, X.; Sun, M.; Xia, R.; Liu, X.; Hao, D.; Chen, H.; Xie, Q. Identification of Drought Tolerant Mechanisms in Maize Seedlings Based on Transcriptome Analysis of Recombination Inbred Lines. Front Plant Sci. 2016, 7, 1080. [Google Scholar] [CrossRef]
- Zenda, T.; Liu, S.; Wang, X.; Jin, H.; Liu, G.; Duan, H. Comparative Proteomic and Physiological Analyses of Two Divergent Maize Inbred Lines Provide More Insights into Drought-Stress Tolerance Mechanisms. Int. J. Mol. Sci. 2018, 19, 3225. [Google Scholar] [CrossRef]
- Budak, H.; Hussain, B.; Khan, Z.; Ozturk, N.Z.; Ullah, N. From Genetics to Functional Genomics: Improvement in Drought Signaling and Tolerance in Wheat. Front. Plant Sci. 2015, 6, 1012. [Google Scholar] [CrossRef]
- Wang, X.; Cai, X.; Xu, C.; Wang, Q.; Dai, S. Drought-Responsive Mechanisms in Plant Leaves Revealed by Proteomics. Int. J. Mol. Sci. 2016, 17, 1706. [Google Scholar] [CrossRef]
- Laloum, T.; Martin, G.; Duque, P. Alternative Splicing Control of Abiotic Stress Responses. Trends Plant Sci. 2018, 23, 140–150. [Google Scholar] [CrossRef] [PubMed]
- Liu, D.; Liu, Y.; Rao, J.; Wang, G.; Li, H.; Ge, F.; Chen, C. Overexpression of the glutathione S-transferase gene from Pyrus pyrifolia fruit improves tolerance to abiotic stress in transgenic tobacco plants. Mol. Biol. 2013, 47, 591–601. [Google Scholar] [CrossRef]
- Ji, W.; Zhu, Y.; Li, Y.; Yang, L.; Zhao, X.; Cai, H.; Bai, X. Over-expression of a glutathione S-transferase gene, GsGST, from wild soybean (Glycine soja) enhances drought and salt tolerance in transgenic tobacco. Biotechnol. Lett. 2010, 32, 1173–1179. [Google Scholar] [CrossRef] [PubMed]
- McKersie, B.D.; Bowley, S.R.; Harjanto, E.; Leprince, O. Water-Deficit Tolerance and Field Performance of Transgenic Alfalfa Overexpressing Superoxide Dismutase. Plant Physiol. 1996, 111, 1177–1181. [Google Scholar] [CrossRef] [PubMed]
- Wang, W.B.; Kim, Y.H.; Lee, H.S.; Kim, K.Y.; Deng, X.P.; Kwak, S.S. Analysis of antioxidant enzyme activity during germination of alfalfa under salt and drought stresses. Plant Physiol. Biochem. 2009, 47, 570–577. [Google Scholar] [CrossRef]
- Miller, G.; Suzuki, N.; Ciftci-Yilmaz, S.; Mittler, R. Reactive oxygen species homeostasis and signalling during drought and salinity stresses. Plant Cell Environ. 2010, 33, 453–467. [Google Scholar] [CrossRef]
- Benesova, M.; Hola, D.; Fischer, L.; Jedelsky, P.L.; Hnilicka, F.; Wilhelmova, N.; Rothova, O.; Kocova, M.; Prochazkova, D.; Honnerova, J.; et al. The physiology and proteomics of drought tolerance in maize: Early stomatal closure as a cause of lower tolerance to short-term dehydration? PLoS ONE 2012, 7, e38017. [Google Scholar] [CrossRef] [PubMed]
- Zhou, S.; Li, M.; Guan, Q.; Liu, F.; Zhang, S.; Chen, W.; Yin, L.; Qin, Y.; Ma, F. Physiological and proteome analysis suggest critical roles for the photosynthetic system for high water-use efficiency under drought stress in Malus. Plant Sci. 2015, 236, 44–60. [Google Scholar] [CrossRef] [PubMed]
- Abreu, I.A.; Farinha, A.P.; Negrao, S.; Goncalves, N.; Fonseca, C.; Rodrigues, M.; Batista, R.; Saibo, N.J.; Oliveira, M.M. Coping with abiotic stress: Proteome changes for crop improvement. J. Proteom. 2013, 93, 145–168. [Google Scholar] [CrossRef] [PubMed]
- Komatsu, S.; Hiraga, S.; Yanagawa, Y. Proteomics techniques for the development of flood tolerant crops. J. Proteome Res. 2012, 11, 68–78. [Google Scholar] [CrossRef] [PubMed]
- Wu, S.; Ning, F.; Zhang, Q.; Wu, X.; Wang, W. Enhancing Omics Research of Crop Responses to Drought under Field Conditions. Front Plant Sci. 2017, 8, 174. [Google Scholar] [CrossRef]
- Wu, X.; Wang, W. Increasing Confidence of Proteomics Data Regarding the Identification of Stress-Responsive Proteins in Crop Plants. Front Plant Sci. 2016, 7, 702. [Google Scholar] [CrossRef]
- Wang, X.; Zenda, T.; Liu, S.; Liu, G.; Jin, H.; Dai, L.; Dong, A.; Yang, Y.; Duan, H. Comparative Proteomics and Physiological Analyses Reveal Important Maize Filling-Kernel Drought-Responsive Genes and Metabolic Pathways. Int. J. Mol. Sci. 2019, 20, 3743. [Google Scholar] [CrossRef]
- Zeng, W.; Peng, Y.; Zhao, X.; Wu, B.; Chen, F.; Ren, B.; Zhuang, Z.; Gao, Q.; Ding, Y. Comparative Proteomics Analysis of the Seedling Root Response of Drought-sensitive and Drought-tolerant Maize Varieties to Drought Stress. Int. J. Mol. Sci. 2019, 20, 2793. [Google Scholar] [CrossRef]
- Zhang, Q. Strategies for developing Green Super Rice. Proc. Natl. Acad. Sci. USA 2007, 104, 16402–16409. [Google Scholar] [CrossRef]
- Baerenfaller, K.; Massonnet, C.; Walsh, S.; Baginsky, S.; Buhlmann, P.; Hennig, L.; Hirsch-Hoffmann, M.; Howell, K.A.; Kahlau, S.; Radziejwoski, A.; et al. Systems-based analysis of Arabidopsis leaf growth reveals adaptation to water deficit. Mol. Syst. Biol. 2012, 8, 606. [Google Scholar] [CrossRef]
- Mohammadi, P.P.; Moieni, A.; Hiraga, S.; Komatsu, S. Organ-specific proteomic analysis of drought-stressed soybean seedlings. J. Proteom. 2012, 75, 1906–1923. [Google Scholar] [CrossRef] [PubMed]
- Bonhomme, L.; Valot, B.; Tardieu, F.; Zivy, M. Phosphoproteome dynamics upon changes in plant water status reveal early events associated with rapid growth adjustment in maize leaves. Mol. Cell Proteom. 2012, 11, 957–972. [Google Scholar] [CrossRef] [PubMed]
- Ke, Y.; Han, G.; He, H.; Li, J. Differential regulation of proteins and phosphoproteins in rice under drought stress. Biochem. Biophys. Res. Commun. 2009, 379, 133–138. [Google Scholar] [CrossRef] [PubMed]
- Xin, L.; Zheng, H.; Yang, Z.; Guo, J.; Liu, T.; Sun, L.; Xiao, Y.; Yang, J.; Yang, Q.; Guo, L. Physiological and proteomic analysis of maize seedling response to water deficiency stress. J. Plant Physiol. 2018, 228, 29–38. [Google Scholar] [CrossRef] [PubMed]
- Krannich, C.T.; Maletzki, L.; Kurowsky, C.; Horn, R. Network Candidate Genes in Breeding for Drought Tolerant Crops. Int. J. Mol. Sci. 2015, 16, 16378–16400. [Google Scholar] [CrossRef]
- Cakir, B.; Agasse, A.; Gaillard, C.; Saumonneau, A.; Delrot, S.; Atanassova, R. A grape ASR protein involved in sugar and abscisic acid signaling. Plant Cell 2003, 15, 2165–2180. [Google Scholar] [CrossRef]
- Zhang, F.; Li, L.; Jiao, Z.; Chen, Y.; Liu, H.; Chen, X.; Fu, J.; Wang, G.; Zheng, J. Characterization of the calcineurin B-Like (CBL) gene family in maize and functional analysis of ZmCBL9 under abscisic acid and abiotic stress treatments. Plant Sci. 2016, 253, 118–129. [Google Scholar] [CrossRef]
- Colebrook, E.H.; Thomas, S.G.; Phillips, A.L.; Hedden, P. The role of gibberellin signalling in plant responses to abiotic stress. J. Exp. Biol. 2014, 217, 67–75. [Google Scholar] [CrossRef]
- Hedden, P.; Thomas, S.G. Gibberellin biosynthesis and its regulation. Biochem. J. 2012, 444, 11–25. [Google Scholar] [CrossRef]
- Sun, T.P. Gibberellin-GID1-DELLA: A pivotal regulatory module for plant growth and development. Plant Physiol. 2010, 154, 567–570. [Google Scholar] [CrossRef]
- Van De Velde, K.; Ruelens, P.; Geuten, K.; Rohde, A.; Van Der Straeten, D. Exploiting DELLA Signaling in Cereals. Trends Plant Sci. 2017, 22, 880–893. [Google Scholar] [CrossRef] [PubMed]
- Zadraznik, T.; Hollung, K.; Egge-Jacobsen, W.; Meglic, V.; Sustar-Vozlic, J. Differential proteomic analysis of drought stress response in leaves of common bean (Phaseolus vulgaris L.). J. Proteom. 2013, 78, 254–272. [Google Scholar] [CrossRef] [PubMed]
- Sabehat, A.; Lurie, S.; Weiss, D. Expression of small heat-shock proteins at low temperatures. A possible role in protecting against chilling injuries. Plant Physiol. 1998, 117, 651–658. [Google Scholar] [CrossRef]
- Swindell, W.R.; Huebner, M.; Weber, A.P. Transcriptional profiling of Arabidopsis heat shock proteins and transcription factors reveals extensive overlap between heat and non-heat stress response pathways. BMC Genom. 2007, 8, 125. [Google Scholar] [CrossRef]
- Timperio, A.M.; Egidi, M.G.; Zolla, L. Proteomics applied on plant abiotic stresses: Role of heat shock proteins (HSP). J. Proteom. 2008, 71, 391–411. [Google Scholar] [CrossRef]
- Tardieu, F.; Granier, C.; Muller, B. Water deficit and growth. Co-ordinating processes without an orchestrator? Curr. Opin. Plant Biol. 2011, 14, 283–289. [Google Scholar] [CrossRef]
- Doskocilova, A.; Kohoutova, L.; Volc, J.; Kourova, H.; Benada, O.; Chumova, J.; Plihal, O.; Petrovska, B.; Halada, P.; Bogre, L.; et al. NITRILASE1 regulates the exit from proliferation, genome stability and plant development. New Phytol. 2013, 198, 685–698. [Google Scholar] [CrossRef]
- Ghabooli, M.; Khatabi, B.; Ahmadi, F.S.; Sepehri, M.; Mirzaei, M.; Amirkhani, A.; Jorrin-Novo, J.V.; Salekdeh, G.H. Proteomics study reveals the molecular mechanisms underlying water stress tolerance induced by Piriformospora indica in barley. J. Proteom. 2013, 94, 289–301. [Google Scholar] [CrossRef]
- Koh, J.; Chen, G.; Yoo, M.J.; Zhu, N.; Dufresne, D.; Erickson, J.E.; Shao, H.; Chen, S. Comparative Proteomic Analysis of Brassica napus in Response to Drought Stress. J. Proteome Res. 2015, 14, 3068–3081. [Google Scholar] [CrossRef]
- Trivedi, I.; Rai, K.M.; Singh, S.K.; Kumar, V.; Singh, M.; Ranjan, A.; Lodhi, N.; Sawant, S.V. Analysis of histones and histone variants in plants. Methods Mol. Biol. 2012, 833, 225–236. [Google Scholar]
- Brossa, R.; Pinto-Marijuan, M.; Francisco, R.; Lopez-Carbonell, M.; Chaves, M.M.; Alegre, L. Redox proteomics and physiological responses in Cistus albidus shrubs subjected to long-term summer drought followed by recovery. Planta 2015, 241, 803–822. [Google Scholar] [CrossRef]
- Trivedi, I.; Ranjan, A.; Sharma, Y.K.; Sawant, S. The histone H1 variant accumulates in response to water stress in the drought tolerant genotype of Gossypium herbaceum L. Protein J. 2012, 31, 477–486. [Google Scholar] [CrossRef]
- Wang, W.; Wang, Y.; Du, Y.; Zhao, Z.; Zhu, X.; Jiang, X.; Shu, Z.; Yin, Y.; Li, X. Overexpression of Camellia sinensis H1 histone gene confers abiotic stress tolerance in transgenic tobacco. Plant Cell Rep. 2014, 33, 1829–1841. [Google Scholar] [CrossRef] [PubMed]
- Chen, L.T.; Luo, M.; Wang, Y.Y.; Wu, K. Involvement of Arabidopsis histone deacetylase HDA6 in ABA and salt stress response. J. Exp. Bot. 2010, 61, 3345–3353. [Google Scholar] [CrossRef] [PubMed]
- Chen, L.T.; Wu, K. Role of histone deacetylases HDA6 and HDA19 in ABA and abiotic stress response. Plant Signal Behav. 2010, 5, 1318–1320. [Google Scholar] [CrossRef] [PubMed]
- Rossi, V.; Locatelli, S.; Varotto, S.; Donn, G.; Pirona, R.; Henderson, D.A.; Hartings, H.; Motto, M. Maize histone deacetylase hda101 is involved in plant development, gene transcription, and sequence-specific modulation of histone modification of genes and repeats. Plant Cell 2007, 19, 1145–1162. [Google Scholar] [CrossRef]
- Yang, H.; Liu, X.; Xin, M.; Du, J.; Hu, Z.; Peng, H.; Rossi, V.; Sun, Q.; Ni, Z.; Yao, Y. Genome-Wide Mapping of Targets of Maize Histone Deacetylase HDA101 Reveals Its Function and Regulatory Mechanism during Seed Development. Plant Cell 2016, 28, 629–645. [Google Scholar] [CrossRef]
- Zheng, Y.; Ding, Y.; Sun, X.; Xie, S.; Wang, D.; Liu, X.; Su, L.; Wei, W.; Pan, L.; Zhou, D.X. Histone deacetylase HDA9 negatively regulates salt and drought stress responsiveness in Arabidopsis. J. Exp. Bot. 2016, 67, 1703–1713. [Google Scholar] [CrossRef]
- Allagulova Ch, R.; Gimalov, F.R.; Shakirova, F.M.; Vakhitov, V.A. The plant dehydrins: Structure and putative functions. Biochemistry 2003, 68, 945–951. [Google Scholar]
- Kim, Y.S.; Kim, I.S.; Bae, M.J.; Choe, Y.H.; Kim, Y.H.; Park, H.M.; Kang, H.G.; Yoon, H.S. Homologous expression of cytosolic dehydroascorbate reductase increases grain yield and biomass under paddy field conditions in transgenic rice (Oryza sativa L. japonica). Planta 2013, 237, 1613–1625. [Google Scholar] [CrossRef]
- Xu, J.; Xing, X.J.; Tian, Y.S.; Peng, R.H.; Xue, Y.; Zhao, W.; Yao, Q.H. Transgenic Arabidopsis Plants Expressing Tomato Glutathione S-Transferase Showed Enhanced Resistance to Salt and Drought Stress. PLoS ONE 2015, 10, e0136960. [Google Scholar] [CrossRef] [PubMed]
- Ford, K.L.; Cassin, A.; Bacic, A. Quantitative proteomic analysis of wheat cultivars with differing drought stress tolerance. Front Plant Sci. 2011, 2, 44. [Google Scholar] [CrossRef] [PubMed]
- Fukuda, A.; Tanaka, Y. Effects of ABA, auxin, and gibberellin on the expression of genes for vacuolar H+ -inorganic pyrophosphatase, H+ -ATPase subunit A, and Na+/H+ antiporter in barley. Plant Physiol. Biochem. 2006, 44, 351–358. [Google Scholar] [CrossRef] [PubMed]
- Kabala, K.; Janicka-Russak, M.; Reda, M.; Migocka, M. Transcriptional regulation of the V-ATPase subunit c and V-PPase isoforms in Cucumis sativus under heavy metal stress. Physiol. Plant 2014, 150, 32–45. [Google Scholar] [CrossRef]
- Gigon, A.; Matos, A.R.; Laffray, D.; Zuily-Fodil, Y.; Pham-Thi, A.T. Effect of drought stress on lipid metabolism in the leaves of Arabidopsis thaliana (ecotype Columbia). Ann. Bot. 2004, 94, 345–351. [Google Scholar] [CrossRef]
- Xu, Y.H.; Liu, R.; Yan, L.; Liu, Z.Q.; Jiang, S.C.; Shen, Y.Y.; Wang, X.F.; Zhang, D.P. Light-harvesting chlorophyll a/b-binding proteins are required for stomatal response to abscisic acid in Arabidopsis. J. Exp. Bot. 2012, 63, 1095–1106. [Google Scholar] [CrossRef]
- Gargouri, M.; Bates, P.D.; Park, J.J.; Kirchhoff, H.; Gang, D.R. Functional photosystem I maintains proper energy balance during nitrogen depletion in Chlamydomonas reinhardtii, promoting triacylglycerol accumulation. Biotechnol. Biofuels 2017, 10, 89. [Google Scholar] [CrossRef]
- Gargouri, M.; Park, J.J.; Holguin, F.O.; Kim, M.J.; Wang, H.; Deshpande, R.R.; Shachar-Hill, Y.; Hicks, L.M.; Gang, D.R. Identification of regulatory network hubs that control lipid metabolism in Chlamydomonas reinhardtii. J. Exp. Bot. 2015, 66, 4551–4566. [Google Scholar] [CrossRef]
- Xie, H.; Yang, D.H.; Yao, H.; Bai, G.; Zhang, Y.H.; Xiao, B.G. iTRAQ-based quantitative proteomic analysis reveals proteomic changes in leaves of cultivated tobacco (Nicotiana tabacum) in response to drought stress. Biochem. Biophys. Res. Commun. 2016, 469, 768–775. [Google Scholar] [CrossRef]
- Liu, B.; Shan, X.; Wu, Y.; Su, S.; Li, S.; Liu, H.; Han, J.; Yuan, Y. iTRAQ-Based Quantitative Proteomic Analysis of Embryogenic and Non-embryogenic Calli Derived from a Maize (Zea mays L.) Inbred Line Y423. Int. J. Mol. Sci. 2018, 19, 4004. [Google Scholar] [CrossRef]
- Shilov, I.V.; Seymour, S.L.; Patel, A.A.; Loboda, A.; Tang, W.H.; Keating, S.P.; Hunter, C.L.; Nuwaysir, L.M.; Schaeffer, D.A. The Paragon Algorithm, a next generation search engine that uses sequence temperature values and feature probabilities to identify peptides from tandem mass spectra. Mol. Cell Proteom. 2007, 6, 1638–1655. [Google Scholar] [CrossRef] [PubMed]
- Wang, X.; Shan, X.; Wu, Y.; Su, S.; Li, S.; Liu, H.; Han, J.; Xue, C.; Yuan, Y. iTRAQ-based quantitative proteomic analysis reveals new metabolic pathways responding to chilling stress in maize seedlings. J. Proteom. 2016, 146, 14–24. [Google Scholar] [CrossRef]
- Wang, Z.Q.; Xu, X.Y.; Gong, Q.Q.; Xie, C.; Fan, W.; Yang, J.L.; Lin, Q.S.; Zheng, S.J. Root proteome of rice studied by iTRAQ provides integrated insight into aluminum stress tolerance mechanisms in plants. J. Proteom. 2014, 98, 189–205. [Google Scholar] [CrossRef] [PubMed]
- Ji, W.; Cong, R.; Li, S.; Li, R.; Qin, Z.; Li, Y.; Zhou, X.; Chen, S.; Li, J. Comparative Proteomic Analysis of Soybean Leaves and Roots by iTRAQ Provides Insights into Response Mechanisms to Short-Term Salt Stress. Front Plant Sci. 2016, 7, 573. [Google Scholar] [CrossRef] [PubMed]
- Livak, K.J.; Schmittgen, T.D. Analysis of relative gene expression data using real-time quantitative PCR and the 2(-Delta Delta C(T)) Method. Methods 2001, 25, 402–408. [Google Scholar] [CrossRef]


| GO_Name | GO_ID | p-Value | Count | Differentially Accumulated Protein Species (DAPS) 1 | |
|---|---|---|---|---|---|
| Biological Process | |||||
| 1 | photosynthesis | GO:0015979 | 3.49 × 10⁻⁶ | 9 | B6TH55|1.36818125; P05348|0.71520625; B6STG2|1.30215625; O24574|0.6964125; P04966|0.76561875; B6U534|1.40439375; P24993|1.39320625; B4G1K9|1.3451375; B4FTR7|0.448975 |
| 2 | mitochondrial electron transport | GO:0006122 | 6.51 × 10⁻⁵ | 3 | B6TEX6|1.324725; B6SPA1|1.36054375; Q6R9D5|1.34895 |
| 3 | carbon fixation | GO:0015977 | 6.51 × 10⁻⁵ | 3 | A0A096TUU6|0.55751875; P05348|0.71520625; O24574|0.6964125 |
| 4 | photorespiration | GO:0009853 | 1.86 × 10⁻⁴ | 3 | P05348|0.71520625; O24574|0.6964125; B6TVC7|1.37949375 |
| 5 | ATP synthesis coupled electron transport | GO:0042773 | 6.03 × 10⁻⁴ | 3 | B6TEX6|1.324725; B6SPA1|1.36054375; Q6R9D5|1.34895 |
| 6 | response to water | GO:0009415 | 9.14 × 10⁻⁴ | 3 | C4J477|2.24320625; B4G1H1|2.28670625; A3KLI1|4.3088125 |
| 7 | mitochondrial transmembrane transport | GO:1990542 | 1.12 × 10⁻³ | 2 | B6U5I0|1.344925; B4FET7|0.765575 |
| 8 | respiratory electron transport chain | GO:0022904 | 1.19 × 10⁻³ | 3 | B6TEX6|1.324725; B6SPA1|1.36054375; Q6R9D5|1.34895 |
| 9 | electron transport chain | GO:0022900 | 1.50 × 10⁻³ | 4 | B6TEX6|1.324725; B6SPA1|1.36054375; B4FYW4|1.45836875; Q6R9D5|1.34895 |
| 10 | cellular metabolic compound salvage | GO:0043094 | 3.21 × 10⁻³ | 3 | P05348|0.71520625; O24574|0.6964125; B6TVC7|1.37949375 |
| 11 | response to inorganic substance | GO:0010035 | 3.50 × 10⁻³ | 4 | C4J477|2.24320625; B4G1H1|2.28670625; P23346|1.48615; A3KLI1|4.3088125 |
| 12 | seed maturation | GO:0010431 | 6.23 × 10⁻³ | 2 | B6UH30|1.92453125; C0PGB5|0.717475 |
| 13 | regulation of protein stability | GO:0031647 | 7.15 × 10⁻³ | 1 | P24993|1.39320625 |
| 14 | S-glycoside biosynthetic process | GO:0016144 | 7.79 × 10⁻³ | 2 | B4FTR7|0.448975; B4FJN0|0.654025 |
| 15 | oxidation-reduction process | GO:0055114 | 8.93 × 10⁻³ | 19 | B4FRC8|1.38471875; P05348|0.71520625; B4F8L7|0.6962375; B4FT31|1.31011875; A5H453|1.357525; B6THA1|1.336; O24574|0.6964125; P04966|0.76561875; B6TEX6|1.324725; K7W7R1|1.62785625; B4FN24|1.3030875; K7VH40|1.4048; B6SPA1|1.36054375; P23346|1.48615; B4FI05|1.33465625; C4J6E4|1.34324375; Q41738|0.7225625; B4FYW4|1.45836875; Q6R9D5|1.34895 |
| Molecular Function | |||||
| 1 | ribulose-bisphosphate carboxylase activity | GO:0016984 | 2.43 × 10⁻⁶ | 3 | A0A096TUU6|0.55751875; P05348|0.71520625; O24574|0.6964125 |
| 2 | rRNA binding | GO:0019843 | 8.14 × 10⁻⁵ | 4 | C4JBF5|0.72338125; P08527|0.73171875; P06586|0.7672125; B6SX84|0.759125 |
| 3 | electron carrier activity | GO:0009055 | 2.76 × 10⁻⁴ | 6 | B6THA1|1.336; P04966|0.76561875; B6TVC7|1.37949375; B4FYW4|1.45836875; Q6R9D5|1.34895; K7V5H2|0.76678125 |
| 4 | carboxy-lyase activity | GO:0016831 | 6.22 × 10⁻⁴ | 4 | A0A096TUU6|0.55751875; AY110562|1.3718125; P05348|0.71520625; O24574|0.6964125 |
| 5 | chlorophyll binding | GO:0016168 | 7.99 × 10⁻⁴ | 3 | P04966|0.76561875; B6U534|1.40439375; B4G1K9|1.3451375 |
| 6 | ubiquinol-cytochrome-c reductase activity | GO:0008121 | 1.94 × 10⁻³ | 2 | B6SPA1|1.36054375; Q6R9D5|1.34895 |
| 7 | phosphate ion binding | GO:0042301 | 3.12 × 10⁻³ | 1 | P24993|1.39320625 |
| 8 | structural molecule activity | GO:0005198 | 3.81 × 10⁻³ | 9 | C4JBF5|0.72338125; Q41785|0.6788375; P08527|0.73171875; B6SJ08|0.7401; P06586|0.7672125; B6SJU8|0.7215; B6SX84|0.759125; B6SIT5|0.6876; B6T2K5|0.73715 |
| 9 | oxidoreductase activity | GO:0016491 | 5.19 × 10⁻³ | 17 | B4FRC8|1.38471875; P05348|0.71520625; B4F8L7|0.6962375; B4FT31|1.31011875; A5H453|1.357525; B6THA1|1.336; O24574|0.6964125; P04966|0.76561875; K7W7R1|1.62785625; B4FN24|1.3030875; K7VH40|1.4048; P23346|1.48615; B6SPA1|1.36054375; B4FI05|1.33465625; C4J6E4|1.34324375; Q41738|0.7225625; Q6R9D5|1.34895 |
| 10 | structural constituent of ribosome | GO:0003735 | 5.57 × 10⁻³ | 8 | C4JBF5|0.72338125; P08527|0.73171875; B6SJ08|0.7401; P06586|0.7672125; B6SJU8|0.7215; B6SX84|0.759125; B6SIT5|0.6876; B6T2K5|0.73715 |
| 11 | arginine decarboxylase activity | GO:0008792 | 6.23 × 10⁻³ | 1 | AY110562|1.3718125 |
| 12 | myristoyltransferase activity | GO:0019107 | 6.23 × 10⁻³ | 1 | Q4FZ48|0.70004375 |
| 13 | lyase activity | GO:0016829 | 7.00 × 10⁻³ | 6 | A0A096TUU6|0.55751875; AY110562|1.3718125; A0A096RZN2|0.6292; P05348|0.71520625; O24574|0.6964125; B4FJJ9|0.75581875 |
| 14 | ferredoxin-NADP+ reductase activity | GO:0004324 | 9.34 × 10⁻³ | 1 | B4FI05|1.33465625 |
| 15 | hydrolase activity, acting on ether bonds | GO:0016801 | 9.34 × 10⁻³ | 1 | C0PHR4|0.74545 |
| Cell Component | |||||
| 1 | cytoplasm | GO:0005737 | 1.32 × 10⁻⁹ | 35 | C4J030|0.6855625; Q9ZT00|0.6089125; P05348|0.71520625; C4JBF5|0.72338125; B6SLX1|1.35598125; P23346|1.48615; B6TEX6|1.324725; Q41785|0.6788375; O24574|0.6964125; P04966|0.76561875; J7LC26|0.76554375; Q6R9D5|1.34895; P24993|1.39320625; P08527|0.73171875; B6SJ08|0.7401; P06586|0.7672125; B6SPA1|1.36054375; B6U5I0|1.344925; B6SJU8|0.7215; B6TVC7|1.37949375; B4FET7|0.765575; K7U772|0.73978125; B4FTR7|0.448975; B4FJN0|0.654025; B6SX84|0.759125; B4F8V9|0.74715; Q41738|0.7225625; B6SIT5|0.6876; B6SNM4|1.3185375; K7V2H9|1.3191875; K7W104|1.4398125; B6SLJ2|1.339075; C4JBA7|0.7688625; B6U1I6|1.69764375; B6T2K5|0.73715 |
| 2 | chloroplast | GO:0009507 | 1.49 × 10⁻⁷ | 14 | C4J030|0.6855625; Q9ZT00|0.6089125; P05348|0.71520625; O24574|0.6964125; P04966|0.76561875; B4FTR7|0.448975; P24993|1.39320625; P06586|0.7672125; K7U772|0.73978125; B4FJN0|0.654025; B6SX84|0.759125; Q41738|0.7225625; P08527|0.73171875; B6TVC7|1.37949375 |
| 3 | macromolecular complex | GO:0032991 | 1.10 × 10⁻⁶ | 25 | B6TH55|1.36818125; C4JBF5|0.72338125; B6U471|0.7354625; Q41785|0.6788375; B6SX84|0.759125; Q6R9D5|1.34895; B4FRU4|1.4294875; P04966|0.76561875; B6U534|1.40439375; B6TEX6|1.324725; J7LC26|0.76554375; B6SIT5|0.6876; P24993|1.39320625; P08527|0.73171875; B4G1K9|1.3451375; B6SJ08|0.7401; P06586|0.7672125; B4FD93|1.6656125; B6SJU8|0.7215; B4FET7|0.765575; B6SNM4|1.3185375; K7V2H9|1.3191875; B4FJ31|1.3158875; B6STG2|1.30215625; B6T2K5|0.73715 |
| 4 | membrane protein complex | GO:0098796 | 1.10 × 10⁻⁶ | 11 | B6TH55|1.36818125; P04966|0.76561875; B6TEX6|1.324725; B4FET7|0.765575; Q6R9D5|1.34895; P24993|1.39320625; B4G1K9|1.3451375; B6U534|1.40439375; B6SNM4|1.3185375; K7V2H9|1.3191875; B6STG2|1.30215625 |
| 5 | photosystem I | GO:0009522 | 1.30 × 10⁻⁶ | 5 | B6TH55|1.36818125; B6STG2|1.30215625; P04966|0.76561875; B6U534|1.40439375; B4G1K9|1.3451375 |
| 6 | mitochondrial inner membrane | GO:0005743 | 1.38 × 10⁻⁶ | 6 | B6TEX6|1.324725; B6SPA1|1.36054375; B4FET7|0.765575; K7V2H9|1.3191875; K7W104|1.4398125; Q6R9D5|1.34895 |
| 7 | mitochondrion | GO:0005739 | 9.15 × 10⁻⁶ | 10 | B6TEX6|1.324725; B6SPA1|1.36054375; B6U5I0|1.344925; B6TVC7|1.37949375; B4FET7|0.765575; Q6R9D5|1.34895; K7U772|0.73978125; K7V2H9|1.3191875; K7W104|1.4398125; B6SLJ2|1.339075 |
| 8 | photosystem | GO:0009521 | 9.21 × 10⁻⁶ | 6 | B6TH55|1.36818125; B6STG2|1.30215625; P04966|0.76561875; B6U534|1.40439375; P24993|1.39320625; B4G1K9|1.3451375 |
| 9 | respiratory chain | GO:0070469 | 4.46 × 10⁻⁵ | 4 | B6TEX6|1.324725; B6SPA1|1.36054375; K7V2H9|1.3191875; Q6R9D5|1.34895 |
| 10 | respiratory chain complex | GO:0098803 | 5.15 × 10⁻⁵ | 3 | B6TEX6|1.324725; K7V2H9|1.3191875; Q6R9D5|1.34895 |
| 11 | organelle envelope | GO:0031967 | 1.96 × 10⁻⁴ | 7 | C4J030|0.6855625; B6TEX6|1.324725; B6SPA1|1.36054375; B4FET7|0.765575; K7V2H9|1.3191875; Q6R9D5|1.34895; K7W104|1.4398125 |
| 12 | photosynthetic membrane | GO:0034357 | 2.71 × 10⁻⁴ | 6 | B6TH55|1.36818125; B6STG2|1.30215625; P04966|0.76561875; B6U534|1.40439375; P24993|1.39320625; B4G1K9|1.3451375 |
| 13 | respiratory chain complex III | GO:0045275 | 4.39 × 10⁻⁴ | 2 | B6TEX6|1.324725; Q6R9D5|1.34895 |
| 14 | mitochondrial protein complex | GO:0098798 | 6.73 × 10⁻⁴ | 3 | B6TEX6|1.324725; B4FET7|0.765575; K7V2H9|1.3191875 |
| 15 | ribonucleoprotein complex | GO:0030529 | 7.42 × 10⁻⁴ | 11 | C4JBF5|0.72338125; B6U471|0.7354625; J7LC26|0.76554375; P08527|0.73171875; B6SJ08|0.7401; P06586|0.7672125; B6SJU8|0.7215; B6SX84|0.759125; B6SIT5|0.6876; B4FJ31|1.3158875; B6T2K5|0.73715 |
| 16 | thylakoid | GO:0009579 | 7.84 × 10⁻⁴ | 6 | B6TH55|1.36818125; B6STG2|1.30215625; P04966|0.76561875; B6U534|1.40439375; P24993|1.39320625; B4G1K9|1.3451375 |
| 17 | photosystem I reaction center | GO:0009538 | 8.81 × 10⁻⁴ | 2 | B6TH55|1.36818125; B6STG2|1.30215625 |
| 18 | mitochondrial membrane part | GO:0044455 | 9.16 × 10⁻⁴ | 3 | B6TEX6|1.324725; B4FET7|0.765575; K7V2H9|1.3191875 |
| 19 | protein complex | GO:0043234 | 1.69 × 10⁻³ | 14 | B6TH55|1.36818125; Q41785|0.6788375; P04966|0.76561875; Q6R9D5|1.34895; B4FET7|0.765575; B6TEX6|1.324725; P24993|1.39320625; B4G1K9|1.3451375; B4FD93|1.6656125; B6SNM4|1.3185375; B4FRU4|1.4294875; K7V2H9|1.3191875; B6U534|1.40439375; B6STG2|1.30215625 |
| 20 | chloroplast part | GO:0044434 | 1.96 × 10⁻³ | 6 | C4J030|0.6855625; Q9ZT00|0.6089125; P04966|0.76561875; P24993|1.39320625; K7U772|0.73978125; B4FJN0|0.654025 |
| 21 | oxidoreductase complex | GO:1990204 | 2.26 × 10⁻³ | 3 | B6TEX6|1.324725; K7V2H9|1.3191875; Q6R9D5|1.34895 |
| 22 | ribosome | GO:0005840 | 2.29 × 10⁻³ | 9 | C4JBF5|0.72338125; J7LC26|0.76554375; P08527|0.73171875; B6SJ08|0.7401; P06586|0.7672125; B6SJU8|0.7215; B6SX84|0.759125; B6SIT5|0.6876; B6T2K5|0.73715 |
| 23 | mitochondrial respiratory chain | GO:0005746 | 2.40 × 10⁻³ | 2 | B6TEX6|1.324725; K7V2H9|1.3191875 |
| 24 | chloroplast stroma | GO:0009570 | 2.51 × 10⁻³ | 4 | C4J030|0.6855625; Q9ZT00|0.6089125; K7U772|0.73978125; B4FJN0|0.654025 |
| 25 | organelle membrane | GO:0031090 | 3.43 × 10⁻³ | 7 | B6TEX6|1.324725; B6SPA1|1.36054375; B4FET7|0.765575; B6SNM4|1.3185375; K7V2H9|1.3191875; Q6R9D5|1.34895; K7W104|1.4398125 |
| 26 | viral nucleocapsid | GO:0019013 | 3.56 × 10⁻³ | 2 | B6U471|0.7354625; B4FJ31|1.3158875 |
| 27 | intracellular membrane-bounded organelle | GO:0043231 | 4.14 × 10⁻³ | 26 | C4J030|0.6855625; Q9ZT00|0.6089125; P05348|0.71520625; O24574|0.6964125; P04966|0.76561875; B6TEX6|1.324725; P24993|1.39320625; P06586|0.7672125; B6SPA1|1.36054375; B4FD93|1.6656125; Q6R9D5|1.34895; B6U5I0|1.344925; B6TVC7|1.37949375; B4FET7|0.765575; K7U772|0.73978125; B4FJN0|0.654025; B6SX84|0.759125; Q41738|0.7225625; B6SNM4|1.3185375; K7V2H9|1.3191875; K7W104|1.4398125; B6SLJ2|1.339075; B4FTR7|0.448975; B4FJ31|1.3158875; P08527|0.73171875; B6U1I6|1.69764375 |
| Accession No. | Fold Change 1 | qRT-PCR Primers | Protein Description | ||
|---|---|---|---|---|---|
| UniProt | B73 RefGen_v4 | iTRAQ | qRT-PCR | ||
| B4FKG5 | Zm00001d023529 | 2.02 ± 0.28 | 2.73 ± 0.32 | F: ACCACCTGTTCCACCACAAG R: CTCCTCCTCGATCTTGTGGC | Abscisic acid stress ripening protein 2 |
| K7U051 | Zm00001d050493 | 0.68 ± 0.11 | 0.23 ± 0.11 | F: GACTTCTCCCGCCTCTACCT R: CGGTTGAGGAAGTCGCTGAT | Gibberellin receptor GID1L2 |
| A3KLI1 | Zm00001d037894 | 4.31 ± 0.34 | 7.44 ± 0.49 | F: CGCGTCAAAGCCGTAATGTT R: TGAACAGTACACGGACCCAG | Dehydrin DHN1 |
| B6T2K5 | Zm00001d004052 | 0.74 ± 0.19 | 1.15 ± 0.09 | F: TTCATATCCTCACTCGCCGC R: CGCTTCTTTTCCCTCTCGGT | 60S ribosomal protein L35 |
| C4J410 | Zm00001d012420 | 1.41 ± 0.17 | 1.97 ± 0.08 | F: TCAAGAAGAAGGTGGACGCC R: GTTGCAGATCCCCTCAAGCT | Heat shock protein1 |
| Q9FQA3 | Zm00001d020780 | 1.36 ± 0.23 | 1.74 ± 0.19 | F: CATCGACGAGGTCTGGAAGG R: CCGAACCAGGCCTTCATCAG | Glutathione transferase GST |
| A5H453 | Zm00001d022456 | 1.36 ± 0.10 | 1.67 ± 0.05 | F: GACATGGTCGCTCTCTCAGG R: CGAGGTTCCCCATCTTCACC | Peroxidase 42 |
| P23346 | Zm00001d047479 | 1.49 ± 0.17 | 1.50 ± 0.24 | F: CCAGAAGATGAGAACCGCCA R: GCCCACCCTTTCCAAGATCA | Superoxide dismutase [Cu-Zn] 4AP |
| A0A1D6HZB6 | Zm00001d019627 | 0.52 ± 0.19 | 1.02 ± 0.09 | F: GGCTACTAGTGCACTGGACG R: AAGCAAGTCTCTGTGTCCCG | ABC transporter B family member 28 |
| B8A390 | Zm00001d046591 | 0.68 ± 0.14 | 0.34 ± 0.10 | F: GGTGTGCAGAAGACGGTGTA R: CCTTCCCAATGGCAGCAGTA | Vacuolar-type H+-pyrophosphatase5 |
| K7TI82 | Zm00001d024703 | 1.32 ± 0.58 | 2.47 ± 0.08 | F: ACGGCGACAAGGGTAAGAAG R: TGTCCACGACCTTCTTCACG | C3H transcription factor |
| Q41785 | Zm00001d040508 | 0.68 ± 0.22 | 0.30 ± 0.05 | F: TTGTGATATCCCTCCGCGTG R: CGTCCTCATATTCCGCCTCC | Tubulin beta-8 chain O |
| A0A1D6HJU1 | Zm00001d017989 | 1.32 ± 0.23 | 2.13 ± 0.15 | F: CAGCGTGGTGTCCTACTTCA R: GCTGCTTGAAGTTGATGGGC | GDSL esterase/lipase |
| B4F8L7 | Zm00001d027488 | 0.70 ± 0.06 | 0.18 ± 0.13 | F: AACACCGTGAAGACTGGCAT R: TCGTACACCTTGCACTCGTC | Glyceraldehyde-3-phosphate dehydrogenase |
| C0PGB5 | Zm00001d043986 | 0.72 ± 0.21 | 0.32 ± 0.12 | F: CTCCAACCCGAGCAGAAGTT R: CTTTGAACGAGCGCAACCTC | Pyruvate kinase |
| B6TH55 | Zm00001d005446 | 1.37 ± 0.29 | 1.44 ± 0.14 | F: AGGCGCCAAGGTGAAGATC R: CTCGTCCAAGGCGTAGTTGT | Photosystem I reaction center subunit IV A |
| B4FTR7 | Zm00001d017179 | 0.45 ± 0.24 | 0.85 ± 0.02 | F: ACTGGAGAGGAGGTACGCAT R: CCGTCGGAGTTGAGGTTCTC | Tab2 protein |
| Accession No.1 | Sequence Coverage (%) 2 | Peptides (95%) 3 | Fold Change 4 | Description |
|---|---|---|---|---|
| Signaling | ||||
| A0A1D6EB22 | 61.3 | 39 | 1.76909375 | Abscisic acid stress ripening3 |
| B4FKG5 | 73.9 | 36 | 2.01644375 | Abscisic acid stress ripening protein 2 |
| B6U1I6 | 11.5 | 1 | 1.69764375 | B-cell receptor-associated protein 31-like containing protein |
| B4F9B4 | 5.6 | 1 | 1.452825 | Calcineurin B-like protein |
| K7U3I3 | 11.3 | 2 | 1.3692375 | Ethylene response protein |
| A0A1D6HP31 | 5.3 | 1 | 1.31536875 | F-box protein PP2-B10 |
| K7U051 | 8.6 | 1 | 0.68396875 | Gibberellin receptor GID1L2 |
| Osmotic Regulation | ||||
| B6SIK2 | 24 | 3 | 1.44823125 | Dehydrin 13 |
| B4G1H1 | 36.9 | 9 | 2.28670625 | Dehydrin COR410 |
| A3KLI1 | 45.2 | 18 | 4.3088125 | Dehydrin DHN1 |
| C4J477 | 46.7 | 20 | 2.24320625 | Dehydrin DHN2 |
| B4G019 | 45.3 | 13 | 1.57125625 | Hydroxyproline-rich glycoprotein family protein |
| Protein Synthesis and Turnover | ||||
| B6TDB5 | 22.8 | 2 | 1.3013375 | 17.4 kDa class I heat shock protein 3 |
| B4FRU4 | 28.5 | 8 | 1.4294875 | 26S proteasome non-ATPase regulatory subunit 4-like protein |
| P08527 | 31.1 | 3 | 0.73171875 | 30S ribosomal protein S14, chloroplastic |
| P06586 | 29.5 | 3 | 0.7672125 | 30S ribosomal protein S3, chloroplastic |
| B4FQS5 | 21.2 | 4 | 1.3009375 | 36.4 kDa proline-rich protein |
| B6SIT5 | 62.8 | 7 | 0.6876 | 60S acidic ribosomal protein P2A |
| B6SJ08 | 55.6 | 9 | 0.7401 | 60S ribosomal protein L18 |
| B6T2K5 | 32.5 | 3 | 0.73715 | 60S ribosomal protein L35 |
| C4JBF5 | 77.4 | 14 | 0.72338125 | 60S ribosomal protein L9 |
| B6SLX1 | 70.4 | 10 | 1.35598125 | Chaperonin |
| Q4FZ48 | 39.7 | 2 | 0.70760625 | Cysteine proteinase inhibitor |
| B6TNU0 | 16.8 | 4 | 0.6811 | Eukaryotic translation initiation factor 2 gamma subunit |
| K7VH40 | 41.7 | 7 | 1.4048 | Flavoprotein wrbA |
| K7U772 | 7.7 | 2 | 0.73978125 | Glutamyl-tRNA(Gln) amidotransferase subunit B, chloroplastic/mitochondrial |
| B4FU07 | 14.2 | 1 | 0.76964375 | Glycoprotein membrane GPI-anchored |
| B4FJN0 | 8.3 | 2 | 0.654025 | Phosphoglucan phosphatase DSP4 chloroplastic |
| C4J410 | 59.4 | 59 | 1.4112625 | Heat shock protein1 |
| A0A1D6PTR2 | 33.2 | 10 | 1.58213125 | HSP20-like chaperones superfamily protein |
| B6T903 | 68.1 | 34 | 1.66753125 | Nascent polypeptide-associated complex alpha subunit-like protein |
| A0A1D6L313 | 3.9 | 2 | 1.92525 | Peptidase |
| A0A1D6PP97 | 12.4 | 2 | 0.69133125 | Peptide chain release factor APG3 chloroplastic |
| B6SX84 | 6.6 | 1 | 0.759125 | Plastid-specific ribosomal protein 6 |
| B6U471 | 56.7 | 34 | 0.7354625 | Ribonucleoprotein A |
| B6SJU8 | 19.1 | 2 | 0.7215 | Ribosomal protein L15 |
| J7LC26 | 40.8 | 7 | 0.76554375 | Ribosomal protein S10 |
| A0A096TUU6 | 63.4 | 206 | 0.55751875 | Ribulose bisphosphate carboxylase large chain |
| O24574 | 79.4 | 52 | 0.6964125 | Ribulose bisphosphate carboxylase small chain |
| P05348 | 79.4 | 54 | 0.71520625 | Ribulose bisphosphate carboxylase small chain, chloroplastic |
| Q9ZT00 | 64.4 | 42 | 0.6089125 | Ribulose bisphosphate carboxylase/oxygenase activase, chloroplastic |
| A0A1D6JXL4 | 14.3 | 2 | 0.6313 | Serine/threonine-protein phosphatase |
| B4F8V9 | 44.1 | 15 | 0.74715 | T-complex protein 1 subunit delta |
| Reactive Oxygen Species (ROS) Scavenging Pathways | ||||
| B4FT31 | 82.7 | 14 | 1.31011875 | Dehydro ascorbate reductase |
| B6SMJ6 | 3.3 | 1 | 1.54051875 | Glutathione S-transferase GSTU6 |
| A0A1D6PD99 | 65.8 | 22 | 1.5907375 | Glutathione S-transferase L2 chloroplastic |
| A0A1D6JYM2 | 36.7 | 25 | 1.606675 | Glutathione S-transferase L2 chloroplastic |
| Q9FQA3 | 12.2 | 2 | 1.35623125 | Glutathione transferase GST |
| A0A1D6LSN2 | 51.6 | 9 | 1.58461875 | Glutathione transferase19 |
| A0A1D6L6U6 | 44.2 | 7 | 1.3986625 | Glutathione transferase5 |
| B6THA1 | 66.4 | 8 | 1.336 | Grx_C2.2-glutaredoxin subgroup I |
| C0PBY7 | 45.8 | 13 | 1.448225 | Nucleoside diphosphate kinase |
| C4J6E4 | 52 | 28 | 1.34324375 | Peroxidase |
| A5H453 | 44.2 | 26 | 1.357525 | Peroxidase 42 |
| B4FN24 | 71 | 21 | 1.3030875 | Peroxiredoxin-5 |
| B4FLE3 | 20.5 | 1 | 1.36374375 | Prostaglandin E synthase 3 |
| P23346 | 59.2 | 21 | 1.48615 | Superoxide dismutase [Cu-Zn] 4AP |
| Membrane Trafficking | ||||
| A0A1D6HZB6 | 10.4 | 1 | 0.52055 | ABC transporter B family member 28 (ATP-Binding Cassette) |
| A0A1D6P3C1 | 23.4 | 7 | 1.4758 | Charged multivesicular body protein 4b |
| A0A1D6HQA8 | 12.1 | 1 | 0.62341875 | Chloroplast channel forming outer membrane protein |
| K7V5H2 | 7.1 | 1 | 0.76678125 | Copper ion binding protein |
| B6SQL3 | 83 | 9 | 1.339825 | Copper transport protein CCH |
| B6TJH8 | 12.1 | 2 | 1.3348125 | Mitochondrial glycoprotein |
| B6U5I0 | 47 | 4 | 1.344925 | Mitochondrial import inner membrane translocase subunit Tim10 |
| B6SLJ2 | 32.5 | 1 | 1.339075 | Mitochondrial import inner membrane translocase subunit Tim8 |
| B4FET7 | 11.8 | 2 | 0.765575 | Mitochondrial import inner membrane translocase subunit TIM21 |
| A0A1D6JKW8 | 43.9 | 4 | 1.63820625 | Non-specific lipid-transfer protein |
| B6SGP7 | 67.8 | 98 | 1.4372375 | Non-specific lipid-transfer protein |
| B4FB54 | 74 | 11 | 1.51785 | Non-specific lipid-transfer protein |
| B6UH30 | 42.5 | 8 | 1.92453125 | PEBP (Phosphatidylethanolamine-binding protein) family protein |
| B6SNM4 | 39.3 | 3 | 1.3185375 | Protein transport protein Sec61 beta subunit |
| A0A1D6LHK0 | 38.9 | 5 | 1.3837125 | Protein transport protein Sec61 subunit beta |
| A0A1D6PHG2 | 3.9 | 1 | 0.65433125 | SecY protein transport family protein |
| B4FSU1 | 14.9 | 2 | 0.7646625 | Transmembrane emp24 domain-containing protein 10 |
| B6SUM0 | 16.5 | 1 | 0.51840625 | Vacuolar protein sorting-associated protein 29 |
| B8A390 | 10.5 | 4 | 0.6845 | Vacuolar-type H+-pyrophosphatase5 |
| Transcription Related | ||||
| C0PHR4 | 58.4 | 25 | 0.74545 | Adenosyl homocysteinase |
| A0A1D6HZB8 | 18.3 | 3 | 1.55415 | Alkyl transferase |
| K7TI82 | 2 | 1 | 1.3210625 | C3H transcription factor |
| B6SSH9 | 57.1 | 30 | 1.6191 | Extracellular ribonuclease LE OS=Zea mays PE=2 SV=1 |
| A0A1D6J4Q0 | 30.3 | 6 | 0.5743625 | Flowering-promoting factor 1-like protein |
| A0A1D6NGH2 | 6.1 | 3 | 1.82566875 | GBF-interacting protein |
| B4F939 | 9.6 | 1 | 0.7477625 | Histone deacetylase |
| A0A1D6NW49 | 33.6 | 3 | 1.44954375 | Histone H1 |
| B4FD93 | 33.7 | 5 | 1.6656125 | Histone H1 |
| C0P4Y9 | 25 | 2 | 1.37089375 | HNH endonuclease |
| K7TNM4 | 32.8 | 8 | 1.44975 | Nuclear transport factor 2 (NTF2) family protein with RNA binding (RRM-RBD-RNP motifs) domain |
| A0A1D6E366 | 17.7 | 2 | 1.40421875 | Nucleosome/chromatin assembly factor D |
| A0A1D6HNJ8 | 17.6 | 2 | 0.66309375 | Plastid transcriptionally active 17 |
| K7THT7 | 4.2 | 1 | 0.7220125 | Putative DEAD-box ATP-dependent RNA helicase family protein |
| B4FQT5 | 6.2 | 1 | 1.77780625 | Replication factor C subunit 2 |
| B4FBD6 | 12.2 | 3 | 1.4390625 | Ribonuclease 3 |
| B4FK28 | 15.1 | 3 | 0.7205 | RNA-binding (RRM/RBD/RNP motifs) family protein |
| B4FJ31 | 20.9 | 1 | 1.3158875 | Small nuclear ribonucleoprotein F |
| A0A1D6EC40 | 6.3 | 1 | 0.75345 | Trihelix transcription factor ASR3 |
| Cell Structure and Cell Cycle | ||||
| A0A1D6QU75 | 4.3 | 1 | 1.5890375 | CASP-like protein cysteinyl aspartate specific proteinase Caspase |
| A0A1D6L6F4 | 6.8 | 3 | 0.73449375 | Glucose-6-phosphate isomeras |
| A0A1D6E965 | 68.5 | 80 | 0.71039375 | Glyceraldehyde-3-phosphate dehydrogenase |
| B4FQE2 | 12.5 | 1 | 0.7307125 | Nitrilase 4 isoform 1 |
| B4FV91 | 51.7 | 10 | 1.4576125 | Pathogenesis related protein5 |
| B4FN06 | 46.9 | 5 | 1.40720625 | Programmed cell death protein 5 |
| C0HE67 | 9.3 | 1 | 1.4680625 | Protein WVD2-like 5 |
| C0P5V6 | 19.2 | 5 | 0.7639625 | Transferase |
| Q41785 | 23.6 | 8 | 0.6788375 | Tubulin beta-8 chain O |
| Fatty Acid Metabolism | ||||
| B6TZ91 | 6.5 | 1 | 1.32930625 | Esterase |
| A0A1D6HJU1 | 19.2 | 2 | 1.3182 | GDSL esterase/lipase |
| B4G272 | 25 | 14 | 0.75193125 | Protein fatty acid export 3 chloroplastic |
| Carbohydrate and Energy Metabolism | ||||
| A0A1D6IZQ8 | 76.4 | 10 | 1.34993125 | Acyl-CoA-binding protein1 |
| B4FJJ9 | 7.5 | 1 | 0.75581875 | ATP-dependent (S)-NAD(P)H-hydrate dehydratase |
| B6SWK9 | 7.2 | 2 | 0.66775625 | Auxin-induced beta-glucosidase |
| A0A1D6N5T1 | 10.2 | 3 | 0.76715 | Beta-galactosidase |
| B4FD17 | 32.2 | 13 | 0.67739375 | Dihydrolipoamide acetyltransferase component of pyruvate dehydrogenase complex |
| B6T5U0 | 39.8 | 9 | 1.325275 | F1F0-ATPase inhibitor protein |
| B6TGD4 | 54.2 | 8 | 1.344875 | F1F0-ATPase inhibitor protein |
| B4F8L7 | 54.8 | 33 | 0.6962375 | Glyceraldehyde-3-phosphate dehydrogenase |
| C0P5P9 | 33.3 | 9 | 0.70004375 | Glycylpeptide N-tetradecanoyltransferase |
| A0A1D6N1P8 | 9.3 | 1 | 1.3151375 | Phosphotransferase/hexokinase |
| A0A1D6DVJ7 | 30.4 | 13 | 0.744875 | Plasma membrane ATPase |
| C0PGB5 | 11.1 | 4 | 0.717475 | Pyruvate kinase |
| C0P6F8 | 44.1 | 47 | 0.54820625 | Sucrose synthase |
| A0A1D6K2D8 | 23.3 | 14 | 1.32559375 | Sucrose synthase2 |
| C0PPB8 | 5.8 | 1 | 1.51045 | UDP-glycosyltransferase 76C1 |
| Photosynthesis and Photorespiration | ||||
| K7W104 | 6.6 | 1 | 1.4398125 | 2-methoxy-6-polyprenyl-1,4-benzoquinol methylase, mitochondrial |
| B6T144 | 39.1 | 3 | 1.30539375 | B12D protein |
| Q6R9D5 | 3.4 | 1 | 1.34895 | Cytochrome b |
| B6SPA1 | 49.3 | 3 | 1.36054375 | Cytochrome b-c1 complex subunit 6 |
| B6TEX6 | 69.8 | 11 | 1.324725 | Cytochrome b-c1 complex subunit 7 |
| B6TVC7 | 19.4 | 2 | 1.37949375 | Ferredoxin |
| B4FYW4 | 22.7 | 2 | 1.45836875 | Ferredoxin-3 |
| B4FI05 | 16.8 | 3 | 1.33465625 | Ferredoxin--NADP reductase |
| B4FRC8 | 56.5 | 49 | 1.38471875 | Fruit protein PKIWI502 |
| B4FFU4 | 16.4 | 1 | 1.338575 | NADH dehydrogenase [ubiquinone] 1 beta subcomplex subunit 3-A |
| P04966 | 12.9 | 9 | 0.76561875 | Photosystem I P700 chlorophyll a apoprotein A1 |
| A0A1D6HY75 | 64.7 | 283 | 1.3460125 | Photosystem I reaction center subunit IV A |
| B6TH55 | 62.6 | 277 | 1.36818125 | Photosystem I reaction center subunit IV A |
| B6U534 | 23.9 | 9 | 1.40439375 | Photosystem I reaction center subunit V |
| B4G1K9 | 23.5 | 9 | 1.3451375 | Photosystem I reaction center subunit V |
| B6STG2 | 42.9 | 20 | 1.30215625 | Photosystem I reaction center subunit XI |
| P24993 | 42.5 | 20 | 1.39320625 | Photosystem II reaction center protein H |
| A0A1D6JR11 | 33.9 | 3 | 1.33035 | Protein CutA chloroplastic |
| A0A1D6DT56 | 55 | 16 | 0.769575 | Protochlorophyllide reductase1 |
| B4FTR7 | 10.5 | 2 | 0.448975 | Tab2 protein |
© 2019 by the authors. Licensee MDPI, Basel, Switzerland. This article is an open access article distributed under the terms and conditions of the Creative Commons Attribution (CC BY) license (http://creativecommons.org/licenses/by/4.0/).
Share and Cite
Jiang, Z.; Jin, F.; Shan, X.; Li, Y. iTRAQ-Based Proteomic Analysis Reveals Several Strategies to Cope with Drought Stress in Maize Seedlings. Int. J. Mol. Sci. 2019, 20, 5956. https://doi.org/10.3390/ijms20235956
Jiang Z, Jin F, Shan X, Li Y. iTRAQ-Based Proteomic Analysis Reveals Several Strategies to Cope with Drought Stress in Maize Seedlings. International Journal of Molecular Sciences. 2019; 20(23):5956. https://doi.org/10.3390/ijms20235956
Chicago/Turabian StyleJiang, Zhilei, Fengxue Jin, Xiaohui Shan, and Yidan Li. 2019. "iTRAQ-Based Proteomic Analysis Reveals Several Strategies to Cope with Drought Stress in Maize Seedlings" International Journal of Molecular Sciences 20, no. 23: 5956. https://doi.org/10.3390/ijms20235956
APA StyleJiang, Z., Jin, F., Shan, X., & Li, Y. (2019). iTRAQ-Based Proteomic Analysis Reveals Several Strategies to Cope with Drought Stress in Maize Seedlings. International Journal of Molecular Sciences, 20(23), 5956. https://doi.org/10.3390/ijms20235956