n-Butylamine for Improving the Efficiency of Untargeted Mass Spectrometry Analysis of Plasma Metabolite Composition


Abstract
1. Introduction
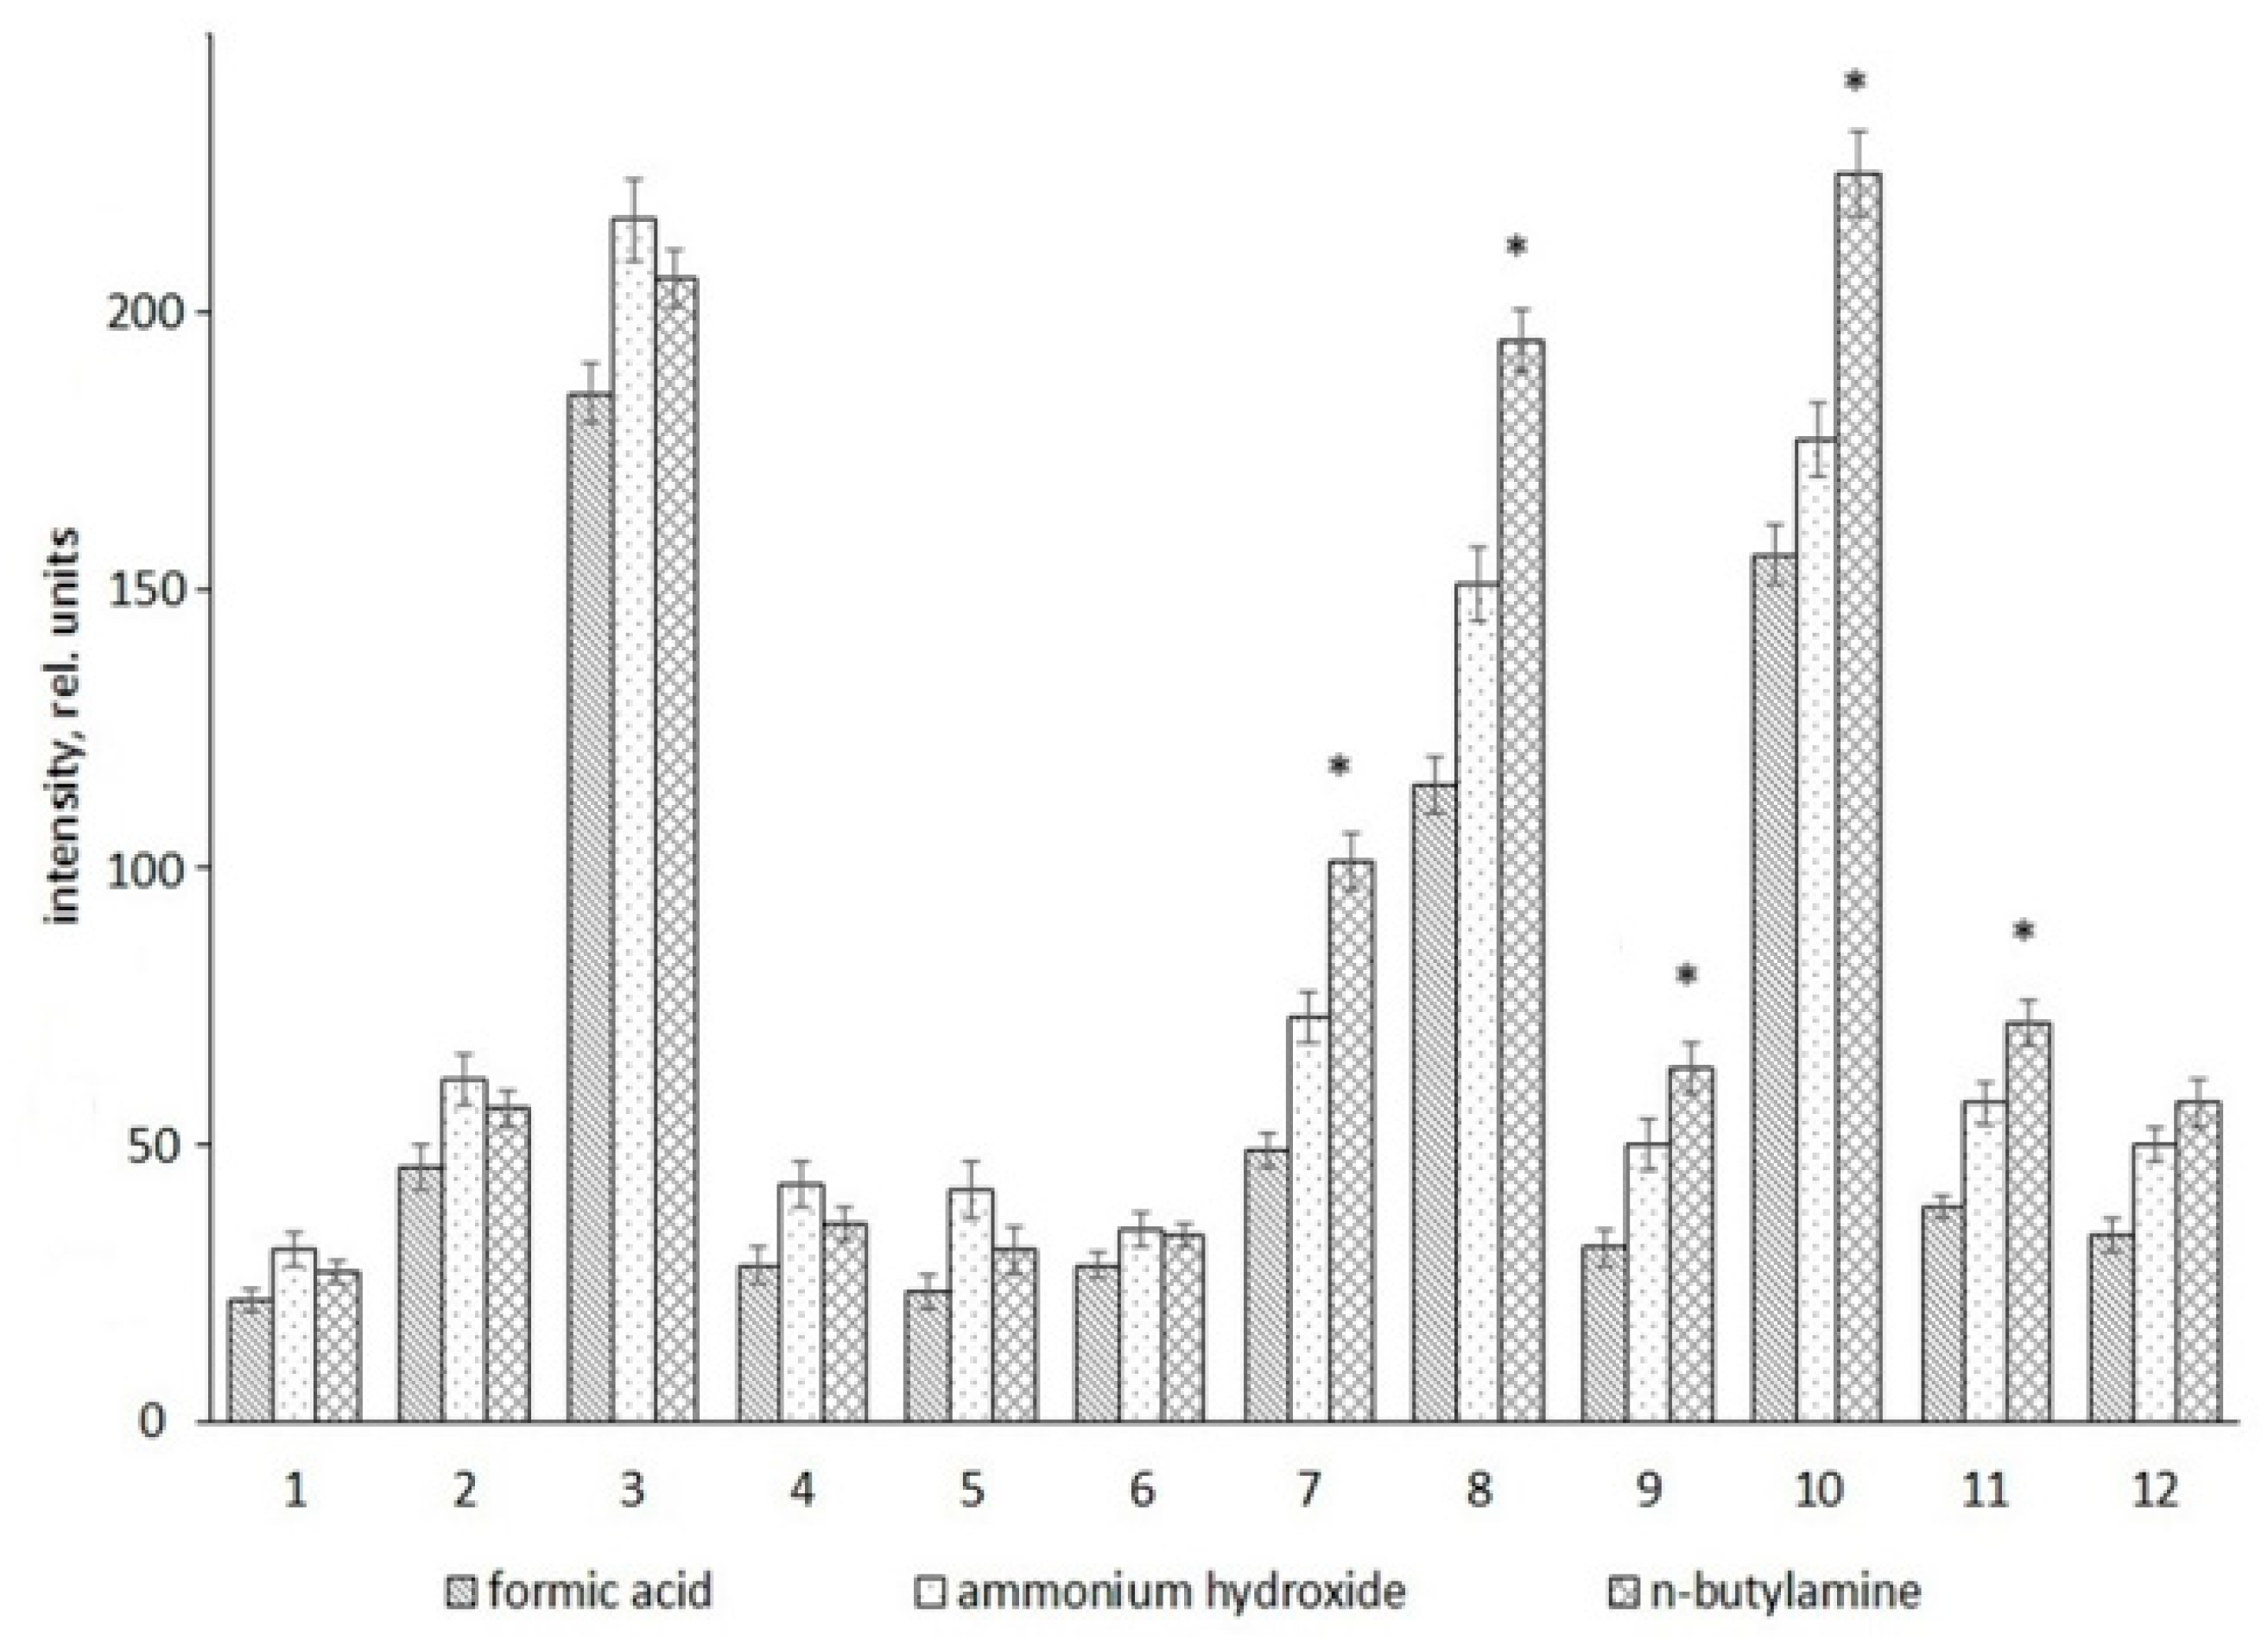
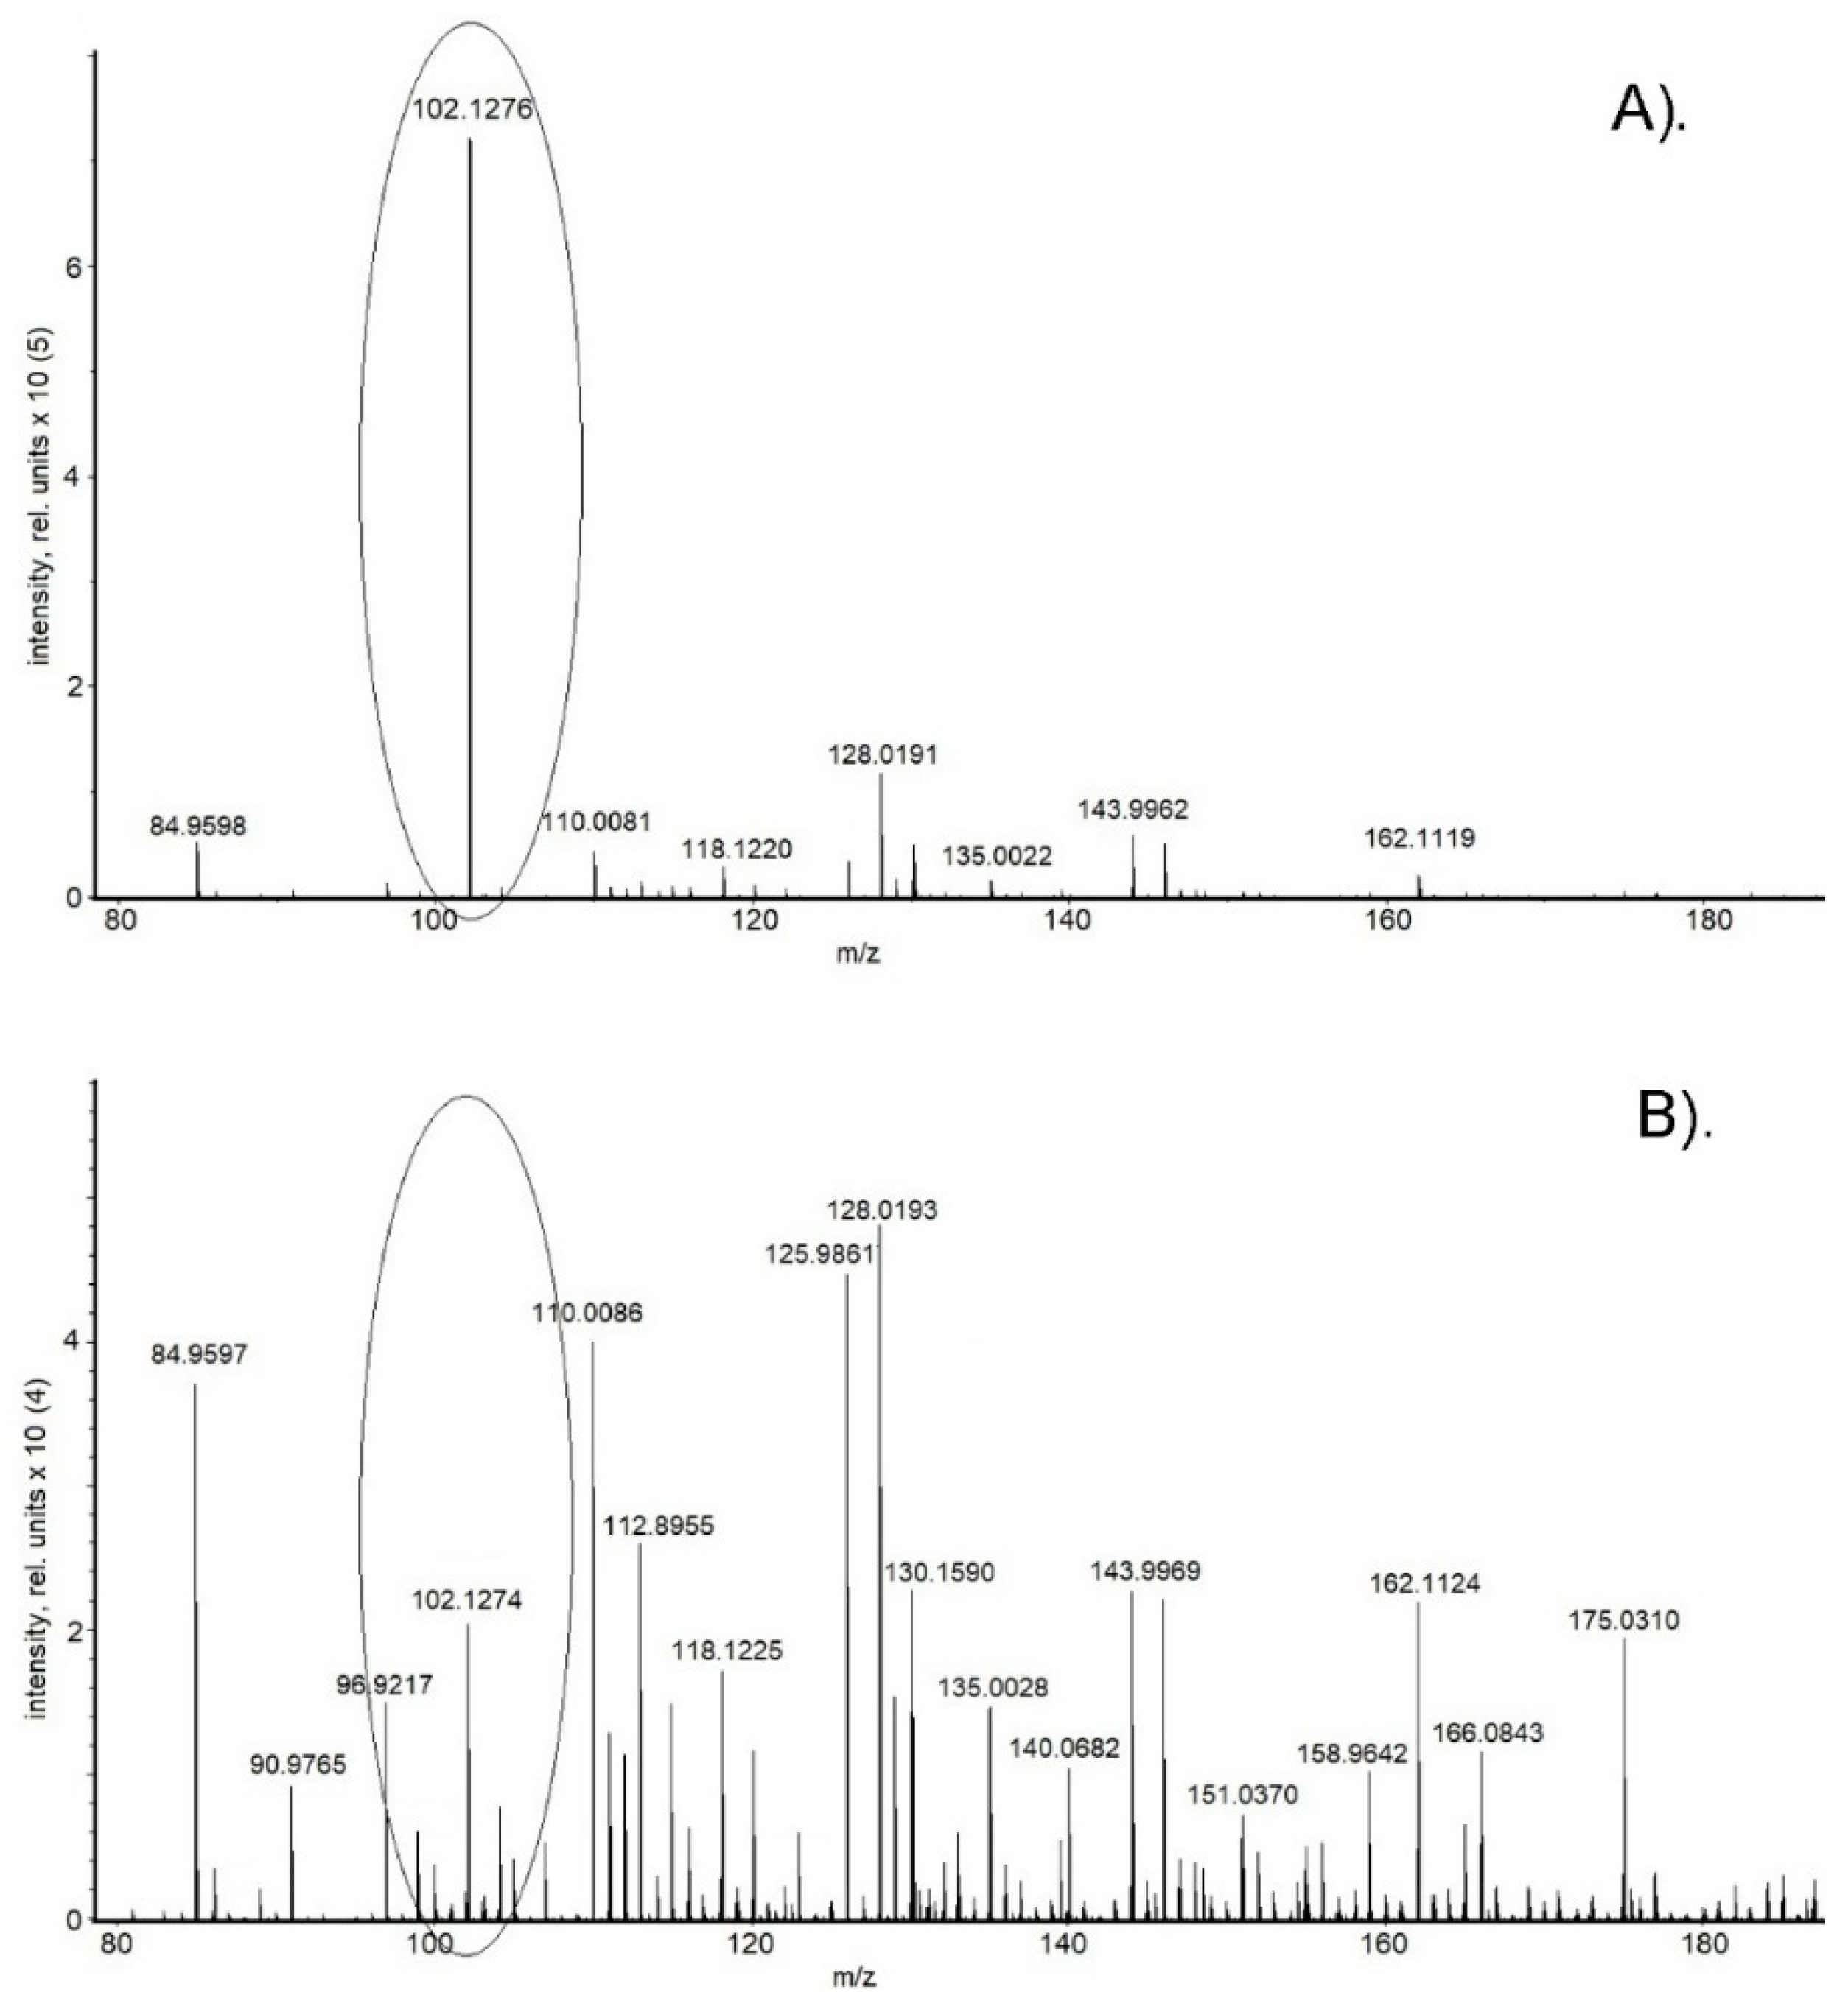
2. Results
3. Discussion
4. Material and Methods
4.1. Blood Plasma Sample Preparation
4.2. Mass Spectrometry Analysis of Blood Plasma Metabolome
4.3. Data Analysis
4.4. Mass Spectra Peak Annotation
Author Contributions
Funding
Acknowledgments
Conflicts of Interest
References
- Balashova, E.; Maslov, D.; Lokhov, P. A metabolomics approach to pharmacotherapy personalization. J. Pers. Med. 2018, 8, 28. [Google Scholar] [CrossRef] [PubMed]
- Kiontke, A.; Oliveira-Birkmeier, A.; Opitz, A.; Birkemeyer, C. Electrospray ionization efficiency is dependent on different molecular descriptors with respect to solvent pH and instrumental configuration. PLoS ONE 2016, 11, e0167502. [Google Scholar] [CrossRef] [PubMed]
- Moriwaki, H. Electrospray ionization mass spectrometric detection of low polar compounds by adding NaAuCl4. J. Mass Spectrom. 2016, 51, 1096–1102. [Google Scholar] [CrossRef] [PubMed]
- Yang, H.; Lau, W.; Lau, B.; Xuan, Y.; Zhou, S.; Zhao, L.; Luo, Z.; Lin, Q.; Ren, N.; Zhao, X.; et al. A mass spectrometric insight into the origins of benign gynecological disorders. Mass Spectrom. Rev. 2017, 36, 450–470. [Google Scholar] [CrossRef] [PubMed]
- Zhang, A.; Liu, Q.; Zhao, H.; Zhou, X.; Sun, H.; Nan, Y.; Zou, S.; Ma, C.; Wang, X. Phenotypic characterization of nanshi oral liquid alters metabolic signatures during disease prevention. Sci. Rep. 2016, 6, 19333. [Google Scholar] [CrossRef] [PubMed]
- Nicholson, J.; Wilson, I. Opinion: Understanding ‘global’ systems biology: Metabonomics and the continuum of metabolism. Nat. Rev. Drug Discov. 2003, 2, 668–676. [Google Scholar] [CrossRef] [PubMed]
- Santa, T.; Al-Dirbashi, O.; Fukushima, T. Derivatization reagents in liquid chromatography/electrospray ionization tandem mass spectrometry for biomedical analysis. Drug Discov. Ther. 2007, 1, 108–118. [Google Scholar]
- Monnin, C.; Ramrup, P.; Daigle-Young, C.; Vuckovic, D. Improving negative liquid chromatography/electrospray ionization mass spectrometry lipidomic analysis of human plasma using acetic acid as a mobile-phase additive. Rapid Commun. Mass Spectrom. 2018, 32, 201–211. [Google Scholar] [CrossRef]
- Yanes, O.; Tautenhahn, R.; Patti, G.; Siuzdak, G. Expanding coverage of the metabolome for global metabolite profiling. Anal. Chem. 2011, 83, 2152–2161. [Google Scholar] [CrossRef]
- Kamel, A.; Brown, P.; Munson, B. Effects of mobile-phase additives, solution pH, ionization constant, and analyte concentration on the sensitivities and electrospray ionization mass spectra of nucleoside antiviral agents. Anal. Chem. 1999, 71, 5481–5492. [Google Scholar] [CrossRef]
- Basiri, B.; van Hattum, H.; van Dongen, W.; Murph, M.; Bartlett, M. The role of fluorinated alcohols as mobile phase modifiers for LC-MS analysis of oligonucleotides. J. Am. Soc. Mass Spectrom. 2017, 28, 190–199. [Google Scholar] [CrossRef] [PubMed]
- Wu, Z.; Gao, W.; Phelps, M.; Wu, D.; Miller, D.; Dalton, J. Favorable effects of weak acids on negative-ion electrospray ionization mass spectrometry. Anal. Chem. 2004, 76, 839–847. [Google Scholar] [CrossRef] [PubMed]
- Ostermann, A.I.; Willenberg, I.; Schebb, N.H. Comparison of sample preparation methods for the quantitative analysis of eicosanoids and other oxylipins in plasma by means of LC-MS/MS. Anal. Bioanal. Chem. 2015, 407, 1403. [Google Scholar] [CrossRef] [PubMed]
- Christinat, N.; Morin-Rivron, D.; Masoodi, M. High-throughput quantitative lipidomics analysis of nonesterified fatty acids in human plasma. J. Proteome Res. 2016, 15, 2228–2235. [Google Scholar] [CrossRef] [PubMed]
- Yang, X.; Qu, Y.; Yuan, Q.; Wan, P.; Du, Z.; Chen, D.; Wong, C. Effect of ammonium on liquid- and gas-phase protonation and deprotonation in electrospray ionization mass spectrometry. Analyst 2013, 138, 659–665. [Google Scholar] [CrossRef] [PubMed]
- Huber, C.; Krajete, A. Analysis of nucleic acids by capillary ion-pair reversed-phase HPLC coupled to negative-ion electrospray ionization mass spectrometry. Anal. Chem. 1999, 71, 3730–3739. [Google Scholar] [CrossRef] [PubMed]
- Tuytten, R.; Lemière, F.; van Dongen, W.; Esmans, E.; Slegers, H. Short capillary ion-pair high-performance liquid chromatography coupled to electrospray (tandem) mass spectrometry for the simultaneous analysis of nucleoside mono-, di- and triphosphates. Rapid Commun. Mass Spectrom. 2002, 16, 1205–1215. [Google Scholar] [CrossRef]
- Kok, M.; de Jong, G.; Somsen, G. Sensitivity enhancement in capillary electrophoresis-mass spectrometry of anionic metabolites using a triethylamine-containing background electrolyte and sheath liquid. Electrophoresis 2011, 32, 3016–3024. [Google Scholar] [CrossRef]
- Wu, J.; Zhang, Y.; Wiegand, R.; Wang, J.; Bepler, G.; Li, J. Quantitative analysis of intracellular nucleoside triphosphates and other polar metabolites using ion pair reversed-phase liquid chromatography coupled with tandem mass spectrometry. J. Chromatogr. B Analyt. Technol. Biomed. Life Sci. 2015, 1006, 167–178. [Google Scholar] [CrossRef]
- Wang, S.; Xing, T.; Liu, A.; He, Z.; Yan, Y.; Daly, T.; Li, N. Simple approach for improved LC−MS analysis of protein biopharmaceuticals via modification of desolvation gas. Anal. Chem. 2019, 91, 3156–3162. [Google Scholar] [CrossRef]
- Taoka, M.; Yamauchi, Y.; Nobe, Y.; Masaki, S.; Nakayama, H.; Ishikawa, H.; Takahashi, N.; Isobe, T. An analytical platform for mass spectrometry-based identification and chemical analysis of RNA in ribonucleoprotein complexes. Nucleic Acids Res. 2009, 37, e140. [Google Scholar] [CrossRef] [PubMed]
- Rütters, H.; Möhring, T.; Rullkötter, J.; Griep-Raming, J.; Metzger, J. The persistent memory effect of triethylamine in the analysis of phospholipids by liquid chromatography/mass spectrometry. Rapid Commun. Mass Spectrom. 2000, 14, 122–123. [Google Scholar] [CrossRef]
- Gulersonmez, M.; Lock, S.; Hankemeier, T.; Ramautar, R. Sheathless capillary electrophoresis-mass spectrometry for anionic metabolic profiling. Electrophoresis 2016, 37, 1007–1014. [Google Scholar] [CrossRef] [PubMed]
- Lin, L.; Yu, Q.; Yan, X.; Hang, W.; Zheng, J.; Xing, J.; Huang, B. Direct infusion mass spectrometry or liquid chromatography mass spectrometry for human metabonomics? A serum metabonomic study of kidney cancer. Analyst 2010, 135, 2970–2978. [Google Scholar] [CrossRef]
- Lokhov, P.; Trifonova, O.; Maslov, D.; Archakov, A. Blood plasma metabolites and the risk of developing lung cancer in Russia. Eur. J. Cancer Prev. 2013, 22, 335–341. [Google Scholar] [CrossRef]
- Versace, F.; Déglon, J.; Mangin, P.; Staub, C. Application of direct-infusion ESI–MS/MS for toxicological screening. Bioanalysis 2014, 6, 2043–2055. [Google Scholar] [CrossRef]
- Musharraf, S.; Siddiqui, A.; Mazhar, S. Direct infusion ESI–MS analysis for metabolite profiling of human plasma using various fractionation techniques. Bioanalysis 2014, 6, 2057–2070. [Google Scholar] [CrossRef]
- Dan, W.A. Biomarker metabolite signatures pave the way for electronic-nose applications in early clinical disease diagnoses. Curr. Metab. 2017, 5, 90–101. [Google Scholar]
- Cala, M.P.; Aldana, J.; Medina, J.; Sánchez, J.; Guio, J.; Wist, J.; Meesters, R. Multiplatform plasma metabolic and lipid fingerprinting of breast cancer: A pilot control-case study in Colombian Hispanic women. PLoS ONE 2018, 13, e0190958. [Google Scholar] [CrossRef]
- Lokhov, P.; Dashtiev, M.; Moshkovskii, S.; Archakov, A. Metabolite profiling of blood plasma of patients with prostate cancer. Metabolomics 2010, 6, 156–163. [Google Scholar] [CrossRef]
- Colizza, K.; Yevdokimov, A.; McLennan, L.; Smith, J.; Oxley, J. Using gas phase reactions of hexamethylene triperoxide diamine (HMTD) to improve detection in mass spectrometry. J. Am. Soc. Mass Spectrom. 2018, 29, 675–684. [Google Scholar] [CrossRef] [PubMed]
- Gowda, G.; Zhang, S.; Gu, H.; Asiago, V.; Shanaiah, N.; Raftery, D. Metabolomics-based methods for early disease diagnostics. Expert Rev. Mol. Diagn. 2008, 8, 617–633. [Google Scholar] [CrossRef] [PubMed]
- Li, S.; Todor, A.; Luo, R. Blood transcriptomics and metabolomics for personalized medicine. Comput. Struct. Biotechnol. J. 2016, 14, 1–7. [Google Scholar] [CrossRef] [PubMed]
- Amaral, J.; Antunes, L.; de Macedo, C.; Mattos, K.; Han, J.; Pan, J.; Sarno, E.; Bozza, P.; Finlay, B.; Pessolani, M. Metabonomics reveals drastic changes in anti-inflammatory/pro-resolving polyunsaturated fatty acids-derived lipid mediators in leprosy disease. PLoS Negl. Trop. Dis. 2013, 7, e2381. [Google Scholar] [CrossRef]
- Lokhov, P.; Trifonova, O.; Maslov, D.; Balashova, E.; Archakov, A.; Shestakova, E.; Shestakova, M.; Dedov, I. Diagnosing impaired glucose tolerance using direct infusion mass spectrometry of blood plasma. PLoS ONE 2014, 9, e105343. [Google Scholar] [CrossRef]
- Wang, Z.; Zhu, C.; Nambi, V.; Morrison, A.; Folsom, A.; Ballantyne, C.; Boerwinkle, E.; Yu, B. Metabolomic Pattern Predicts Incident Coronary Heart Disease. Arterioscler. Thromb. Vasc. Biol. 2019, 39, 1475–1482. [Google Scholar] [CrossRef]
- Fiehn, O.; Kim, J. Metabolomics insights into pathophysiological mechanisms of interstitial cystitis. Int. Neurourol. J. 2014, 18, 106–114. [Google Scholar] [CrossRef]
- Feng, S.; Du, Y.-Q.; Zhang, L.; Zhang, L.; Feng, R.-R.; Liu, S.-Y. Analysis of serum metabolic profile by ultra-performance liquid chromatography-mass spectrometry for biomarkers discovery. Chin. Med. J. (Engl.) 2015, 128, 159–168. [Google Scholar] [CrossRef]
- Mook-Kanamori, D.; El-Din Selim, M.; Takiddin, A.; Al-Mahmoud, K.; Kader, S.; McKeon, C.; Suhre, K. 1,5-anhydroglucitol in saliva is a noninvasive marker of short-term glycemic control. J. Clin. Endocrinol. Metab. 2014, 99, E479–E483. [Google Scholar] [CrossRef]
- Wu, Z.; Kruger, M.; Cooper, G.; Poppitt, S.; Fraser, K. Tissue-specific sample dilution: An important parameter to optimise prior to untargeted LC-MS metabolomics. Metabolites 2019, 9, 124. [Google Scholar] [CrossRef]
- Thiele, I.; Swainston, N.; Fleming, R.; Hoppe, A.; Mo, M.; Rolfsson, O.; Dunn, W.; Mendes, P.; Palsson, B. A community-driven global reconstruction of human metabolism. Nat. Biotechnol. 2013, 31, 419–425. [Google Scholar] [CrossRef]
- Holcapek, M.; Volná, K.; Jandera, P.; Kolárová, L.; Lemr, K.; Exner, M.; Církva, A. Effects of ion-pairing reagents on the electrospray signal suppression of sulphonated dyes and intermediates. J. Mass Spectrom. 2004, 39, 43–50. [Google Scholar] [CrossRef]
- Shah, P.; Sharma, P.; Shah, J.; Sanyal, M.; Shrivastav, P. Simultaneous analysis of losartan, its active metabolite, and hydrochlorothiazide in human plasma by a UPLC-MS/MS method. Turkish J. Chem. 2015, 39, 714–733. [Google Scholar] [CrossRef]
- Sumner, L.; Amberg, A.; Barrett, D.; Beale, M.; Beger, R.; Daykin, C.; Fan, T.; Fiehn, O.; Goodacre, R.; Griffin, J.; et al. Proposed minimum reporting standards for chemical analysis Chemical Analysis Working Group (CAWG) Metabolomics Standards Initiative (MSI). Metabolomics 2007, 3, 211–221. [Google Scholar] [CrossRef]


| No. | Metabolites | HMDB ID | m/z Value | Elemental Composition | |
|---|---|---|---|---|---|
| Measured (m/z) | Calculated (Da) | ||||
| 1 | succinic acid | HMDB0000254 | 117.0195 | 117.0182 | C4H6O4 |
| 2 | malic acid | HMDB0000744 | 133.0157 | 133.0131 | C4H6O5 |
| 3 | palmitic acid | HMDB0000220 | 255.2405 | 255.2318 | C16H32O2 |
| 4 | α-linolenic acid | HMDB0001388 | 277.2201 | 277.2162 | C18H30O2 |
| 5 | arachidonic acid | HMDB0001043 | 303.2324 | 303.2318 | C20H32O2 |
| 6 | docosahexaenoic acid | HMDB0002183 | 327.2323 | 327.2318 | C22H32O2 |
| 7 | PG * | n/a | 735.5201 | 735.5170 | C39H77O10P |
| 8 | PG/PA * | n/a | 747.5201 | 747.5170 | C40H77O10P |
| 9 | PS * | n/a | 808.5143 | 808.5123 | C44H76NO10P |
| 10 | PS * | n/a | 830.5935 | 830.5905 | C45H86NO10P |
| 11 | n/a | n/a | 936.5211 | n/a | n/a |
| 12 | n/a | n/a | 938.5012 | n/a | n/a |
© 2019 by the authors. Licensee MDPI, Basel, Switzerland. This article is an open access article distributed under the terms and conditions of the Creative Commons Attribution (CC BY) license (http://creativecommons.org/licenses/by/4.0/).
Share and Cite
Maslov, D.L.; Trifonova, O.P.; Balashova, E.E.; Lokhov, P.G. n-Butylamine for Improving the Efficiency of Untargeted Mass Spectrometry Analysis of Plasma Metabolite Composition. Int. J. Mol. Sci. 2019, 20, 5957. https://doi.org/10.3390/ijms20235957
Maslov DL, Trifonova OP, Balashova EE, Lokhov PG. n-Butylamine for Improving the Efficiency of Untargeted Mass Spectrometry Analysis of Plasma Metabolite Composition. International Journal of Molecular Sciences. 2019; 20(23):5957. https://doi.org/10.3390/ijms20235957
Chicago/Turabian StyleMaslov, Dmitry L., Oxana P. Trifonova, Elena E. Balashova, and Petr G. Lokhov. 2019. "n-Butylamine for Improving the Efficiency of Untargeted Mass Spectrometry Analysis of Plasma Metabolite Composition" International Journal of Molecular Sciences 20, no. 23: 5957. https://doi.org/10.3390/ijms20235957
APA StyleMaslov, D. L., Trifonova, O. P., Balashova, E. E., & Lokhov, P. G. (2019). n-Butylamine for Improving the Efficiency of Untargeted Mass Spectrometry Analysis of Plasma Metabolite Composition. International Journal of Molecular Sciences, 20(23), 5957. https://doi.org/10.3390/ijms20235957