Biodistribution of Mesenchymal Stem Cell-Derived Extracellular Vesicles in a Radiation Injury Bone Marrow Murine Model

 , and
, and 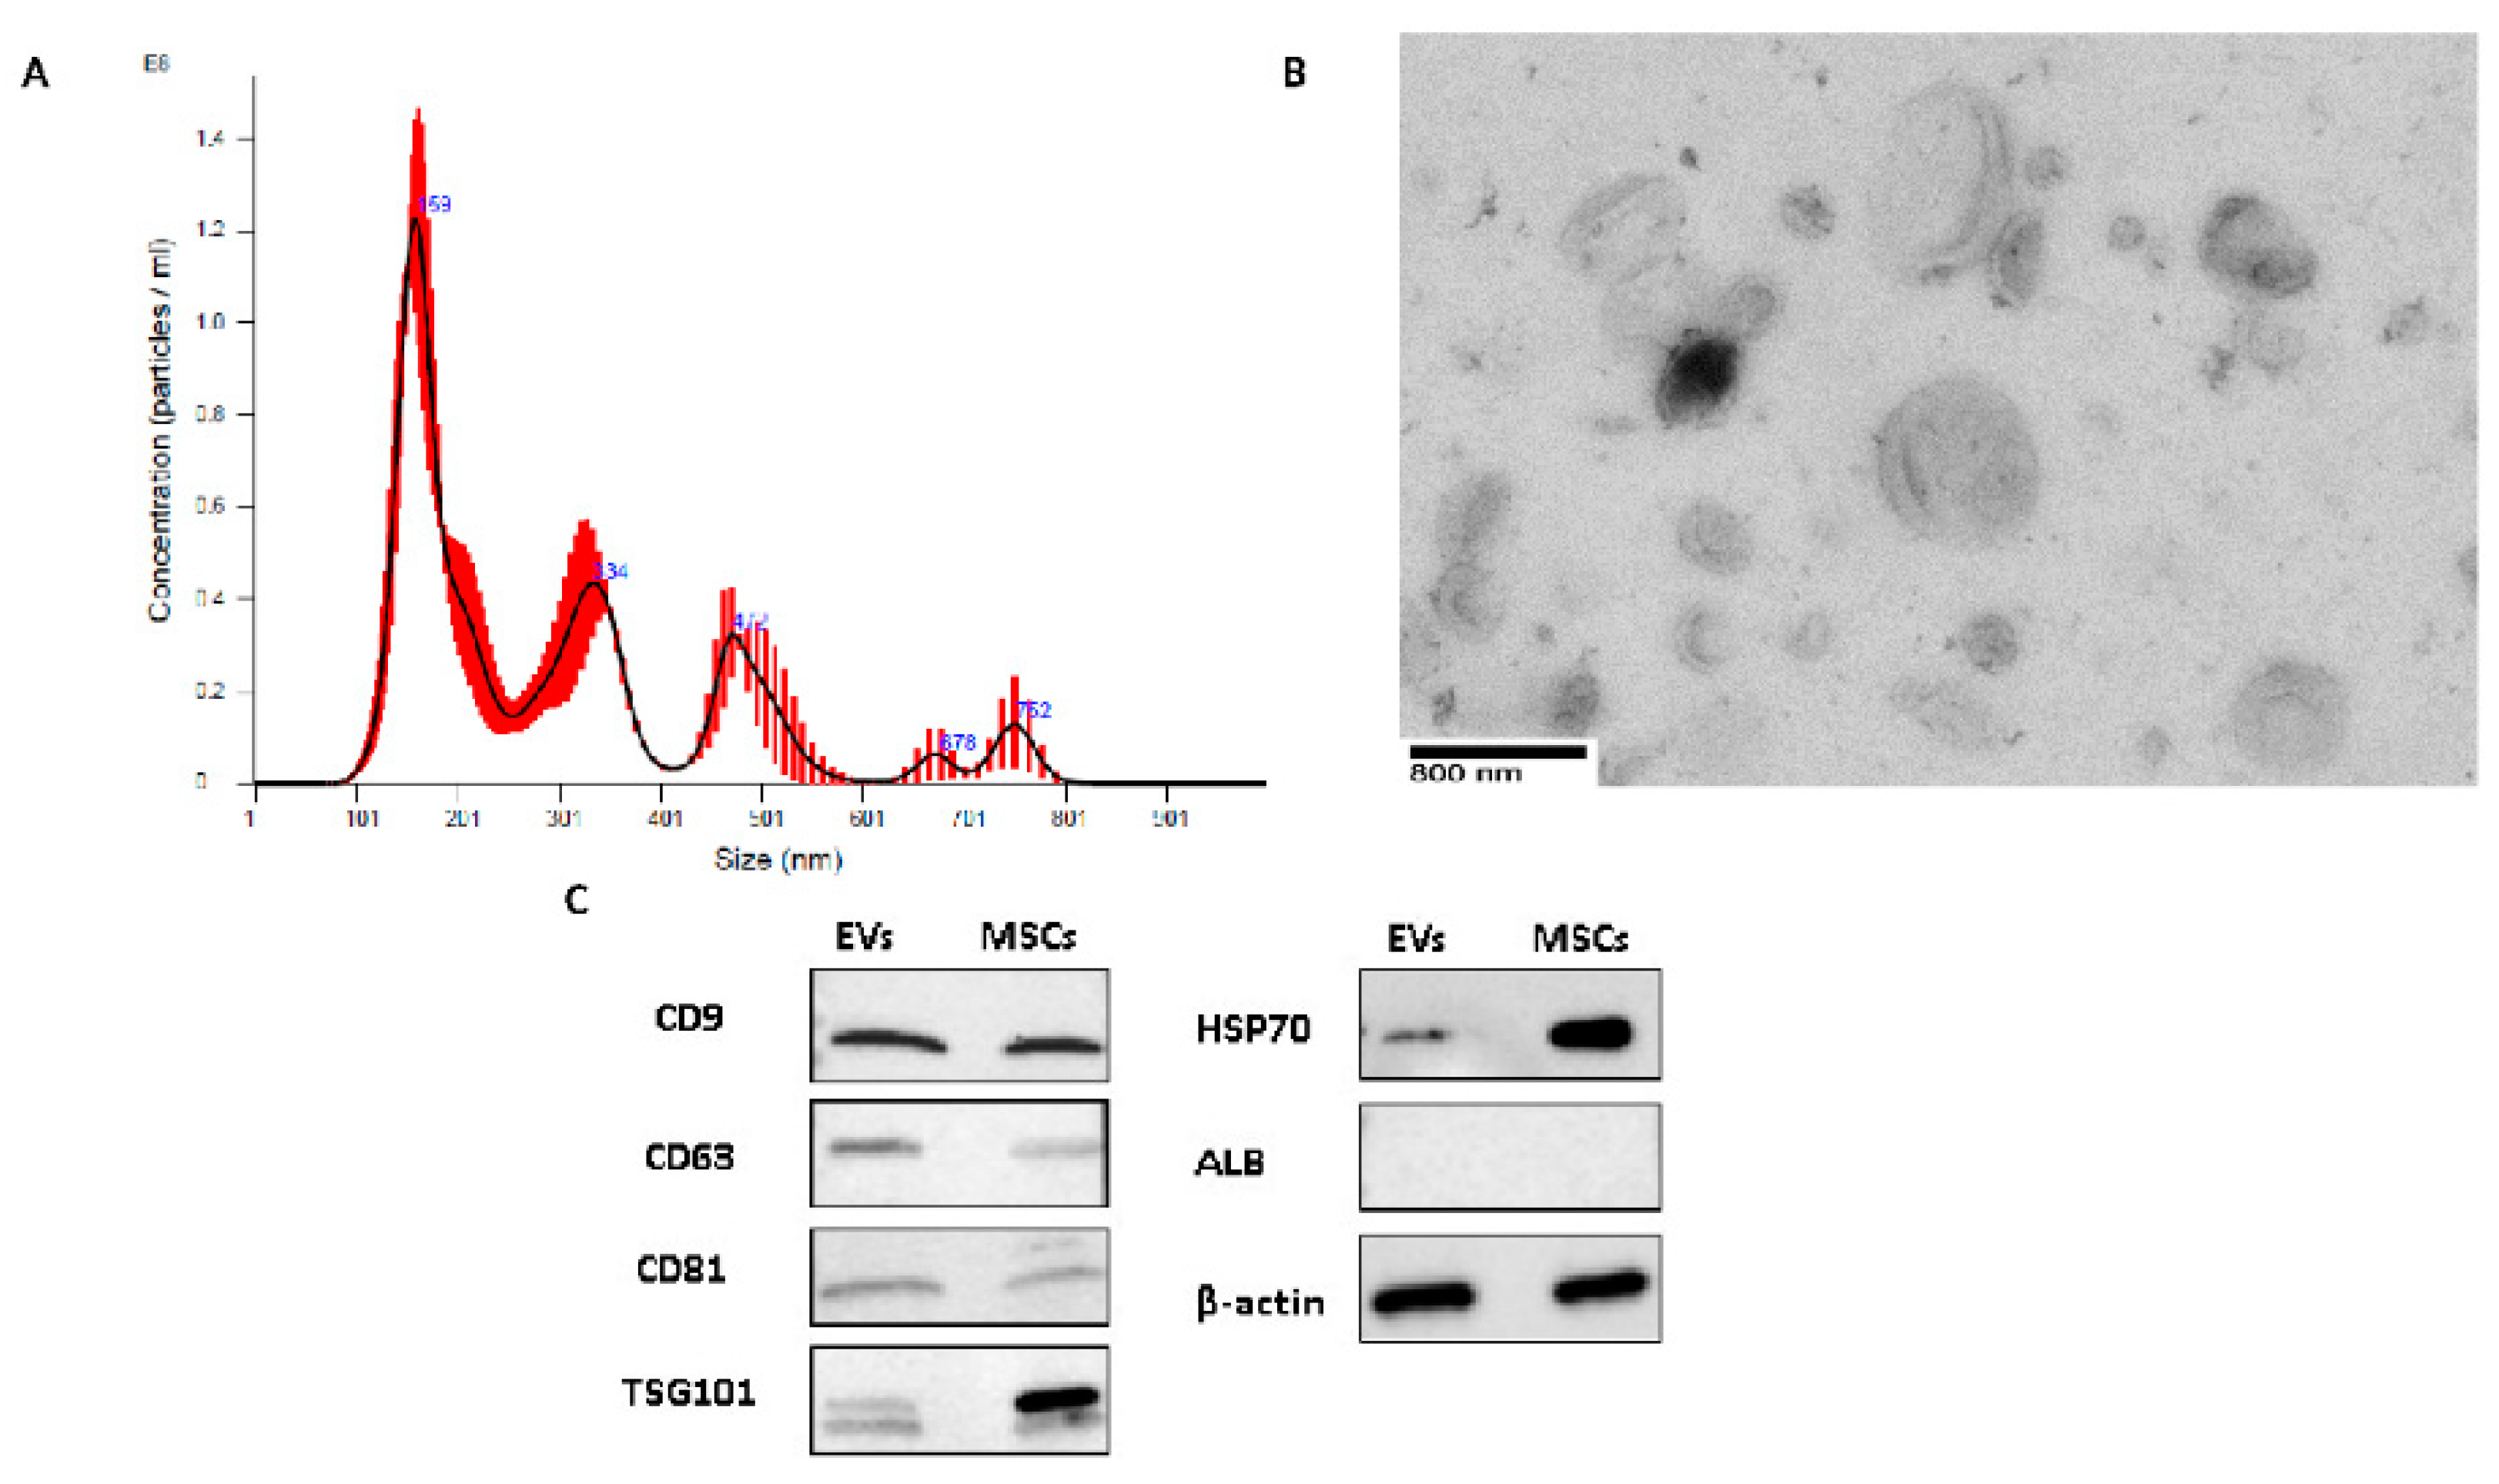
Abstract
1. Introduction
2. Results
2.1. EV Characterization
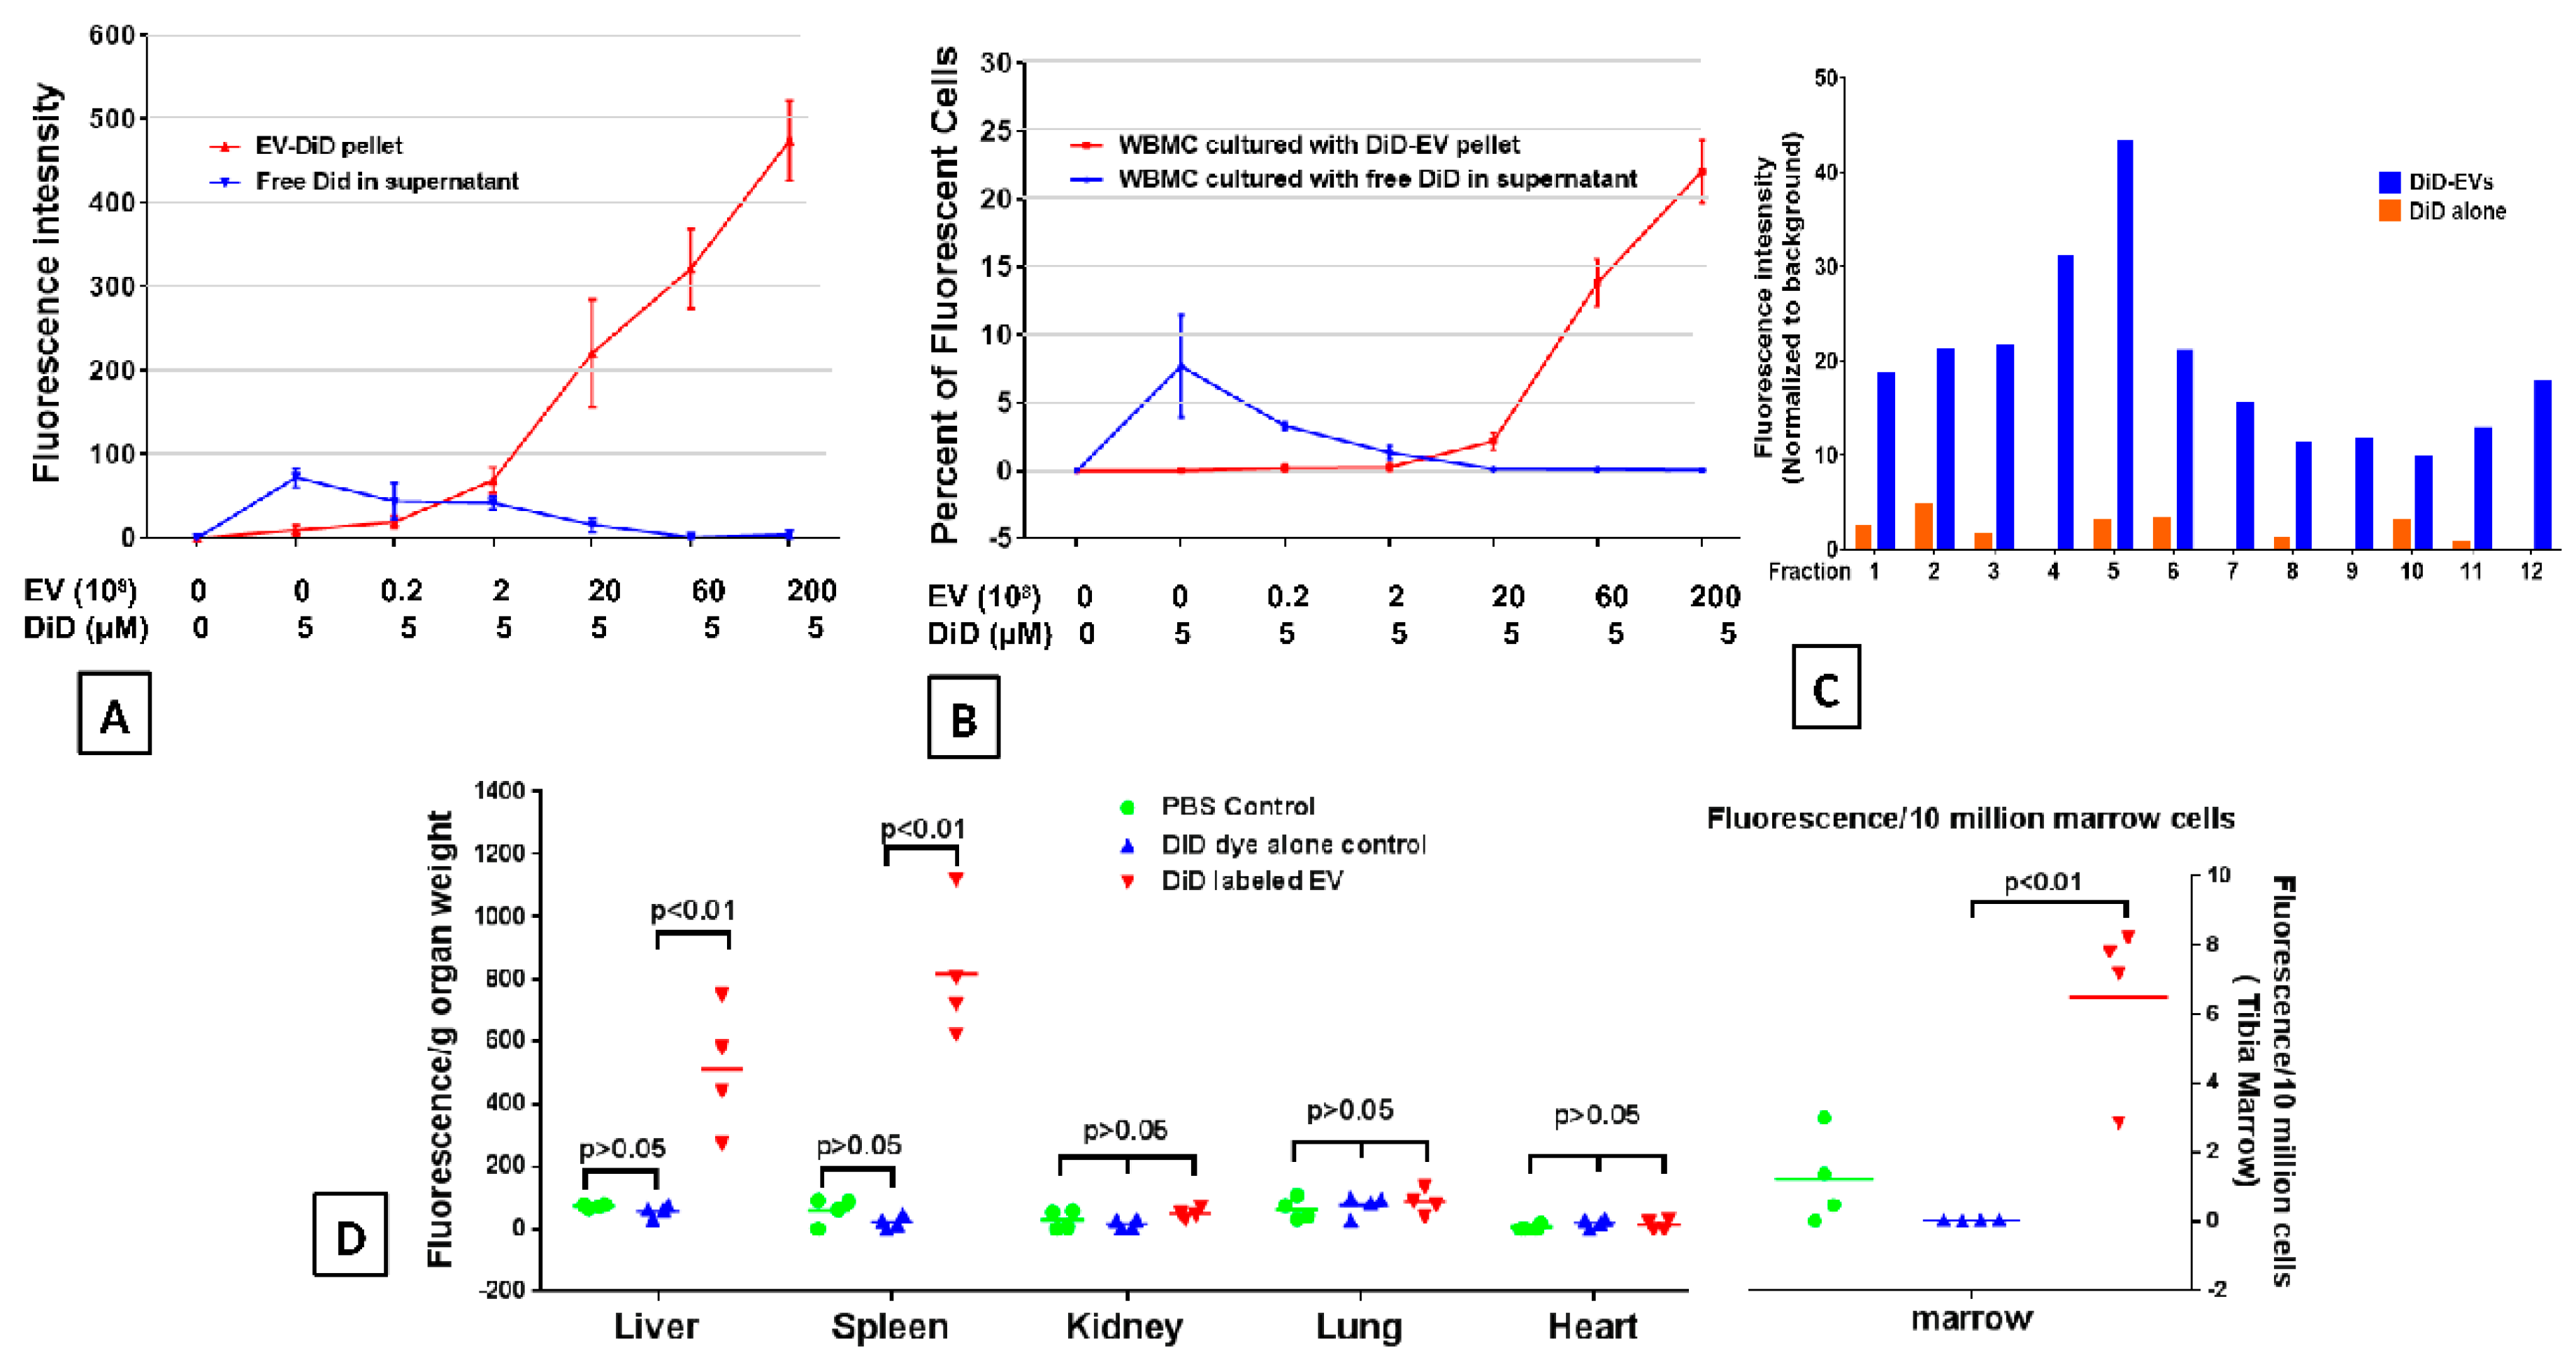
2.2. DiD Dye Labelling EVs
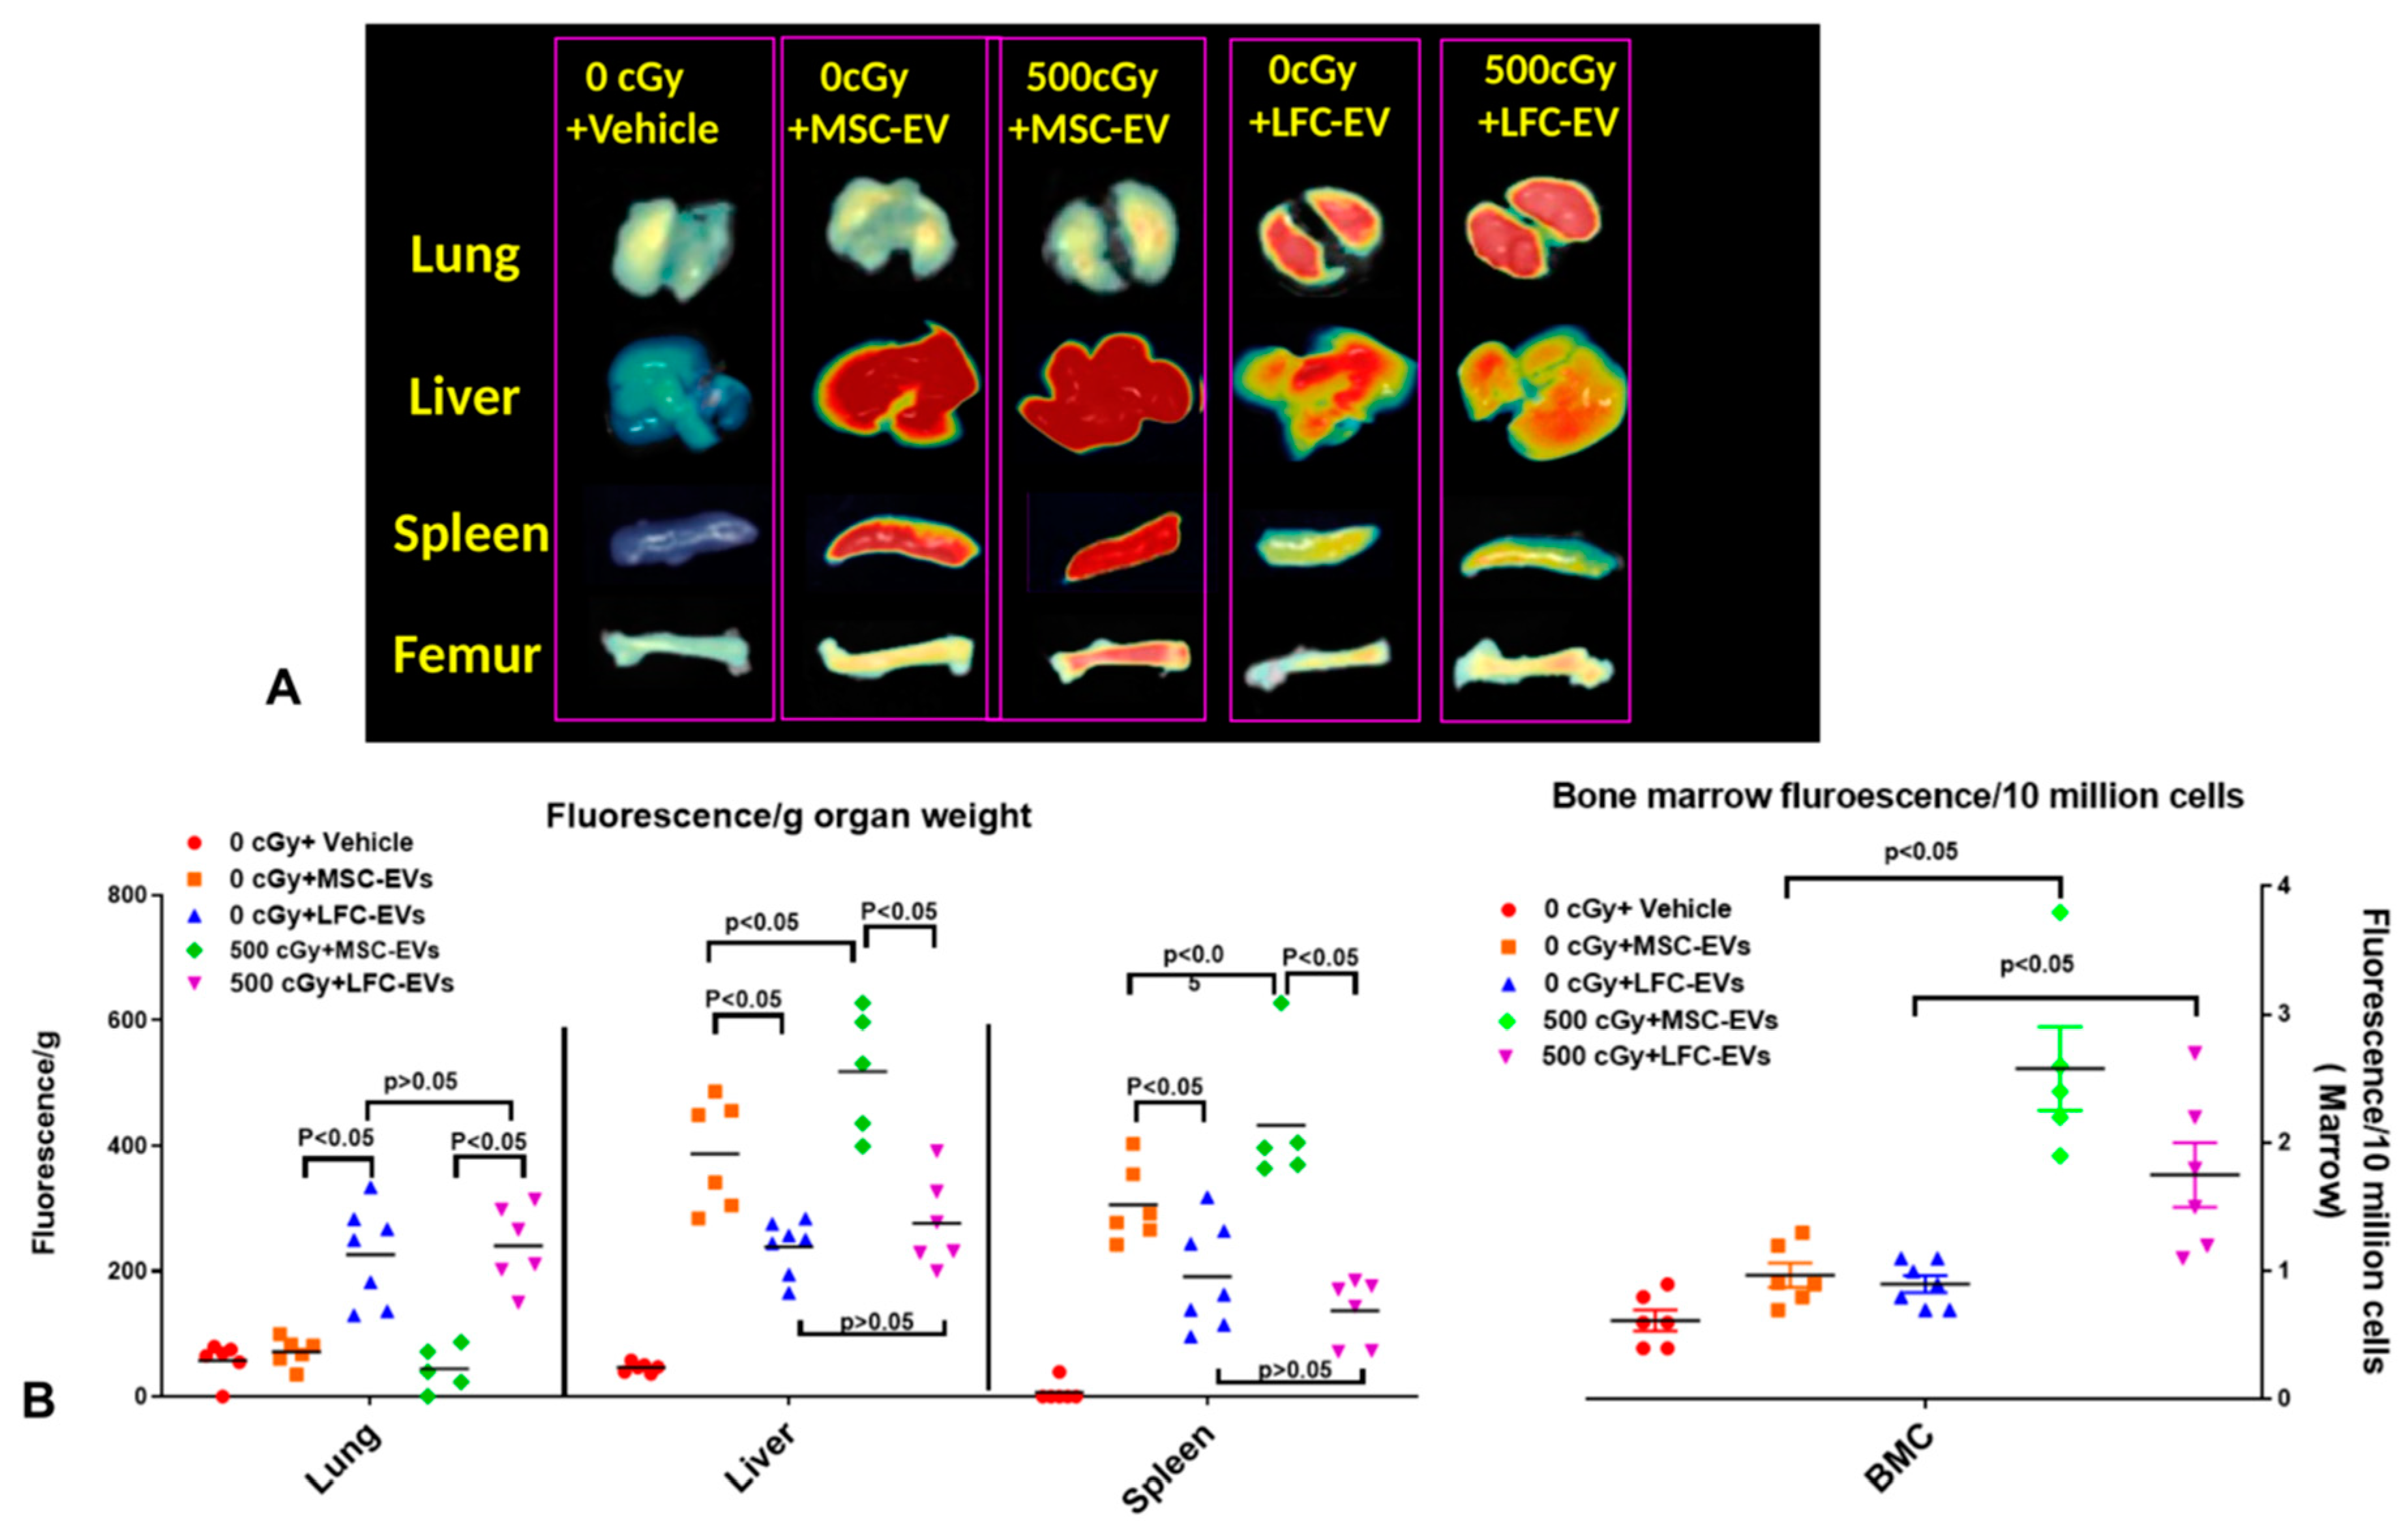
2.3. EVs Accumulate in Radiated Livers, Spleens, and Bone Marrow
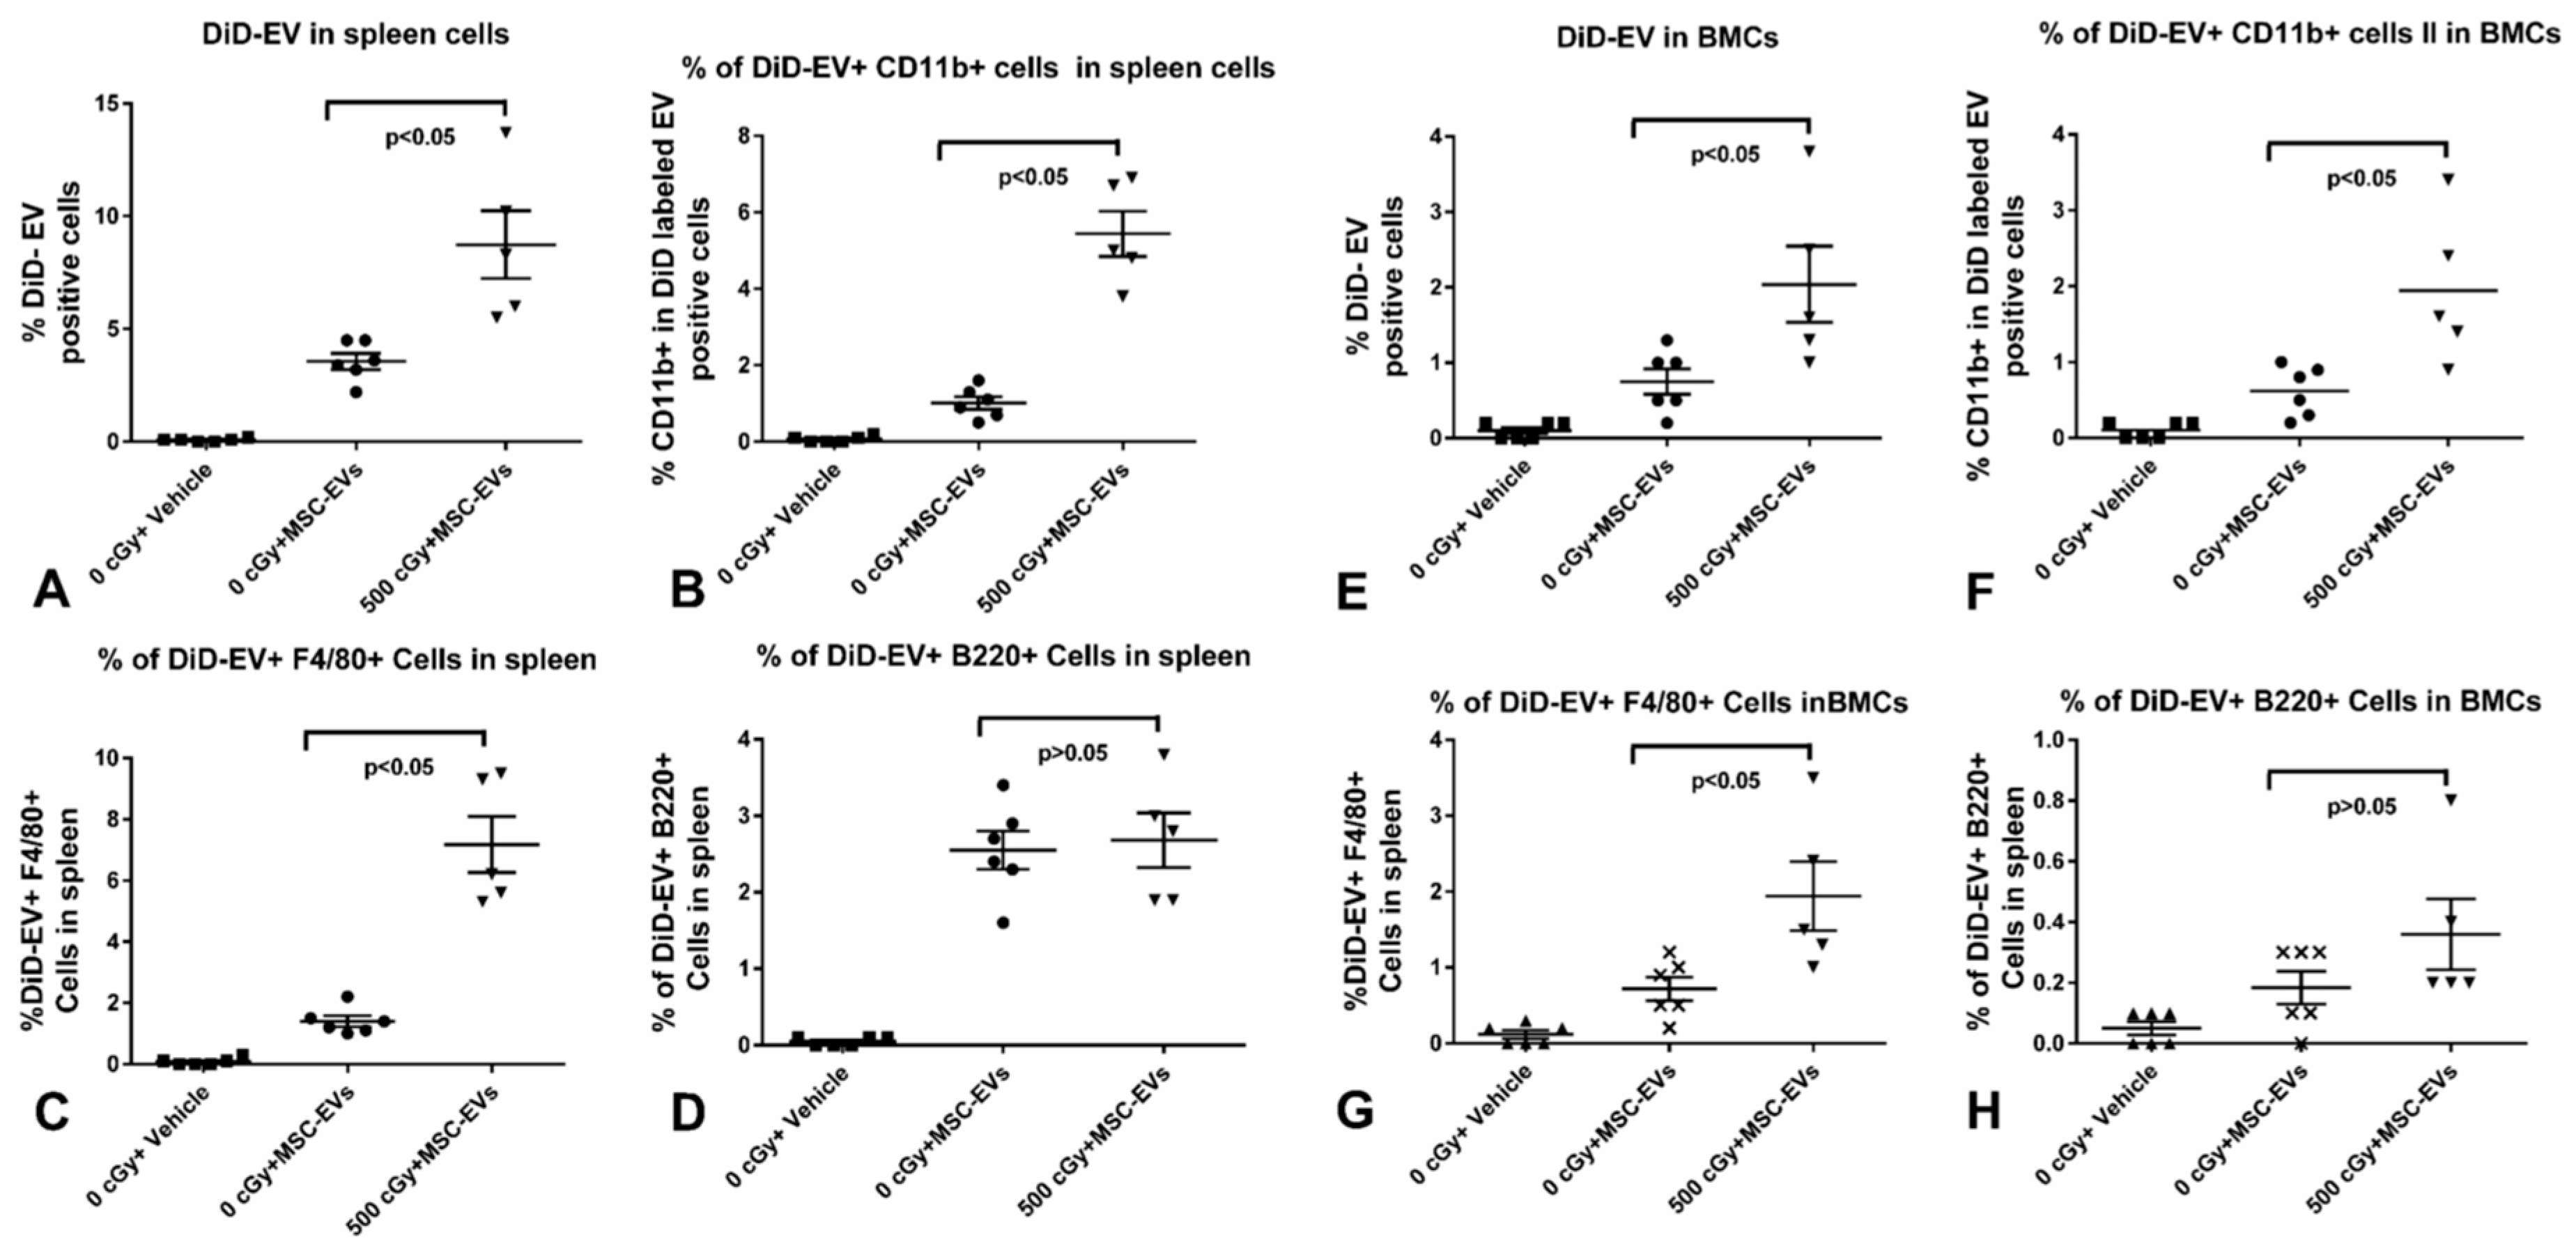
2.4. MSC-EVs Are Internalized in Different Immune Cells
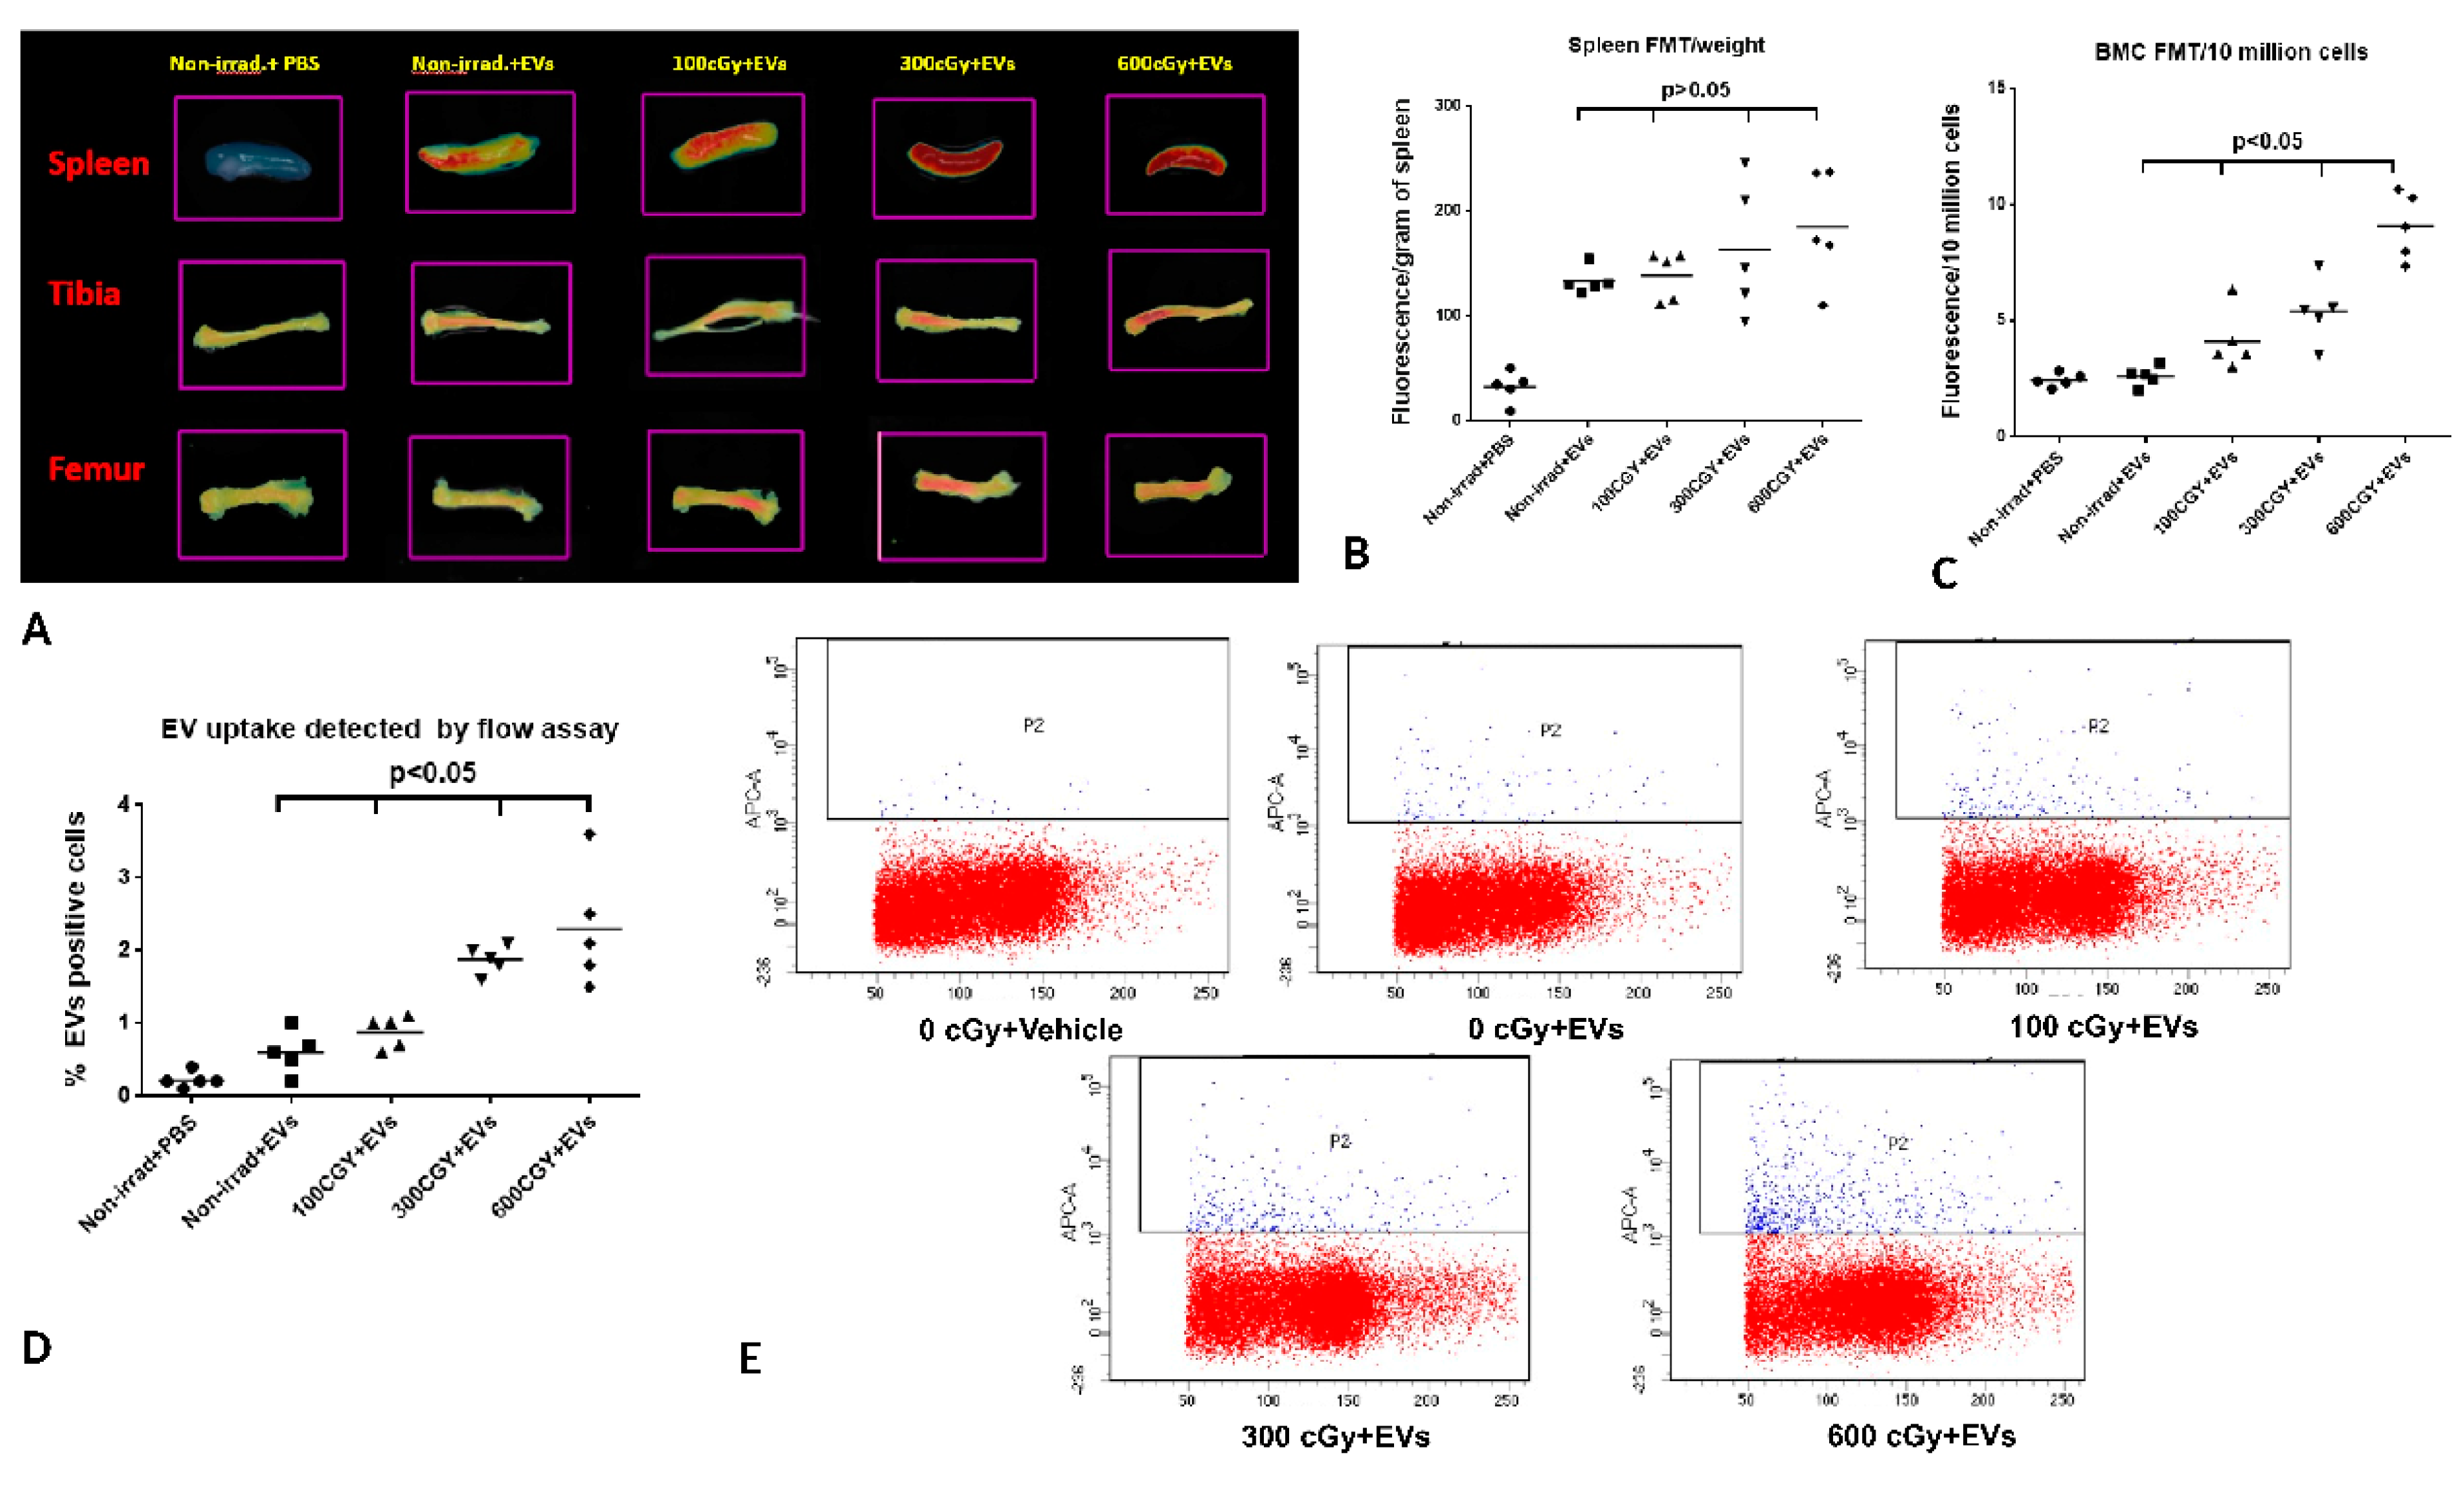
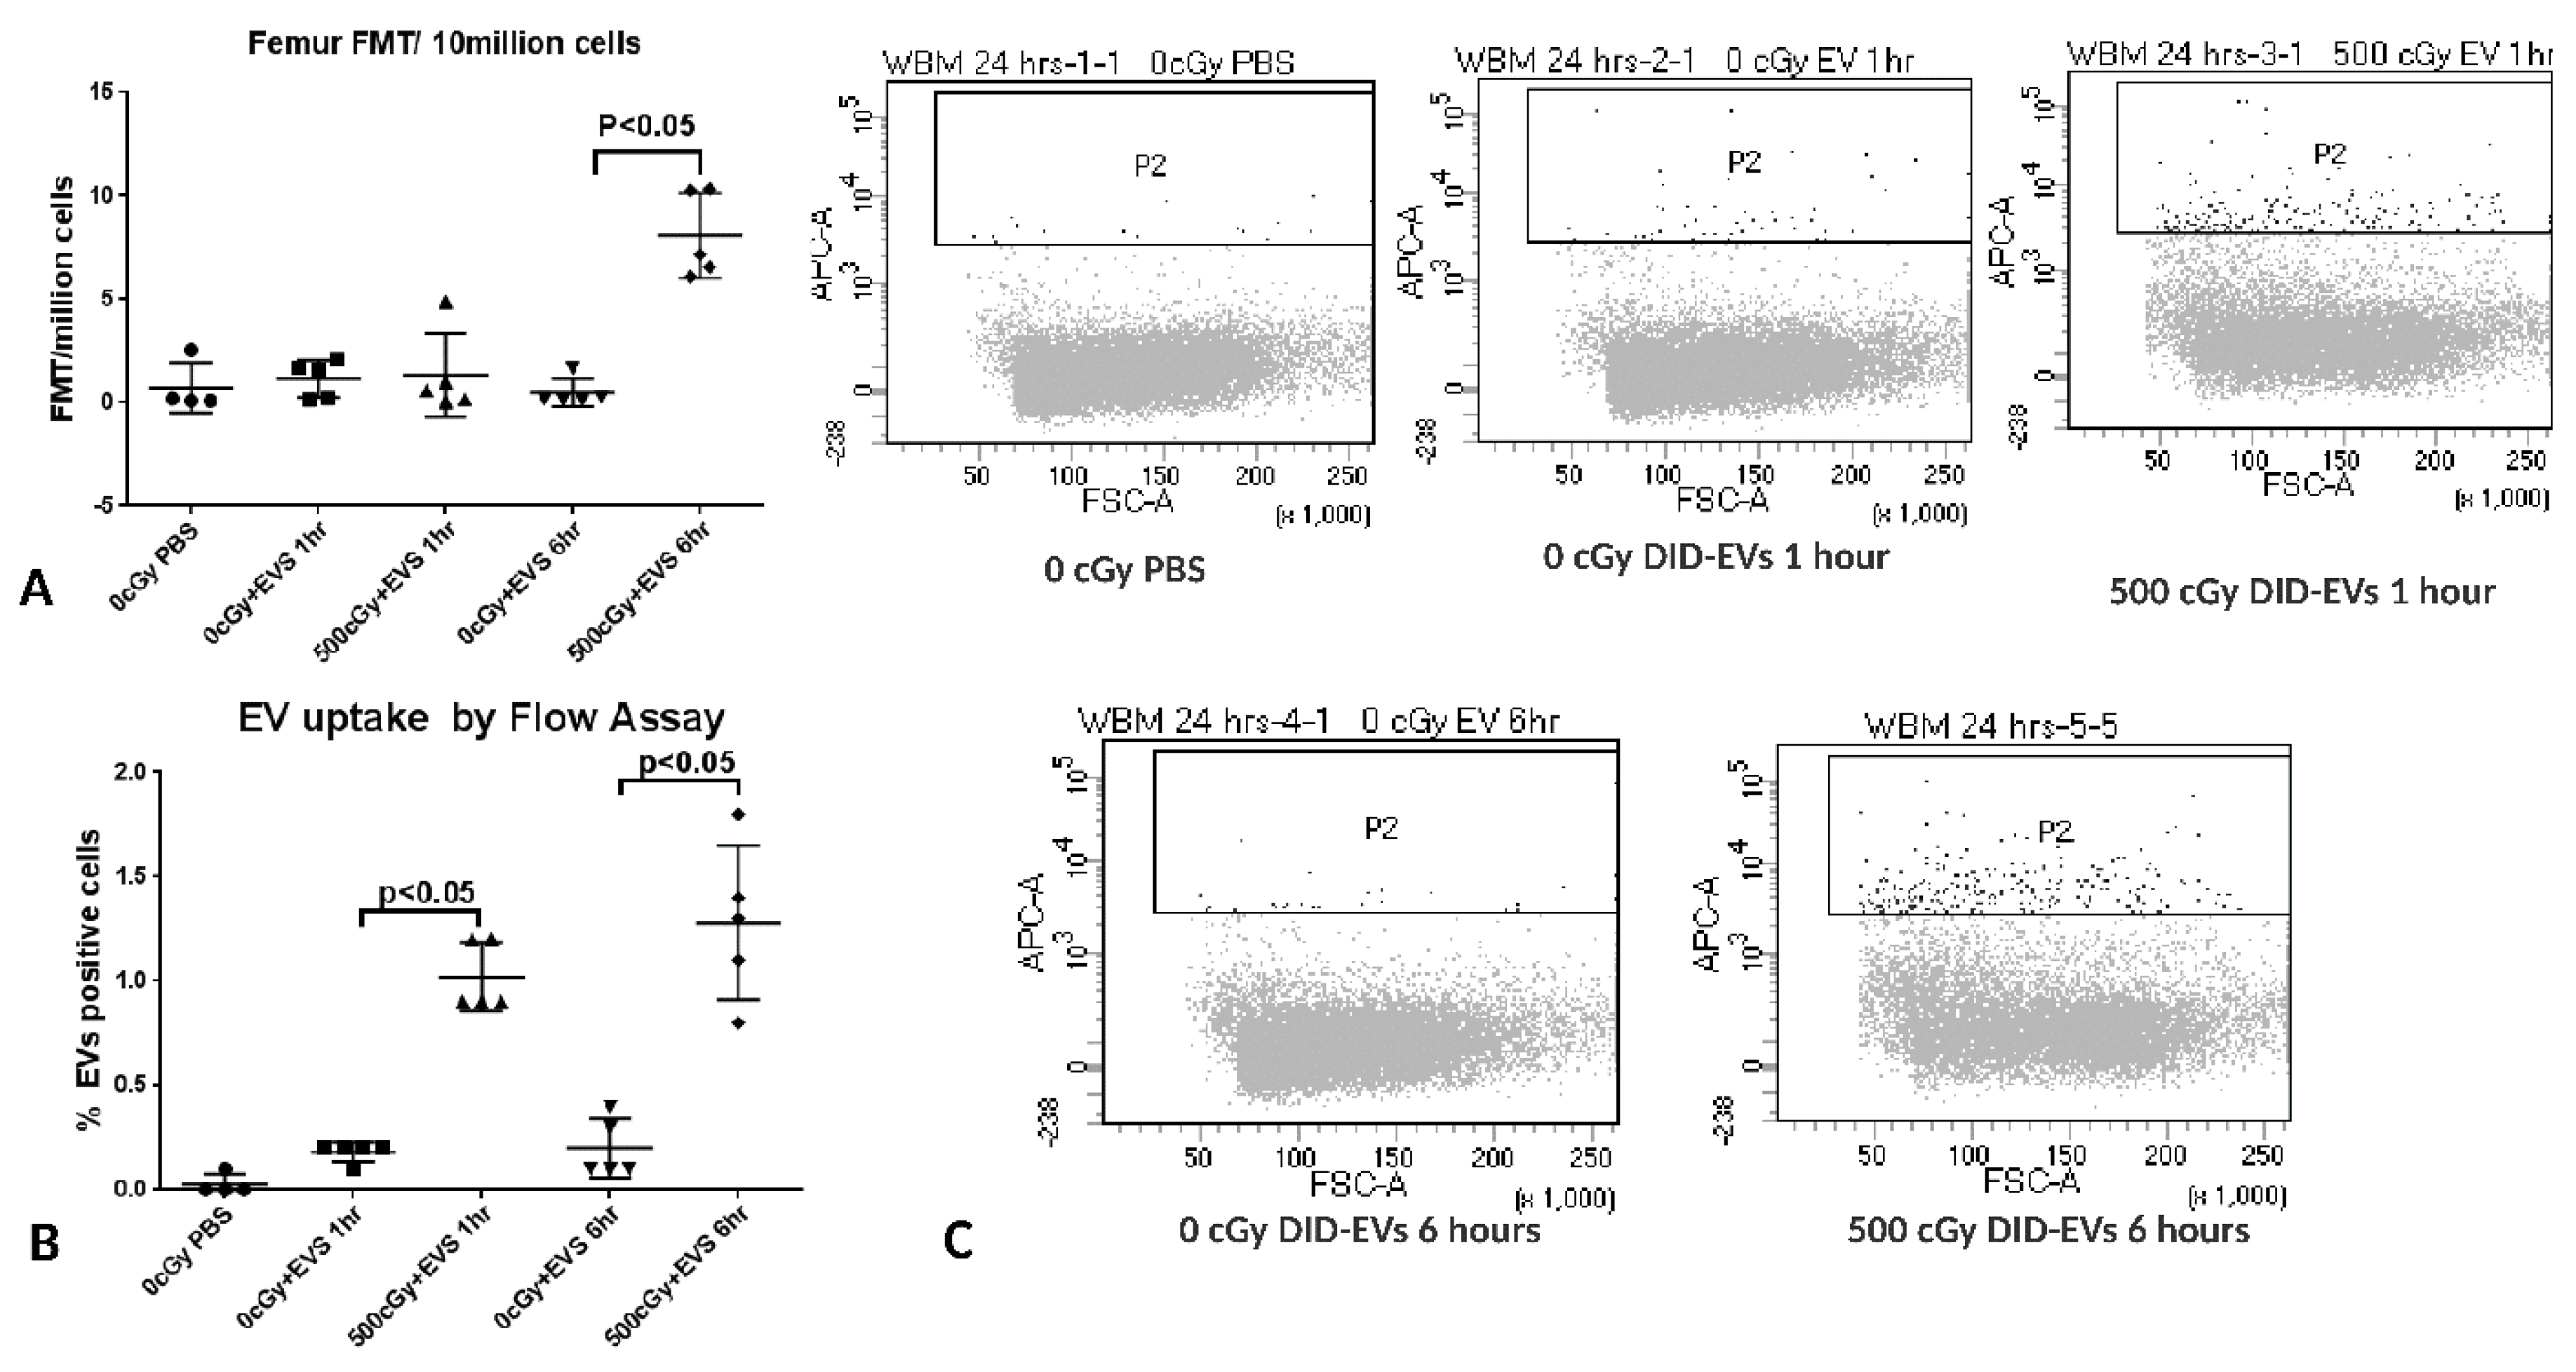
2.5. Accumulation of EVs in Bone Marrow is Dependent on the Dose of Radiation Exposure
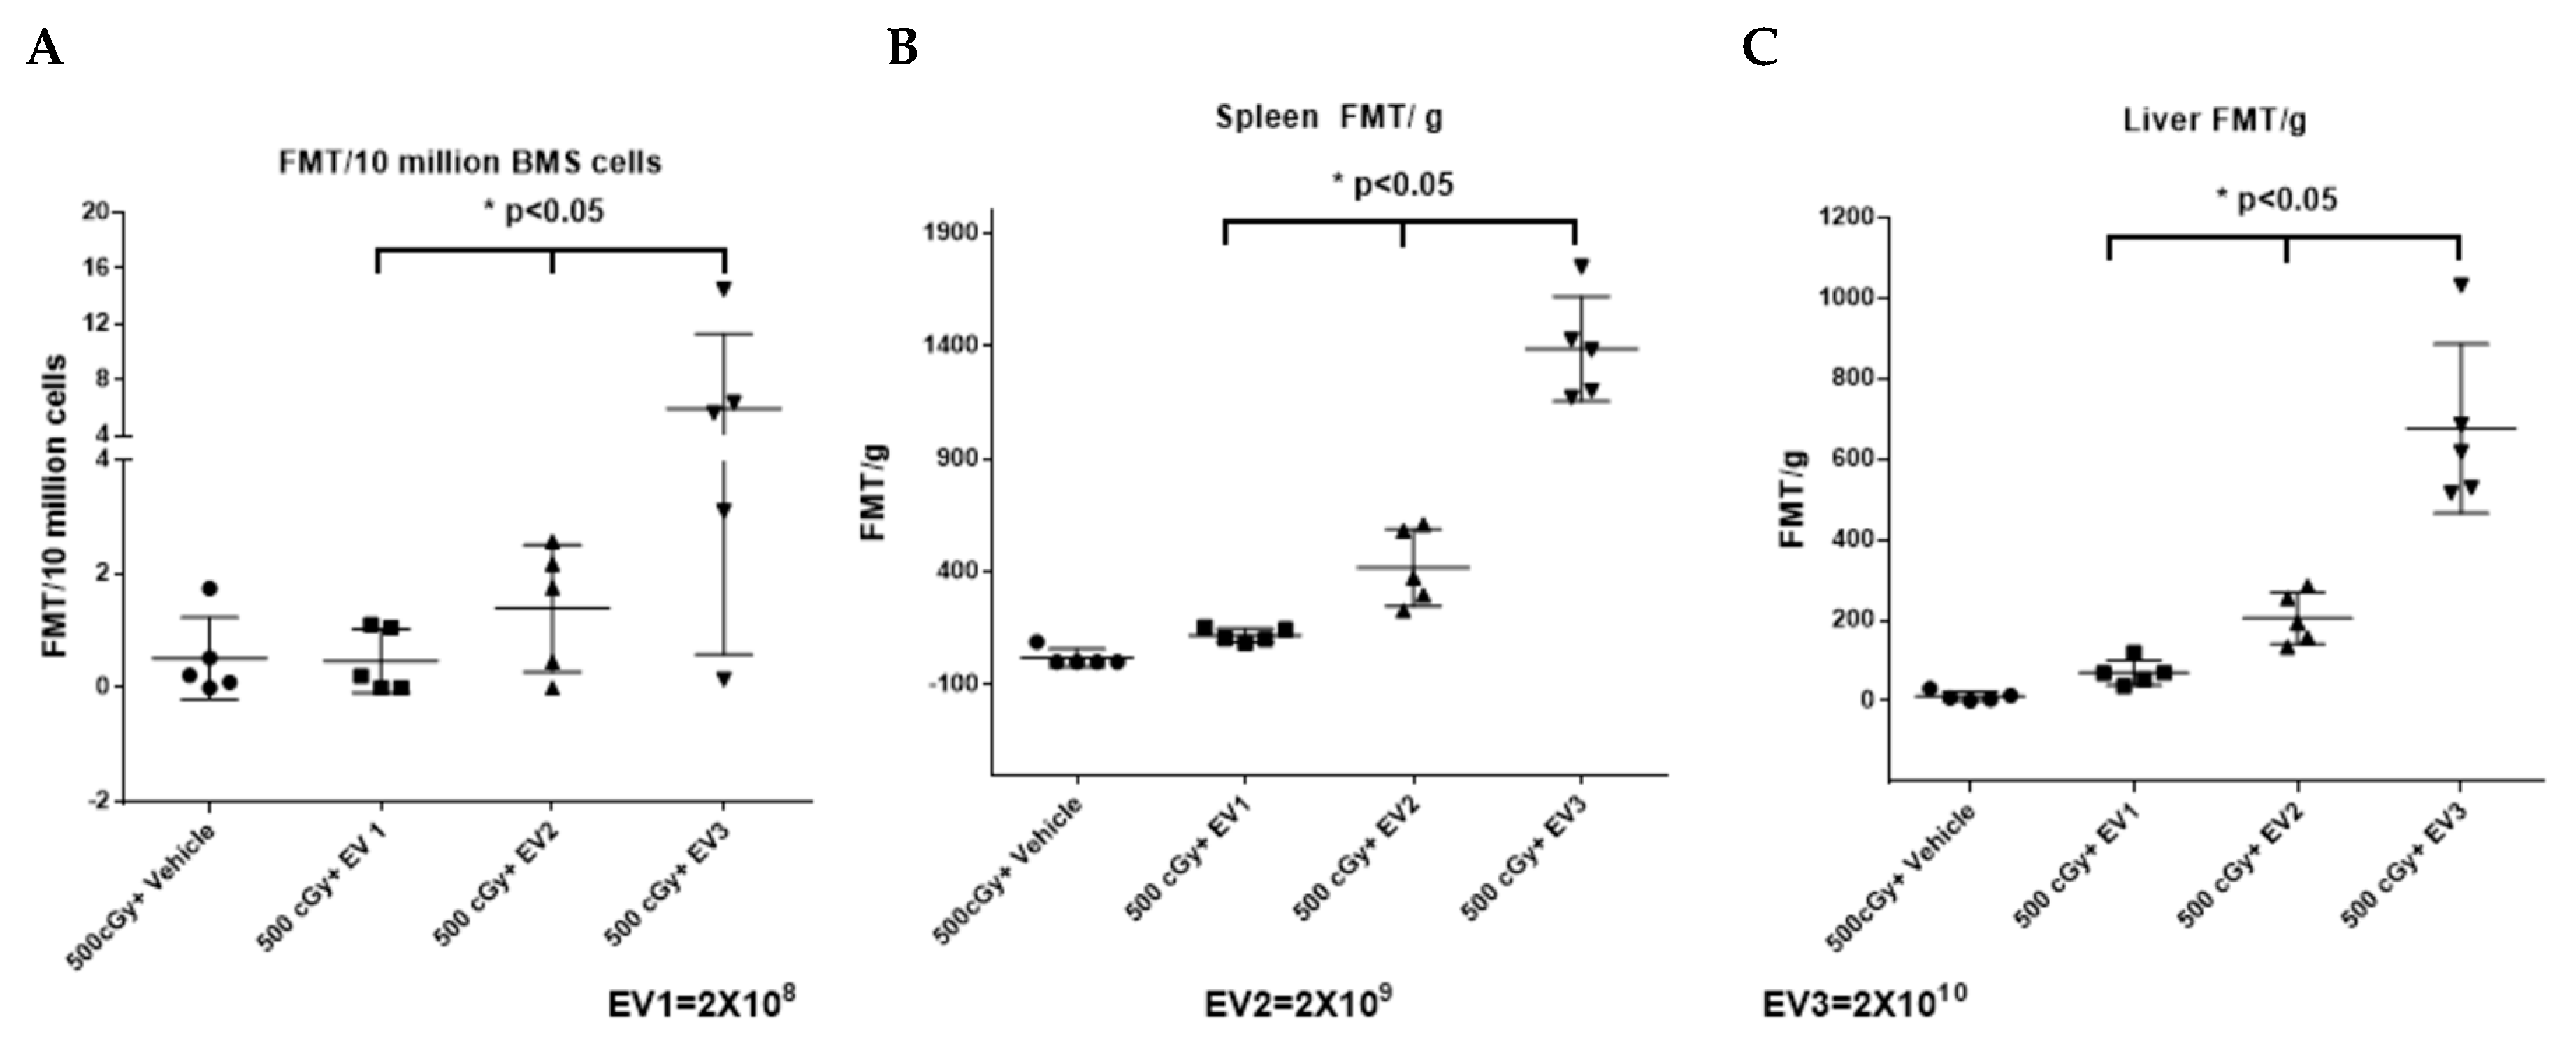
2.6. Accumulation of EVs in the Spleen and Bone Marrow Is Dependent on the Dose of EVs Administered
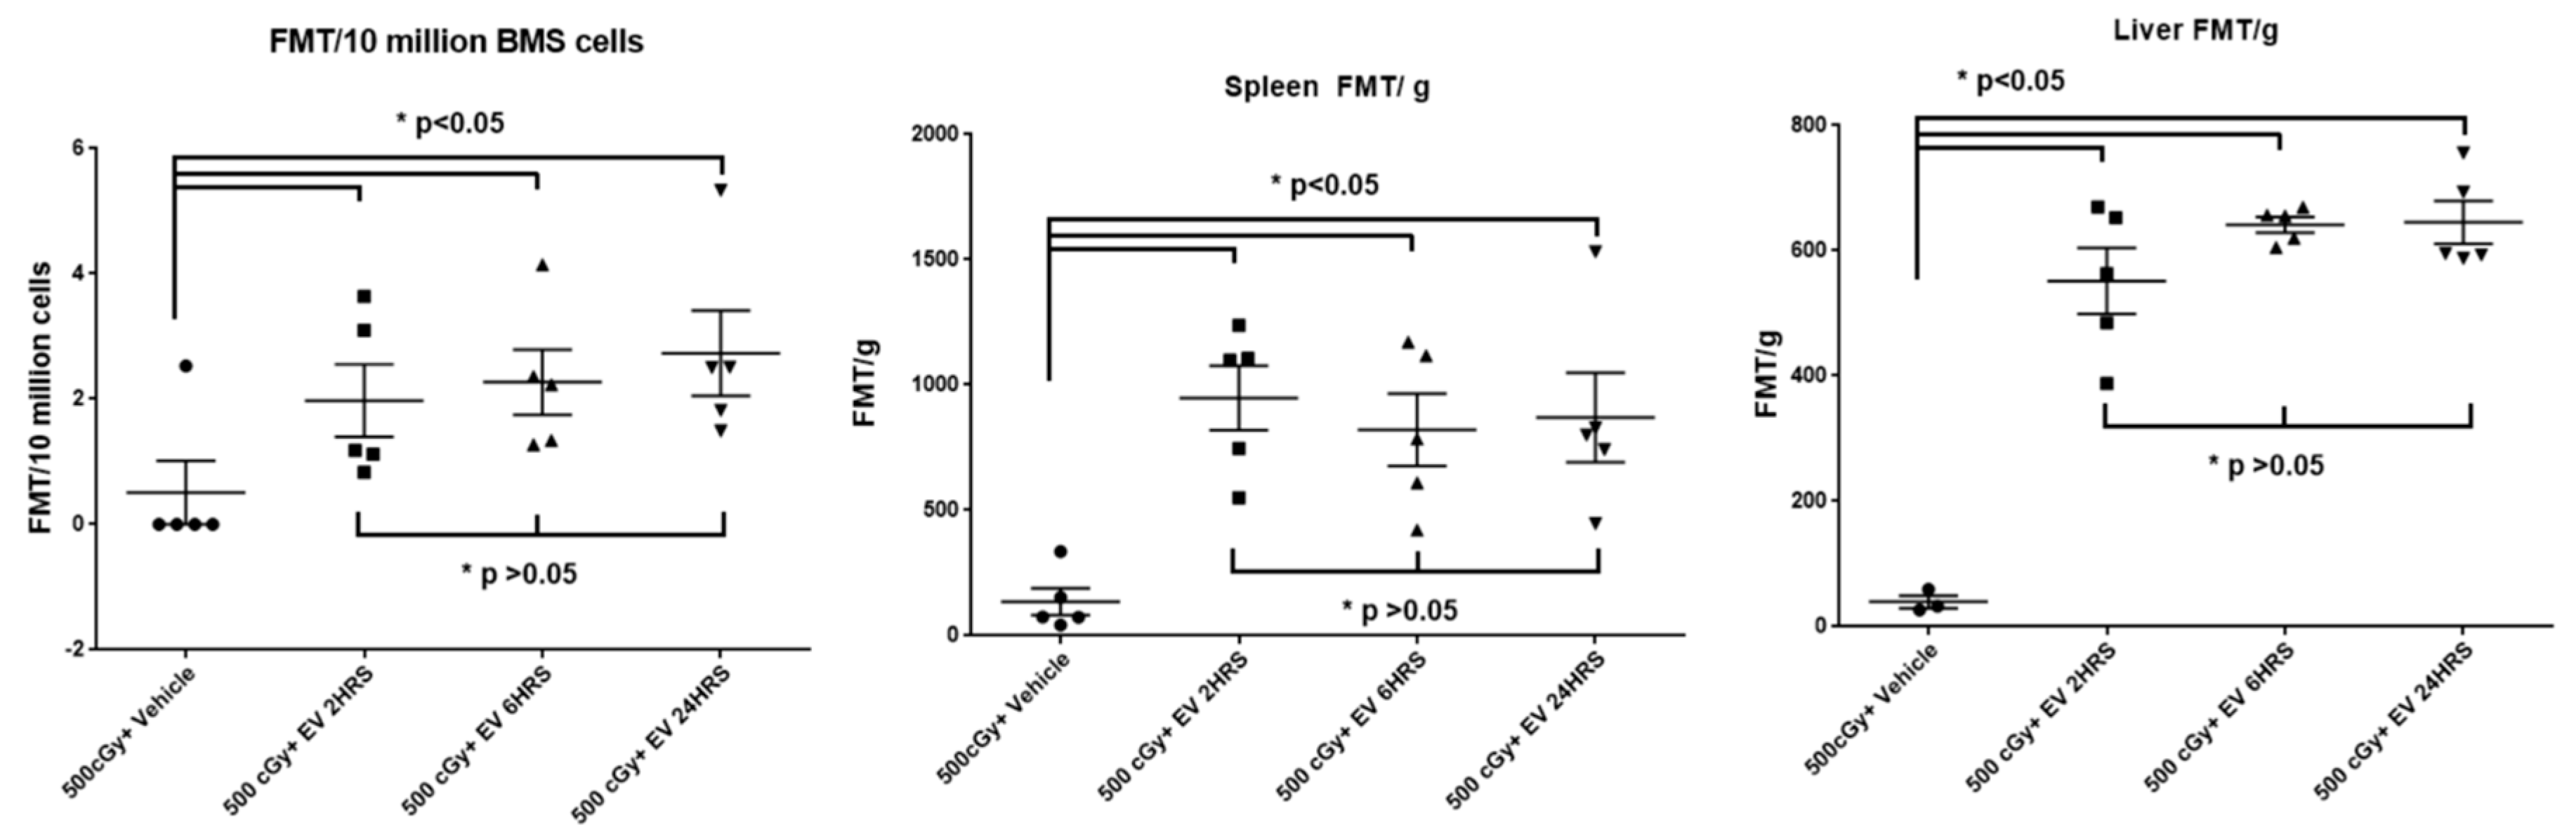
2.7. The Time Course of EV Distribution in Mice after EV Injection
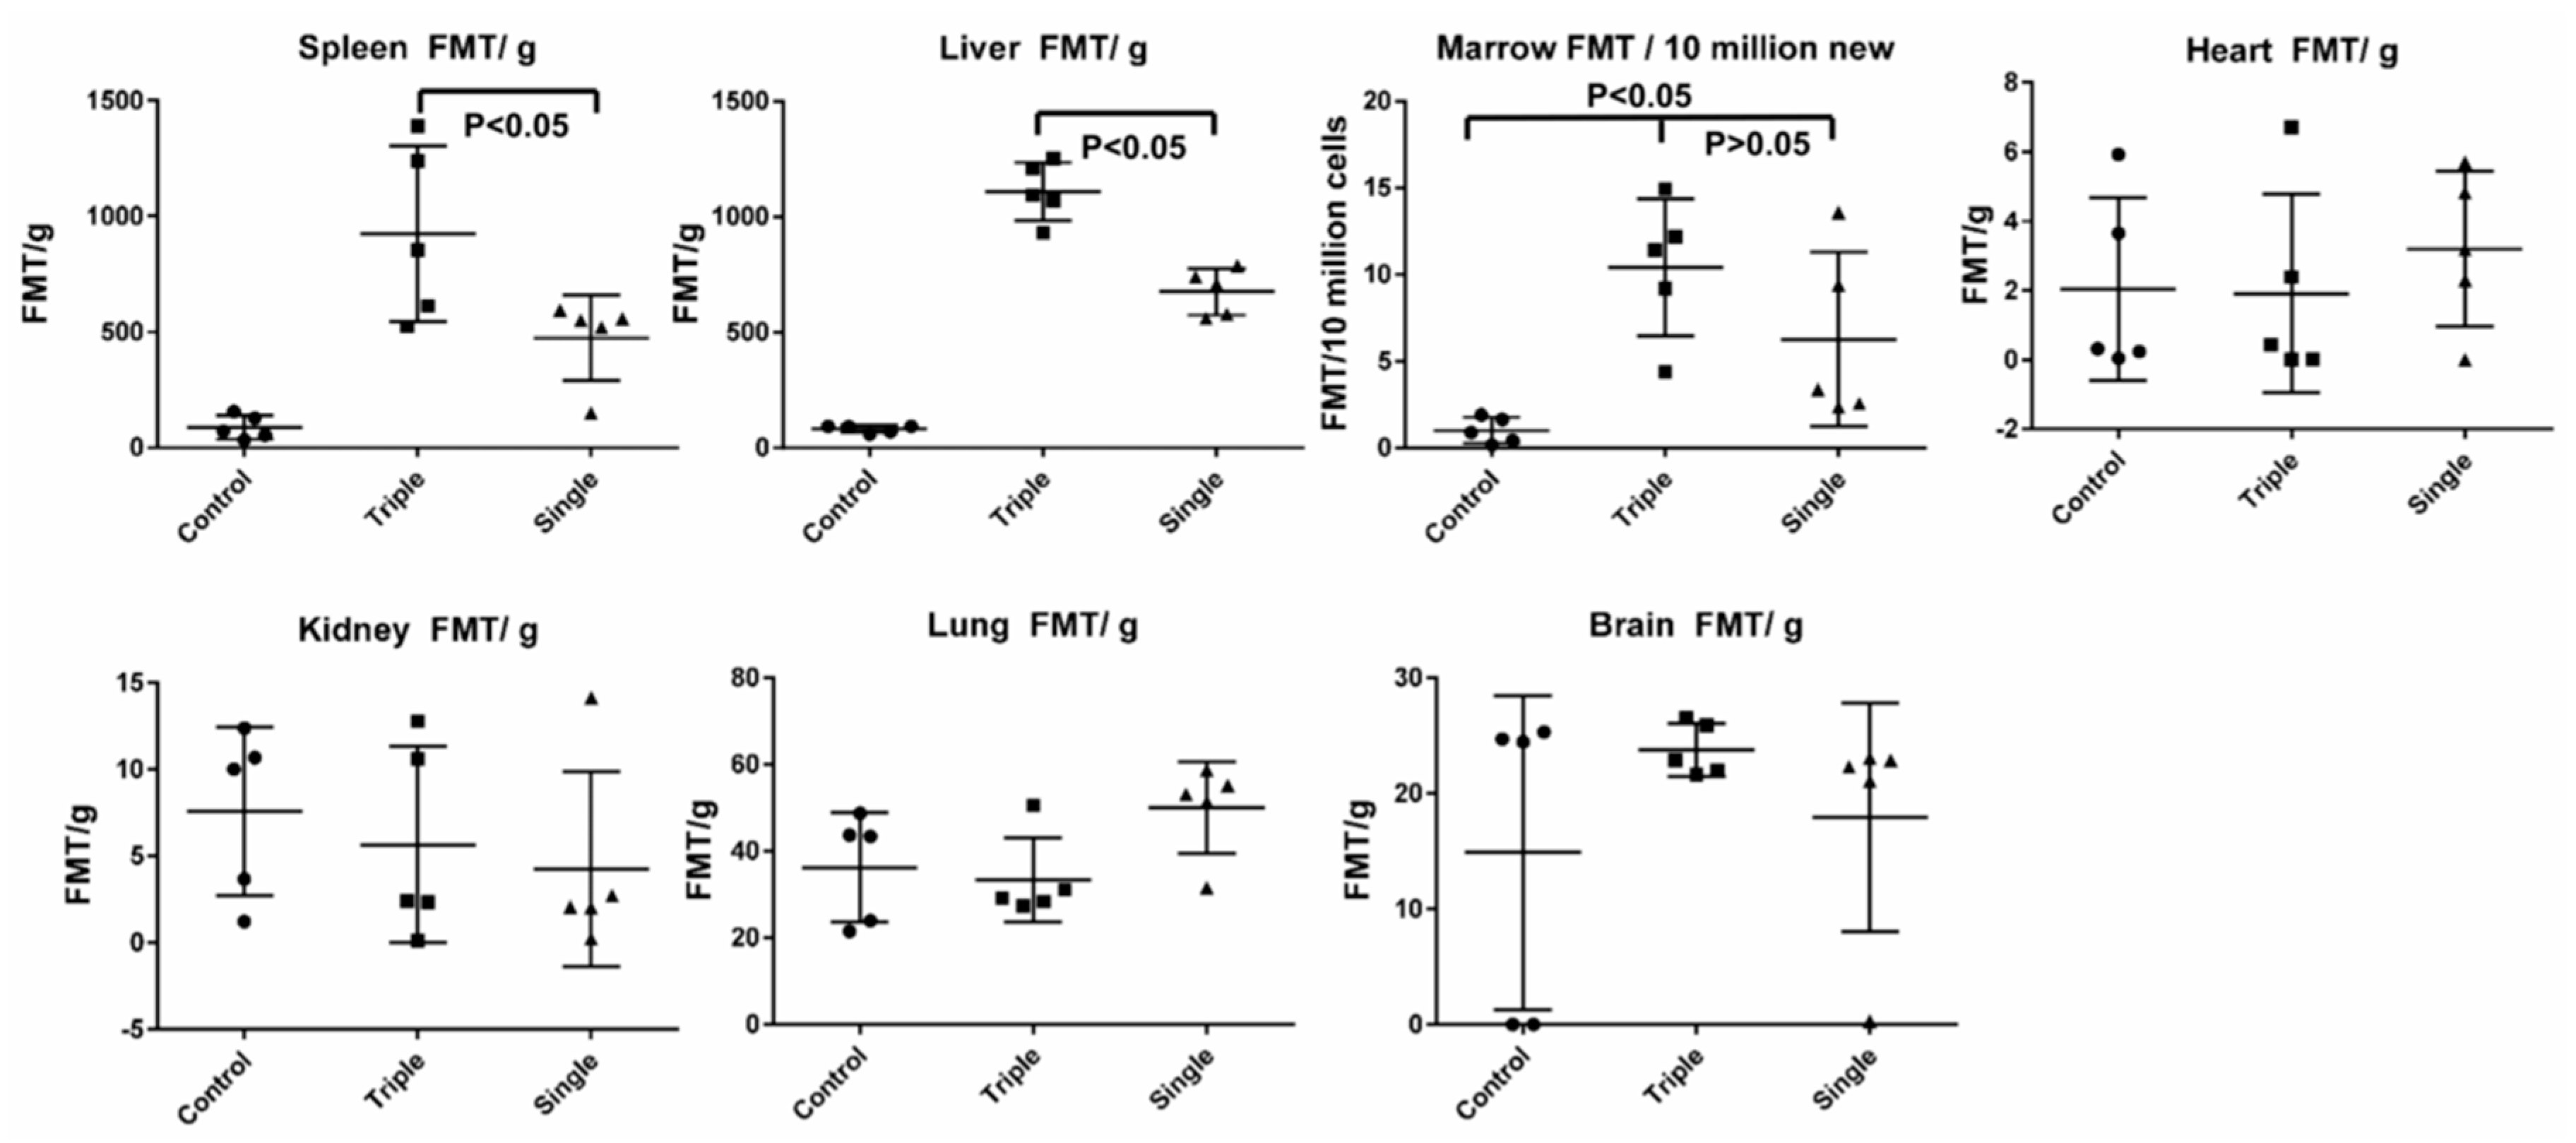
2.8. EV Biodistribution in Mice after Single or Triple Doses of EV Injections
3. Discussion
4. Material Methods
4.1. Experimental Animals
4.2. Cell Culture and EV Isolation
4.3. EV Characterization
4.4. EV Labeling with DiD Lipid Dye
4.5. Fluorescence Molecular Tomography (FMT)
4.6. Sucrose Density Gradient Ultracentrifugation
4.7. Radiation Injury Murine Model
4.8. Spleen Single Cell Suspension Preparing, Staining, and Imaging
4.9. Flow-Cytometry Analysis
4.10. Statistics
Supplementary Materials
Author Contributions
Funding
Acknowledgments
Conflicts of Interest
Abbreviations
| MSC | Mesenchymal stem cell |
| EVs | Extracellular vesicles |
| H-ARS | Hematopoietic acute radiation syndrome |
| LFC | Lung fibroblast cell |
| FMT | Fluorescence molecular tomography |
References
- Claude, A. Concentration and Purification of Chicken Tumor I Agent. Science 1938, 87, 467–468. [Google Scholar] [CrossRef] [PubMed]
- Wolf, P. The nature and significance of platelet products in human plasma. Br. J. Haematol. 1967, 13, 269–288. [Google Scholar] [CrossRef] [PubMed]
- Anderson, H.C. Vesicles associated with calcification in the matrix of epiphyseal cartilage. J. Cell Biol. 1969, 41, 59–72. [Google Scholar] [CrossRef] [PubMed]
- Johnstone, R.M.; Adam, M.; Hammond, J.R.; Orr, L.; Turbide, C. Vesicle formation during reticulocyte maturation. Association of plasma membrane activities with released vesicles (exosomes). J. Biol. Chem. 1987, 262, 9412–9420. [Google Scholar] [PubMed]
- Quesenberry, P.J.; Aliotta, J.; Deregibus, M.C.; Camussi, G. Role of extracellular RNA-carrying vesicles in cell differentiation and reprogramming. Stem Cell Res. Ther. 2015, 6, 153. [Google Scholar] [CrossRef] [PubMed]
- Tan, C.Y.; Lai, R.C.; Wong, W.; Dan, Y.Y.; Lim, S.K.; Ho, H.K. Mesenchymal stem cell-derived exosomes promote hepatic regeneration in drug-induced liver injury models. Stem Cell Res. Ther. 2014, 5, 76. [Google Scholar] [CrossRef] [PubMed]
- Timmers, L.; Lim, S.K.; Arslan, F.; Armstrong, J.S.; Hoefer, I.E.; Doevendans, P.A.; Piek, J.J.; El Oakley, R.M.; Choo, A.; Lee, C.N.; et al. Reduction of myocardial infarct size by human mesenchymal stem cell conditioned medium. Stem Cell Res. 2007, 1, 129–137. [Google Scholar] [CrossRef]
- Zhu, Y.G.; Feng, X.M.; Abbott, J.; Fang, X.H.; Hao, Q.; Monsel, A.; Qu, J.M.; Matthay, M.A.; Lee, J.W. Human mesenchymal stem cell microvesicles for treatment of Escherichia coli endotoxin-induced acute lung injury in mice. Stem Cells 2014, 32, 116–125. [Google Scholar] [CrossRef]
- Collino, F.; Bruno, S.; Incarnato, D.; Dettori, D.; Neri, F.; Provero, P.; Pomatto, M.; Oliviero, S.; Tetta, C.; Quesenberry, P.J.; et al. AKI Recovery Induced by Mesenchymal Stromal Cell-Derived Extracellular Vesicles Carrying MicroRNAs. J. Am. Soc. Nephrol. JASN 2015, 26, 2349–2360. [Google Scholar] [CrossRef]
- Bi, B.; Schmitt, R.; Israilova, M.; Nishio, H.; Cantley, L.G. Stromal cells protect against acute tubular injury via an endocrine effect. J. Am. Soc. Nephrol. JASN 2007, 18, 2486–2496. [Google Scholar] [CrossRef]
- Caplan, A.I.; Dennis, J.E. Mesenchymal stem cells as trophic mediators. J. Cell. Biochem. 2006, 98, 1076–1084. [Google Scholar] [CrossRef] [PubMed]
- Biancone, L.; Bruno, S.; Deregibus, M.C.; Tetta, C.; Camussi, G. Therapeutic potential of mesenchymal stem cell-derived microvesicles. Nephrol. Dial. Transplant. Off. Publ. Eur. Dial. Transpl. Assoc. Eur. Ren. Assoc. 2012, 27, 3037–3042. [Google Scholar] [CrossRef] [PubMed]
- Quesenberry, P.J.; Aliotta, J.M. Cellular phenotype switching and microvesicles. Adv. Drug Deliv. Rev. 2010, 62, 1141–1148. [Google Scholar] [CrossRef] [PubMed]
- Camussi, G.; Deregibus, M.C.; Cantaluppi, V. Role of stem-cell-derived microvesicles in the paracrine action of stem cells. Biochem. Soc. Trans. 2013, 41, 283–287. [Google Scholar] [CrossRef] [PubMed]
- Arora, R.; Chawla, R.; Marwah, R.; Kumar, V.; Goel, R.; Arora, P.; Jaiswal, S.; Sharma, R.K. Medical radiation countermeasures for nuclear and radiological emergencies: Current status and future perspectives. J. Pharm. Bioallied Sci. 2010, 2, 202–212. [Google Scholar] [CrossRef] [PubMed]
- Williams, J.P.; Brown, S.L.; Georges, G.E.; Hauer-Jensen, M.; Hill, R.P.; Huser, A.K.; Kirsch, D.G.; Macvittie, T.J.; Mason, K.A.; Medhora, M.M.; et al. Animal models for medical countermeasures to radiation exposure. Radiat. Res. 2010, 173, 557–578. [Google Scholar] [CrossRef] [PubMed]
- Wen, S.; Dooner, M.; Cheng, Y.; Papa, E.; Del Tatto, M.; Pereira, M.; Deng, Y.; Goldberg, L.; Aliotta, J.; Chatterjee, D.; et al. Mesenchymal stromal cell-derived extracellular vesicles rescue radiation damage to murine marrow hematopoietic cells. Leukemia 2016, 30, 2221–2231. [Google Scholar] [CrossRef]
- Wiklander, O.P.; Nordin, J.Z.; O’Loughlin, A.; Gustafsson, Y.; Corso, G.; Mager, I.; Vader, P.; Lee, Y.; Sork, H.; Seow, Y.; et al. Extracellular vesicle in vivo biodistribution is determined by cell source, route of administration and targeting. J. Extracell. Vesicles 2015, 4, 26316. [Google Scholar] [CrossRef]
- Grange, C.; Tapparo, M.; Bruno, S.; Chatterjee, D.; Quesenberry, P.J.; Tetta, C.; Camussi, G. Biodistribution of mesenchymal stem cell-derived extracellular vesicles in a model of acute kidney injury monitored by optical imaging. Int. J. Mol. Med. 2014, 33, 1055–1063. [Google Scholar] [CrossRef]
- Wen, S.W.; Sceneay, J.; Lima, L.G.; Wong, C.S.; Becker, M.; Krumeich, S.; Lobb, R.J.; Castillo, V.; Wong, K.N.; Ellis, S.; et al. The biodistribution and immune suppressive effects of breast cancer-derived exosomes. Cancer Res. 2016, 76, 6816–6827. [Google Scholar] [CrossRef]
- Luo, S.; Zhang, E.; Su, Y.; Cheng, T.; Shi, C. A review of NIR dyes in cancer targeting and imaging. Biomaterials 2011, 32, 7127–7138. [Google Scholar] [CrossRef] [PubMed]
- Collino, F.; Pomatto, M.; Bruno, S.; Lindoso, R.S.; Tapparo, M.; Sicheng, W.; Quesenberry, P.; Camussi, G. Exosome and Microvesicle-Enriched Fractions Isolated from Mesenchymal Stem Cells by Gradient Separation Showed Different Molecular Signatures and Functions on Renal Tubular Epithelial Cells. Stem Cell Rev. 2017, 13, 226–243. [Google Scholar] [CrossRef] [PubMed]
- Watson, D.C.; Bayik, D.; Srivatsan, A.; Bergamaschi, C.; Valentin, A.; Niu, G.; Bear, J.; Monninger, M.; Sun, M.; Morales-Kastresana, A.; et al. Efficient production and enhanced tumor delivery of engineered extracellular vesicles. Biomaterials 2016, 105, 195–205. [Google Scholar] [CrossRef] [PubMed]
- Gangadaran, P.; Hong, C.M.; Ahn, B.C. An Update on in Vivo Imaging of Extracellular Vesicles as Drug Delivery Vehicles. Front. Pharmacol. 2018, 9, 169. [Google Scholar] [CrossRef] [PubMed]
- Smyth, T.; Kullberg, M.; Malik, N.; Smith-Jones, P.; Graner, M.W.; Anchordoquy, T.J. Biodistribution and delivery efficiency of unmodified tumor-derived exosomes. J. Control. Release: Off. J. Control. Release Soc. 2015, 199, 145–155. [Google Scholar] [CrossRef] [PubMed]
- Ni-Ting Chiou, K.M.A. Improved exosome isolation by sucrose gradient fractionation of ultracentrifuged crude exosome pellets. Res. Sq. Protoc. Exch. 2016. [Google Scholar] [CrossRef]


© 2019 by the authors. Licensee MDPI, Basel, Switzerland. This article is an open access article distributed under the terms and conditions of the Creative Commons Attribution (CC BY) license (http://creativecommons.org/licenses/by/4.0/).
Share and Cite
Wen, S.; Dooner, M.; Papa, E.; Del Tatto, M.; Pereira, M.; Borgovan, T.; Cheng, Y.; Goldberg, L.; Liang, O.; Camussi, G.; et al. Biodistribution of Mesenchymal Stem Cell-Derived Extracellular Vesicles in a Radiation Injury Bone Marrow Murine Model. Int. J. Mol. Sci. 2019, 20, 5468. https://doi.org/10.3390/ijms20215468
Wen S, Dooner M, Papa E, Del Tatto M, Pereira M, Borgovan T, Cheng Y, Goldberg L, Liang O, Camussi G, et al. Biodistribution of Mesenchymal Stem Cell-Derived Extracellular Vesicles in a Radiation Injury Bone Marrow Murine Model. International Journal of Molecular Sciences. 2019; 20(21):5468. https://doi.org/10.3390/ijms20215468
Chicago/Turabian StyleWen, Sicheng, Mark Dooner, Elaine Papa, Michael Del Tatto, Mandy Pereira, Theodor Borgovan, Yan Cheng, Laura Goldberg, Olin Liang, Giovanni Camussi, and et al. 2019. "Biodistribution of Mesenchymal Stem Cell-Derived Extracellular Vesicles in a Radiation Injury Bone Marrow Murine Model" International Journal of Molecular Sciences 20, no. 21: 5468. https://doi.org/10.3390/ijms20215468
APA StyleWen, S., Dooner, M., Papa, E., Del Tatto, M., Pereira, M., Borgovan, T., Cheng, Y., Goldberg, L., Liang, O., Camussi, G., & Quesenberry, P. (2019). Biodistribution of Mesenchymal Stem Cell-Derived Extracellular Vesicles in a Radiation Injury Bone Marrow Murine Model. International Journal of Molecular Sciences, 20(21), 5468. https://doi.org/10.3390/ijms20215468