Dysregulation of Placental Functions and Immune Pathways in Complete Hydatidiform Moles


 ,
,  , ,
, ,  , , , , , , and
Abstract
:1. Introduction
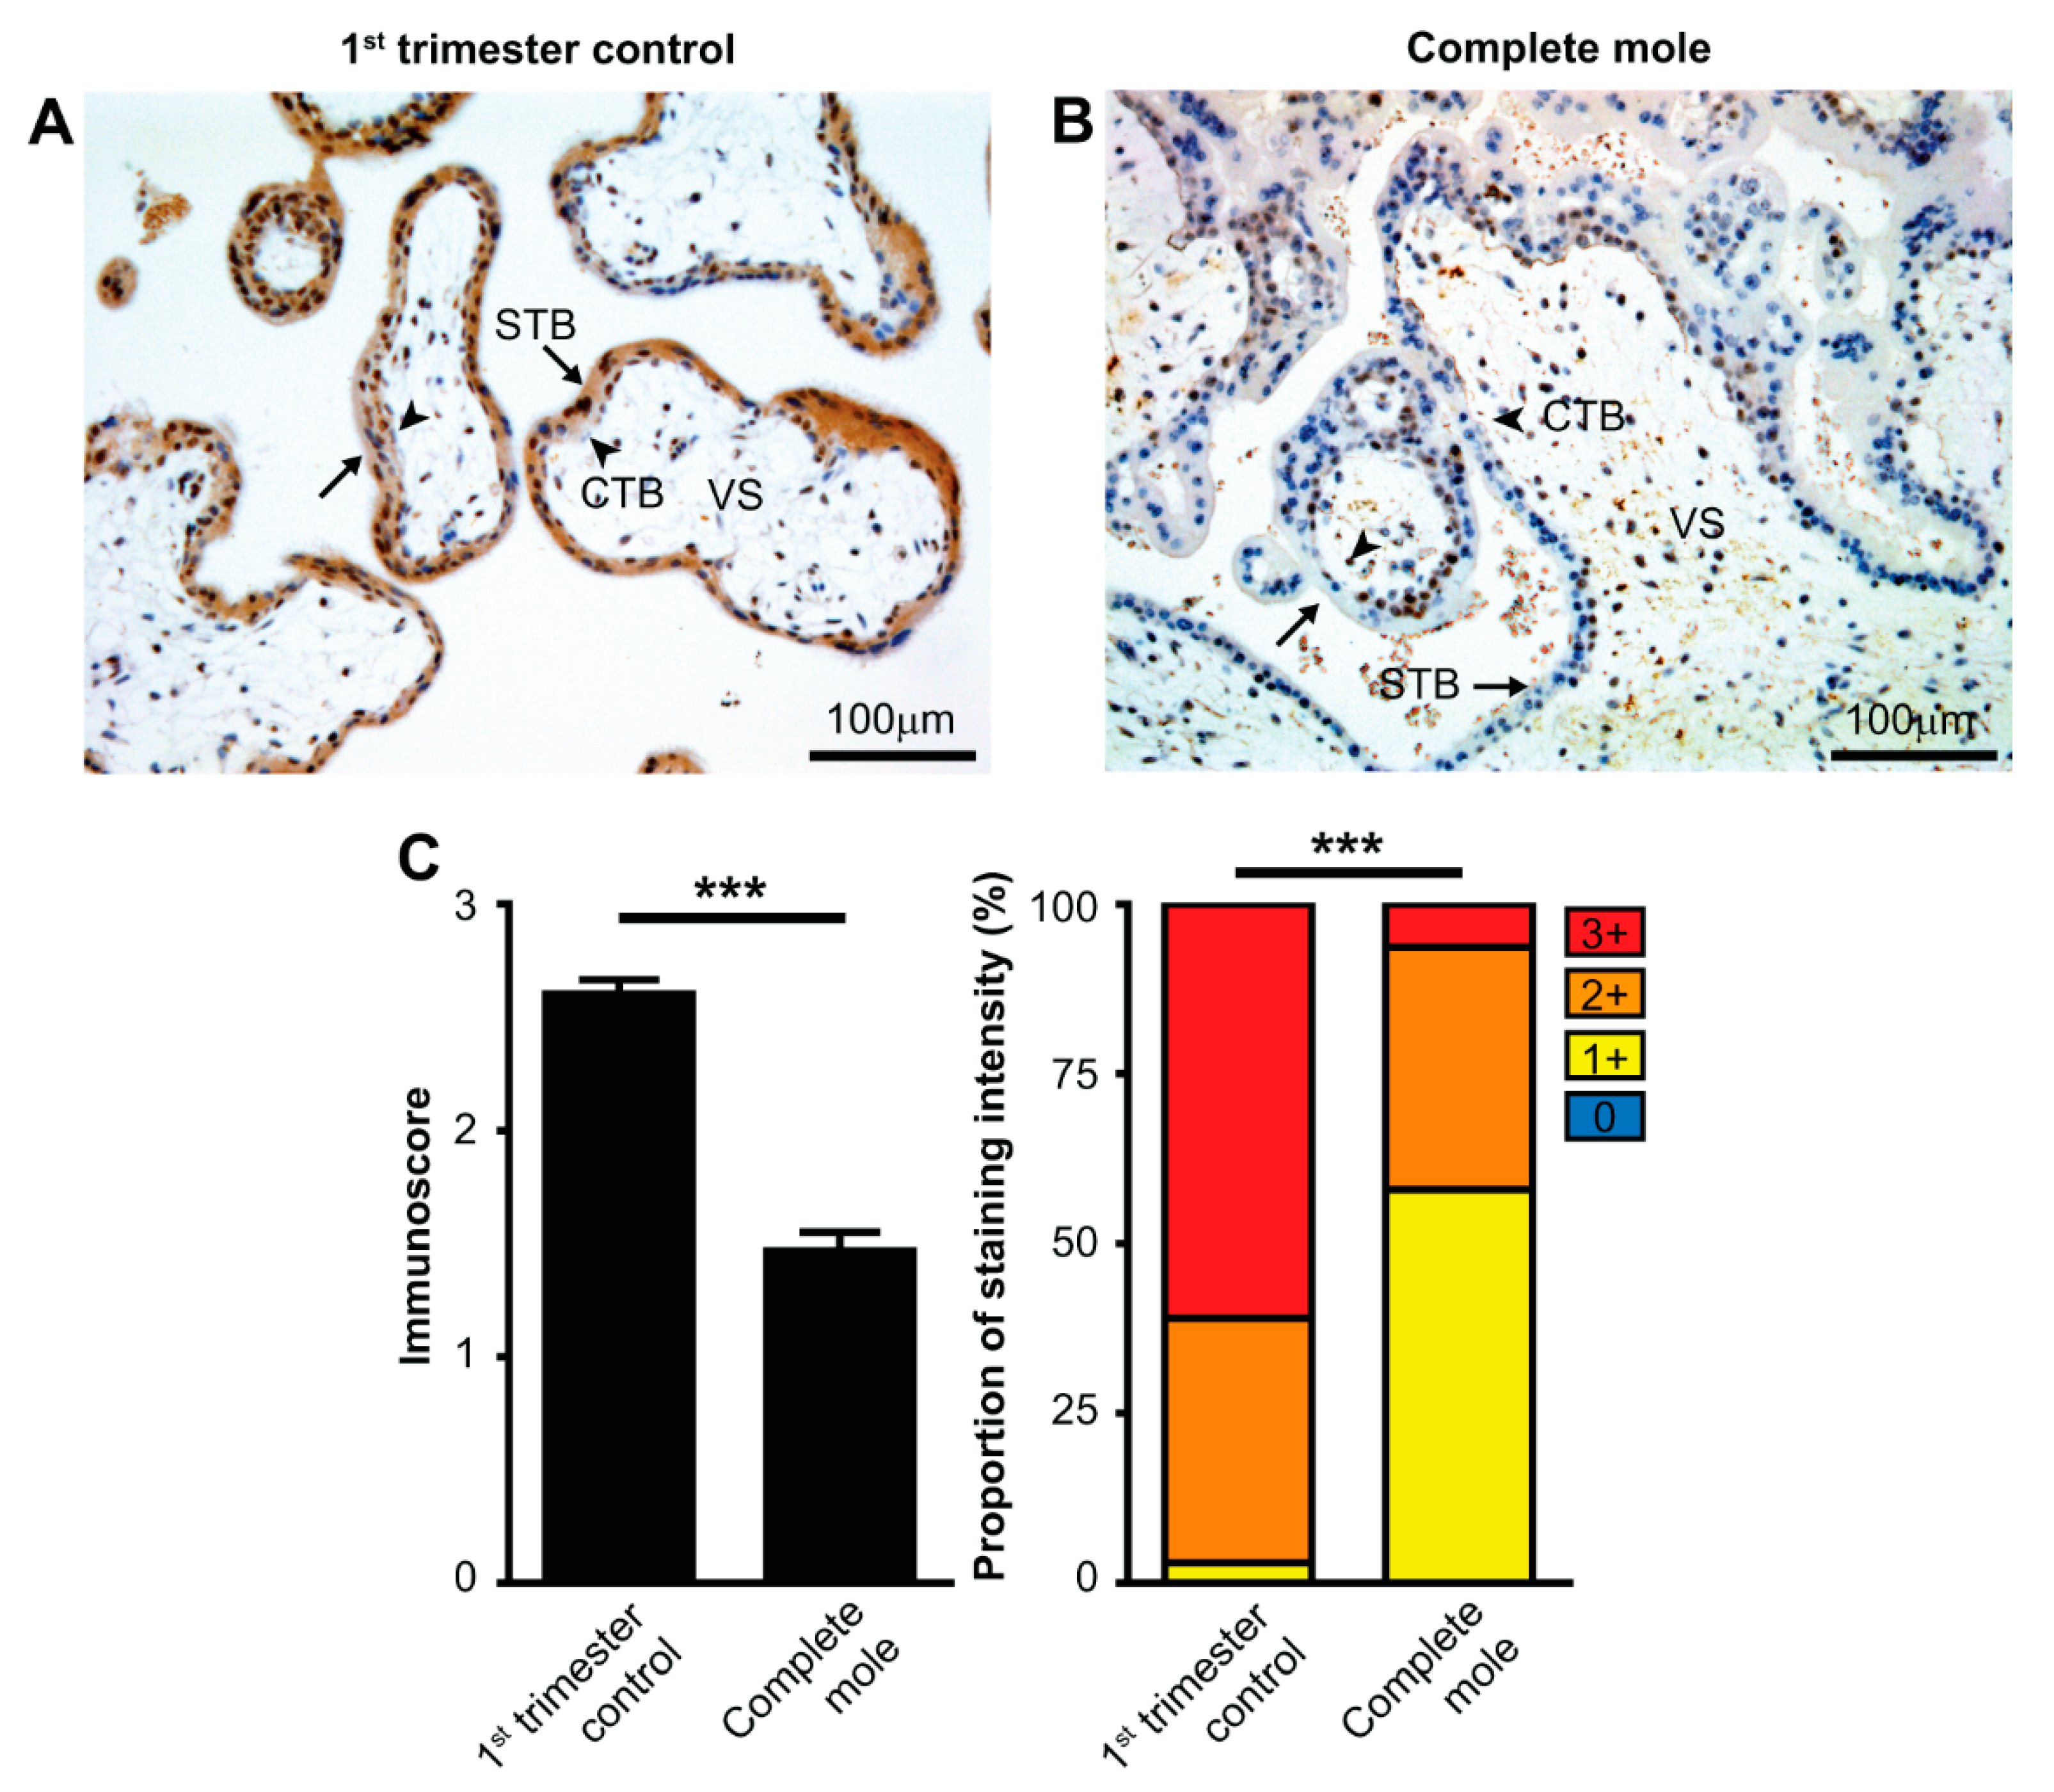
2. Results
2.1. The Transcriptome of First Trimester Placentas and CHMs
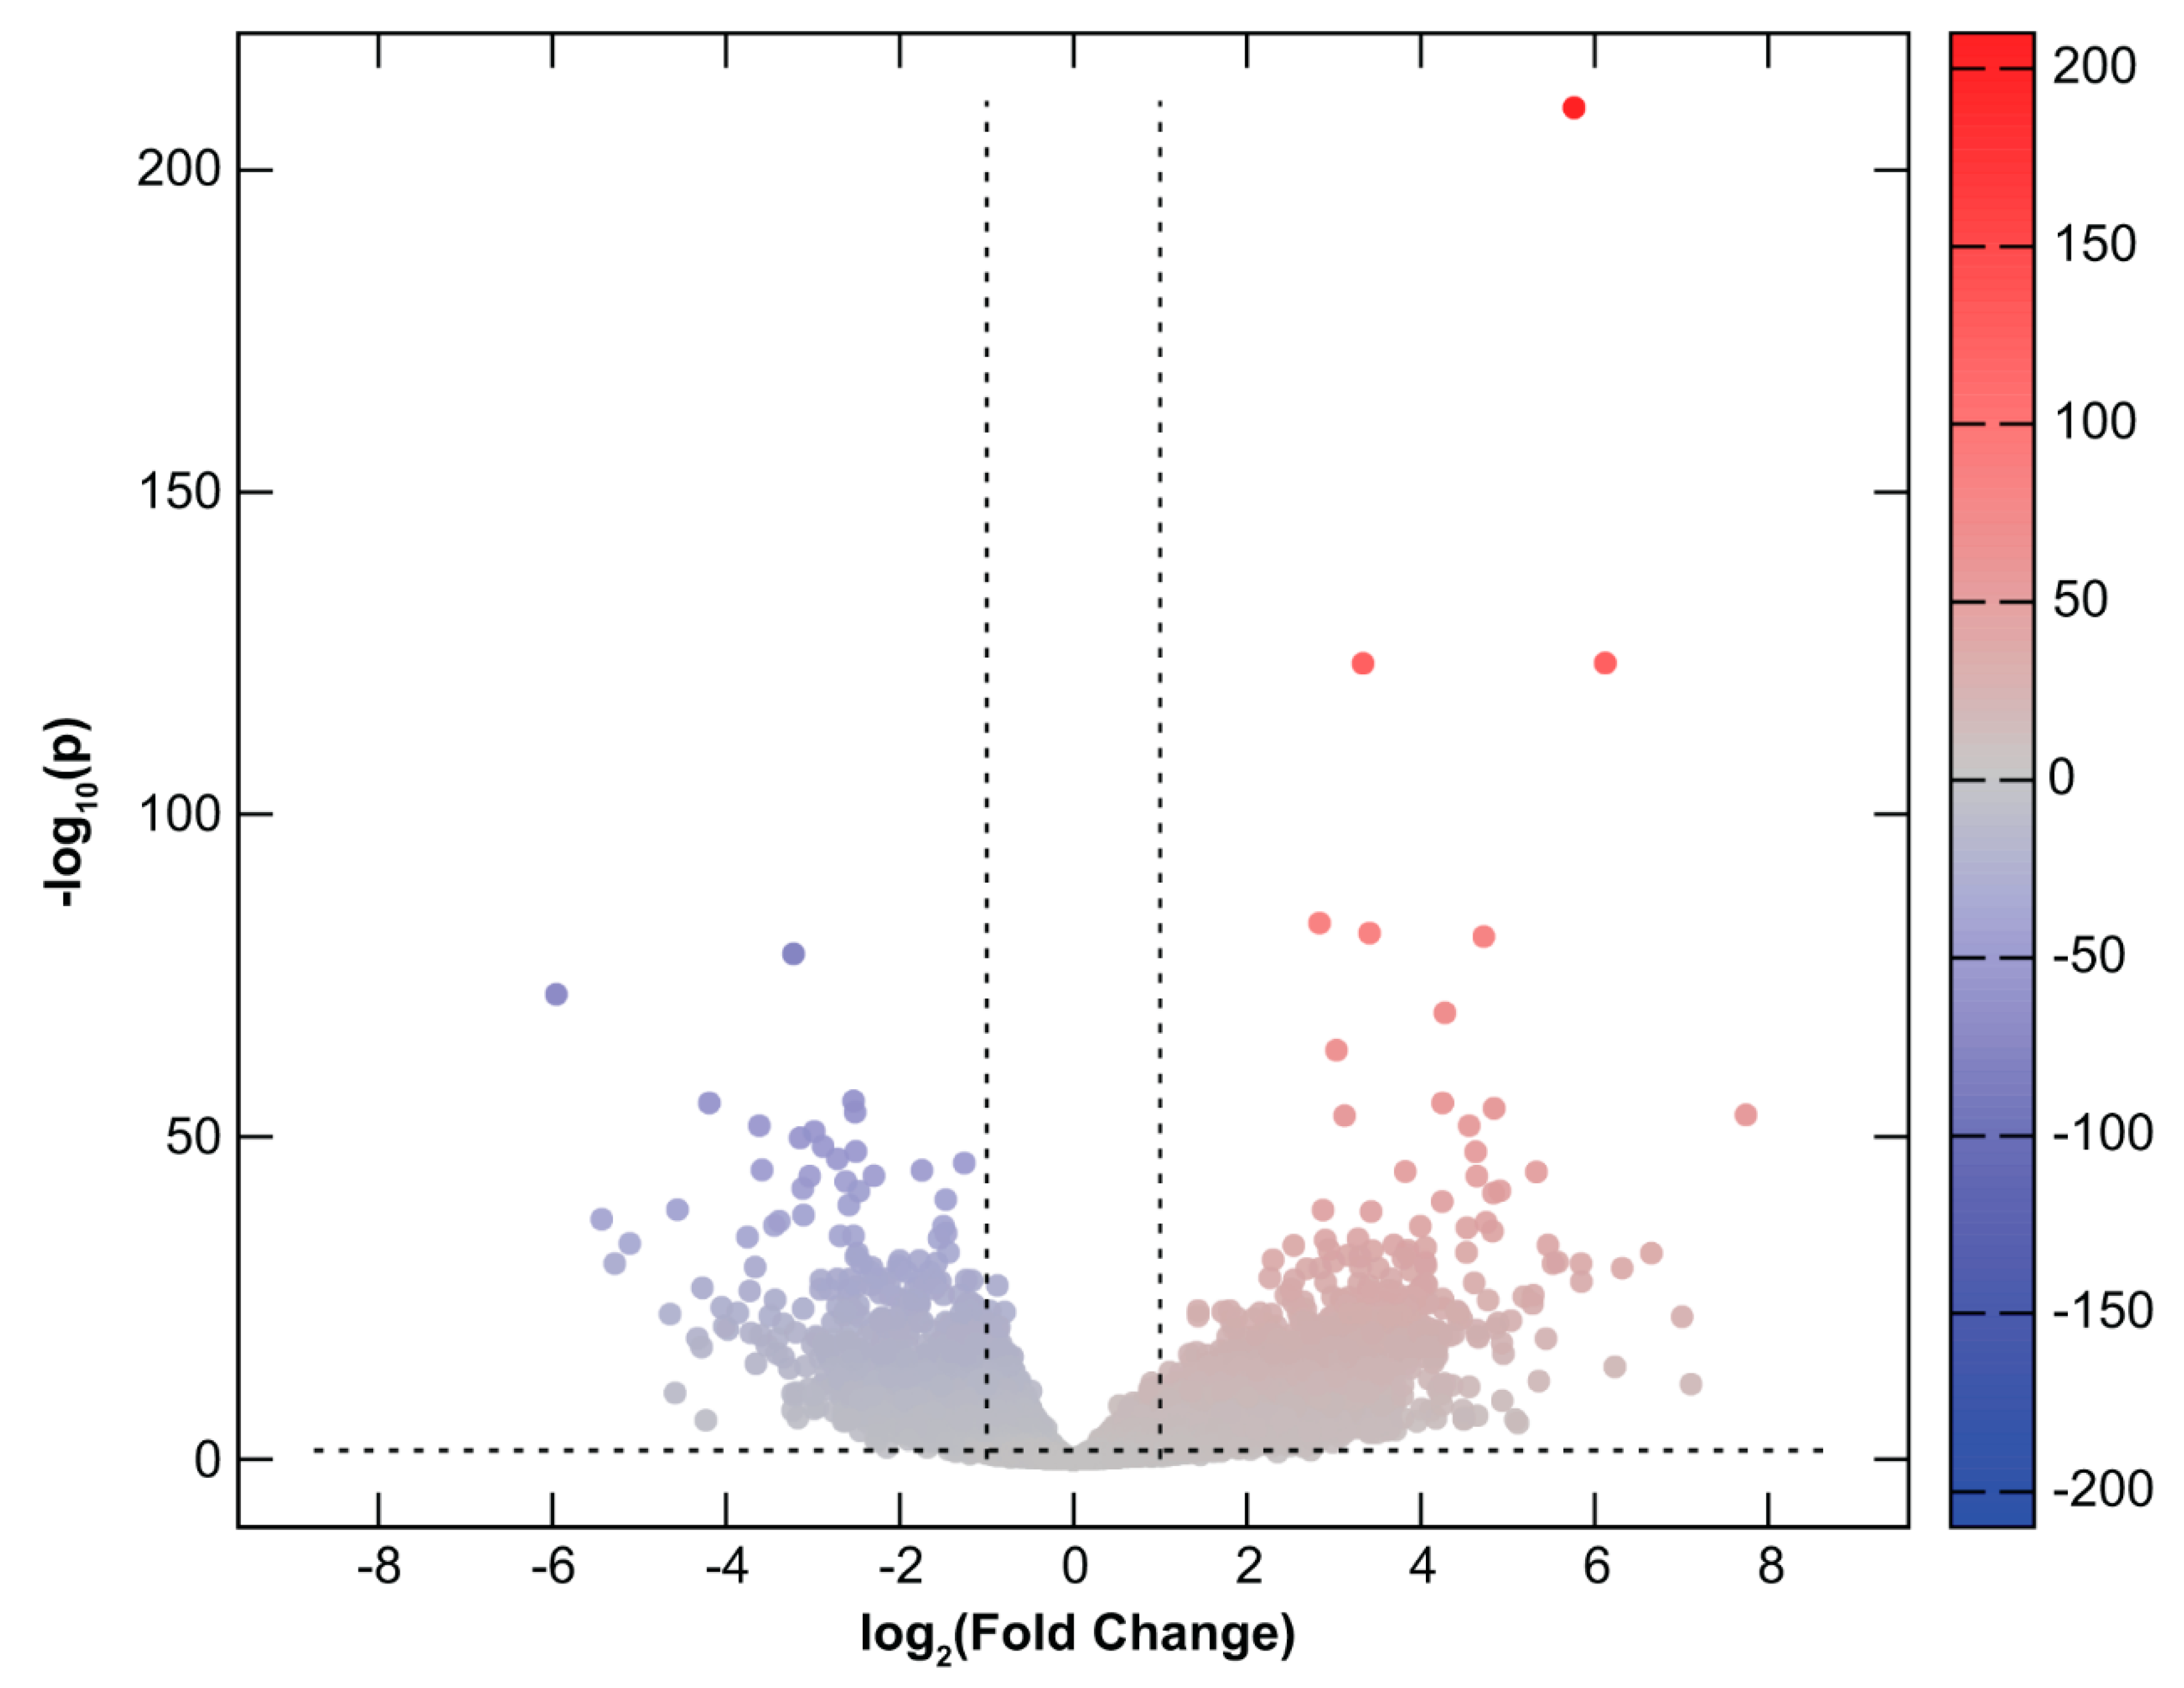
2.2. Differential Gene Expression in CHMs
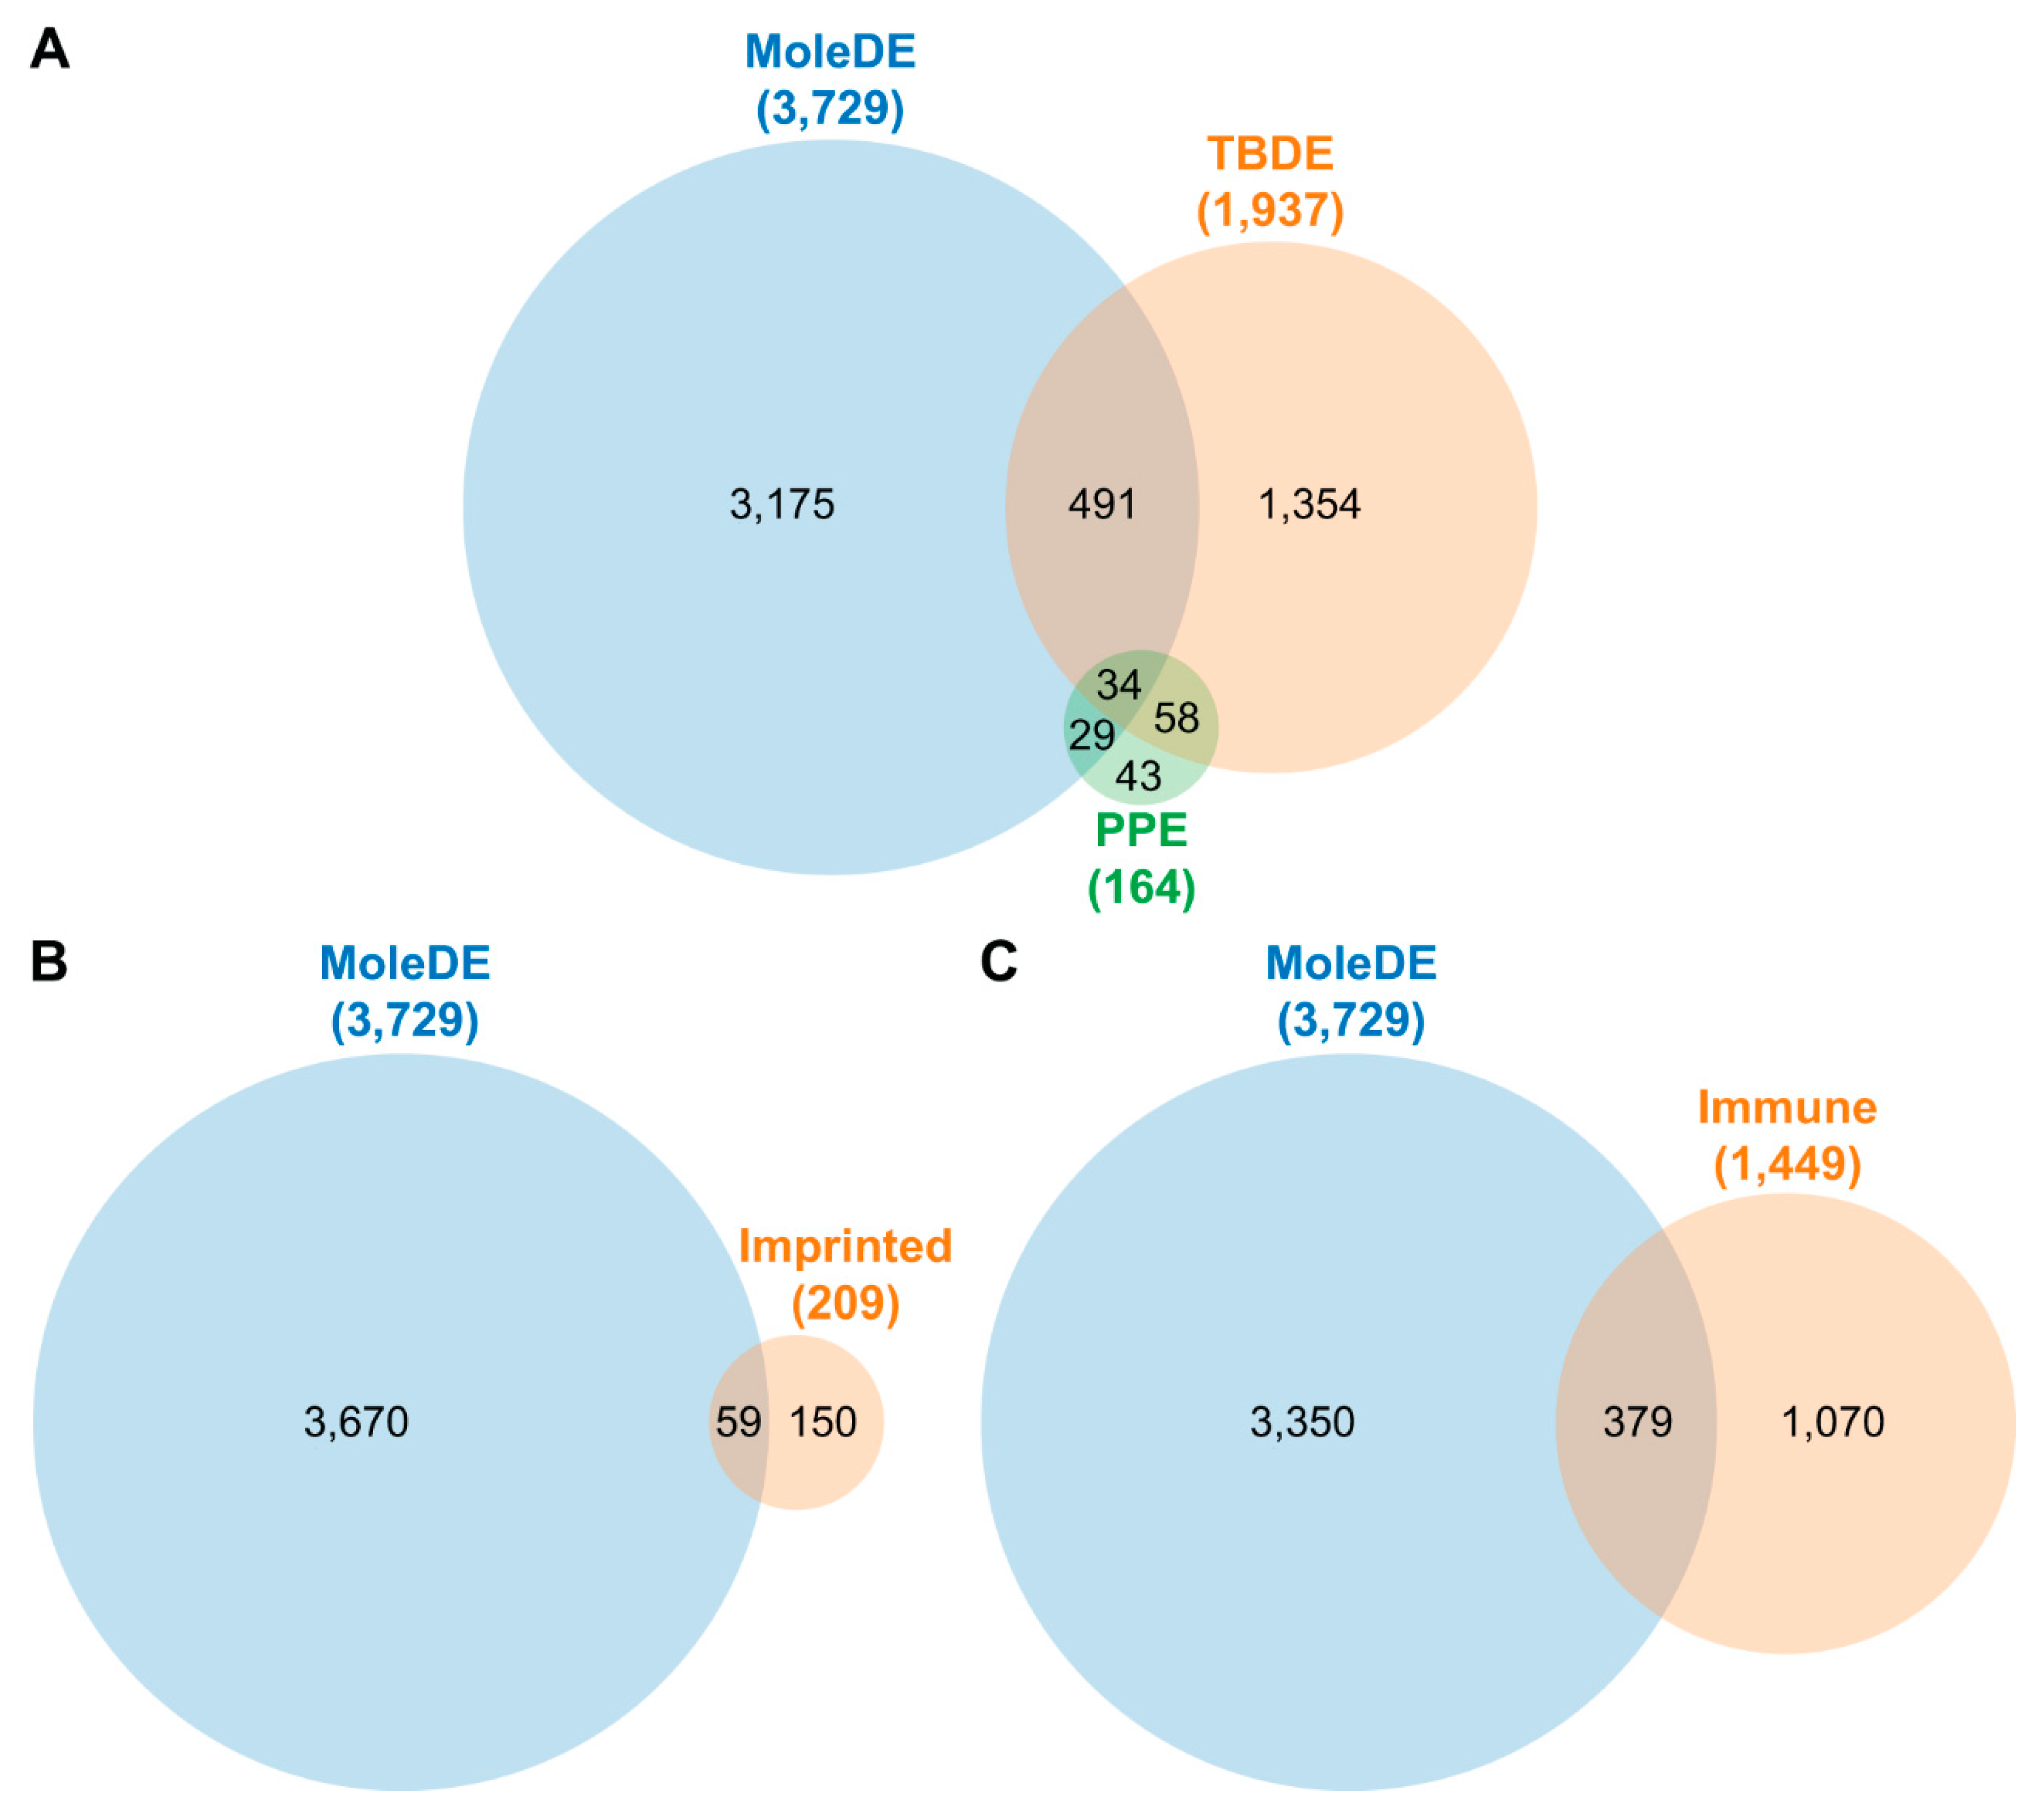
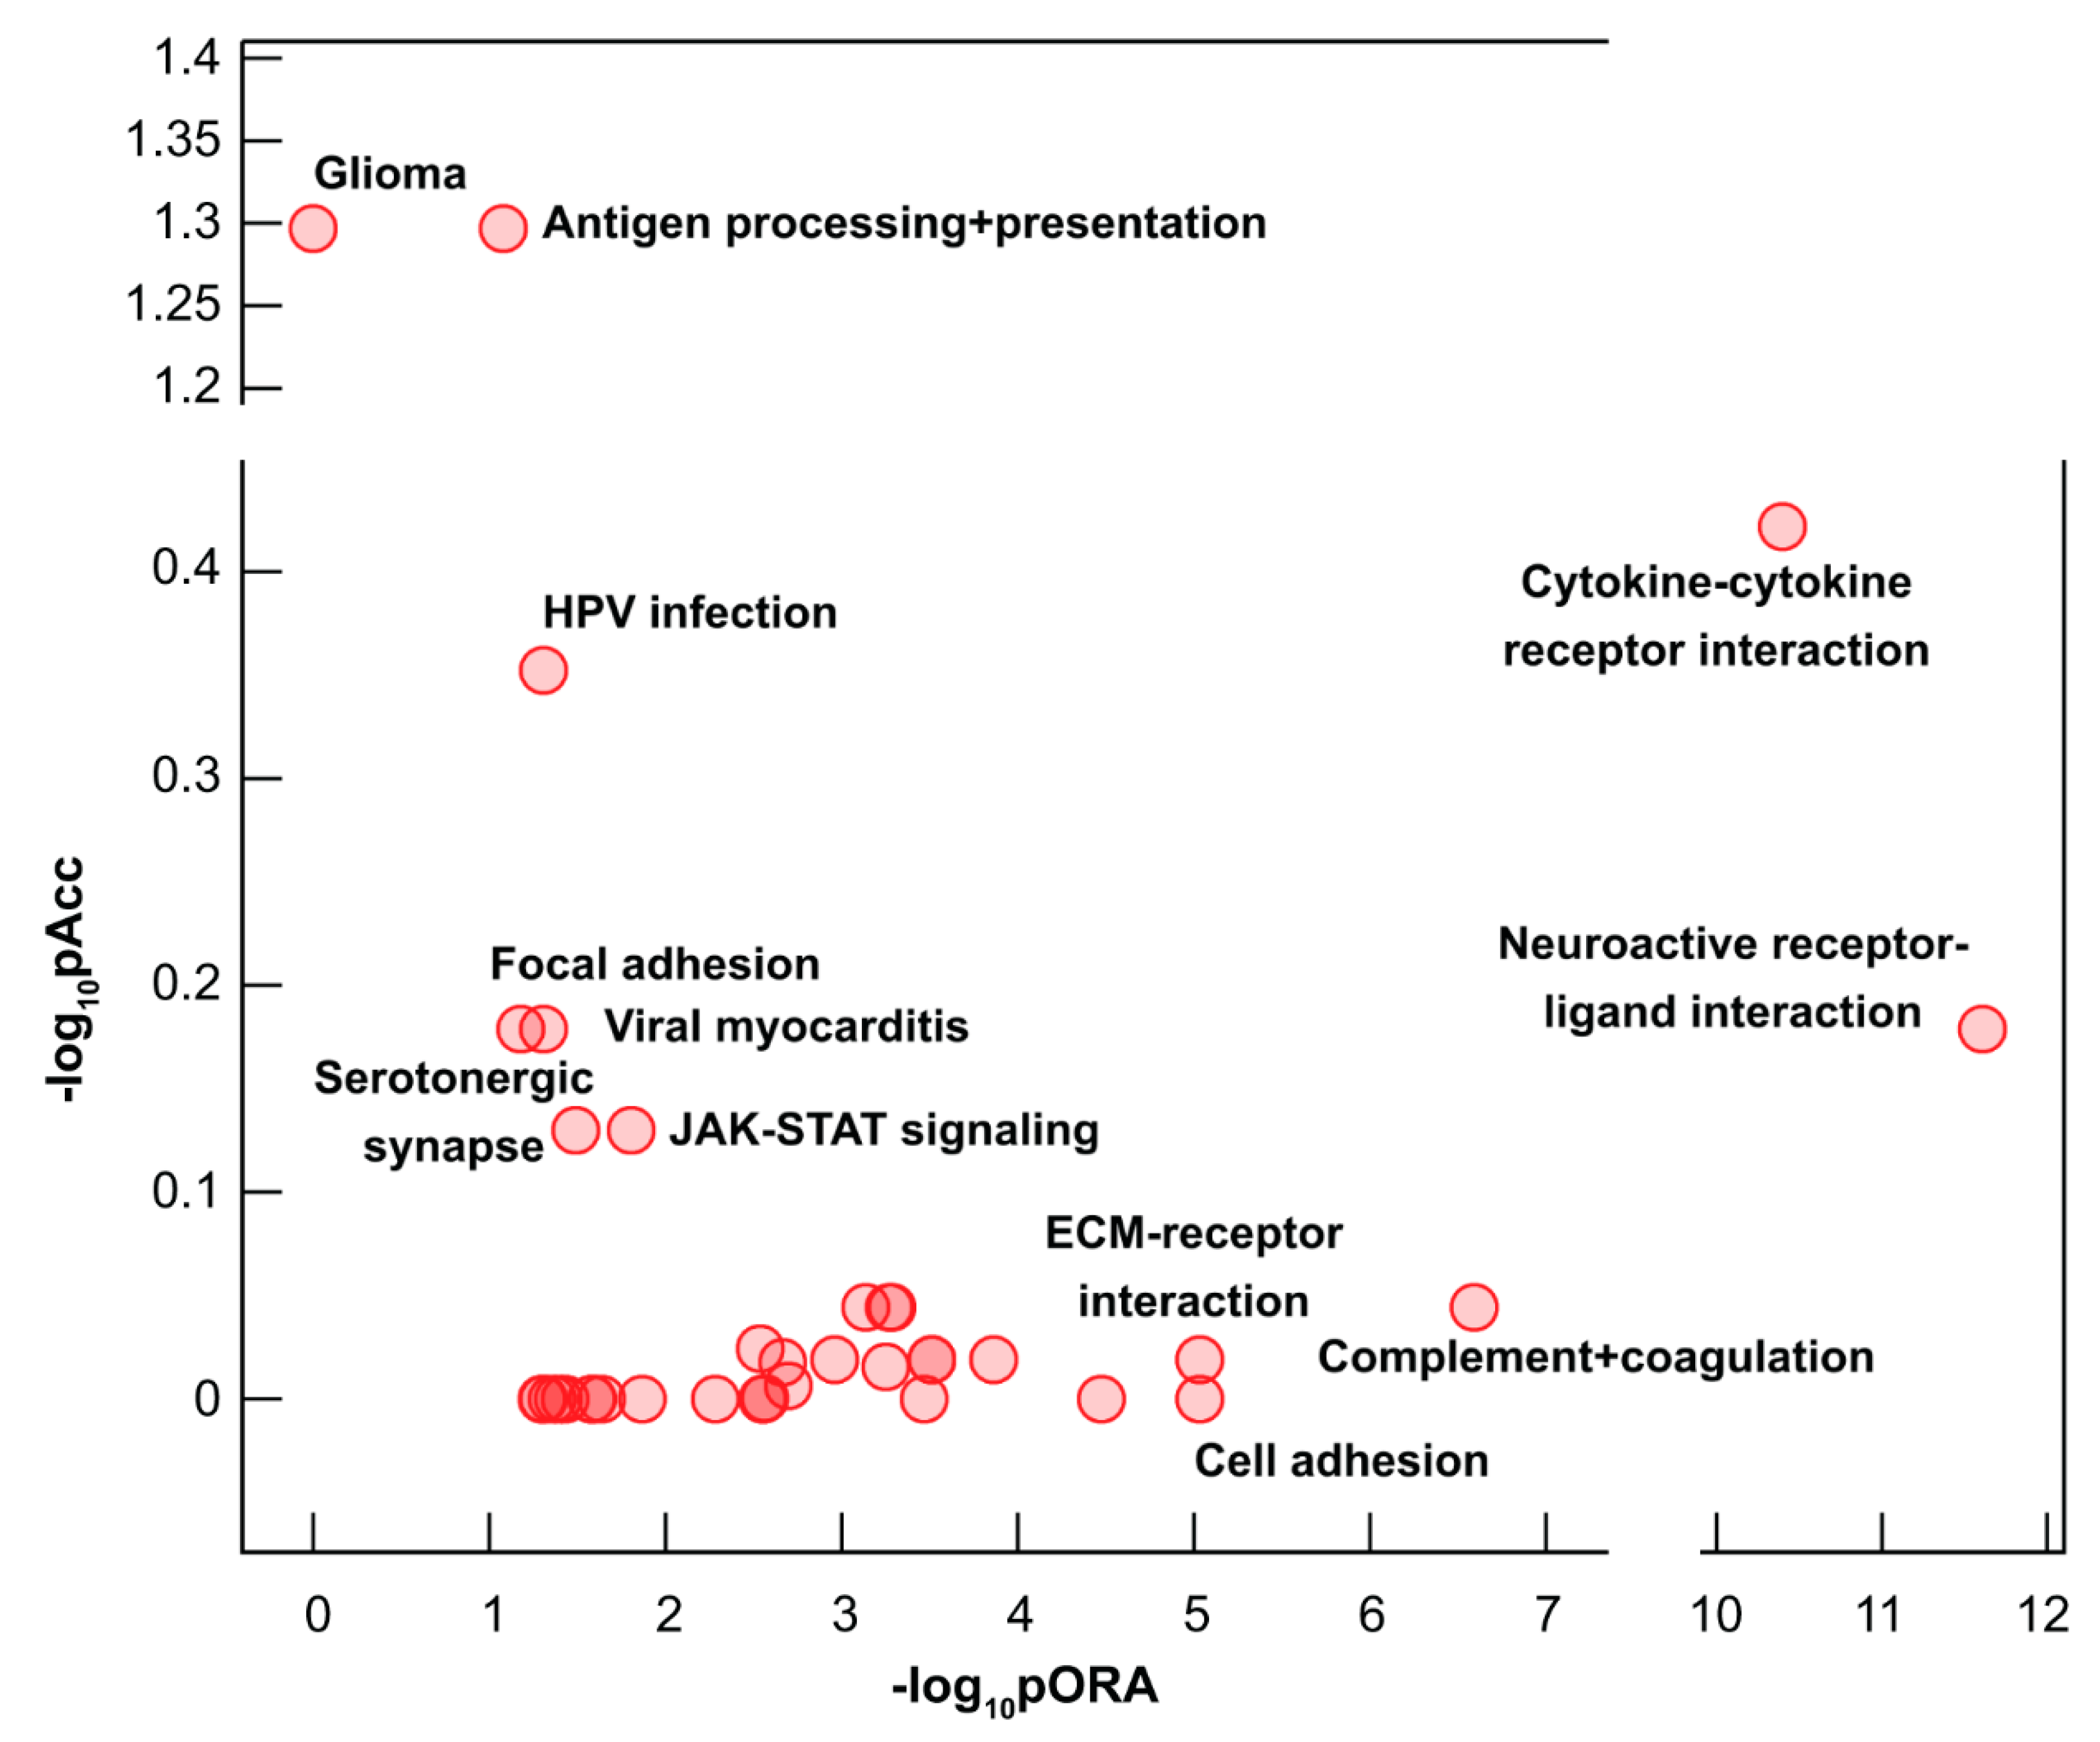
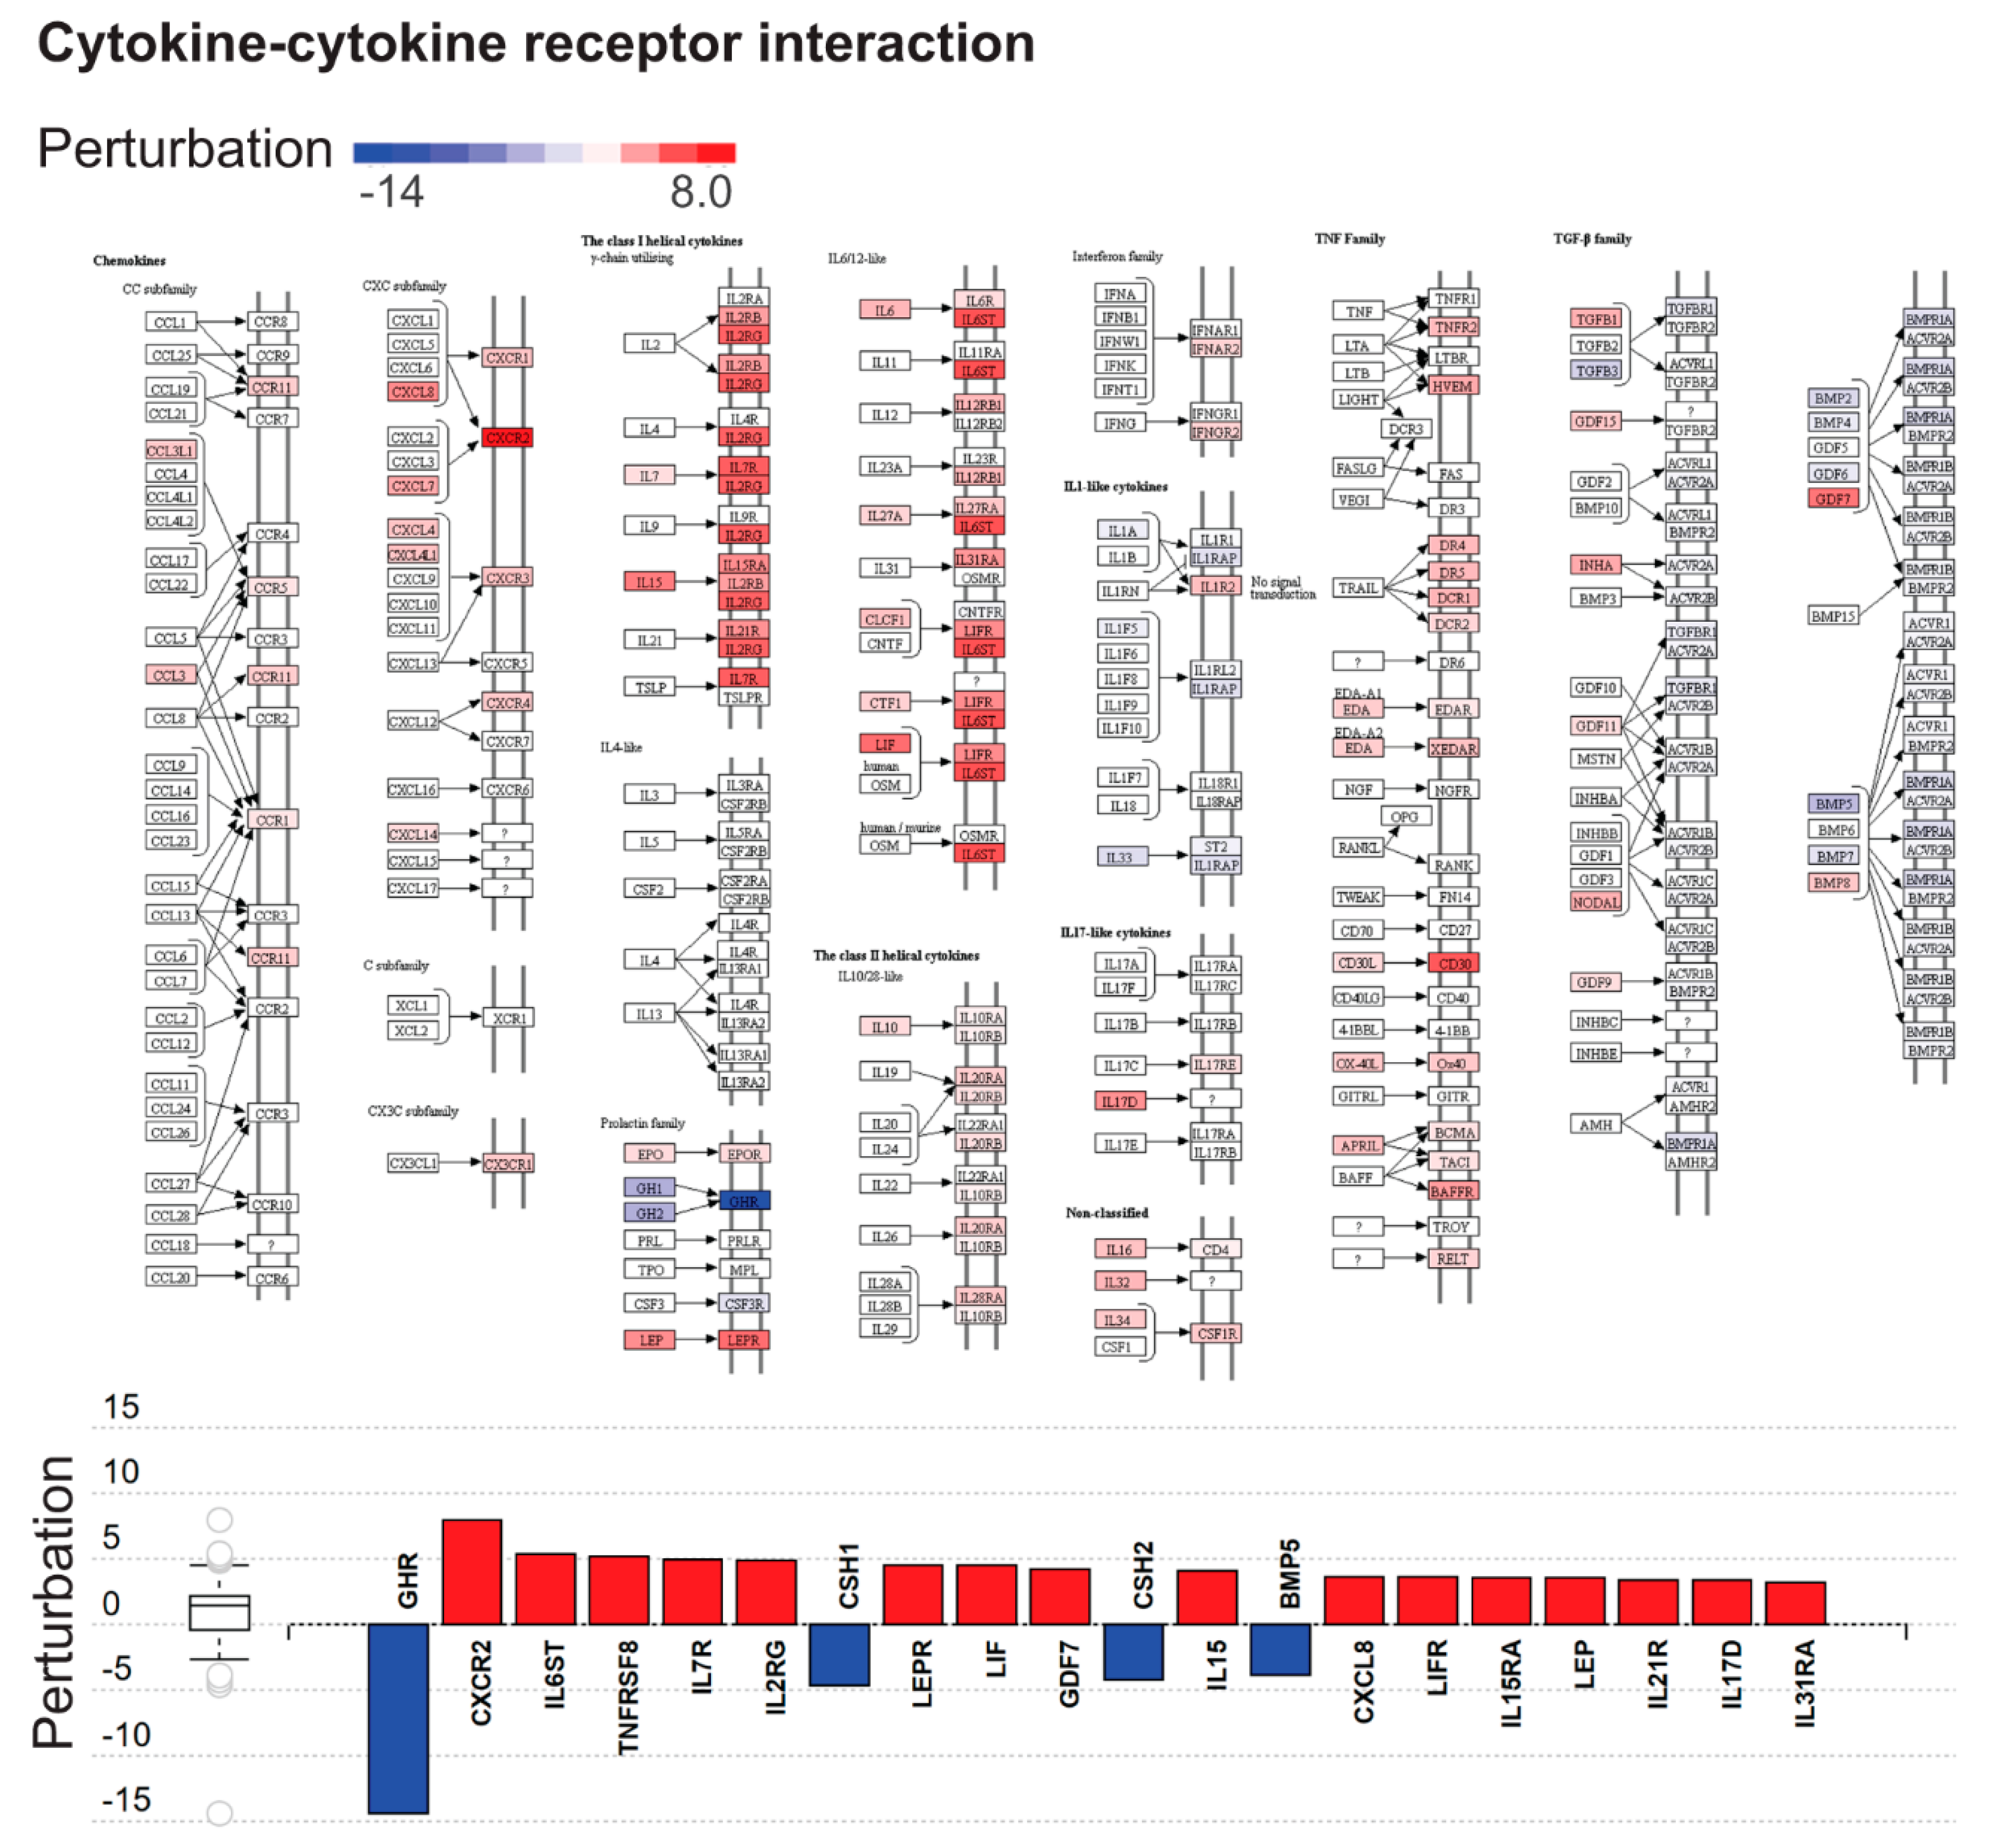
2.3. Dysregulated Biological Processes and Pathways in CHMs
2.4. Validation of RNA-Seq Results at the Protein Level
3. Discussion
3.1. Principal Findings of This Study
3.2. Placental Gene Expression and Functions are Down-Regulated in CHMs
3.3. Possible Causes of the Dysregulation of Placental Gene Expression in CHMs
3.4. Immune Functions are Widely Dysregulated in CHMs
3.5. Strengths and Limitations of the Study
3.6. Concluding Remarks
4. Materials and Methods
4.1. Human Subjects, Clinical Samples, and Definitions
4.1.1. Subjects in the RNA-Seq Discovery Study
4.1.2. Subjects in the Tissue Microarray Validation Study
4.2. Experimental Procedures
4.2.1. Sample Collection and Preparation for RNA-Seq
4.2.2. RNA Sequencing
4.2.3. Histopathological Examinations
4.2.4. Tissue Microarray Construction
4.2.5. Immunohistochemistry and Immunoscoring
4.3. Data Analysis
4.3.1. Analysis of mRNA Expression (RNA-Seq Data)
4.3.2. Pathway Analysis
4.3.3. Enrichment Analyses
4.3.4. Analysis of TMA Data
4.3.5. Data Availability
Supplementary Materials
Author Contributions
Funding
Acknowledgments
Conflicts of Interest
Abbreviations
| CHM | complete hydatidiform mole |
| ECM | extracellular matrix |
| FFPE | formalin-fixed paraffin-embedded |
| gal-14 | galectin-14 |
| GO | Gene Ontology |
| GTD | gestational trophoblastic disease |
| GTN | gestational trophoblastic neoplasia |
| hCG | human chorionic gonadotropin |
| IL | interleukin |
| KEGG | Kyoto Encyclopedia of Genes and Genomes |
| p57 | cyclin-dependent kinase inhibitor p57 |
| pFDR | false discovery rate |
| TMA | tissue microarray |
References
- Lurain, J.R. Gestational trophoblastic disease I: Epidemiology, pathology, clinical presentation and diagnosis of gestational trophoblastic disease, and management of hydatidiform mole. Am. J. Obstet. Gynecol. 2010, 203, 531–539. [Google Scholar] [CrossRef]
- Garcia-Sayre, J.; Castaneda, A.V.; Roman, L.D.; Matsuo, K. Diagnosis and Management of Gestational Trophoblastic Disease. In Handbook of Gynecology; Shoupe, D., Ed.; Springer: New York, NY, USA, 2017; pp. 1–15. [Google Scholar]
- Lurain, J.R. Gestational trophoblastic disease II: Classification and management of gestational trophoblastic neoplasia. Am. J. Obstet. Gynecol. 2011, 204, 11–18. [Google Scholar] [CrossRef] [PubMed]
- Seckl, M.J.; Sebire, N.J.; Berkowitz, R.S. Gestational trophoblastic disease. Lancet 2010, 376, 717–729. [Google Scholar] [CrossRef]
- Atrash, H.K.; Hogue, C.J.; Grimes, D.A. Epidemiology of hydatidiform mole during early gestation. Am. J. Obstet. Gynecol. 1986, 154, 906–909. [Google Scholar] [CrossRef]
- Takeuchi, S. Incidence of gestational trophoblastic disease by regional registration in Japan. Hum. Reprod. 1987, 2, 729–734. [Google Scholar] [CrossRef] [PubMed]
- Smith, H.O.; Hilgers, R.D.; Bedrick, E.J.; Qualls, C.R.; Wiggins, C.L.; Rayburn, W.F.; Waxman, A.G.; Stephens, N.D.; Cole, L.W.; Swanson, M.; et al. Ethnic differences at risk for gestational trophoblastic disease in New Mexico: A 25-year population-based study. Am. J. Obstet. Gynecol. 2003, 188, 357–366. [Google Scholar] [CrossRef] [PubMed]
- Smith, H.O.; Qualls, C.R.; Hilgers, R.D.; Verschraegen, C.F.; Rayburn, W.F.; Cole, L.W.; Padilla, L.A.; Key, C.R. Gestational trophoblastic neoplasia in American Indians. J. Reprod. Med. 2004, 49, 535–544. [Google Scholar]
- Maesta, I.; Berkowitz, R.S.; Goldstein, D.P.; Bernstein, M.R.; Ramirez, L.A.; Horowitz, N.S. Relationship between race and clinical characteristics, extent of disease, and response to chemotherapy in patients with low-risk gestational trophoblastic neoplasia. Gynecol. Oncol. 2015, 138, 50–54. [Google Scholar] [CrossRef]
- Gockley, A.A.; Joseph, N.T.; Melamed, A.; Sun, S.Y.; Goodwin, B.; Bernstein, M.; Goldstein, D.P.; Berkowitz, R.S.; Horowitz, N.S. Effect of race/ethnicity on clinical presentation and risk of gestational trophoblastic neoplasia in patients with complete and partial molar pregnancy at a tertiary care referral center. Am. J. Obstet. Gynecol. 2016, 215, 334.e1–334.e6. [Google Scholar] [CrossRef]
- Sand, P.K.; Lurain, J.R.; Brewer, J.I. Repeat gestational trophoblastic disease. Obstet. Gynecol. 1984, 63, 140–144. [Google Scholar]
- Hui, P.; Buza, N.; Murphy, K.M.; Ronnett, B.M. Hydatidiform Moles: Genetic Basis and Precision Diagnosis. Annu. Rev. Pathol. 2017, 12, 449–485. [Google Scholar] [CrossRef] [PubMed]
- Nguyen, N.M.P.; Ge, Z.J.; Reddy, R.; Fahiminiya, S.; Sauthier, P.; Bagga, R.; Sahin, F.I.; Mahadevan, S.; Osmond, M.; Breguet, M.; et al. Causative Mutations and Mechanism of Androgenetic Hydatidiform Moles. Am. J. Hum. Genet. 2018, 103, 740–751. [Google Scholar] [CrossRef] [PubMed] [Green Version]
- Nguyen, N.M.; Slim, R. Genetics and Epigenetics of Recurrent Hydatidiform Moles: Basic Science and Genetic Counselling. Curr. Obstet. Gynecol. Rep. 2014, 3, 55–64. [Google Scholar] [CrossRef] [PubMed] [Green Version]
- Sanchez-Delgado, M.; Martin-Trujillo, A.; Tayama, C.; Vidal, E.; Esteller, M.; Iglesias-Platas, I.; Deo, N.; Barney, O.; Maclean, K.; Hata, K.; et al. Absence of Maternal Methylation in Biparental Hydatidiform Moles from Women with NLRP7 Maternal-Effect Mutations Reveals Widespread Placenta-Specific Imprinting. PLoS Genet. 2015, 11, e1005644. [Google Scholar] [CrossRef] [PubMed]
- Desterke, C.; Slim, R.; Candelier, J.J. A bioinformatics transcriptome meta-analysis highlights the importance of trophoblast differentiation in the pathology of hydatidiform moles. Placenta 2018, 65, 29–36. [Google Scholar] [CrossRef] [PubMed]
- Than, N.G.; Romero, R.; Tarca, A.L.; Kekesi, K.A.; Xu, Y.; Xu, Z.; Juhasz, K.; Bhatti, G.; Leavitt, R.J.; Gelencser, Z.; et al. Integrated Systems Biology Approach Identifies Novel Maternal and Placental Pathways of Preeclampsia. Front. Immunol. 2018, 9, 1661. [Google Scholar] [CrossRef] [PubMed]
- Karaszi, K.; Szabo, S.; Juhasz, K.; Kiraly, P.; Kocsis-Deak, B.; Hargitai, B.; Krenacs, T.; Hupuczi, P.; Erez, O.; Papp, Z.; et al. Increased placental expression of Placental Protein 5 (PP5) / Tissue Factor Pathway Inhibitor-2 (TFPI-2) in women with preeclampsia and HELLP syndrome: Relevance to impaired trophoblast invasion? Placenta 2019, 76, 30–39. [Google Scholar] [CrossRef] [PubMed]
- Szilagyi, A.; Romero, R.; Xu, Y.; Kiraly, P.; Palhalmi, J.; Gyorffy, B.A.; Juhasz, K.; Hupuczi, P.; Kekesi, K.A.; Meinhardt, G.; et al. Placenta-specific genes and their regulation during villous trophoblast differentiation. 2019; Submitted. [Google Scholar]
- Jia, D.; Jurkowska, R.Z.; Zhang, X.; Jeltsch, A.; Cheng, X. Structure of Dnmt3a bound to Dnmt3L suggests a model for de novo DNA methylation. Nature 2007, 449, 248–251. [Google Scholar] [CrossRef] [Green Version]
- Gu, T.P.; Guo, F.; Yang, H.; Wu, H.P.; Xu, G.F.; Liu, W.; Xie, Z.G.; Shi, L.; He, X.; Jin, S.G.; et al. The role of Tet3 DNA dioxygenase in epigenetic reprogramming by oocytes. Nature 2011, 477, 606–610. [Google Scholar] [CrossRef]
- Nottke, A.; Colaiacovo, M.P.; Shi, Y. Developmental roles of the histone lysine demethylases. Development 2009, 136, 879–889. [Google Scholar] [CrossRef] [PubMed] [Green Version]
- Gonzalez, T.L.; Sun, T.; Koeppel, A.F.; Lee, B.; Wang, E.T.; Farber, C.R.; Rich, S.S.; Sundheimer, L.W.; Buttle, R.A.; Chen, Y.I.; et al. Sex differences in the late first trimester human placenta transcriptome. Biol. Sex Differ. 2018, 9, 4. [Google Scholar] [CrossRef] [PubMed]
- Nishi, H.; Yahata, N.; Ohyashiki, K.; Isaka, K.; Shiraishi, K.; Ohyashiki, J.H.; Toyama, K.; Takayama, M. Comparison of telomerase activity in normal chorionic villi to trophoblastic diseases. Int. J. Oncol. 1998, 12, 81–85. [Google Scholar] [CrossRef] [PubMed]
- Nishi, H.; Ohyashiki, K.; Fujito, A.; Yahata, N.; Ohyashiki, J.H.; Isaka, K.; Takayama, M. Expression of telomerase subunits and localization of telomerase activation in hydatidiform mole. Placenta 1999, 20, 317–323. [Google Scholar] [CrossRef]
- Sebire, N.J.; Lindsay, I. Current issues in the histopathology of gestational trophoblastic tumors. Fetal Pediatr. Pathol. 2010, 29, 30–44. [Google Scholar] [CrossRef] [PubMed]
- Knofler, M.; Pollheimer, J. Human placental trophoblast invasion and differentiation: A particular focus on Wnt signaling. Front. Genet. 2013, 4, 190. [Google Scholar] [CrossRef] [PubMed]
- Buza, N.; Hui, P. Immunohistochemistry and other ancillary techniques in the diagnosis of gestational trophoblastic diseases. Semin. Diagn. Pathol. 2014, 31, 223–232. [Google Scholar] [CrossRef]
- Petts, G.; Fisher, R.A.; Short, D.; Lindsay, I.; Seckl, M.J.; Sebire, N.J. Histopathological and immunohistochemical features of early hydatidiform mole in relation to subsequent development of persistent gestational trophoblastic disease. J. Reprod. Med. 2014, 59, 213–220. [Google Scholar]
- Fock, V.; Plessl, K.; Fuchs, R.; Dekan, S.; Milla, S.K.; Haider, S.; Fiala, C.; Knofler, M.; Pollheimer, J. Trophoblast subtype-specific EGFR/ERBB4 expression correlates with cell cycle progression and hyperplasia in complete hydatidiform moles. Hum. Reprod. 2015, 30, 789–799. [Google Scholar] [CrossRef]
- Velicky, P.; Meinhardt, G.; Plessl, K.; Vondra, S.; Weiss, T.; Haslinger, P.; Lendl, T.; Aumayr, K.; Mairhofer, M.; Zhu, X.; et al. Genome amplification and cellular senescence are hallmarks of human placenta development. PLoS Genet. 2018, 14, e1007698. [Google Scholar] [CrossRef]
- Lim, D.H.; Maher, E.R. Human imprinting syndromes. Epigenomics 2009, 1, 347–369. [Google Scholar] [CrossRef] [PubMed]
- Ferguson-Smith, A.C. Genomic imprinting: The emergence of an epigenetic paradigm. Nat. Rev. Genet. 2011, 12, 565–575. [Google Scholar] [CrossRef] [PubMed]
- Tomizawa, S.; Sasaki, H. Genomic imprinting and its relevance to congenital disease, infertility, molar pregnancy and induced pluripotent stem cell. J. Hum. Genet. 2012, 57, 84–91. [Google Scholar] [CrossRef] [PubMed] [Green Version]
- Fan, J.B.; Surti, U.; Taillon-Miller, P.; Hsie, L.; Kennedy, G.C.; Hoffner, L.; Ryder, T.; Mutch, D.G.; Kwok, P.Y. Paternal origins of complete hydatidiform moles proven by whole genome single-nucleotide polymorphism haplotyping. Genomics 2002, 79, 58–62. [Google Scholar] [CrossRef] [PubMed]
- Hauzman, E.E.; Papp, Z. Conception without the development of a human being. J. Perinat. Med. 2008, 36, 175–177. [Google Scholar] [CrossRef]
- Carey, L.; Nash, B.M.; Wright, D.C. Molecular genetic studies of complete hydatidiform moles. Transl. Pediatr. 2015, 4, 181–188. [Google Scholar] [PubMed]
- Gu, H.; Gao, J.; Guo, W.; Zhou, Y.; Kong, Q. The expression of DNA methyltransferases3A is specifically downregulated in chorionic villi of early embryo growth arrest cases. Mol. Med. Rep. 2017, 16, 591–596. [Google Scholar] [CrossRef] [PubMed]
- Dimitrova, E.; Turberfield, A.H.; Klose, R.J. Histone demethylases in chromatin biology and beyond. EMBO Rep. 2015, 16, 1620–1639. [Google Scholar] [CrossRef]
- Slim, R.; Mehio, A. The genetics of hydatidiform moles: New lights on an ancient disease. Clin. Genet. 2007, 71, 25–34. [Google Scholar] [CrossRef]
- Messaed, C.; Akoury, E.; Djuric, U.; Zeng, J.; Saleh, M.; Gilbert, L.; Seoud, M.; Qureshi, S.; Slim, R. NLRP7, a nucleotide oligomerization domain-like receptor protein, is required for normal cytokine secretion and co-localizes with Golgi and the microtubule-organizing center. J. Biol. Chem. 2011, 286, 43313–43323. [Google Scholar] [CrossRef]
- Kalogiannidis, I.; Kalinderi, K.; Kalinderis, M.; Miliaras, D.; Tarlatzis, B.; Athanasiadis, A. Recurrent complete hydatidiform mole: Where we are, is there a safe gestational horizon? Opinion and mini-review. J. Assist. Reprod. Genet. 2018, 35, 967–973. [Google Scholar] [CrossRef] [PubMed]
- Mor, G.; Cardenas, I.; Abrahams, V.; Guller, S. Inflammation and pregnancy: The role of the immune system at the implantation site. Ann. N. Y. Acad. Sci. 2011, 1221, 80–87. [Google Scholar] [CrossRef] [PubMed]
- Racicot, K.; Kwon, J.Y.; Aldo, P.; Silasi, M.; Mor, G. Understanding the complexity of the immune system during pregnancy. Am. J. Reprod. Immunol. 2014, 72, 107–116. [Google Scholar] [CrossRef] [PubMed]
- Aghaeepour, N.; Ganio, E.A.; McIlwain, D.; Tsai, A.S.; Tingle, M.; Van Gassen, S.; Gaudilliere, D.K.; Baca, Q.; McNeil, L.; Okada, R.; et al. An immune clock of human pregnancy. Sci. Immunol. 2017, 2. [Google Scholar] [CrossRef] [PubMed] [Green Version]
- Fulop, V.; Vermes, G.; Demeter, J. The relationship between inflammatory and immunological processes during pregnancy. Practical aspects. Orv. Hetil. 2019, 160, 1247–1259. [Google Scholar] [PubMed]
- Rusterholz, C.; Hahn, S.; Holzgreve, W. Role of placentally produced inflammatory and regulatory cytokines in pregnancy and the etiology of preeclampsia. Semin. Immunopathol. 2007, 29, 151–162. [Google Scholar] [CrossRef] [PubMed]
- Than, N.G.; Romero, R.; Erez, O.; Weckle, A.; Tarca, A.L.; Hotra, J.; Abbas, A.; Han, Y.M.; Kim, S.S.; Kusanovic, J.P.; et al. Emergence of hormonal and redox regulation of galectin-1 in placental mammals: Implication in maternal-fetal immune tolerance. Proc. Natl. Acad. Sci. USA 2008, 105, 15819–15824. [Google Scholar] [CrossRef] [PubMed]
- Than, N.G.; Romero, R.; Goodman, M.; Weckle, A.; Xing, J.; Dong, Z.; Xu, Y.; Tarquini, F.; Szilagyi, A.; Gal, P.; et al. A primate subfamily of galectins expressed at the maternal-fetal interface that promote immune cell death. Proc. Natl. Acad. Sci. USA 2009, 106, 9731–9736. [Google Scholar] [CrossRef] [PubMed]
- Hunt, J.S.; Pace, J.L.; Gill, R.M. Immunoregulatory molecules in human placentas: Potential for diverse roles in pregnancy. Int. J. Dev. Biol. 2010, 54, 457–467. [Google Scholar] [CrossRef]
- Than, N.G.; Balogh, A.; Romero, R.; Karpati, E.; Erez, O.; Szilagyi, A.; Kovalszky, I.; Sammar, M.; Gizurarson, S.; Matko, J.; et al. Placental protein 13 (PP13)—A placental immunoregulatory galectin protecting pregnancy. Front. Immunol. 2014, 5, 348. [Google Scholar] [CrossRef]
- Cheng, S.B.; Sharma, S. Interleukin-10: A pleiotropic regulator in pregnancy. Am. J. Reprod. Immunol. 2015, 73, 487–500. [Google Scholar] [CrossRef] [PubMed]
- Than, N.G.; Romero, R.; Balogh, A.; Karpati, E.; Mastrolia, S.A.; Staretz-Chacham, O.; Hahn, S.; Erez, O.; Papp, Z.; Kim, C.J. Galectins: Double-edged swords in the cross-roads of pregnancy complications and female reproductive tract inflammation and neoplasia. J. Pathol. Transl. Med. 2015, 49, 181–208. [Google Scholar] [CrossRef] [PubMed]
- Zhang, Y.H.; Tian, M.; Tang, M.X.; Liu, Z.Z.; Liao, A.H. Recent insight into the role of the PD-1/PD-L1 pathway in feto-maternal tolerance and pregnancy. Am. J. Reprod. Immunol. 2015, 74, 201–208. [Google Scholar] [CrossRef] [PubMed]
- Ferreira, L.M.R.; Meissner, T.B.; Tilburgs, T.; Strominger, J.L. HLA-G: At the interface of maternal-fetal tolerance. Trends Immunol. 2017, 38, 272–286. [Google Scholar] [CrossRef] [PubMed]
- Le Bouteiller, P.; Bensussan, A. Up-and-down immunity of pregnancy in humans. F1000Res 2017, 6, 1216. [Google Scholar] [CrossRef]
- Schumacher, A. Human chorionic gonadotropin as a pivotal endocrine immune regulator initiating and preserving fetal tolerance. Int. J. Mol. Sci. 2017, 18, 2166. [Google Scholar] [CrossRef]
- Robertson, S.A.; Care, A.S.; Moldenhauer, L.M. Regulatory T cells in embryo implantation and the immune response to pregnancy. J. Clin. Investig. 2018, 128, 4224–4235. [Google Scholar] [CrossRef] [Green Version]
- Takahashi, H.; Takizawa, T.; Matsubara, S.; Ohkuchi, A.; Kuwata, T.; Usui, R.; Matsumoto, H.; Sato, Y.; Fujiwara, H.; Okamoto, A.; et al. Extravillous trophoblast cell invasion is promoted by the CD44-hyaluronic acid interaction. Placenta 2014, 35, 163–170. [Google Scholar] [CrossRef]
- Mori, A.; Nishi, H.; Sasaki, T.; Nagamitsu, Y.; Kawaguchi, R.; Okamoto, A.; Kuroda, M.; Isaka, K. HLA-G expression is regulated by miR-365 in trophoblasts under hypoxic conditions. Placenta 2016, 45, 37–41. [Google Scholar] [CrossRef]
- Raghupathy, R.; Al-Mutawa, E.; Al-Azemi, M.; Makhseed, M.; Azizieh, F.; Szekeres-Bartho, J. Progesterone-induced blocking factor (PIBF) modulates cytokine production by lymphocytes from women with recurrent miscarriage or preterm delivery. J. Reprod. Immunol. 2009, 80, 91–99. [Google Scholar] [CrossRef]
- Prins, J.R.; Gomez-Lopez, N.; Robertson, S.A. Interleukin-6 in pregnancy and gestational disorders. J. Reprod. Immunol. 2012, 95, 1–14. [Google Scholar] [CrossRef] [PubMed]
- Whitten, A.E.; Romero, R.; Korzeniewski, S.J.; Tarca, A.L.; Schwartz, A.G.; Yeo, L.; Dong, Z.; Hassan, S.S.; Chaiworapongsa, T. Evidence of an imbalance of angiogenic/antiangiogenic factors in massive perivillous fibrin deposition (maternal floor infarction): A placental lesion associated with recurrent miscarriage and fetal death. Am. J. Obstet. Gynecol. 2013, 208, 310.e1–310.e11. [Google Scholar] [CrossRef] [PubMed]
- Shemesh, A.; Tirosh, D.; Sheiner, E.; Tirosh, N.B.; Brusilovsky, M.; Segev, R.; Rosental, B.; Porgador, A. First trimester pregnancy loss and the expression of alternatively spliced NKp30 isoforms in maternal blood and placental tissue. Front. Immunol. 2015, 6, 189. [Google Scholar] [CrossRef] [PubMed]
- Balogh, A.; Toth, E.; Romero, R.; Parej, K.; Csala, D.; Szenasi, N.L.; Hajdu, I.; Juhasz, K.; Kovacs, A.F.; Meiri, H.; et al. Placental Galectins Are Key Players in Regulating the Maternal Adaptive Immune Response. Front. Immunol. 2019, 10, 1240. [Google Scholar] [CrossRef] [PubMed]
- Romero, R.; Mazor, M.; Brandt, F.; Sepulveda, W.; Avila, C.; Cotton, D.B.; Dinarello, C.A. Interleukin-1 alpha and interleukin-1 beta in preterm and term human parturition. Am. J. Reprod. Immunol. 1992, 27, 117–123. [Google Scholar] [CrossRef] [PubMed]
- Romero, R.; Mazor, M.; Sepulveda, W.; Avila, C.; Copeland, D.; Williams, J. Tumor necrosis factor in preterm and term labor. Am. J. Obstet. Gynecol. 1992, 166, 1576–1587. [Google Scholar] [CrossRef]
- Cherouny, P.H.; Pankuch, G.A.; Romero, R.; Botti, J.J.; Kuhn, D.C.; Demers, L.M.; Appelbaum, P.C. Neutrophil attractant/activating peptide-1/interleukin-8: Association with histologic chorioamnionitis, preterm delivery, and bioactive amniotic fluid leukoattractants. Am. J. Obstet. Gynecol. 1993, 169, 1299–1303. [Google Scholar] [CrossRef]
- Gotsch, F.; Romero, R.; Kusanovic, J.P.; Erez, O.; Espinoza, J.; Kim, C.J.; Vaisbuch, E.; Than, N.G.; Mazaki-Tovi, S.; Chaiworapongsa, T.; et al. The anti-inflammatory limb of the immune response in preterm labor, intra-amniotic infection/inflammation, and spontaneous parturition at term: A role for interleukin-10. J. Matern. Fetal Neonatal Med. 2008, 21, 529–547. [Google Scholar] [CrossRef] [PubMed] [Green Version]
- Gomez-Lopez, N.; Laresgoiti-Servitje, E.; Olson, D.M.; Estrada-Gutierrez, G.; Vadillo-Ortega, F. The role of chemokines in term and premature rupture of the fetal membranes: A review. Biol. Reprod. 2010, 82, 809–814. [Google Scholar] [CrossRef] [PubMed]
- Romero, R.; Dey, S.K.; Fisher, S.J. Preterm labor: One syndrome, many causes. Science 2014, 345, 760–765. [Google Scholar] [CrossRef] [PubMed] [Green Version]
- Romero, R.; Grivel, J.C.; Tarca, A.L.; Chaemsaithong, P.; Xu, Z.; Fitzgerald, W.; Hassan, S.S.; Chaiworapongsa, T.; Margolis, L. Evidence of perturbations of the cytokine network in preterm labor. Am. J. Obstet. Gynecol. 2015, 213, 836.e1–836.e18. [Google Scholar] [CrossRef] [PubMed] [Green Version]
- Than, N.G.; Erez, O.; Wildman, D.E.; Tarca, A.L.; Edwin, S.S.; Abbas, A.; Hotra, J.; Kusanovic, J.P.; Gotsch, F.; Hassan, S.S.; et al. Severe preeclampsia is characterized by increased placental expression of galectin-1. J. Matern. Fetal Neonatal Med. 2008, 21, 429–442. [Google Scholar] [CrossRef] [PubMed] [Green Version]
- Than, N.G.; Abdul Rahman, O.; Magenheim, R.; Nagy, B.; Fule, T.; Hargitai, B.; Sammar, M.; Hupuczi, P.; Tarca, A.L.; Szabo, G.; et al. Placental protein 13 (galectin-13) has decreased placental expression but increased shedding and maternal serum concentrations in patients presenting with preterm pre-eclampsia and HELLP syndrome. Virchows Arch. 2008, 453, 387–400. [Google Scholar] [CrossRef] [PubMed] [Green Version]
- Than, N.G.; Romero, R.; Meiri, H.; Erez, O.; Xu, Y.; Tarquini, F.; Barna, L.; Szilagyi, A.; Ackerman, R.; Sammar, M.; et al. PP13, maternal ABO blood groups and the risk assessment of pregnancy complications. PLoS ONE 2011, 6, e21564. [Google Scholar] [CrossRef] [PubMed]
- Hsu, P.; Nanan, R.K. Innate and adaptive immune interactions at the fetal-maternal interface in healthy human pregnancy and pre-eclampsia. Front. Immunol. 2014, 5, 125. [Google Scholar] [CrossRef]
- Stoikou, M.; Grimolizzi, F.; Giaglis, S.; Schafer, G.; van Breda, S.V.; Hoesli, I.M.; Lapaire, O.; Huhn, E.A.; Hasler, P.; Rossi, S.W.; et al. Gestational diabetes mellitus Is associated with altered neutrophil activity. Front. Immunol. 2017, 8, 702. [Google Scholar] [CrossRef]
- Geldenhuys, J.; Rossouw, T.M.; Lombaard, H.A.; Ehlers, M.M.; Kock, M.M. Disruption in the regulation of immune responses in the placental subtype of preeclampsia. Front. Immunol. 2018, 9, 1659. [Google Scholar] [CrossRef]
- Tsuda, S.; Zhang, X.; Hamana, H.; Shima, T.; Ushijima, A.; Tsuda, K.; Muraguchi, A.; Kishi, H.; Saito, S. Clonally expanded decidual effector regulatory T cells increase in late gestation of normal pregnancy, but not in preeclampsia, in humans. Front. Immunol. 2018, 9, 1934. [Google Scholar] [CrossRef]
- Nagymanyoki, Z.; Callahan, M.J.; Parast, M.M.; Fulop, V.; Mok, S.C.; Berkowitz, R.S. Immune cell profiling in normal pregnancy, partial and complete molar pregnancy. Gynecol. Oncol. 2007, 107, 292–297. [Google Scholar] [CrossRef]
- Hussein, M.R.; Abd-Elwahed, A.R.; Abodeif, E.S.; Abdulwahed, S.R. Decidual immune cell infiltrate in hydatidiform mole. Cancer Investig. 2009, 27, 60–66. [Google Scholar] [CrossRef]
- Sundara, Y.T.; Jordanova, E.S.; Hernowo, B.S.; Gandamihardja, S.; Fleuren, G.J. Decidual infiltration of FoxP3(+) regulatory T cells, CD3(+) T cells, CD56(+) decidual natural killer cells and Ki-67 trophoblast cells in hydatidiform mole compared to normal and ectopic pregnancies. Mol. Med. Rep. 2012, 5, 275–281. [Google Scholar] [CrossRef] [PubMed]
- Suryawanshi, H.; Morozov, P.; Straus, A.; Sahasrabudhe, N.; Max, K.E.A.; Garzia, A.; Kustagi, M.; Tuschl, T.; Williams, Z. A single-cell survey of the human first-trimester placenta and decidua. Sci. Adv. 2018, 4, eaau4788. [Google Scholar] [CrossRef] [PubMed] [Green Version]
- Driscoll, S.G. Trophoblastic growths: Morphologic aspects and taxonomy. J. Reprod. Med. 1981, 26, 181–191. [Google Scholar] [PubMed]
- Berkowitz, R.S.; Faris, H.M.; Hill, J.A.; Anderson, D.J. Localization of leukocytes and cytokines in chorionic villi of normal placentas and complete hydatidiform moles. Gynecol. Oncol. 1990, 37, 396–400. [Google Scholar] [CrossRef]
- Sacks, S.H.; Chowdhury, P.; Zhou, W. Role of the complement system in rejection. Curr. Opin. Immunol. 2003, 15, 487–492. [Google Scholar] [CrossRef]
- Qiao, S.; Nagasaka, T.; Harada, T.; Nakashima, N. p53, Bax and Bcl-2 expression, and apoptosis in gestational trophoblast of complete hydatidiform mole. Placenta 1998, 19, 361–369. [Google Scholar] [CrossRef]
- Wargasetia, T.L.; Shahib, N.; Martaadisoebrata, D.; Dhianawaty, D.; Hernowo, B. Characterization of apoptosis and autophagy through Bcl-2 and Beclin-1 immunoexpression in gestational trophoblastic disease. Iran. J. Reprod. Med. 2015, 13, 413–420. [Google Scholar]
- Davidovich, P.; Kearney, C.J.; Martin, S.J. Inflammatory outcomes of apoptosis, necrosis and necroptosis. Biol. Chem. 2014, 395, 1163–1171. [Google Scholar] [CrossRef]
- Fishelson, Z.; Attali, G.; Mevorach, D. Complement and apoptosis. Mol. Immunol. 2001, 38, 207–219. [Google Scholar] [CrossRef]
- Ronnett, B.M. Hydatidiform Moles: Ancillary Techniques to Refine Diagnosis. Arch. Pathol. Lab. Med. 2018, 142, 1485–1502. [Google Scholar] [CrossRef] [Green Version]
- Ning, F.; Hou, H.; Morse, A.N.; Lash, G.E. Understanding and management of gestational trophoblastic disease. F1000Res 2019, 8, 1–8. [Google Scholar] [CrossRef] [PubMed]
- Colley, E.; Hamilton, S.; Smith, P.; Morgan, N.V.; Coomarasamy, A.; Allen, S. Potential genetic causes of miscarriage in euploid pregnancies: A systematic review. Hum. Reprod. Update 2019, 25, 452–472. [Google Scholar] [CrossRef] [PubMed]
- Meyer, M.; Kircher, M. Illumina sequencing library preparation for highly multiplexed target capture and sequencing. Cold Spring Harb. Protoc. 2010, 2010, pdb prot5448. [Google Scholar] [CrossRef]
- Hargitai, B.; Marton, T.; Cox, P.M. Best practice no 178. Examination of the human placenta. J. Clin. Pathol. 2004, 57, 785–792. [Google Scholar] [CrossRef] [PubMed]
- Redline, R.W. Placental pathology: A systematic approach with clinical correlations. Placenta 2008, 29 Suppl. A, 86–91. [Google Scholar] [CrossRef]
- Khong, T.Y.; Mooney, E.E.; Ariel, I.; Balmus, N.C.; Boyd, T.K.; Brundler, M.A.; Derricott, H.; Evans, M.J.; Faye-Petersen, O.M.; Gillan, J.E.; et al. Sampling and Definitions of Placental Lesions: Amsterdam Placental Workshop Group Consensus Statement. Arch. Pathol. Lab. Med. 2016, 140, 698–713. [Google Scholar] [CrossRef]
- Soma, H.; Osawa, H.; Oguro, T.; Yoshihama, I.; Fujita, K.; Mineo, S.; Kudo, M.; Tanaka, K.; Akita, M.; Urabe, S.; et al. P57kip2 immunohistochemical expression and ultrastructural findings of gestational trophoblastic disease and related disorders. Med. Mol. Morphol. 2007, 40, 95–102. [Google Scholar] [CrossRef]
- Madi, J.M.; Braga, A.; Paganella, M.P.; Litvin, I.E.; Wendland, E.M. Accuracy of p57(KIP)(2) compared with genotyping to diagnose complete hydatidiform mole: A systematic review and meta-analysis. BJOG 2018, 125, 1226–1233. [Google Scholar] [CrossRef]
- Szabo, S.; Xu, Y.; Romero, R.; Fule, T.; Karaszi, K.; Bhatti, G.; Varkonyi, T.; Varkonyi, I.; Krenacs, T.; Dong, Z.; et al. Changes of placental syndecan-1 expression in preeclampsia and HELLP syndrome. Virchows Arch. 2013, 463, 445–458. [Google Scholar] [CrossRef] [Green Version]
- Szabo, S.; Mody, M.; Romero, R.; Xu, Y.; Karaszi, K.; Mihalik, N.; Xu, Z.; Bhatti, G.; Fule, T.; Hupuczi, P.; et al. Activation of villous trophoblastic p38 and ERK1/2 signaling pathways in preterm preeclampsia and HELLP syndrome. Pathol. Oncol. Res. 2015, 21, 659–668. [Google Scholar] [CrossRef]
- Szenasi, N.L.; Toth, E.; Balogh, A.; Juhasz, K.; Karaszi, K.; Ozohanics, O.; Gelencser, Z.; Kiraly, P.; Hargitai, B.; Drahos, L.; et al. Proteomic identification of membrane-associated placental protein 4 (MP4) as perlecan and characterization of its placental expression in normal and pathologic pregnancies. PeerJ 2019, 7, e6982. [Google Scholar] [CrossRef] [PubMed] [Green Version]
- Kim, D.; Langmead, B.; Salzberg, S.L. HISAT: A fast spliced aligner with low memory requirements. Nat. Methods 2015, 12, 357–360. [Google Scholar] [CrossRef] [PubMed]
- Li, H.; Handsaker, B.; Wysoker, A.; Fennell, T.; Ruan, J.; Homer, N.; Marth, G.; Abecasis, G.; Durbin, R.; Genome Project Data Processing Subgroup. The Sequence Alignment/Map format and SAMtools. Bioinformatics 2009, 25, 2078–2079. [Google Scholar] [CrossRef] [PubMed] [Green Version]
- Liao, Y.; Smyth, G.K.; Shi, W. featureCounts: An efficient general purpose program for assigning sequence reads to genomic features. Bioinformatics 2014, 30, 923–930. [Google Scholar] [CrossRef] [PubMed]
- Anders, S.; Huber, W. Differential expression analysis for sequence count data. Genome Biol. 2010, 11, R106. [Google Scholar] [CrossRef]
- Love, M.I.; Huber, W.; Anders, S. Moderated estimation of fold change and dispersion for RNA-seq data with DESeq2. Genome Biol. 2014, 15, 550. [Google Scholar] [CrossRef] [Green Version]
- Draghici, S.; Khatri, P.; Tarca, A.L.; Amin, K.; Done, A.; Voichita, C.; Georgescu, C.; Romero, R. A systems biology approach for pathway level analysis. Genome Res. 2007, 17, 1537–1545. [Google Scholar] [CrossRef] [Green Version]

| Gene Symbol | Entrez ID | Base Mean | lfcSE | Log2 FC | pFDR | p-Value | Control Mean |
|---|---|---|---|---|---|---|---|
| CGA | 1081 | 164,079.45 | 0.63 | 0.07 | 0.93 | 0.91 | 155,778.30 |
| FN1 | 2335 | 141,988.22 | 0.56 | 0.32 | 0.64 | 0.57 | 135,448.78 |
| TFPI2 | 7980 | 125,046.51 | 0.58 | −1.16 | 0.08 | 0.05 | 127,071.15 |
| CSH1 | 1442 | 87,798.80 | 0.67 | −4.58 | 0.00 | 0.00 | 93,037.03 |
| EEF1A1 | 1915 | 84,023.14 | 0.15 | −1.20 | 0.00 | 0.00 | 87,193.18 |
| PEG10 | 23089 | 77,282.40 | 0.24 | −1.74 | 0.00 | 0.00 | 82,299.13 |
| CSH2 | 1443 | 61,726.09 | 0.81 | −4.23 | 0.00 | 0.00 | 65,433.13 |
| COL3A1 | 1281 | 60,159.32 | 0.29 | −1.30 | 0.00 | 0.00 | 63,035.40 |
| KISS1 | 3814 | 65,121.70 | 0.65 | 0.13 | 0.88 | 0.84 | 61,457.48 |
| ADAM12 | 8038 | 44,435.52 | 0.35 | −0.06 | 0.90 | 0.86 | 43,427.10 |
| CYP19A1 | 1588 | 40,376.35 | 0.53 | −1.27 | 0.03 | 0.02 | 41,478.58 |
| SPP1 | 6696 | 37,734.38 | 0.41 | −4.02 | 0.00 | 0.00 | 40,796.23 |
| TGM2 | 7052 | 39,725.43 | 0.36 | −0.36 | 0.39 | 0.31 | 39,553.03 |
| PSG3 | 5671 | 38,487.88 | 0.51 | −1.05 | 0.07 | 0.04 | 39,153.23 |
| PAPPA | 5069 | 35,537.55 | 0.59 | −1.35 | 0.04 | 0.02 | 36,733.78 |
| PSG4 | 5672 | 33,870.64 | 0.59 | −3.17 | 0.00 | 0.00 | 36,069.85 |
| COL4A1 | 1282 | 36,995.51 | 0.37 | 0.33 | 0.46 | 0.37 | 35,055.03 |
| PAPPA2 | 60676 | 34,031.77 | 0.48 | 0.31 | 0.60 | 0.52 | 32,044.98 |
| FBN2 | 2201 | 30,126.49 | 0.26 | −1.57 | 0.00 | 0.00 | 31,930.00 |
| ACTB | 60 | 31,472.69 | 0.22 | 0.39 | 0.11 | 0.07 | 29,870.08 |
| Gene Symbol | Entrez ID | Base Mean | lfcSE | Log2 FC | pFDR | p-Value | Control Mean | CHM Mean |
|---|---|---|---|---|---|---|---|---|
| HBB * | 3043 | 33,412.13 | 0.49 | 7.74 | 0.00 | 0.00 | 1,608.00 | 373,335.00 |
| CGA | 1081 | 164,079.45 | 0.63 | 0.07 | 0.93 | 0.91 | 155,778.30 | 189,408.50 |
| FN1 | 2335 | 141,988.22 | 0.56 | 0.32 | 0.64 | 0.57 | 135,448.78 | 184,274.75 |
| PAEP * | 5047 | 7,444.75 | 0.96 | 7.11 | 0.00 | 0.00 | 545.88 | 95,119.25 |
| KISS1 | 3814 | 65,121.70 | 0.65 | 0.13 | 0.88 | 0.84 | 61,457.48 | 78,481.00 |
| GDF15 * | 9518 | 24,551.03 | 0.58 | 1.70 | 0.01 | 0.00 | 19,462.58 | 73,765.25 |
| TFPI2 | 7980 | 125,046.51 | 0.58 | −1.16 | 0.08 | 0.05 | 127,071.15 | 66,657.75 |
| IGF2 * | 3481 | 26,174.25 | 0.22 | 1.20 | 0.00 | 0.00 | 23,075.75 | 60,786.25 |
| HBA2 * | 3040 | 5,986.27 | 0.56 | 4.95 | 0.00 | 0.00 | 1,590.28 | 52,014.25 |
| COL4A1 | 1282 | 36,995.51 | 0.37 | 0.33 | 0.46 | 0.37 | 35,055.03 | 49,353.25 |
| ADAM12 | 8038 | 44,435.52 | 0.35 | −0.06 | 0.90 | 0.86 | 43,427.10 | 47,781.00 |
| LEP * | 3952 | 6,372.49 | 0.65 | 3.52 | 0.00 | 0.00 | 3,092.85 | 45,604.50 |
| ACTB | 60 | 31,472.69 | 0.22 | 0.39 | 0.11 | 0.07 | 29,870.08 | 45,004.50 |
| PAPPA2 | 60676 | 34,031.77 | 0.48 | 0.31 | 0.60 | 0.52 | 32,044.98 | 44,734.75 |
| EEF1A1 * | 1915 | 84,023.14 | 0.15 | −1.20 | 0.00 | 0.00 | 87,193.18 | 43,702.00 |
| AHNAK | 79026 | 25,150.93 | 0.24 | 0.66 | 0.01 | 0.01 | 23,452.63 | 43,214.25 |
| CGB5 | 93659 | 18,949.99 | 0.70 | 1.13 | 0.16 | 0.11 | 16,161.30 | 40,758.75 |
| FLT1 | 2321 | 19,476.41 | 0.32 | 0.96 | 0.01 | 0.00 | 17,411.10 | 38,701.00 |
| FSTL3 * | 10272 | 7,919.03 | 0.63 | 2.57 | 0.00 | 0.00 | 5,172.10 | 36,659.00 |
| CGB3 * | 1082 | 13,840.61 | 0.66 | 1.49 | 0.04 | 0.02 | 11,254.20 | 35,670.25 |
| Gene Symbol | Entrez ID | Base Mean | Log2 FC | lfcSE | p-Value | pFDR |
|---|---|---|---|---|---|---|
| HBB | 3043 | 33,412.13 | 7.74 | 0.49 | 4.64 × 10−57 | 4.06 × 10−54 |
| PAEP | 5047 | 7,444.75 | 7.11 | 0.96 | 1.70 × 10⁻¹³ | 2.45 × 10⁻¹² |
| CP | 1356 | 307.65 | 7.01 | 0.69 | 1.38 × 10⁻²⁴ | 8.39 × 10⁻²³ |
| C2CD4B | 388125 | 59.15 | 6.66 | 0.54 | 6.42 × 10⁻³⁵ | 1.25 × 10⁻³² |
| IRX3 | 79191 | 99.72 | 6.32 | 0.53 | 1.90 × 10⁻³² | 2.77 × 10⁻³⁰ |
| BEST1 | 7439 | 801.46 | 6.23 | 0.76 | 2.40 × 10⁻¹⁶ | 5.15 × 10⁻¹⁵ |
| DSEL | 92126 | 88.53 | 6.12 | 0.25 | 4.36 × 10−128 | 3.05 × 10−124 |
| B4GALNT3 | 283358 | 83.11 | 5.85 | 0.51 | 2.80 × 10⁻³⁰ | 3.32 × 10⁻²⁸ |
| PGR | 5241 | 62.02 | 5.85 | 0.49 | 3.04 × 10⁻³³ | 4.90 × 10⁻³¹ |
| ZNF623 | 9831 | 59.42 | 5.77 | 0.18 | 1.30 × 10−214 | 1.82 × 10−210 |
| KIAA1324 | 57535 | 79.48 | 5.58 | 0.46 | 1.77 × 10⁻³³ | 3.03 × 10⁻³¹ |
| IGFBP7 | 3490 | 658.18 | 5.52 | 0.46 | 3.03 × 10⁻³³ | 4.90 × 10⁻³¹ |
| RORC | 6097 | 36.06 | 5.47 | 0.43 | 3.04 × 10−36 | 6.86 × 10⁻³⁴ |
| DEFB1 | 1672 | 47.01 | 5.44 | 0.58 | 5.59 × 10⁻²¹ | 2.16 × 10⁻¹⁹ |
| PKHD1 | 5314 | 74.85 | 5.36 | 0.71 | 5.31 × 10⁻¹⁴ | 8.23 × 10⁻¹³ |
| ADCY1 | 107 | 53.12 | 5.33 | 0.37 | 6.31 × 10−48 | 2.95 × 10−45 |
| MAPT | 4137 | 23.64 | 5.30 | 0.48 | 4.39 × 10⁻²⁸ | 4.15 × 10⁻²⁶ |
| PRUNE2 | 158471 | 140.93 | 5.29 | 0.49 | 9.85 × 10⁻²⁷ | 7.89 × 10⁻²⁵ |
| GALNT15 | 117248 | 23.91 | 5.18 | 0.47 | 8.01 × 10⁻²⁸ | 7.28 × 10⁻²⁶ |
| WDR38 | 401551 | 74.42 | 5.12 | 1.02 | 5.62 × 10−07 | 2.74 × 10−06 |
| HAPLN1 | 1404 | 3,248.02 | −3.66 | 0.31 | 1.18 × 10⁻³² | 1.80 × 10⁻³⁰ |
| CD36 | 948 | 2,906.67 | −3.71 | 0.39 | 6.13 × 10⁻²² | 2.71 × 10⁻²⁰ |
| WNT2 | 7472 | 1,855.95 | −3.72 | 0.33 | 8.29 × 10⁻²⁹ | 8.30 × 10⁻²⁷ |
| EGFL6 | 25975 | 4,141.42 | −3.75 | 0.29 | 1.50 × 10−37 | 3.69 × 10⁻³⁵ |
| BMP5 | 653 | 1,150.58 | −3.86 | 0.37 | 3.40 × 10⁻²⁵ | 2.29 × 10⁻²³ |
| F13A1 | 2162 | 7,493.03 | −3.98 | 0.41 | 1.75 × 10⁻²² | 8.18 × 10⁻²¹ |
| SPP1 | 6696 | 37,734.38 | −4.02 | 0.41 | 6.04 × 10⁻²³ | 2.97 × 10⁻²¹ |
| HBG2 | 3048 | 4,458.52 | −4.05 | 0.38 | 4.57 × 10⁻²⁶ | 3.35 × 10⁻²⁴ |
| MFSD14A | 64645 | 776.11 | −4.19 | 0.26 | 5.42 × 10−59 | 5.96 × 10−56 |
| CSH2 | 1443 | 61,726.09 | −4.23 | 0.81 | 1.94 × 10−07 | 1.03 × 10−06 |
| AGTR1 | 185 | 664.42 | −4.27 | 0.38 | 2.85 × 10⁻²⁹ | 3.03 × 10⁻²⁷ |
| COX4I2 | 84701 | 131.49 | −4.28 | 0.47 | 1.36 × 10⁻¹⁹ | 4.47 × 10⁻¹⁸ |
| SVEP1 | 79987 | 15,505.08 | −4.33 | 0.46 | 5.20 × 10⁻²¹ | 2.01 × 10⁻¹⁹ |
| LYVE1 | 10894 | 2,663.78 | −4.56 | 0.34 | 6.68 × 10−42 | 2.23 × 10−39 |
| CSH1 | 1442 | 87,798.80 | −4.58 | 0.67 | 5.61 × 10⁻¹² | 6.40 × 10⁻¹¹ |
| AREG | 374 | 710.42 | −4.64 | 0.45 | 4.88 × 10⁻²⁵ | 3.19 × 10⁻²³ |
| SPESP1 | 246777 | 321.55 | −5.11 | 0.40 | 1.75 × 10−36 | 4.01 × 10⁻³⁴ |
| RPS10 | 6204 | 742.05 | −5.28 | 0.44 | 3.32 × 10⁻³³ | 5.29 × 10⁻³¹ |
| CSHL1 | 1444 | 2,846.50 | −5.43 | 0.41 | 2.25 × 10−40 | 6.85 × 10−38 |
| ZC3H11A | 9877 | 2,887.90 | −5.95 | 0.32 | 4.7 × 10−76 | 8.29 × 10−73 |
| GO ID | GO Name | Count DE | Count All | p Elim Pruning |
|---|---|---|---|---|
| GO:0005509 | calcium ion binding | 178 | 426 | 1.60 × 10⁻¹³ |
| GO:0008083 | growth factor activity | 50 | 84 | 5.50 × 10⁻¹¹ |
| GO:0005201 | extracellular matrix structural constituent | 74 | 130 | 3.00 × 10−08 |
| GO:0004930 | G protein-coupled receptor activity | 90 | 188 | 9.00 × 10−07 |
| GO:0008201 | heparin binding | 47 | 99 | 2.40 × 10−06 |
| GO:0005125 | cytokine activity | 36 | 70 | 3.60 × 10−06 |
| GO:0030020 | extracellular matrix structural constituent conferring tensile strength | 22 | 35 | 4.00 × 10−06 |
| GO:0004888 | transmembrane signaling receptor activity | 192 | 421 | 4.80 × 10−06 |
| GO:0042605 | peptide antigen binding | 13 | 17 | 1.70 × 10−05 |
| GO:0039706 | co-receptor binding | 8 | 8 | 1.90 × 10−05 |
| GO:0005178 | integrin binding | 42 | 91 | 2.00 × 10−05 |
| GO:0005044 | scavenger receptor activity | 24 | 43 | 2.60 × 10−05 |
| GO:0038023 | signaling receptor activity | 259 | 568 | 3.10 × 10−05 |
| GO:0005249 | voltage-gated potassium channel activity | 23 | 27 | 3.70 × 10−05 |
| GO:0004252 | serine-type endopeptidase activity | 30 | 60 | 4.60 × 10−05 |
| GO:0005179 | hormone activity | 19 | 34 | 1.80 × 10−04 |
| GO:0008331 | high voltage-gated calcium channel activity | 6 | 6 | 2.90 × 10−04 |
| GO:0020037 | heme binding | 29 | 63 | 3.90 × 10−04 |
| GO:0030506 | ankyrin binding | 10 | 14 | 4.40 × 10−04 |
| GO:0003996 | acyl-CoA ligase activity | 7 | 8 | 4.40 × 10−04 |
| GO ID | GO Name | Count DE | Count All | p Elim Pruning |
|---|---|---|---|---|
| GO:0010469 | regulation of signaling receptor activity | 143 | 285 | 3.90 × 10⁻¹⁴ |
| GO:0007155 | cell adhesion | 407 | 1,014 | 2.00 × 10⁻¹³ |
| GO:0007268 | chemical synaptic transmission | 165 | 397 | 3.60 × 10−07 |
| GO:0030198 | extracellular matrix organization | 122 | 271 | 3.80 × 10−07 |
| GO:0030449 | regulation of complement activation | 22 | 33 | 1.20 × 10−06 |
| GO:0006958 | complement activation, classical pathway | 16 | 22 | 6.40 × 10−06 |
| GO:0034765 | regulation of ion transmembrane transport | 130 | 295 | 1.50 × 10−05 |
| GO:0045669 | positive regulation of osteoblast differentiation | 29 | 54 | 1.50 × 10−05 |
| GO:0007156 | homophilic cell adhesion via plasma membrane adhesion molecules | 36 | 76 | 5.40 × 10−05 |
| GO:0007186 | G protein-coupled receptor signaling pathway | 196 | 516 | 6.00 × 10−05 |
| GO:0007166 | cell surface receptor signaling pathway | 686 | 2,116 | 8.60 × 10−05 |
| GO:0007601 | visual perception | 51 | 123 | 1.50 × 10−04 |
| GO:0006957 | complement activation, alternative pathway | 8 | 9 | 1.50 × 10−04 |
| GO:0006805 | xenobiotic metabolic process | 32 | 68 | 1.60 × 10−04 |
| GO:0002576 | platelet degranulation | 44 | 103 | 1.80 × 10−04 |
| GO:0042102 | positive regulation of T cell proliferation | 32 | 60 | 2.20 × 10−04 |
| GO:0035115 | embryonic forelimb morphogenesis | 17 | 29 | 2.20 × 10−04 |
| GO:0030501 | positive regulation of bone mineralization | 19 | 34 | 2.20 × 10−04 |
| GO:0048662 | negative regulation of smooth muscle cell proliferation | 23 | 39 | 2.30 × 10−04 |
| GO:0035116 | embryonic hindlimb morphogenesis | 14 | 22 | 2.20 × 10−04 |
| Pathway Name | p-value | pFDR |
|---|---|---|
| Cytokine-cytokine receptor interaction | 1.38 × 10−07 | 2.31 × 10−05 |
| Cell adhesion molecules (CAMs) | 1.43 × 10−07 | 2.31 × 10−05 |
| Protein digestion and absorption | 6.20 × 10−07 | 6.68 × 10−05 |
| Neuroactive ligand-receptor interaction | 1.32 × 10−06 | 1.07 × 10−04 |
| Complement and coagulation cascades | 6.91 × 10−06 | 4.46 × 10−04 |
| Hypertrophic cardiomyopathy (HCM) | 1.05 × 10−05 | 4.87 × 10−04 |
| Extracellular matrix (ECM)-receptor interaction | 1.06 × 10−05 | 4.87 × 10−04 |
| Autoimmune thyroid disease | 2.91 × 10−05 | 1.17 × 10−03 |
| Allograft rejection | 7.36 × 10−05 | 2.39 × 10−03 |
| Graft-versus-host disease | 8.01 × 10−05 | 2.39 × 10−03 |
| Antigen processing and presentation | 8.15 × 10−05 | 2.39 × 10−03 |
| Intestinal immune network for IgA production | 9.94 × 10−05 | 2.68 × 10−03 |
| Staphylococcus aureus infection | 1.18 × 10−04 | 2.94 × 10−03 |
| Metabolism of xenobiotics by cytochrome P450 | 1.64 × 10−04 | 3.63 × 10−03 |
| Hematopoietic cell lineage | 1.73 × 10−04 | 3.63 × 10−03 |
| Patients Providing GTD Tissue Samples (n = 4) | Patients Providing Placenta Samples (n = 40) | |
|---|---|---|
| Race/ethnicity Hispanic Caucasian Asian African-American Unknown/other | 2 - 1 - 1 | 6 34 - - - |
| Age at procedure | 25.7 | 39.2 |
| Histologic diagnosis Complete mole Incomplete mole Invasive mole | 3 - 1 | - - - |
| Sex chromosome content XY XX | - 4 | 22 18 |
| Gestational age at tissue collection (days) | 79.2 (58–98) | 84.2 (77–124) |
| Patients Providing GTD Tissue Samples (n = 23 *) | Patients Providing Placenta Samples (n = 29) | |
|---|---|---|
| Race/ethnicity a Hispanic Non-Hispanic white Asian African-American Unknown/other | 18 (78%) 2 (9%) 0 0 3 (13%) | |
| 29 (100%) | ||
| Age (years) at procedure b | 31.9 ± 9.5 | 30.4 ± 6.4 |
| Comorbidities Hypertension a Diabetes a beta-hCG (mIU/mL) c | 1 (4%) 1 (4%) 185,277 (70,349–387,812) | |
| Histologic diagnosis a | ||
| Complete mole | 26 (100%) | 0 (0%) |
| p57 immunostaining confirmation of CHM | 23 (88%) | |
| Gestational age at the procedure (days) b | 64.4 ± 18.2 | 62.3 ± 11.8 |
| Grouping | Definition | Sample No. * |
|---|---|---|
| 1 | D&C then cured | 15 |
| 2a | D&C then persistent GTD, cured by first-line single agent | 1 |
| 2b | D&C then persistent GTD, cured by upfront hysterectomy | 4 |
| 2c | D&C then persistent GTD, cured by upfront hysterectomy and adjuvant chemotherapy | 0 |
| 3a | D&C then persistent GTD, received first-line single agent but failed | 3 |
| 3b | D&C then persistent GTD, received first-line multi-agent and cured | 0 |
| 3c | D&C then persistent GTD, received first-line multi-agent and failed | 0 |
| 3d | D&C then persistent GTD, received upfront hysterectomy but recurred | 0 |
| 4 | Recurrent GTD | 3 |
| Primary Antibody (Concentration/Dilution, Distributor) | Secondary Antibody (Dilution, Distributor) | Detection Antibody (Distributor) | Detection System (Distributor) |
|---|---|---|---|
| monoclonal mouse anti-human p57 antibody (1:3000) (code: MA5-11309, Thermo Fisher Scientific, Waltham, MA, USA) | - | Novolink detections system (Leica-Novocastra, Wetzlar, Germany) | Novolink DAB/substrate kit (Leica-Novocastra, Wetzlar, Germany) |
| recombinant, His6-tagged anti-human gal-14 antibody (0.65 µg/mL) [provided by Prof. R. Romero (PRB, NIH)] | monoclonal mouse anti-His6-tag antibody (1:200) (code: 05-959, Merck-Millipore, Burlington, MA, USA) |
© 2019 by the authors. Licensee MDPI, Basel, Switzerland. This article is an open access article distributed under the terms and conditions of the Creative Commons Attribution (CC BY) license (http://creativecommons.org/licenses/by/4.0/).
Share and Cite
King, J.R.; Wilson, M.L.; Hetey, S.; Kiraly, P.; Matsuo, K.; Castaneda, A.V.; Toth, E.; Krenacs, T.; Hupuczi, P.; Mhawech-Fauceglia, P.; et al. Dysregulation of Placental Functions and Immune Pathways in Complete Hydatidiform Moles. Int. J. Mol. Sci. 2019, 20, 4999. https://doi.org/10.3390/ijms20204999
King JR, Wilson ML, Hetey S, Kiraly P, Matsuo K, Castaneda AV, Toth E, Krenacs T, Hupuczi P, Mhawech-Fauceglia P, et al. Dysregulation of Placental Functions and Immune Pathways in Complete Hydatidiform Moles. International Journal of Molecular Sciences. 2019; 20(20):4999. https://doi.org/10.3390/ijms20204999
Chicago/Turabian StyleKing, Jennifer R., Melissa L. Wilson, Szabolcs Hetey, Peter Kiraly, Koji Matsuo, Antonio V. Castaneda, Eszter Toth, Tibor Krenacs, Petronella Hupuczi, Paulette Mhawech-Fauceglia, and et al. 2019. "Dysregulation of Placental Functions and Immune Pathways in Complete Hydatidiform Moles" International Journal of Molecular Sciences 20, no. 20: 4999. https://doi.org/10.3390/ijms20204999
APA StyleKing, J. R., Wilson, M. L., Hetey, S., Kiraly, P., Matsuo, K., Castaneda, A. V., Toth, E., Krenacs, T., Hupuczi, P., Mhawech-Fauceglia, P., Balogh, A., Szilagyi, A., Matko, J., Papp, Z., Roman, L. D., Cortessis, V. K., & Than, N. G. (2019). Dysregulation of Placental Functions and Immune Pathways in Complete Hydatidiform Moles. International Journal of Molecular Sciences, 20(20), 4999. https://doi.org/10.3390/ijms20204999