c-Src Recruitment is Involved in c-MET-Mediated Malignant Behaviour of NT2D1 Non-Seminoma Cells

 ,
,  ,
,  and
and 
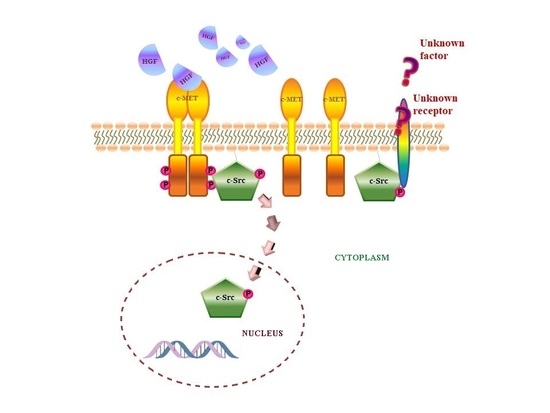
Abstract
1. Introduction
2. Results
2.1. c-Src is Involved in HGF-Dependent NT2D1 Cell Proliferation
2.2. c-Src is Specifically Involved in HGF-Dependent NT2D1 Cell Chemoattraction
2.3. c-MET Modulates the Collective Migration of NT2D1 Cells Induced by HGF
2.4. c-Src is Involved in HGF-Induced NT2D1 Cell Collective Migration
2.5. c-Src is Involved in HGF-Dependent NT2D1 Cell Invasion
2.6. Phospho-c-Src Detection after HGF Administration to NT2D1 Cells
2.7. Immunofluorescence Analysis of the Active Form of c-Src (Phospho Tyr 416) in NT2D1 Cells
3. Discussion
4. Materials and Methods
4.1. Cell Culture
4.2. Cell Proliferation Assay
4.3. Cell Cycle FACS Analysis
4.4. Cell Death Assay
4.5. Chemotaxis Assay
4.6. Matrigel Invasion Assay
4.7. Wound-healing Assay (Collective Migration Assay)
4.8. Immunofluorescence Analyses
4.9. Western Blot Analyses
4.10. Statistical Analyses
Supplementary Materials
Author Contributions
Funding
Conflicts of Interest
Abbreviations
| BCA | Bicinchoninic Acid assay |
| BSA | Bovine Serum Albumine |
| c-MET | Mesenchymal Epithelial Transition factor (HGF receptor) |
| FBS | Foetal Bovine Serum |
| GCNIS | Germ Cell Neoplasia In Situ |
| GFR | Growth Factor Reduced |
| HGF | Hepatocyte Growth Factor |
| SEM | Standard Error Measure |
| SUM (I) | Sum of Intensity |
| TGCTs | Testicular Germ Cell Tumours |
References
- Woldu, S.L.; Bagrodia, A. Update on epidemiologic considerations and treatment trends in testicular cancer. Curr. Opin. Urol. 2018, 28, 440–447. [Google Scholar] [CrossRef] [PubMed]
- Chieffi, P.; Chieffi, S.; Franco, R.; Sinisi, A.A. Recent advances in the biology of germ cell tumors: Implications for the diagnosis and treatment. J. Endocrinol. Investig. 2012, 35, 1015–1020. [Google Scholar]
- Chieffi, P. An Overview on Predictive Biomarkers of Testicular Germ Cell Tumors. J. Cell. Physiol. 2017, 232, 276–280. [Google Scholar] [CrossRef] [PubMed]
- Chieffi, P.; Franco, R.; Portella, G. Molecular and cell biology of testicular germ cell tumors. Int. Rev. Cell Mol. Biol. 2009, 278, 277–308. [Google Scholar] [PubMed]
- Maroto, P.; Anguera, G.; Martin, C. Long-term toxicity of the treatment for germ cell-cancer. A review. Crit. Rev. Oncol. Hematol. 2018, 121, 62–67. [Google Scholar] [CrossRef] [PubMed]
- Kristensen, D.M.; Sonne, S.B.; Ottesen, A.M.; Perrett, R.M.; Nielsen, J.E.; Almstrup, K.; Skakkebaek, N.E.; Leffers, H.; Rajpert-De Meyts, E. Origin of pluripotent germ cell tumours: The role of microenvironment during embryonic development. Mol. Cell. Endocrinol. 2008, 288, 111–118. [Google Scholar] [CrossRef] [PubMed]
- Moch, H.; Cubilla, A.L.; Humphrey, P.A.; Reuter, V.E.; Ulbright, T.M. The 2016 WHO Classification of Tumours of the Urinary System and Male Genital Organs-Part A: Renal, Penile, and Testicular Tumours. Eur. Urol. 2016, 70, 93–105. [Google Scholar] [CrossRef] [PubMed]
- Oosterhuis, J.W.; Looijenga, L.H. Testicular germ-cell tumours in a broader perspective. Nat. Rev. Cancer 2005, 5, 210–222. [Google Scholar] [CrossRef]
- Krausz, C.; Looijenga, L.H. Genetic aspects of testicular germ cell tumors. Cell Cycle 2008, 7, 3519–3524. [Google Scholar] [CrossRef]
- Rajpert-De Meyts, E.; McGlynn, K.A.; Okamoto, K.; Jewett, M.A.; Bokemeyer, C. Testicular germ cell tumours. Lancet 2016, 387, 1762–1774. [Google Scholar] [CrossRef]
- Looijenga, L.H.; Van Agthoven, T.; Biermann, K. Development of malignant germ cells—The genvironmental hypothesis. Int. J. Dev. Biol. 2013, 57, 241–253. [Google Scholar] [CrossRef] [PubMed]
- Catizone, A.; Ricci, G.; Arista, V.; Innocenzi, A.; Galdieri, M. Hepatocyte growth factor and c-MET are expressed in rat prepuberal testis. Endocrinology 1999, 140, 3106–3113. [Google Scholar] [CrossRef] [PubMed]
- Catizone, A.; Ricci, G.; Del Bravo, J.; Galdieri, M. Hepatocyte growth factor modulates in vitro survival and proliferation of germ cells during postnatal testis development. J. Endocrinol. 2006, 189, 137–146. [Google Scholar] [CrossRef] [PubMed]
- Catizone, A.; Ricci, G.; Tufano, M.A.; Perfetto, B.; Canipari, R.; Galdieri, M. Hepatocyte growth factor (HGF) modulates Leydig cell extracellular matrix components. J. Androl. 2010, 31, 306–313. [Google Scholar] [CrossRef] [PubMed]
- Ricci, G.; Catizone, A. Pleiotropic Activities of HGF/c-Met System in Testicular Physiology: Paracrine and Endocrine Implications. Front Endocrinol. 2014, 5, 38. [Google Scholar] [CrossRef] [PubMed]
- Ricci, G.; Catizone, A.; Galdieri, M. Pleiotropic activity of hepatocyte growth factor during embryonic mouse testis development. Mech. Dev. 2002, 118, 19–28. [Google Scholar] [CrossRef]
- Depuydt, C.E.; De Potter, C.R.; Zalata, A.; Baekelandt, E.; Bosmans, E.; Comhaire, F.H. Levels of hepatocyte growth factor/scatter factor (HGF/SF) in seminal plasma of patients with andrological diseases. J. Androl. 1998, 19, 175–182. [Google Scholar]
- Depuydt, C.E.; Zalata, A.; de Potter, C.R.; van Emmelo, J.; Comhaire, F.H. The receptor encoded by the human C-MET oncogene is expressed in testicular tissue and on human spermatozoa. Mol. Hum. Reprod. 1996, 2, 2–8. [Google Scholar] [CrossRef]
- Gherardi, E.; Sandin, S.; Petoukhov, M.V.; Finch, J.; Youles, M.E.; Ofverstedt, L.G.; Miguel, R.N.; Blundell, T.L.; Vande Woude, G.F.; Skoglund, U.; et al. Structural basis of hepatocyte growth factor/scatter factor and MET signalling. Proc. Natl. Acad. Sci. USA 2006, 103, 4046–4051. [Google Scholar] [CrossRef]
- Trusolino, L.; Bertotti, A.; Comoglio, P.M. MET signalling: Principles and functions in development, organ regeneration and cancer. Nat. Rev. Mol. Cell Biol. 2010, 11, 834–848. [Google Scholar] [CrossRef]
- Scheri, K.C.; Leonetti, E.; Laino, L.; Gigantino, V.; Gesualdi, L.; Grammatico, P.; Bizzari, M.; Franco, R.; Oosterhuis, J.W.; Stoop, H.; et al. c-MET receptor as potential biomarker and target molecule for malignant testicular germ cell tumors. Oncotarget 2018, 9, 31842–31860. [Google Scholar] [PubMed]
- Svetlovska, D.; Miskovska, V.; Cholujova, D.; Gronesova, P.; Cingelova, S.; Chovanec, M.; Sycova-Mila, Z.; Obertova, J.; Palacka, P.; Rajec, J.; et al. Plasma Cytokines Correlated with Disease Characteristics, Progression-Free Survival, and Overall Survival in Testicular Germ-Cell Tumor Patients. Clin. Genitourin. Cancer 2017, 15, 411–416. [Google Scholar] [CrossRef] [PubMed]
- Boccaccio, C.; Comoglio, P.M. MET, a driver of invasive growth and cancer clonal evolution under therapeutic pressure. Curr. Opin. Cell Biol. 2014, 31, 98–105. [Google Scholar] [CrossRef] [PubMed]
- Della Corte, C.M.; Fasano, M.; Papaccio, F.; Ciardiello, F.; Morgillo, F. Role of HGF-MET Signaling in Primary and Acquired Resistance to Targeted Therapies in Cancer. Biomedicines 2014, 2, 345–358. [Google Scholar] [CrossRef] [PubMed]
- Miekus, K. The Met tyrosine kinase receptor as a therapeutic target and a potential cancer stem cell factor responsible for therapy resistance. Oncol. Rep. 2017, 37, 647–656. [Google Scholar] [CrossRef] [PubMed]
- Koeppen, H.; Rost, S.; Yauch, R.L. Developing biomarkers to predict benefit from HGF/MET pathway inhibitors. J. Pathol. 2014, 232, 210–218. [Google Scholar] [CrossRef] [PubMed]
- Lutterbach, B.; Zeng, Q.; Davis, L.J.; Hatch, H.; Hang, G.; Kohl, N.E.; Gibbs, J.B.; Pan, B.S. Lung cancer cell lines harboring MET gene amplification are dependent on Met for growth and survival. Cancer Res. 2007, 67, 2081–2088. [Google Scholar] [CrossRef] [PubMed]
- Birchmeier, C.; Birchmeier, W.; Gherardi, E.; Vande Woude, G.F. Met, metastasis, motility and more. Nat. Rev. Mol. Cell Biol. 2003, 4, 915–925. [Google Scholar] [CrossRef] [PubMed]
- Cecchi, F.; Rabe, D.C.; Bottaro, D.P. Targeting the HGF/Met signaling pathway in cancer therapy. Expert Opin. Ther. Targets 2012, 16, 553–572. [Google Scholar] [CrossRef]
- Arnold, L.; Enders, J.; Thomas, S.M. Activated HGF-c-Met Axis in Head and Neck Cancer. Cancers 2017, 9, 169. [Google Scholar] [CrossRef]
- Guarino, M. Src signaling in cancer invasion. J. Cell. Physiol. 2010, 223, 14–26. [Google Scholar] [CrossRef] [PubMed]
- Liu, W.; Kovacevic, Z.; Peng, Z.; Jin, R.; Wang, P.; Yue, F.; Zheng, M.; Huang, M.L.; Jansson, P.J.; Richardson, V.; et al. The molecular effect of metastasis suppressors on Src signaling and tumorigenesis: New therapeutic targets. Oncotarget 2015, 6, 35522–35541. [Google Scholar] [CrossRef] [PubMed]
- Nam, K.; Oh, S.; Lee, K.M.; Yoo, S.A.; Shin, I. CD44 regulates cell proliferation, migration, and invasion via modulation of c-Src transcription in human breast cancer cells. Cell. Signal. 2015, 27, 1882–1894. [Google Scholar] [CrossRef] [PubMed]
- Patel, A.; Sabbineni, H.; Clarke, A.; Somanath, P.R. Novel roles of Src in cancer cell epithelial-to-mesenchymal transition, vascular permeability, microinvasion and metastasis. Life Sci. 2016, 157, 52–61. [Google Scholar] [CrossRef] [PubMed]
- Paladino, D.; Yue, P.; Furuya, H.; Acoba, J.; Rosser, C.J.; Turkson, J. A novel nuclear Src and p300 signaling axis controls migratory and invasive behavior in pancreatic cancer. Oncotarget 2016, 6, 7253–7267. [Google Scholar] [CrossRef]
- Urciuoli, E.; Coletta, I.; Rizzuto, E.; De Vito, R.; Petrini, S.; D’Oria, V.; Pezzullo, M.; Milano, G.M.; Cozza, R.; Locatelli, F.; et al. Src nuclear localization and its prognostic relevance in human osteosarcoma. J. Cell. Physiol. 2018, 2, 1658–1670. [Google Scholar] [CrossRef]
- Takahashi, A.; Obata, Y.; Fukumoto, Y.; Nakayama, Y.; Kasahara, K.; Kuga, T.; Higashiyama, Y.; Saito, T.; Yokoyama, K.K.; Yamaguchi, N. Nuclear localization of Src-family tyrosine kinases is required for growth factor-induced euchromatinization. Exp. Cell Res. 2009, 7, 1117–1141. [Google Scholar] [CrossRef]
- Pyle, L.C.; Nathanson, K.L. Genetic changes associated with testicular cancer susceptibility. Semin. Oncol. 2016, 43, 575–581. [Google Scholar] [CrossRef]
- Schaffrath, J.; Schmoll, H.J.; Voigt, W.; Muller, L.P.; Muller-Tidow, C.; Mueller, T. Efficacy of targeted drugs in germ cell cancer cell lines with differential cisplatin sensitivity. PLoS ONE 2017, 12, e0178930. [Google Scholar] [CrossRef]
- Mostert, M.C.; Verkerk, A.J.; van de Pol, M.; Heighway, J.; Marynen, P.; Rosenberg, C.; van Kessel, A.G.; van Echten, J.; de Jong, B.; Oosterhuis, J.W.; et al. Identification of the critical region of 12p over-representation in testicular germ cell tumors of adolescents and adults. Oncogene 1998, 16, 2617–2627. [Google Scholar] [CrossRef]
- Rodriguez, S.; Jafer, O.; Goker, H.; Summersgill, B.M.; Zafarana, G.; Gillis, A.J.; van Gurp, R.J.; Oosterhuis, J.W.; Lu, Y.J.; Huddart, R.; et al. Expression profile of genes from 12p in testicular germ cell tumors of adolescents and adults associated with i(12p) and amplification at 12p11.2-p12.1. Oncogene 2003, 22, 1880–1891. [Google Scholar] [CrossRef] [PubMed]
- Rosenberg, C.; Van Gurp, R.J.; Geelen, E.; Oosterhuis, J.W.; Looijenga, L.H. Overrepresentation of the short arm of chromosome 12 is related to invasive growth of human testicular seminomas and nonseminomas. Oncogene 2000, 19, 5858–5862. [Google Scholar] [CrossRef] [PubMed]
- Van Echten, J.; Oosterhuis, J.W.; Looijenga, L.H.; van de Pol, M.; Wiersema, J.; te Meerman, G.J.; Schaffordt Koops, H.; Sleijfer, D.T.; de Jong, B. No recurrent structural abnormalities apart from i(12p) in primary germ cell tumors of the adult testis. Genes Chromosomes Cancer 1995, 14, 133–144. [Google Scholar] [CrossRef] [PubMed]
- Zafarana, G.; Grygalewicz, B.; Gillis, A.J.; Vissers, L.E.; van de Vliet, W.; van Gurp, R.J.; Stoop, H.; Debiec-Rychter, M.; Oosterhuis, J.W.; van Kessel, A.G.; et al. 12p-amplicon structure analysis in testicular germ cell tumors of adolescents and adults by array CGH. Oncogene 2003, 22, 7695–7701. [Google Scholar] [CrossRef] [PubMed]
- Mostert, M.M.; van de Pol, M.; Olde Weghuis, D.; Suijkerbuijk, R.F.; Geurts van Kessel, A.; van Echten, J.; Oosterhuis, J.W.; Looijenga, L.H. Comparative genomic hybridization of germ cell tumors of the adult testis: Confirmation of karyotypic findings and identification of a 12p-amplicon. Cancer Genet. Cytogenet. 1996, 89, 146–152. [Google Scholar] [CrossRef]
- Kawakami, T.; Okamoto, K.; Sugihara, H.; Hattori, T.; Reeve, A.E.; Ogawa, O.; Okada, Y. The MET proto-oncogene is not a major target for the gain of chromosome 7 in testicular germ-cell tumors of adolescents. Virchows Arch. 2004, 444, 480–481. [Google Scholar] [CrossRef] [PubMed]
- Shen, H.; Shih, J.; Hollern, D.P.; Wang, L.; Bowlby, R.; Tickoo, S.K.; Thorsson, V.; Mungall, A.J.; Newton, Y.; Hegde, A.M.; et al. Integrated Molecular Characterization of Testicular Germ Cell Tumors. Cell Rep. 2018, 23, 3392–3406. [Google Scholar] [CrossRef] [PubMed]
- Aoun, F.; Kourie, H.R.; Albisinni, S.; Roumeguere, T. Will Testicular Germ Cell Tumors Remain Untargetable? Target Oncol. 2016, 11, 711–721. [Google Scholar] [CrossRef] [PubMed]
- Selfe, J.; Goddard, N.C.; McIntyre, A.; Taylor, K.R.; Renshaw, J.; Popov, S.D.; Thway, K.; Summersgill, B.; Huddart, R.A.; Gilbert, D.C.; et al. IGF1R signalling in testicular germ cell tumour cells impacts on cell survival and acquired cisplatin resistance. J. Pathol. 2018, 244, 242–253. [Google Scholar] [CrossRef] [PubMed]
- Nitzsche, B.; Gloesenkamp, C.; Schrader, M.; Hoffmann, B.; Zengerling, F.; Balabanov, S.; Honecker, F.; Hopfner, M. Anti-tumour activity of two novel compounds in cisplatin-resistant testicular germ cell cancer. Br. J. Cancer 2012, 107, 1853–1863. [Google Scholar] [CrossRef]
- Viticchie, G.; Muller, P.A.J. c-Met and Other Cell Surface Molecules: Interaction, Activation and Functional Consequences. Biomedicines 2015, 3, 46–70. [Google Scholar] [CrossRef] [PubMed]
- Martin, G.S. The hunting of the Src. Nat. Rev. Mol. Cell Biol. 2001, 2, 467–475. [Google Scholar] [CrossRef] [PubMed]
- Abram, C.L.; Courtneidge, S.A. Src family tyrosine kinases and growth factor signaling. Exp. Cell Res. 2000, 254, 1–13. [Google Scholar] [CrossRef] [PubMed]
- Bromann, P.A.; Korkaya, H.; Courtneidge, S.A. The interplay between Src family kinases and receptor tyrosine kinases. Oncogene 2004, 23, 7957–7968. [Google Scholar] [CrossRef]
- Amanchy, R.; Zhong, J.; Hong, R.; Kim, J.H.; Gucek, M.; Cole, R.N.; Molina, H.; Pandey, A. Identification of c-Src tyrosine kinase substrates in platelet-derived growth factor receptor signaling. Mol. Oncol. 2009, 3, 439–450. [Google Scholar] [CrossRef] [PubMed]


© 2019 by the authors. Licensee MDPI, Basel, Switzerland. This article is an open access article distributed under the terms and conditions of the Creative Commons Attribution (CC BY) license (http://creativecommons.org/licenses/by/4.0/).
Share and Cite
Leonetti, E.; Gesualdi, L.; Corano Scheri, K.; Dinicola, S.; Fattore, L.; Masiello, M.G.; Cucina, A.; Mancini, R.; Bizzarri, M.; Ricci, G.; et al. c-Src Recruitment is Involved in c-MET-Mediated Malignant Behaviour of NT2D1 Non-Seminoma Cells. Int. J. Mol. Sci. 2019, 20, 320. https://doi.org/10.3390/ijms20020320
Leonetti E, Gesualdi L, Corano Scheri K, Dinicola S, Fattore L, Masiello MG, Cucina A, Mancini R, Bizzarri M, Ricci G, et al. c-Src Recruitment is Involved in c-MET-Mediated Malignant Behaviour of NT2D1 Non-Seminoma Cells. International Journal of Molecular Sciences. 2019; 20(2):320. https://doi.org/10.3390/ijms20020320
Chicago/Turabian StyleLeonetti, Erica, Luisa Gesualdi, Katia Corano Scheri, Simona Dinicola, Luigi Fattore, Maria Grazia Masiello, Alessandra Cucina, Rita Mancini, Mariano Bizzarri, Giulia Ricci, and et al. 2019. "c-Src Recruitment is Involved in c-MET-Mediated Malignant Behaviour of NT2D1 Non-Seminoma Cells" International Journal of Molecular Sciences 20, no. 2: 320. https://doi.org/10.3390/ijms20020320
APA StyleLeonetti, E., Gesualdi, L., Corano Scheri, K., Dinicola, S., Fattore, L., Masiello, M. G., Cucina, A., Mancini, R., Bizzarri, M., Ricci, G., & Catizone, A. (2019). c-Src Recruitment is Involved in c-MET-Mediated Malignant Behaviour of NT2D1 Non-Seminoma Cells. International Journal of Molecular Sciences, 20(2), 320. https://doi.org/10.3390/ijms20020320