Article

Gene Expression Profiling Reveals Enhanced Defense Responses in an Invasive Weed Compared to Its Native Congener During Pathogenesis

1
Institute of Environment and Ecology, Academy of Environmental Health and Ecological Security, Jiangsu University, Zhenjiang 212013, China
2
School of the Environment and Safety Engineering, Jiangsu University, Zhenjiang 212013, China
3
School of Biological, Earth and Environmental Sciences, University of New South Wales, Sydney, NSW 2052, Australia
4
Environmental Genomics Group, School of Biosciences, University of Birmingham, Birmingham B15 2TT, UK
5
The Royal Botanic Gardens and Domain Trust, Mrs Macquaries Road, Sydney, NSW 2000, Australia
6
The Robert H. Smith Institute of Plant Sciences and Genetics in Agriculture, The Robert H. Smith Faculty of Agriculture, Food and Environment, The Hebrew University of Jerusalem, Rehovot 761001, Israel
7
Institute of Agricultural Engineering, Jiangsu University, Xuefu Road 301, Zhenjiang 212013, China.
*
Authors to whom correspondence should be addressed.
Int. J. Mol. Sci. 2019, 20(19), 4916; https://doi.org/10.3390/ijms20194916
Submission received: 23 August 2019 / Revised: 24 September 2019 / Accepted: 1 October 2019 / Published: 3 October 2019
(This article belongs to the Special Issue Plant Genomics 2019)

Abstract

:
Invasive plants are a huge burden on the environment, and modify local ecosystems by affecting the indigenous biodiversity. Invasive plants are generally less affected by pathogens, although the underlying molecular mechanisms responsible for their enhanced resistance are unknown. We investigated expression profiles of three defense hormones (salicylic acid, jasmonic acid, and ethylene) and their associated genes in the invasive weed, Alternanthera philoxeroides, and its native congener, A. sessilis, after inoculation with Rhizoctonia solani. Pathogenicity tests showed significantly slower disease progression in A. philoxeroides compared to A. sessilis. Expression analyses revealed jasmonic acid (JA) and ethylene (ET) expressions were differentially regulated between A. philoxeroides and A. sessilis, with the former having prominent antagonistic cross-talk between salicylic acid (SA) and JA, and the latter showing weak or no cross-talk during disease development. We also found that JA levels decreased and SA levels increased during disease development in A. philoxeroides. Variations in hormonal gene expression between the invasive and native species (including interspecific differences in the strength of antagonistic cross-talk) were identified during R. solani pathogenesis. Thus, plant hormones and their cross-talk signaling may improve the resistance of invasive A. philoxeroides to pathogens, which has implications for other invasive species during the invasion process.

1. Introduction

Numerous plant species have been directly or indirectly introduced to new habitats as ornamentals, or as sources of food and fiber. However, many of these species have become invasive and pose a serious threat to agriculture, biodiversity and ecosystem function [1]. Following initial introduction, the spread of an invasive plant species could be further enhanced by global climate change (e.g., increasing CO2 emissions) [2,3]. Much of the previous research in invasion biology has focused on the ecological and evolutionary factors that contribute to plant invasions [4,5]. Due to the unavailability of genomic resources [6], the genetic factors underlying invasion success are still not well understood.
Invasive plants may encounter novel abiotic and biotic stresses across the introduction–naturalization–invasion continuum. These stresses can affect their survival and reproduction, and can act as barriers to plant invasion. Successful invasive plant species possess various attributes (such as rapid adaptation, fast growth and spread, or high fecundity), and have effective defenses against natural enemies, which allow them to overcome barriers to invasion [7,8]. Higher resistance against generalist herbivores and pathogens may benefit invasive plants more than non-invasive species in new regions [8,9]. The enemy release hypothesis (ERH) and the biotic resistance hypothesis (BRH) have been proposed to explain the success and limitations that invasive species experience based on studies of novel plant–natural enemy interactions [10,11]. The ERH proposes that exotic plants will be less impacted by natural enemies compared to their native range because they have escaped their specialist herbivores or pathogens [12]. Therefore, the success of invasive plants in new environments can be attributed to the allocation of resources from defense to growth to outcompete other plants (evolution of increased competitive ability hypothesis or EICA) [13]. There has been a lot of support for the ERH, including reduced impacts by herbivores on invasive plants [14,15,16], as well as reduced attacks by above ground fungal and soil pathogens [14,15,17,18,19,20]. In contrast, the BRH states that native enemies should limit the growth of exotic plants in new ranges [21]. Many studies support the BRH [11,22,23,24,25], while some studies support both the ERH and BRH [26,27].
The improved performance of invasive plants in a competitive environment to enemy attack may be due to genetic changes acquired during the invasion process [6,28]. The use of genomic and transcriptomic technologies could identify the genetic architecture underlying the success of invasive plant species. A recent transcriptomic study was used to compare the gene expression profiles of introduced (North American) and native (European) populations of the Canada thistle, Cirsium arvense, in response to nutrient deficiency and shading [29]. This study identified significant differences in R-protein mediated defense and expression pattern between introduced and native populations of C. arvense [29]. Similarly, in the common ragweed (Ambrosia artemisiifolia), an invasive species to Europe, candidate genes were identified using oligonucleotide microarrays under light and nutrient stress conditions that were thought to contribute to invasiveness [30]. In addition, weedy sunflower genotypes of Helianthus annuus naturalized in the USA were tested for variations in gene expression compared to wild non-weedy species [31]. This study found extensive genetic differentiation between the two species [31]. However, until now, only a few investigations have been undertaken to elucidate the genomic mechanisms responsible for the adaptation of invasive plants to biotic stresses.
Generally, a multitude of plant defense pathways are activated in response to microbial pathogens [32]. The first line of active defense occurs at the plant cell surface, when generalist microbe elicitors (the microbe or pathogen-associated molecular patterns, i.e., MAMP or PAMPs) are produced by pathogens such as, flagellin (from bacteria) [33], chitin (from fungal pathogens) [34], β-glucan (from oomycete pathogens) [35], or effectors (from specialized pathogens) [32]. Plants detect these elicitors by pattern-recognition receptors (PRRs) within the cell membrane, which leads to PAMP-triggered immunity (i.e., PTI) [36]. In the case of effectors, receptors with nucleotide-binding domains and leucine-rich repeats (NLRs or R genes) [37] are used, which lead to effector-triggered immunity (i.e., ETI) [38,39]. The evolutionary development of the plant immune system is represented as a Zig-zag model [40], where specialist pathogens often co-evolve with their host (see Han [41] for evolutionary dynamics between plants and pathogens). Invasive plants generally lack the need for defense against specialist pathogens in their new ranges (due to lack of co-evolution) [42] and therefore can invest more energy into growth or reproduction [12,13].
The timely recognition of the invading pathogen and a rapid, effective induction of defense responses are required for resistance to disease in plants [43]. Plant hormones play a key regulatory role in inducing defense responses shortly after the perception of a pathogen, through an extensive transcriptional reprogramming of genes involved in hormonal signaling [44]. In addition, the plant defense hormones play a critical role in response to adverse environmental conditions [45,46,47,48]. Abscisic acid (ABA) plays a central role in plant defense to abiotic stresses, such as salt and drought stress [49]. Salicylic acid (SA) is a major plant defense hormone induced by infections from biotrophic and hemi-biotrophic pathogens [50,51]. SA, jasmonic acid (JA), and ethylene (ET) also play key roles under biotic stresses [52]. These induced defenses and hormone signaling networks have been well characterized in model organisms and crop plants, such as Arabidopsis [53,54], tobacco [55] and tomato [56], but are not well known in invasive plants. For example, pyrosequencing was used to identify molecular signaling networks linked with paradormancy in underground vegetative buds of invasive Cirsium arvense. Interestingly, the plant hormone auxin and ABA-signaling was found to regulate paradormancy, allowing plants to resist weed control methods (e.g., chemical and biological controls), thereby enhancing their invasiveness [57]. Currently, there is a broad interest among invasion biologists to unravel the genetic mechanisms of resistance and defense responses of invasive plants. In this study, we hypothesize that invasive plant species have higher or enhanced resistance to microbial pathogens compared to native congeners. We also predict that the endogenous defense mechanism and signaling (especially the defense hormones SA, JA, and ET) play a crucial role in resistance, thereby benefiting the invasion success of invasive plants.
The alligator weed, Alternanthera philoxeroides (Martius) Grisebach, is an amphibious stoloniferous perennial herb [58]. It is native to South America [59] and was first introduced to China in the late 1930s as a forage crop from Japan [60]. It is the most noxious invasive plant in China [61,62] where it is a significant weed in rice farms, causing an estimated agricultural loss of $75 million per year [63]. Populations of A. philoxeroides growing in China have extremely low genetic diversity, which is attributed to the predominance of a single genotype (likely due to a single recent introduction) and extensive vegetative propagation by cuttings since being introduced [60,64].
Alternanthera philoxeroides is highly vulnerable to insect herbivore attack. For example, more than 15 generalist insects were found to feed on A. philoxeroides in China [11]. A specialist beetle, Agasicles hygrophila (alligator weed flea beetle) from South America was introduced to the USA [59] and China [11] to control A. philoxeroides. However, only a few disease incidences in A. philoxeroides have been reported. For example, species of Nimbya have been found to cause leaf and stem spot on A. philoxeroides in Australia [65]. Nimbya alternantherae has been identified as a biocontrol agent in Brazil [66], while species of Fusarium have been used as a biocontrol for alligator weed in China [67]. Rhizoctonia solani has been shown to be pathogenic to A. philoxeroides, and has also been found to infect a related species, Alternanthera sessilis, in the USA [68] and India [69]. Earlier preliminary pathogenicity screening tests showed that R. solani (ACCC 30374) is more virulent on A. philoxeroides compared to Fusarium oxysporum f.sp cubense (ACCC 36369) (SS Qi, unpublished data). Therefore, A. philoxeroides represents a good model to study pathogen resistance and defenses in an invasive plant species following invasion.
In this study, we aimed to isolate the defense hormones (SA, JA, and ET) and associated genes in invasive A. philoxeroides and its native congener A. sessilis to test for differences in gene expression between the species against a generalist necrotrophic fungus, Rhizoctonia solani. Although signaling of these defense hormones and their cross-talk in response to pathogens are well documented in Arabidopsis and other model plant species [53,54,55,56], our study is the first to examine these phenomena in wild populations of a co-occurring invasive and native congener pair. Furthermore, divergence in gene expression between the species may allow us to identify patterns of defense signaling that may be responsible for enhanced resistance in invasive A. philoxeroides. Specifically, we ask the following questions: (1) Is invasive A. philoxeroides less susceptible to the pathogen (R. solani) compared to its native congener A. sessilis? (2) Are there differences in gene expression between the native and invasive species after inoculation with R. solani? (3) Are there differences in resistance between infected and un-infected neighboring leaves? To address these questions, we performed in vitro and in planta leaf inoculations using R. solani. Six hormones and their responsive genes (three JA, two SA, and one ET) were successfully isolated from both invasive A. philoxeroides and native A. sessilis for expression analysis using RT-qPCR in response to three treatments. The first included R. solani inoculation for susceptibility tests, the second comprised un-infected samples for systemic resistance tests, and the third included hormone pretreatments using SA, JA, and ET (prior to inoculation with R. solani).

2. Results

2.1. Disease Development in A. philoxeroides Was Delayed Compared with A. sessilis

The pathogenicity of R. solani was tested on invasive A. philoxiroides and native A. sessilis. Disease symptoms and necrotic lesions developed on leaves of both plant species (Figure 1a). However, A. philoxiroides showed slower disease progression compared to A. sessilis (Figure 1a,b). Alternanthera sessilis exhibited prominent disease symptoms at 24 hpi, whereas A. philoxiroides had no visible symptoms and mycelium was only observed at the site of inoculation under the microscope, indicating minimal fungal colonization (Figure 1c). Necrotic lesions were noticeable only at 48 hpi in A. philoxiroides (Figure 1a).
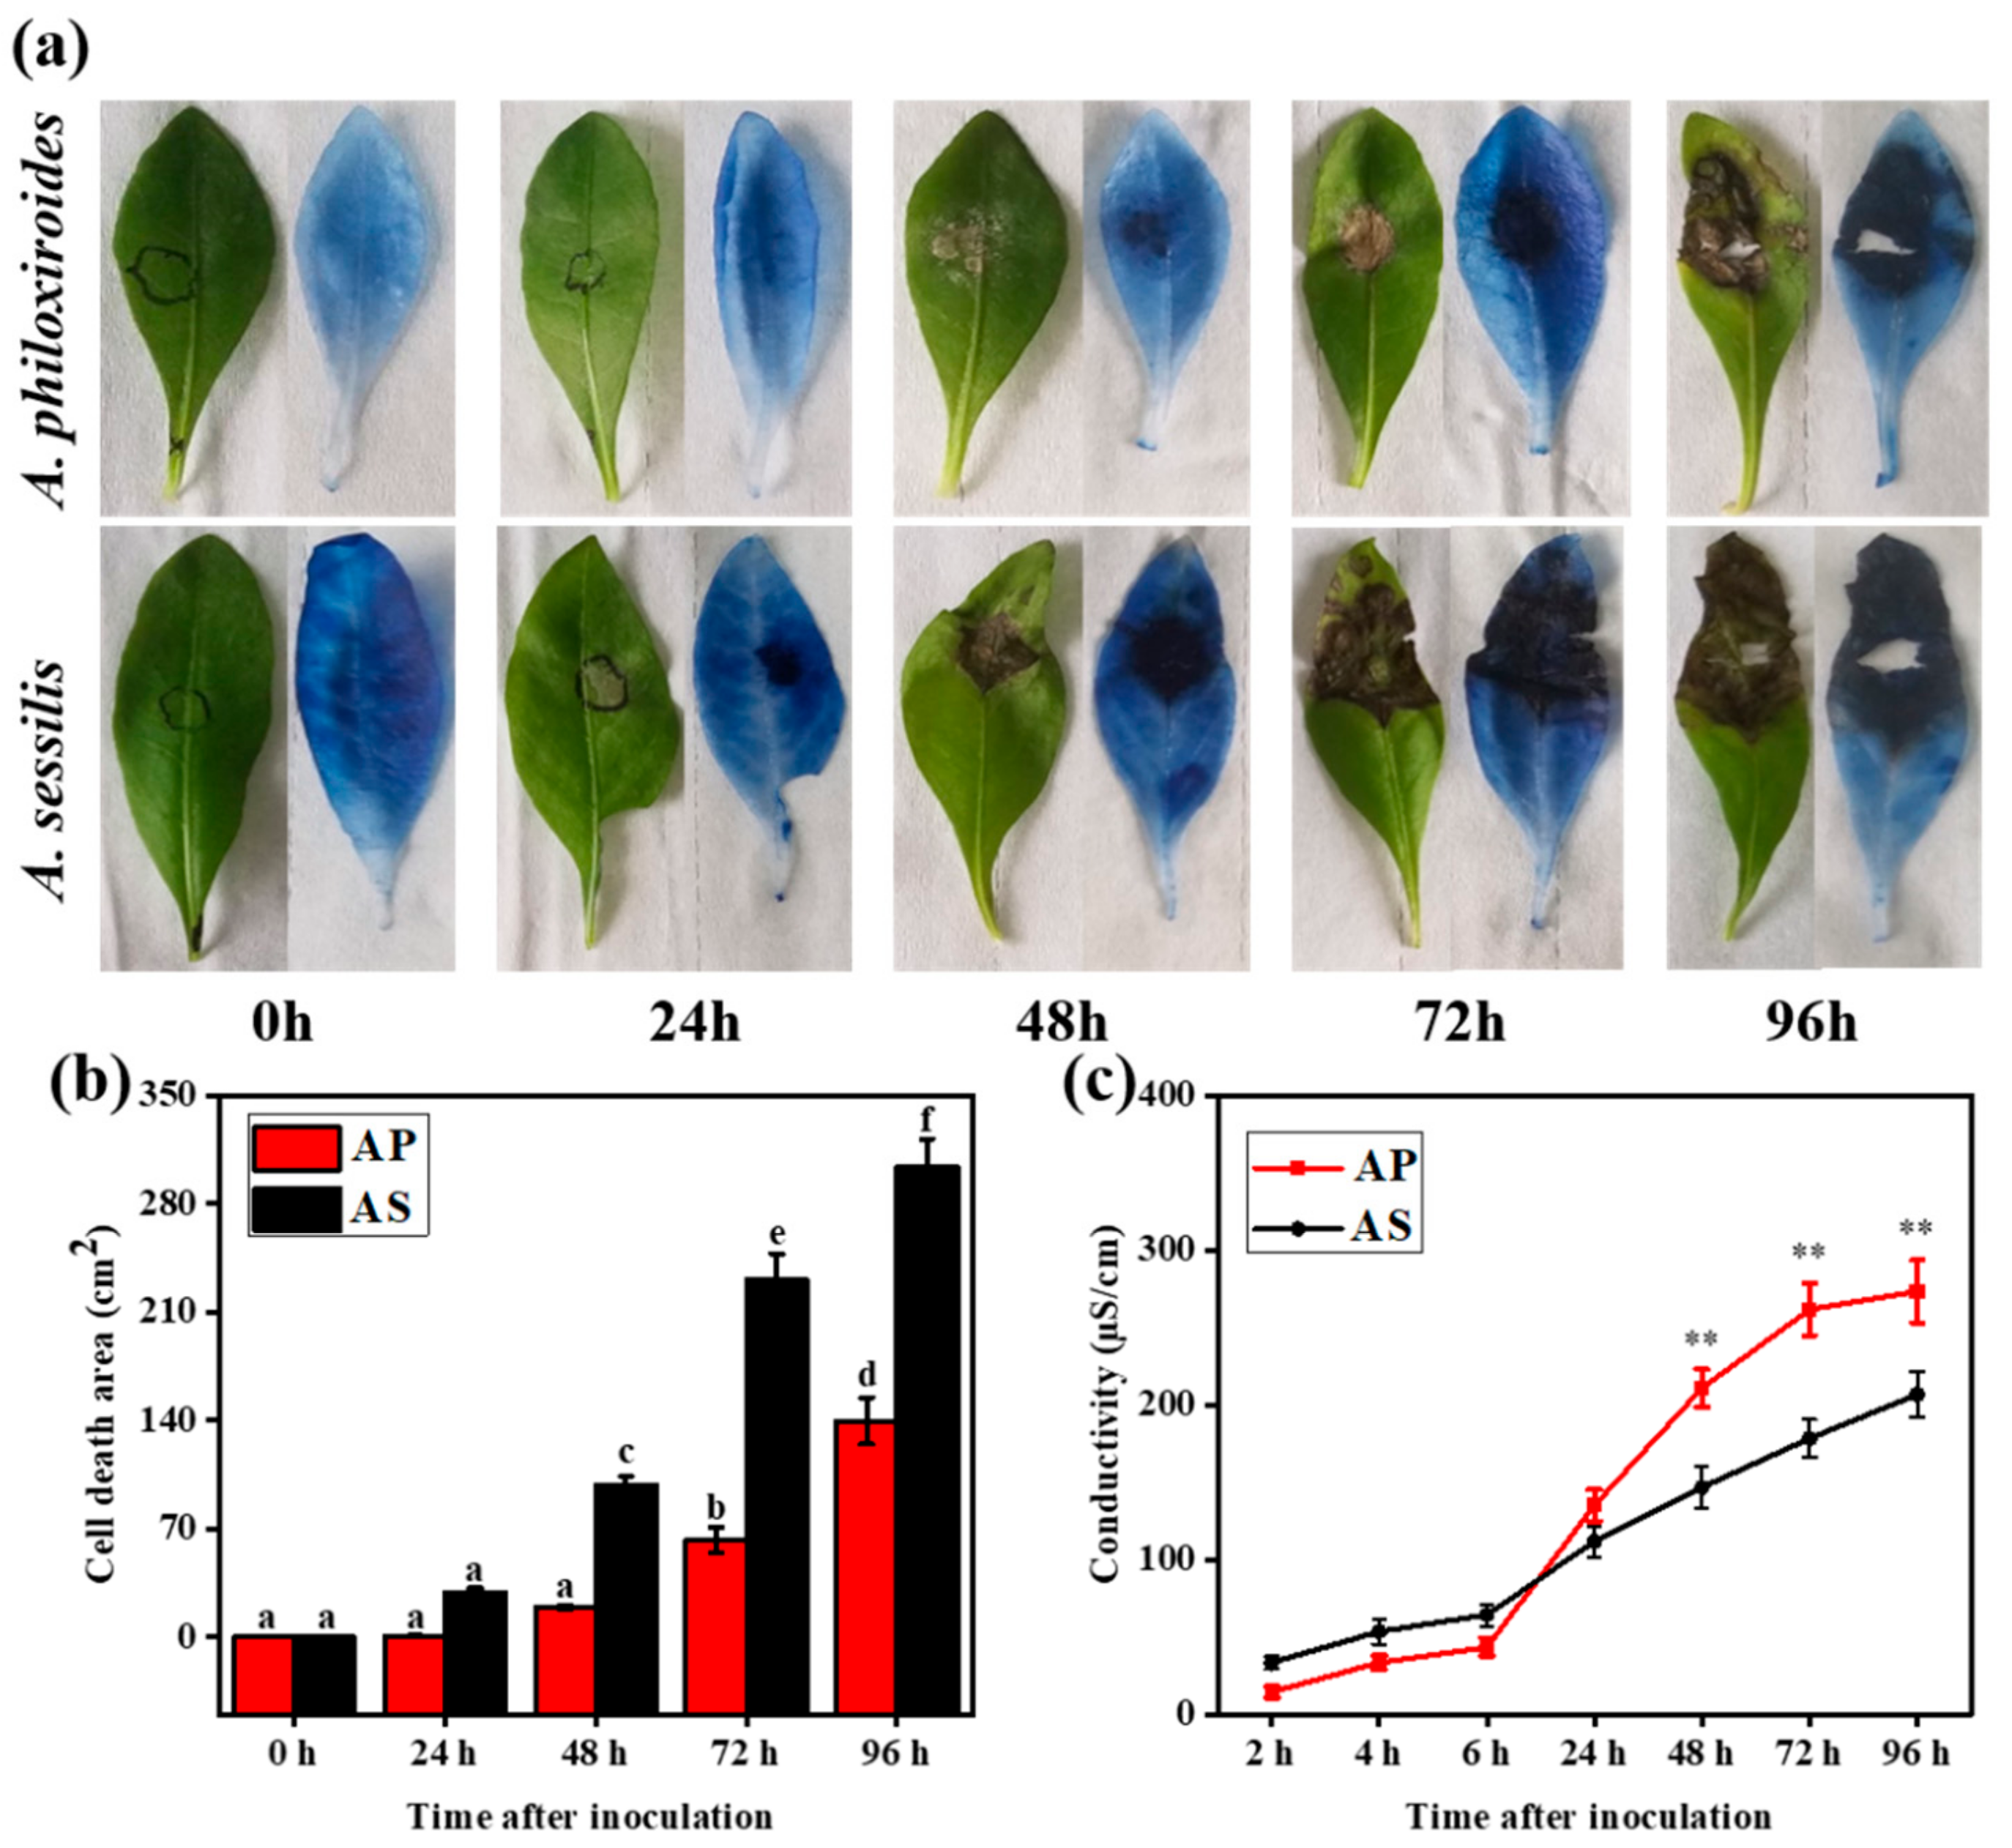
Infected leaves stained with trypan blue clearly highlighted the region of cell death on the leaves (Figure 2a). Alternanthera philoxiroides had a significantly lower cell death area compared to A. sessilis across all time intervals post-inoculation with R. solani (Figure 2b). Furthermore, the amount of ion leakage was significantly higher at earlier time periods (<24 hpi) in A. sessilis compared to A. philoxiroides, which showed higher leakages at a later time interval (>48 hpi; Figure 2c). Overall, these results suggest that, although both plants are susceptible to R. solani, the invasive A. philoxiroides showed slower disease progression compared to the native A. sessilis.

2.2. Expression Divergence of Defense Hormone Genes between A. philoxiroides and A. sessilis

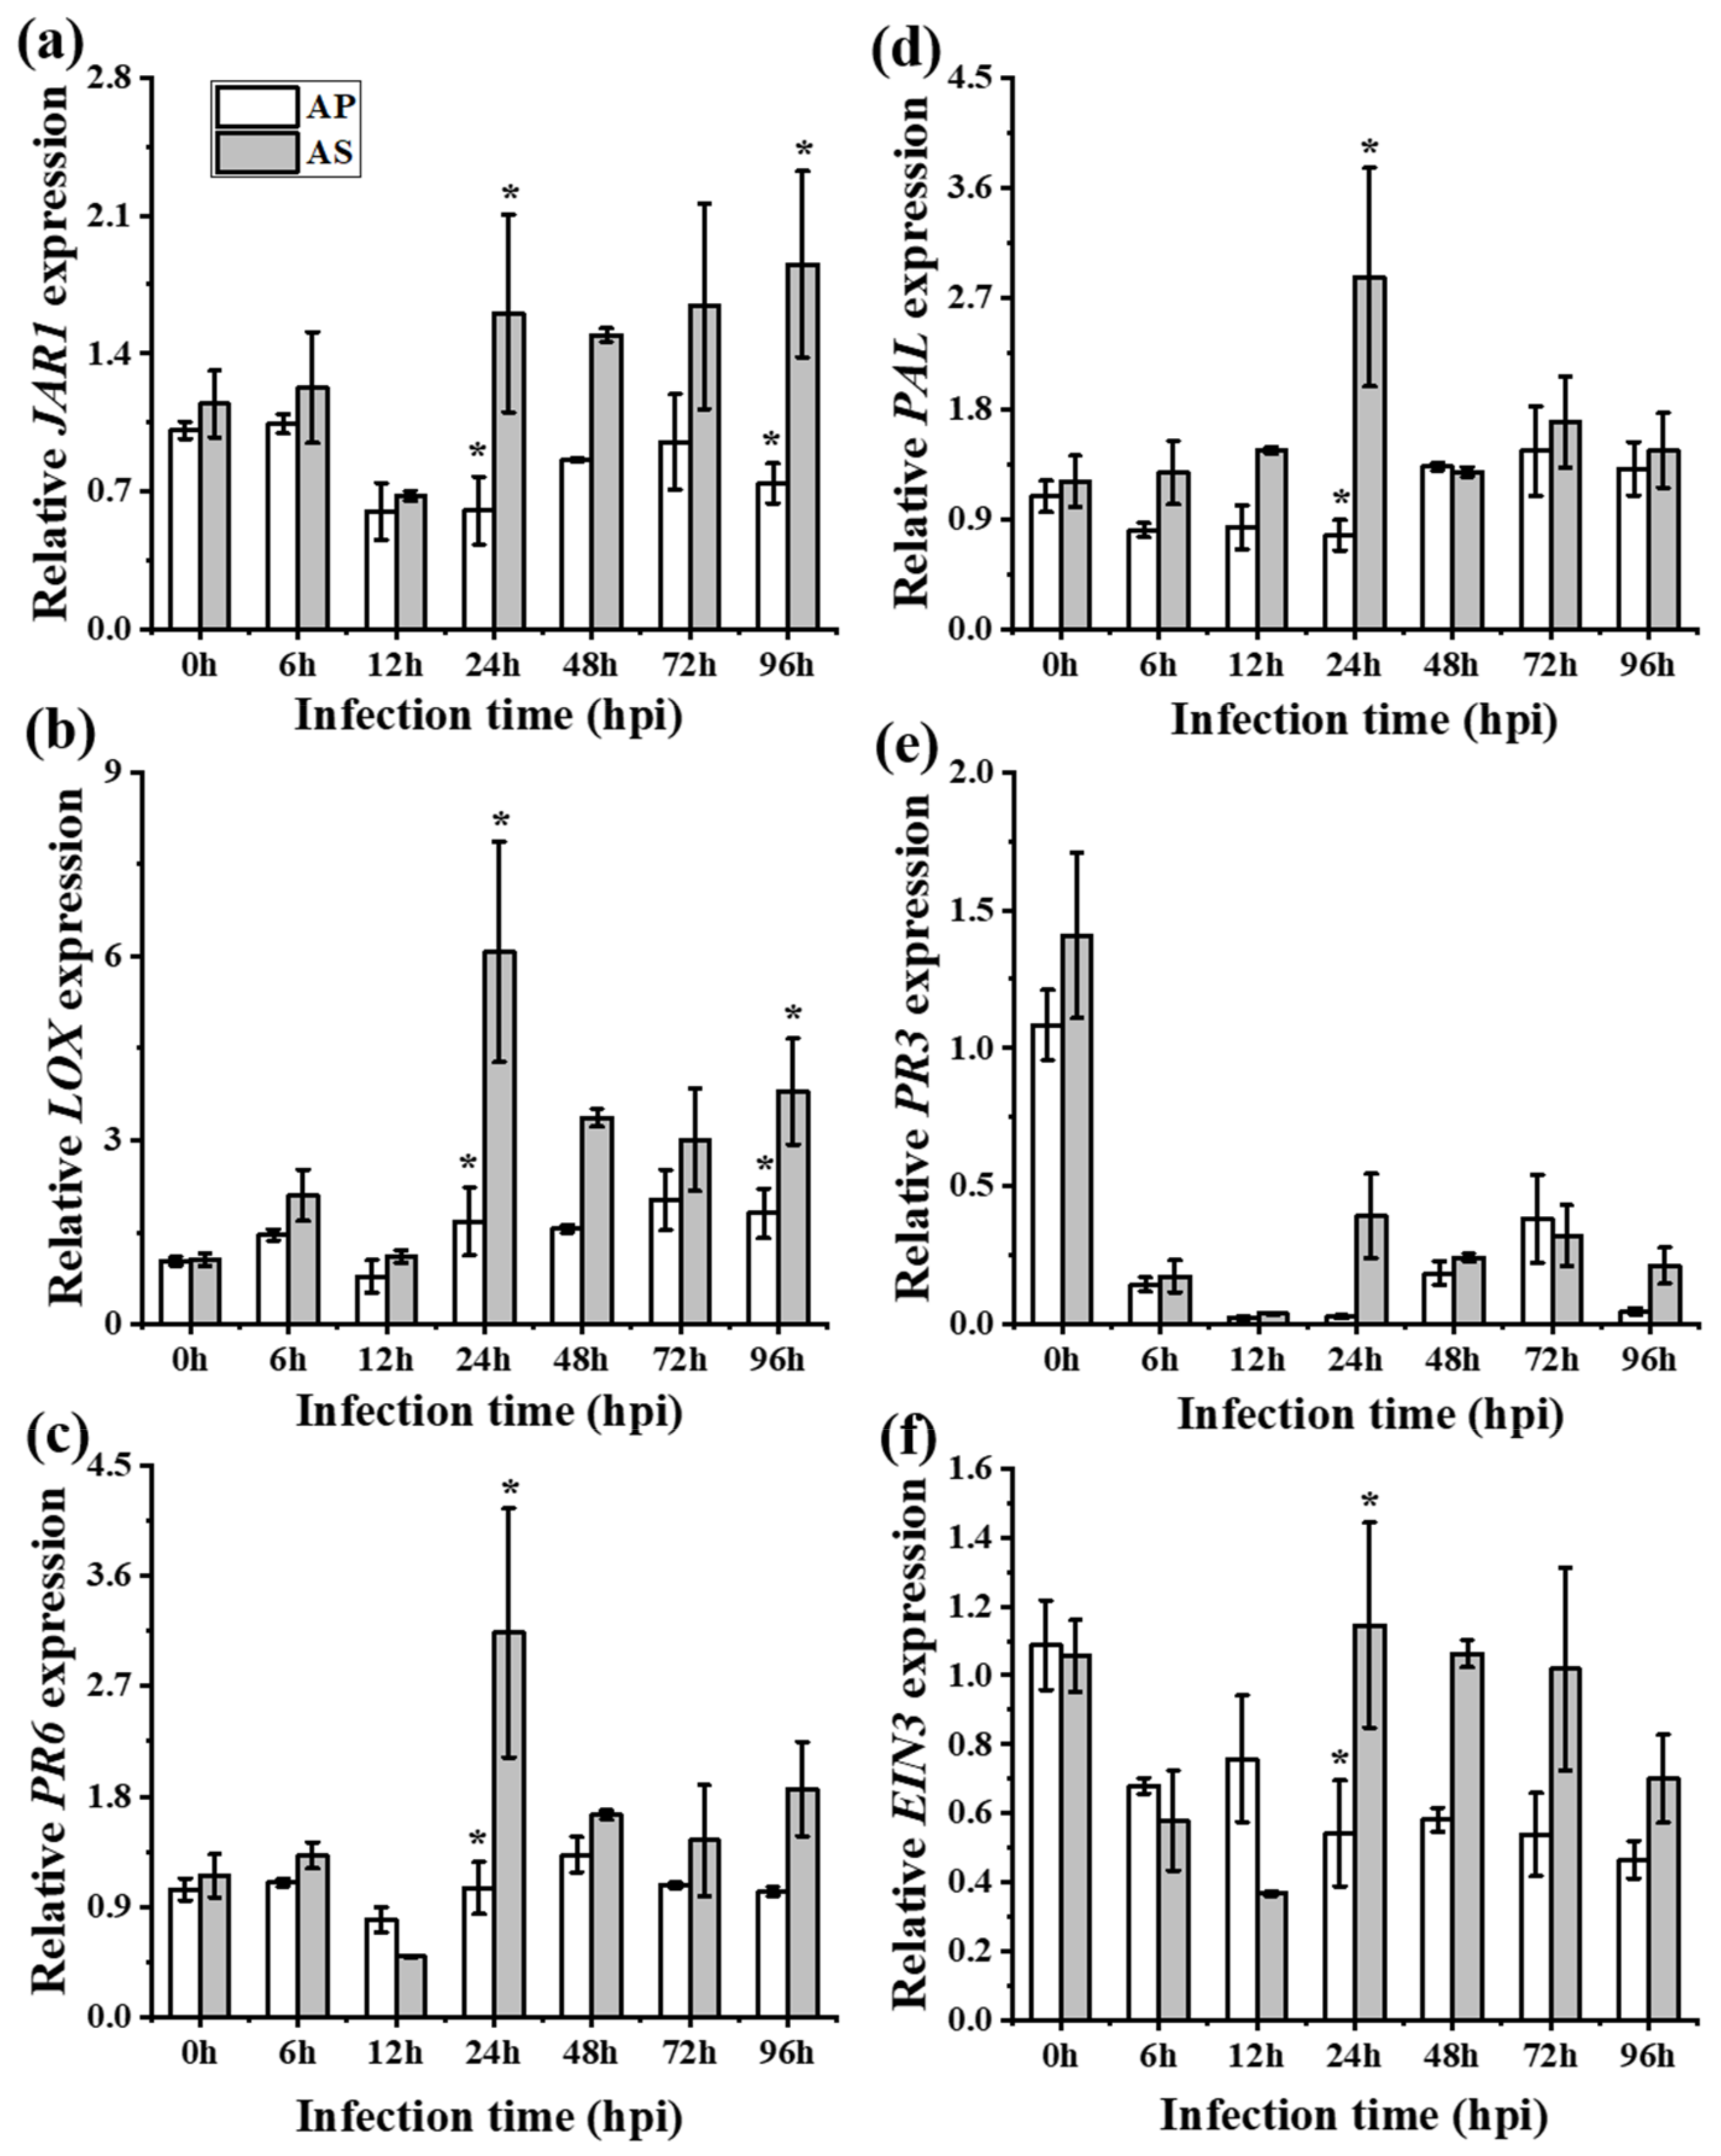
Expressions of all six genes (PAL, PR3, LOX, JAR1, PR6, and EIN3) were quantified in both the local and systemic leaves of the two species against R. solani (the fold–change ratio of defense hormones and their responsive genes are presented in Table S1). Expression differences were observed in both infected local (Figure 3) and systemic leaves (Figure 4), as well as the hormone content (Figure S1) between A. philoxiroides and A. sessilis during disease development caused by R. solani (Table 1 and Table S1). Furthermore, expression differences were also observed in the hormone pre-treatment group between the two species (Figure 5). The key difference was that JA and ET-signaling was differentially regulated in A. sessilis. JA was partially suppressed in A. sessilis, whereas there was a consistent reduction in expression in A. philoxiroides (Figure 3a,b). ET-EIN3 expression was reduced in A. sessilis but was induced in A. philoxiroides (Figure 3e). SA level was induced in both species (Figure 3c,d). In addition, weaker or no antagonistic cross-talk was observed between SA (Figure 3c,d) and JA-signaling (Figure 3a,b) in A. sessilis. In contrast, there was strong cross-talk in A. philoxiroides (Figure 3 and Table 1).

2.3. Functional Analysis of Defense Hormone Gene Sequences between A. philoxiroides and A. sessilis

Six hormones and responsive gene sequences of both invasive and native plants from our study (Table S3) were searched in the NCBI nucleotide database and their identity was checked against other plant species in the Amaranthaceae (Table S4). The output of each gene sequence was obtained to predict a high confidence protein coding sequence from six reading frames (Table S4). Furthermore, a gene from each hormone (PAL, JAR1, and EIN3) was selected on the basis of core signaling component for detailed functional analysis in both A. philoxiroides and A. sessilis. Each sequence was assembled to a single long contig to predict protein coding genes along with mRNA and the amino acid translation (Table S5). We aimed to compare each gene sequence with other closely related species in Amaranthaceae, and also to compare between A. philoxiroides and A. sessilis (Figures S2–S5). A comparative phylogenetic analysis of the three hormone genes revealed high conservation within Amaranthaceae (including Beta vulgaris and Spinacia oleracea, Figure S2). We predicted the conserved domains and motifs in each gene sequence and analyzed how conserved they were across species (see Figure S3 for motifs and Figure S4 for domains). We found that multiple sequence alignments of each amino acid sequence showed high levels of gene conservation between A. philoxiroides and A. sessilis, and high conservation between the two study species and other related species (Figure S5).

2.4. R. solani Suppresses Jasmonic Acid Signaling for Disease Promotion in A. philoxiroides

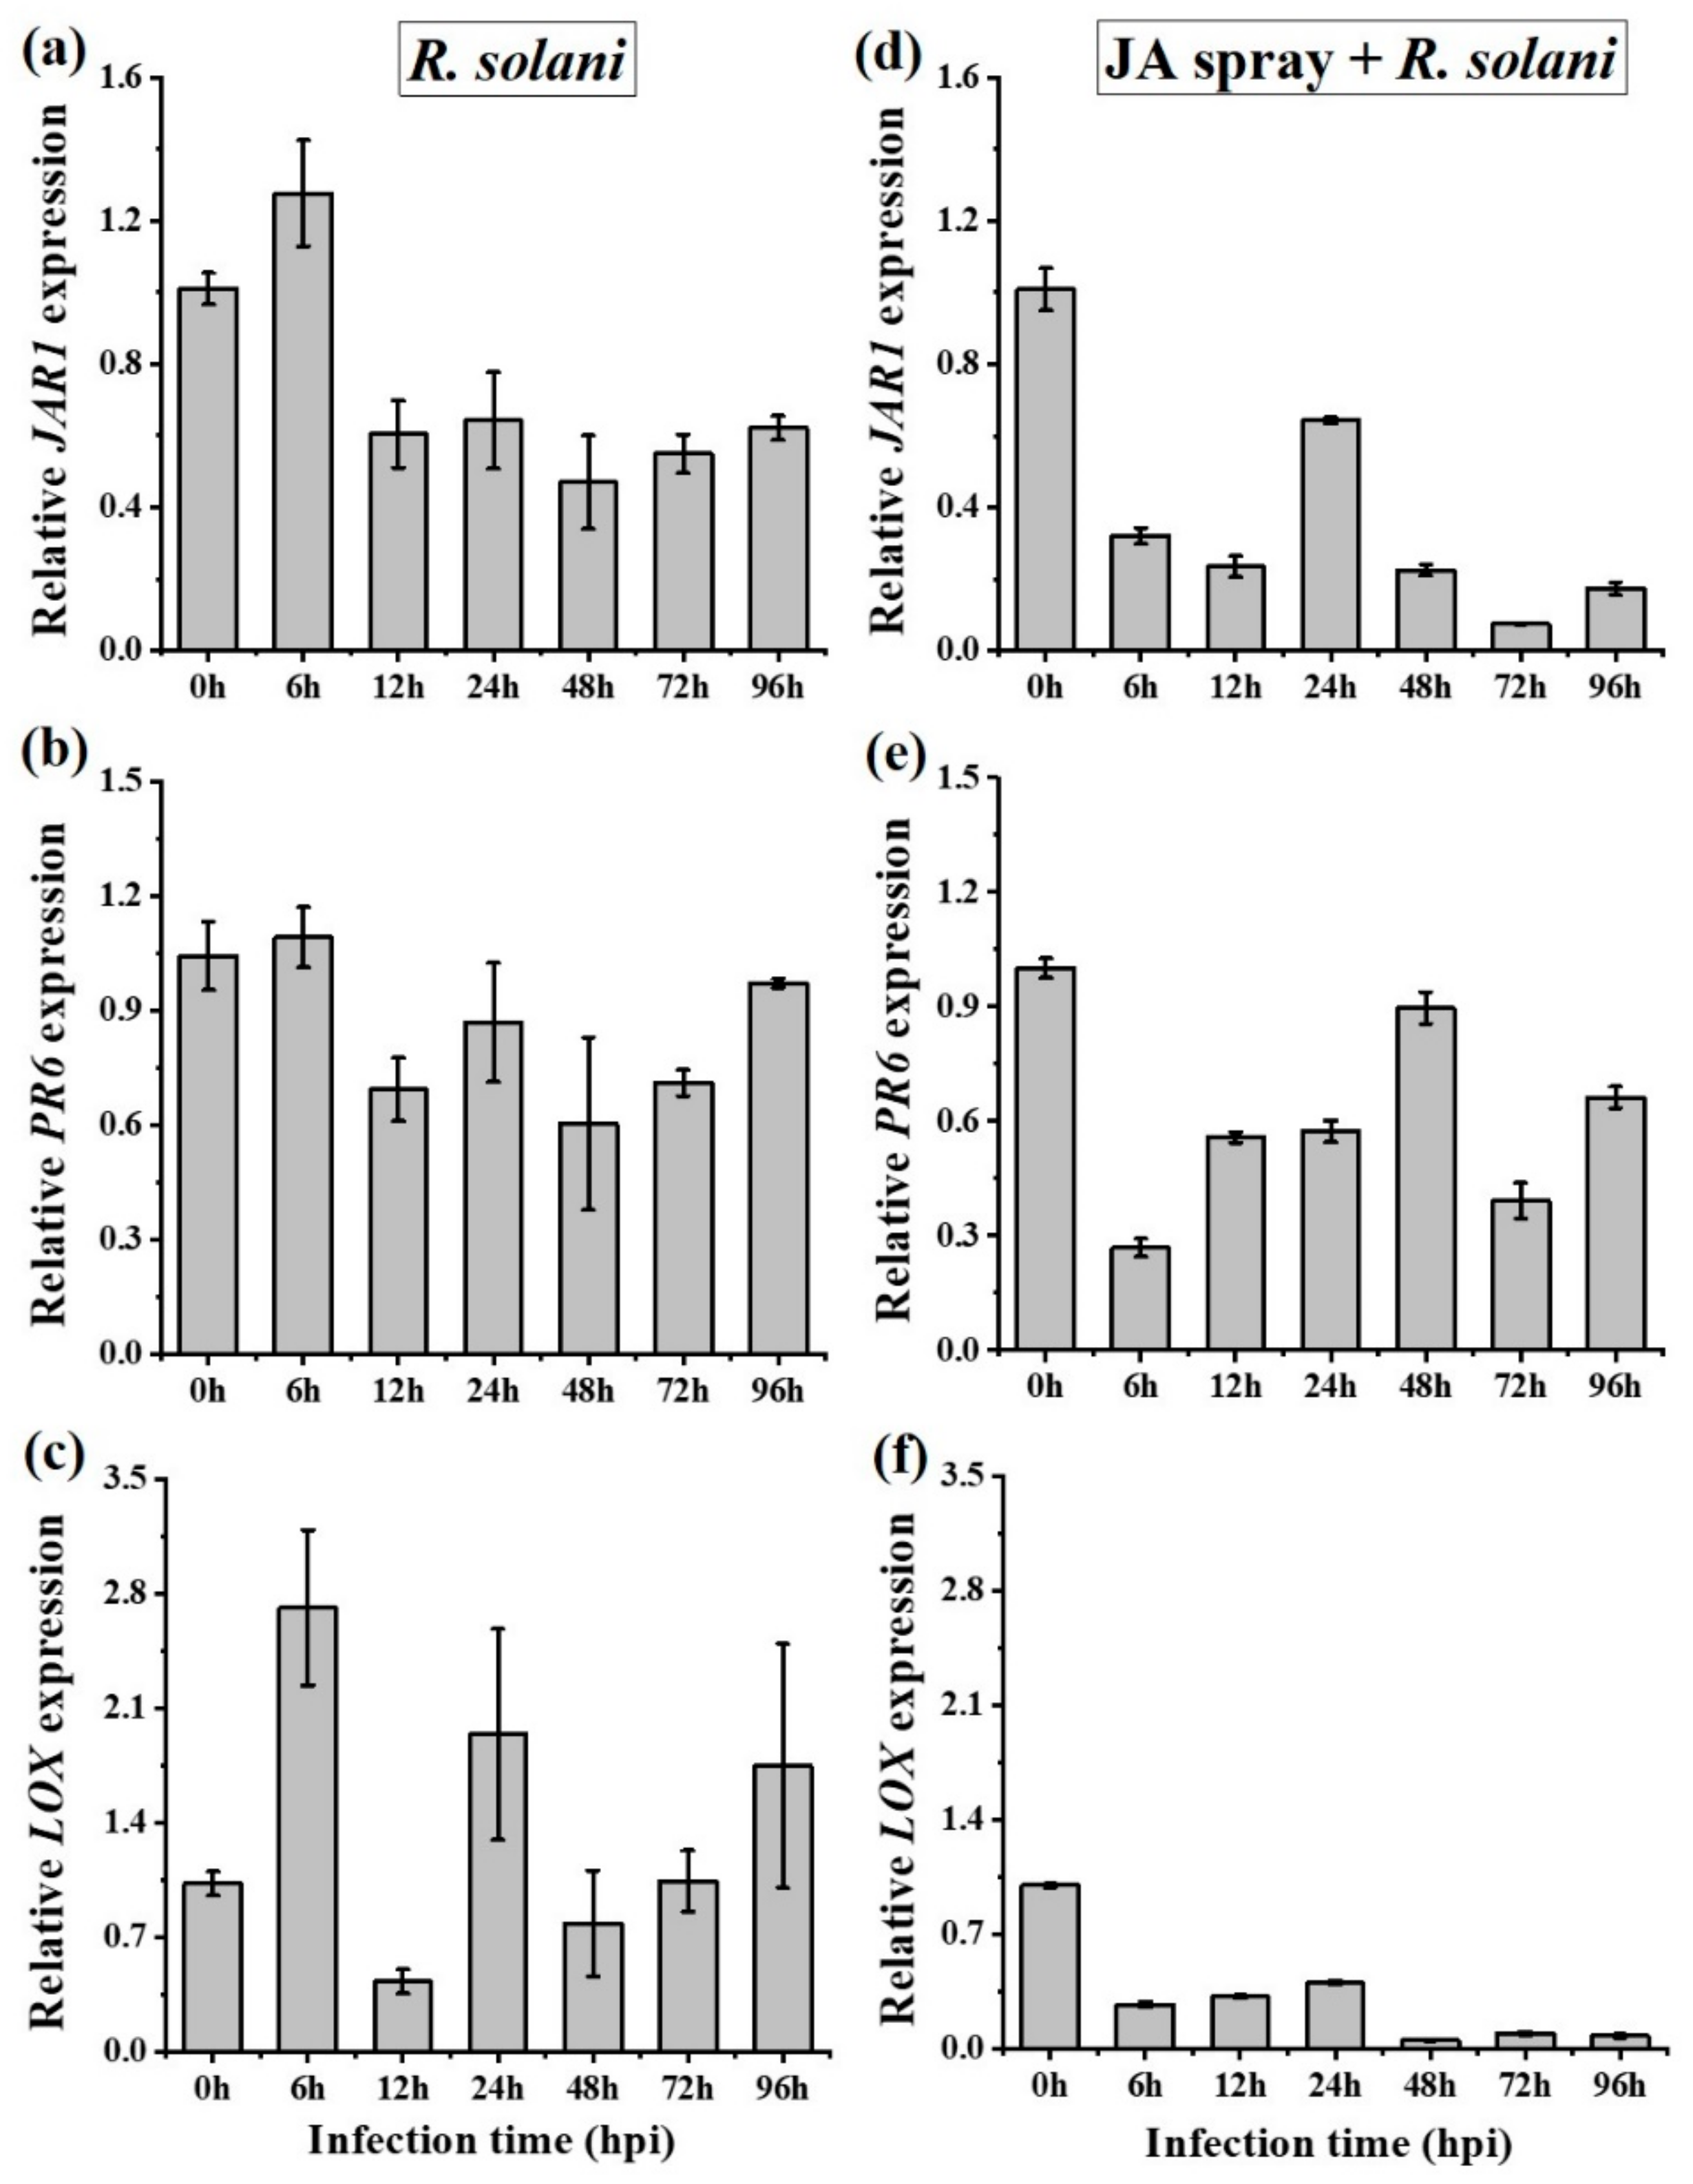
To examine the role of JA-signaling, expression levels of three JA-dependent transcripts, LOX (Lipoxygenase), JAR1 (JA amido synthetase 1), and PR6 (Proteinase inhibitor), were tested in A. philoxiroides following inoculation with R. solani. We found the expressions of JAR1 and PR6 were reduced in A. philoxiroides, whereas LOX expression was inconsistent at each time after inoculation (Figure 6a–c). At 6 hpi, all three (LOX, JAR1, and PR6) levels had increased (Figure 6a–c; Table S1). Plants subjected to the MeJA hormone pretreatment also showed reduced expressions across all three JA genes at all time intervals (Figure 6d–f). Overall, our results suggest that JA signaling may be responsible for resistance to R. solani in A. philoxiroides because JA was induced earlier (up to 6 hpi). During disease progression (after 48 hpi), R. solani may overcome JA-resistance signaling by suppressing the defensive responses in A. philoxiroides (Figure 6).

2.5. Salicylic Acid and Ethylene Signaling Enhances Disease Susceptibility in A. philoxiroides

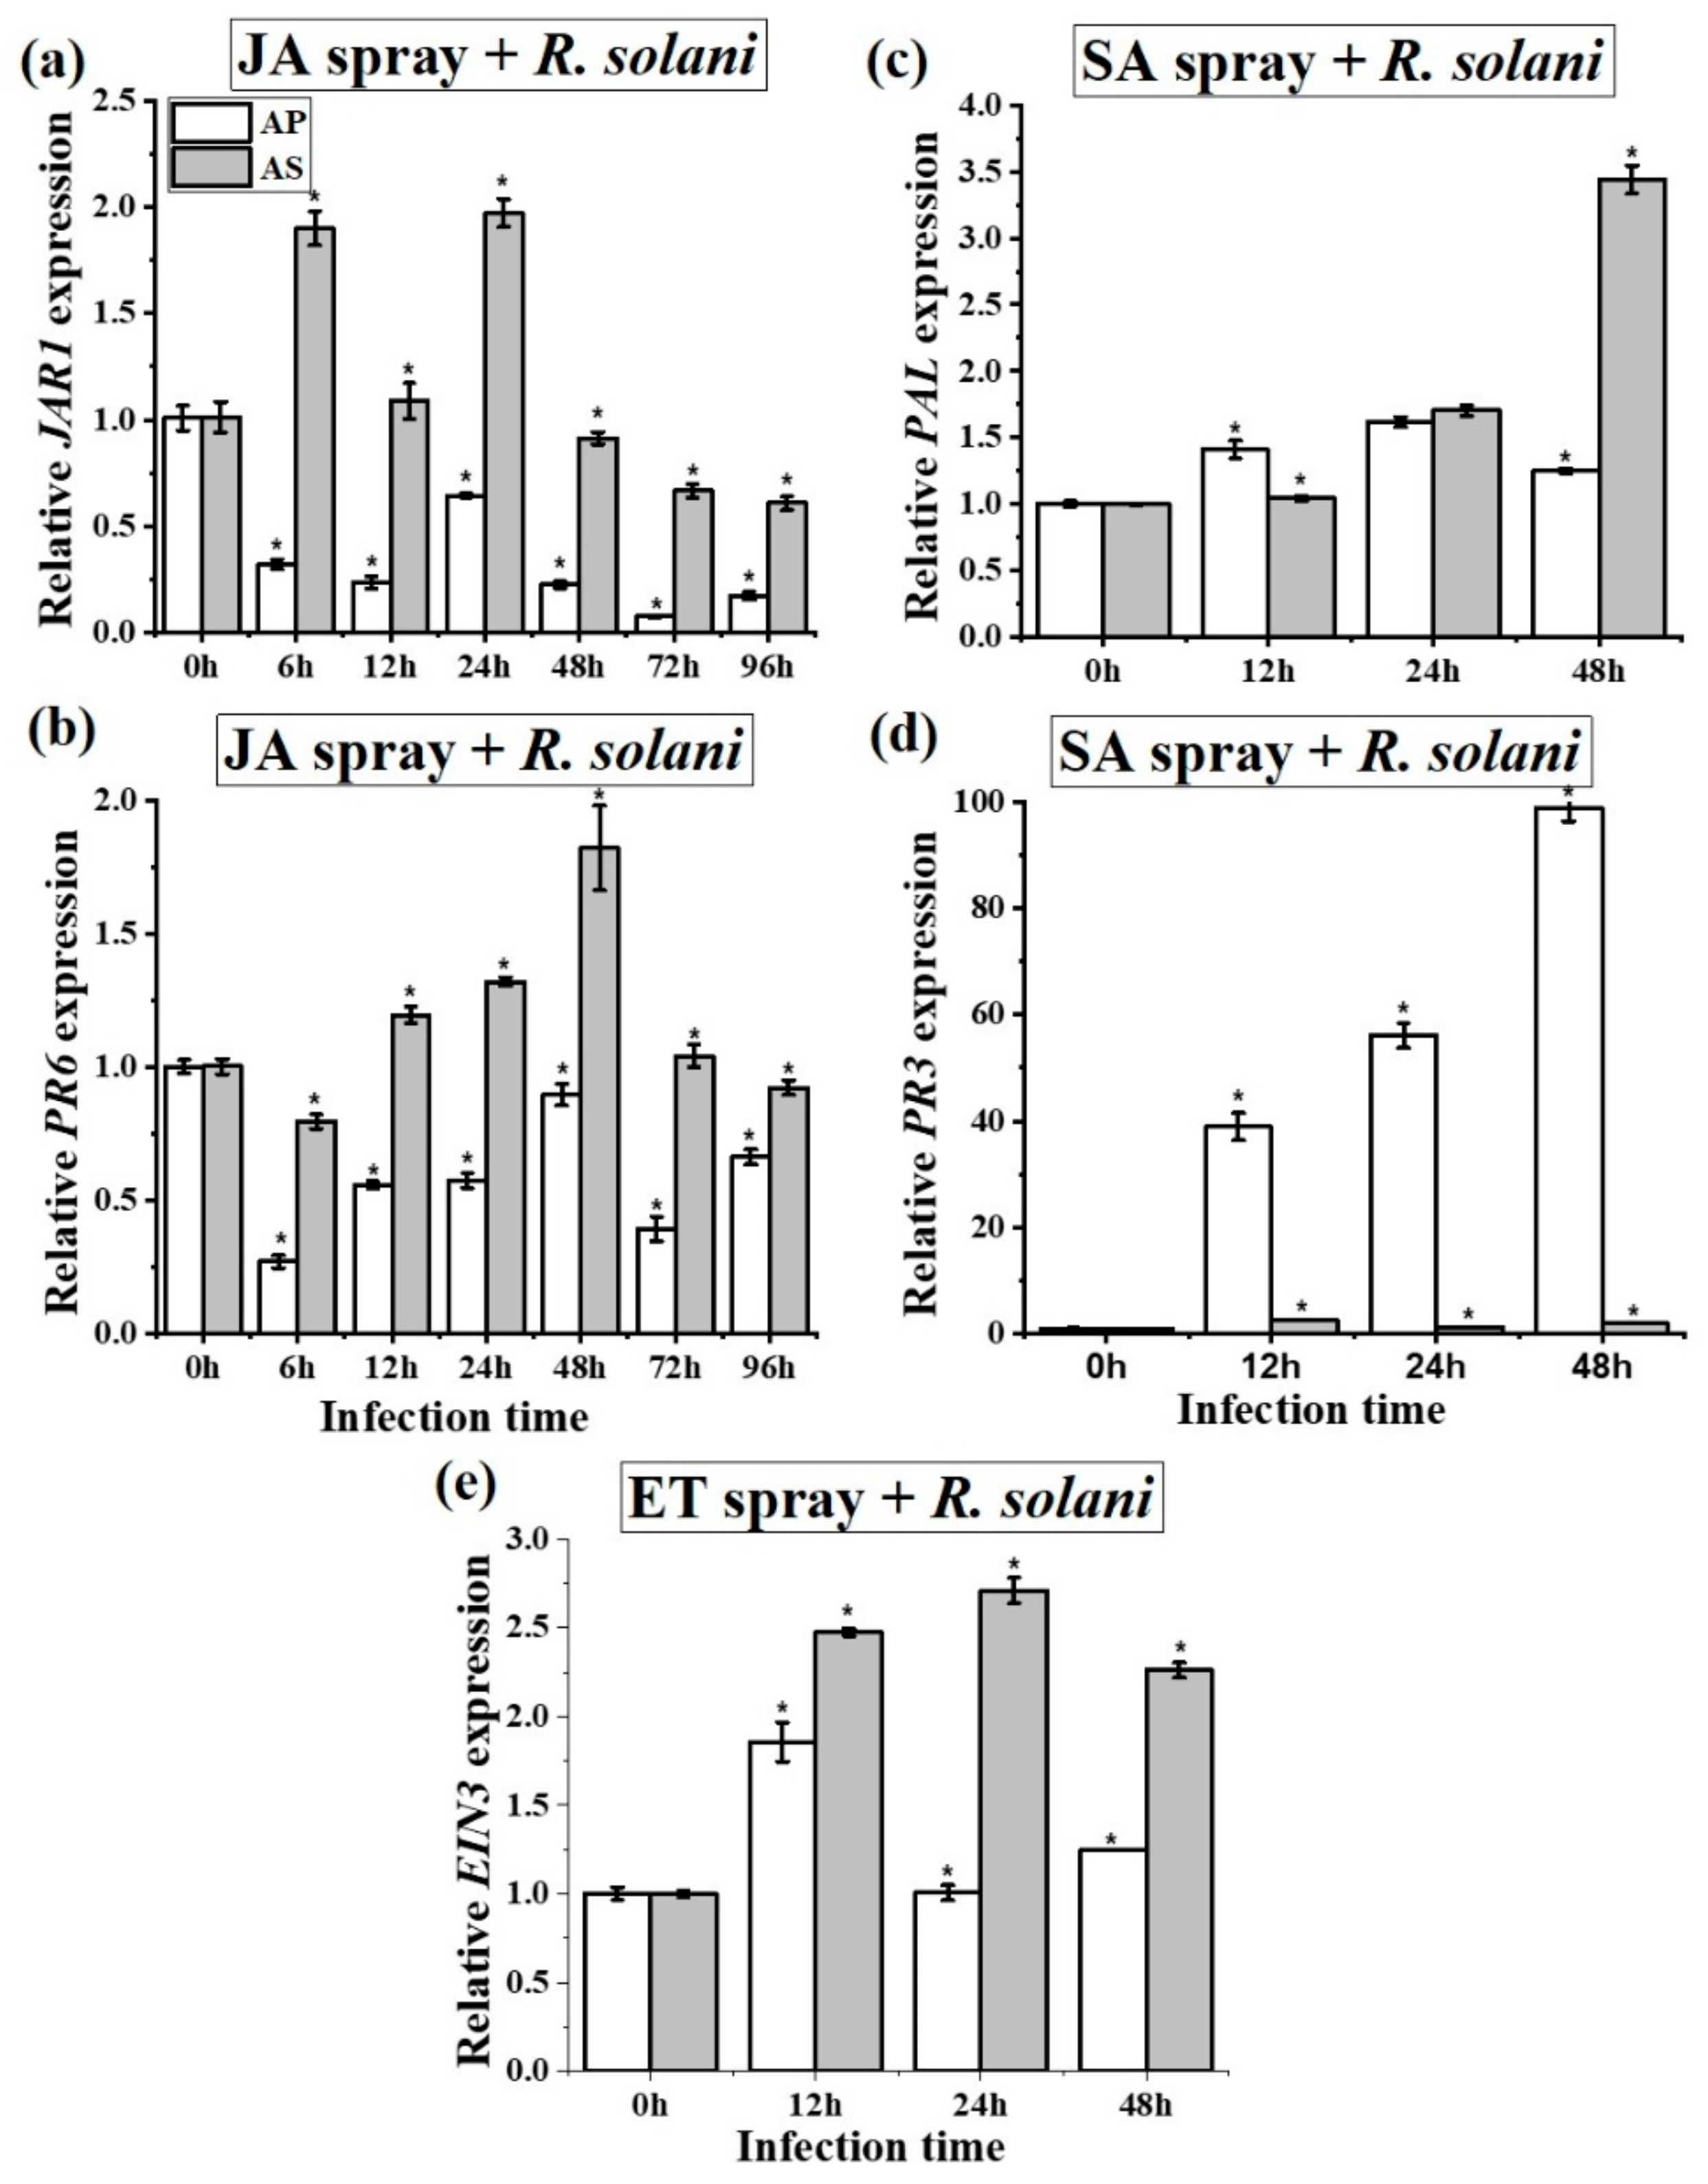
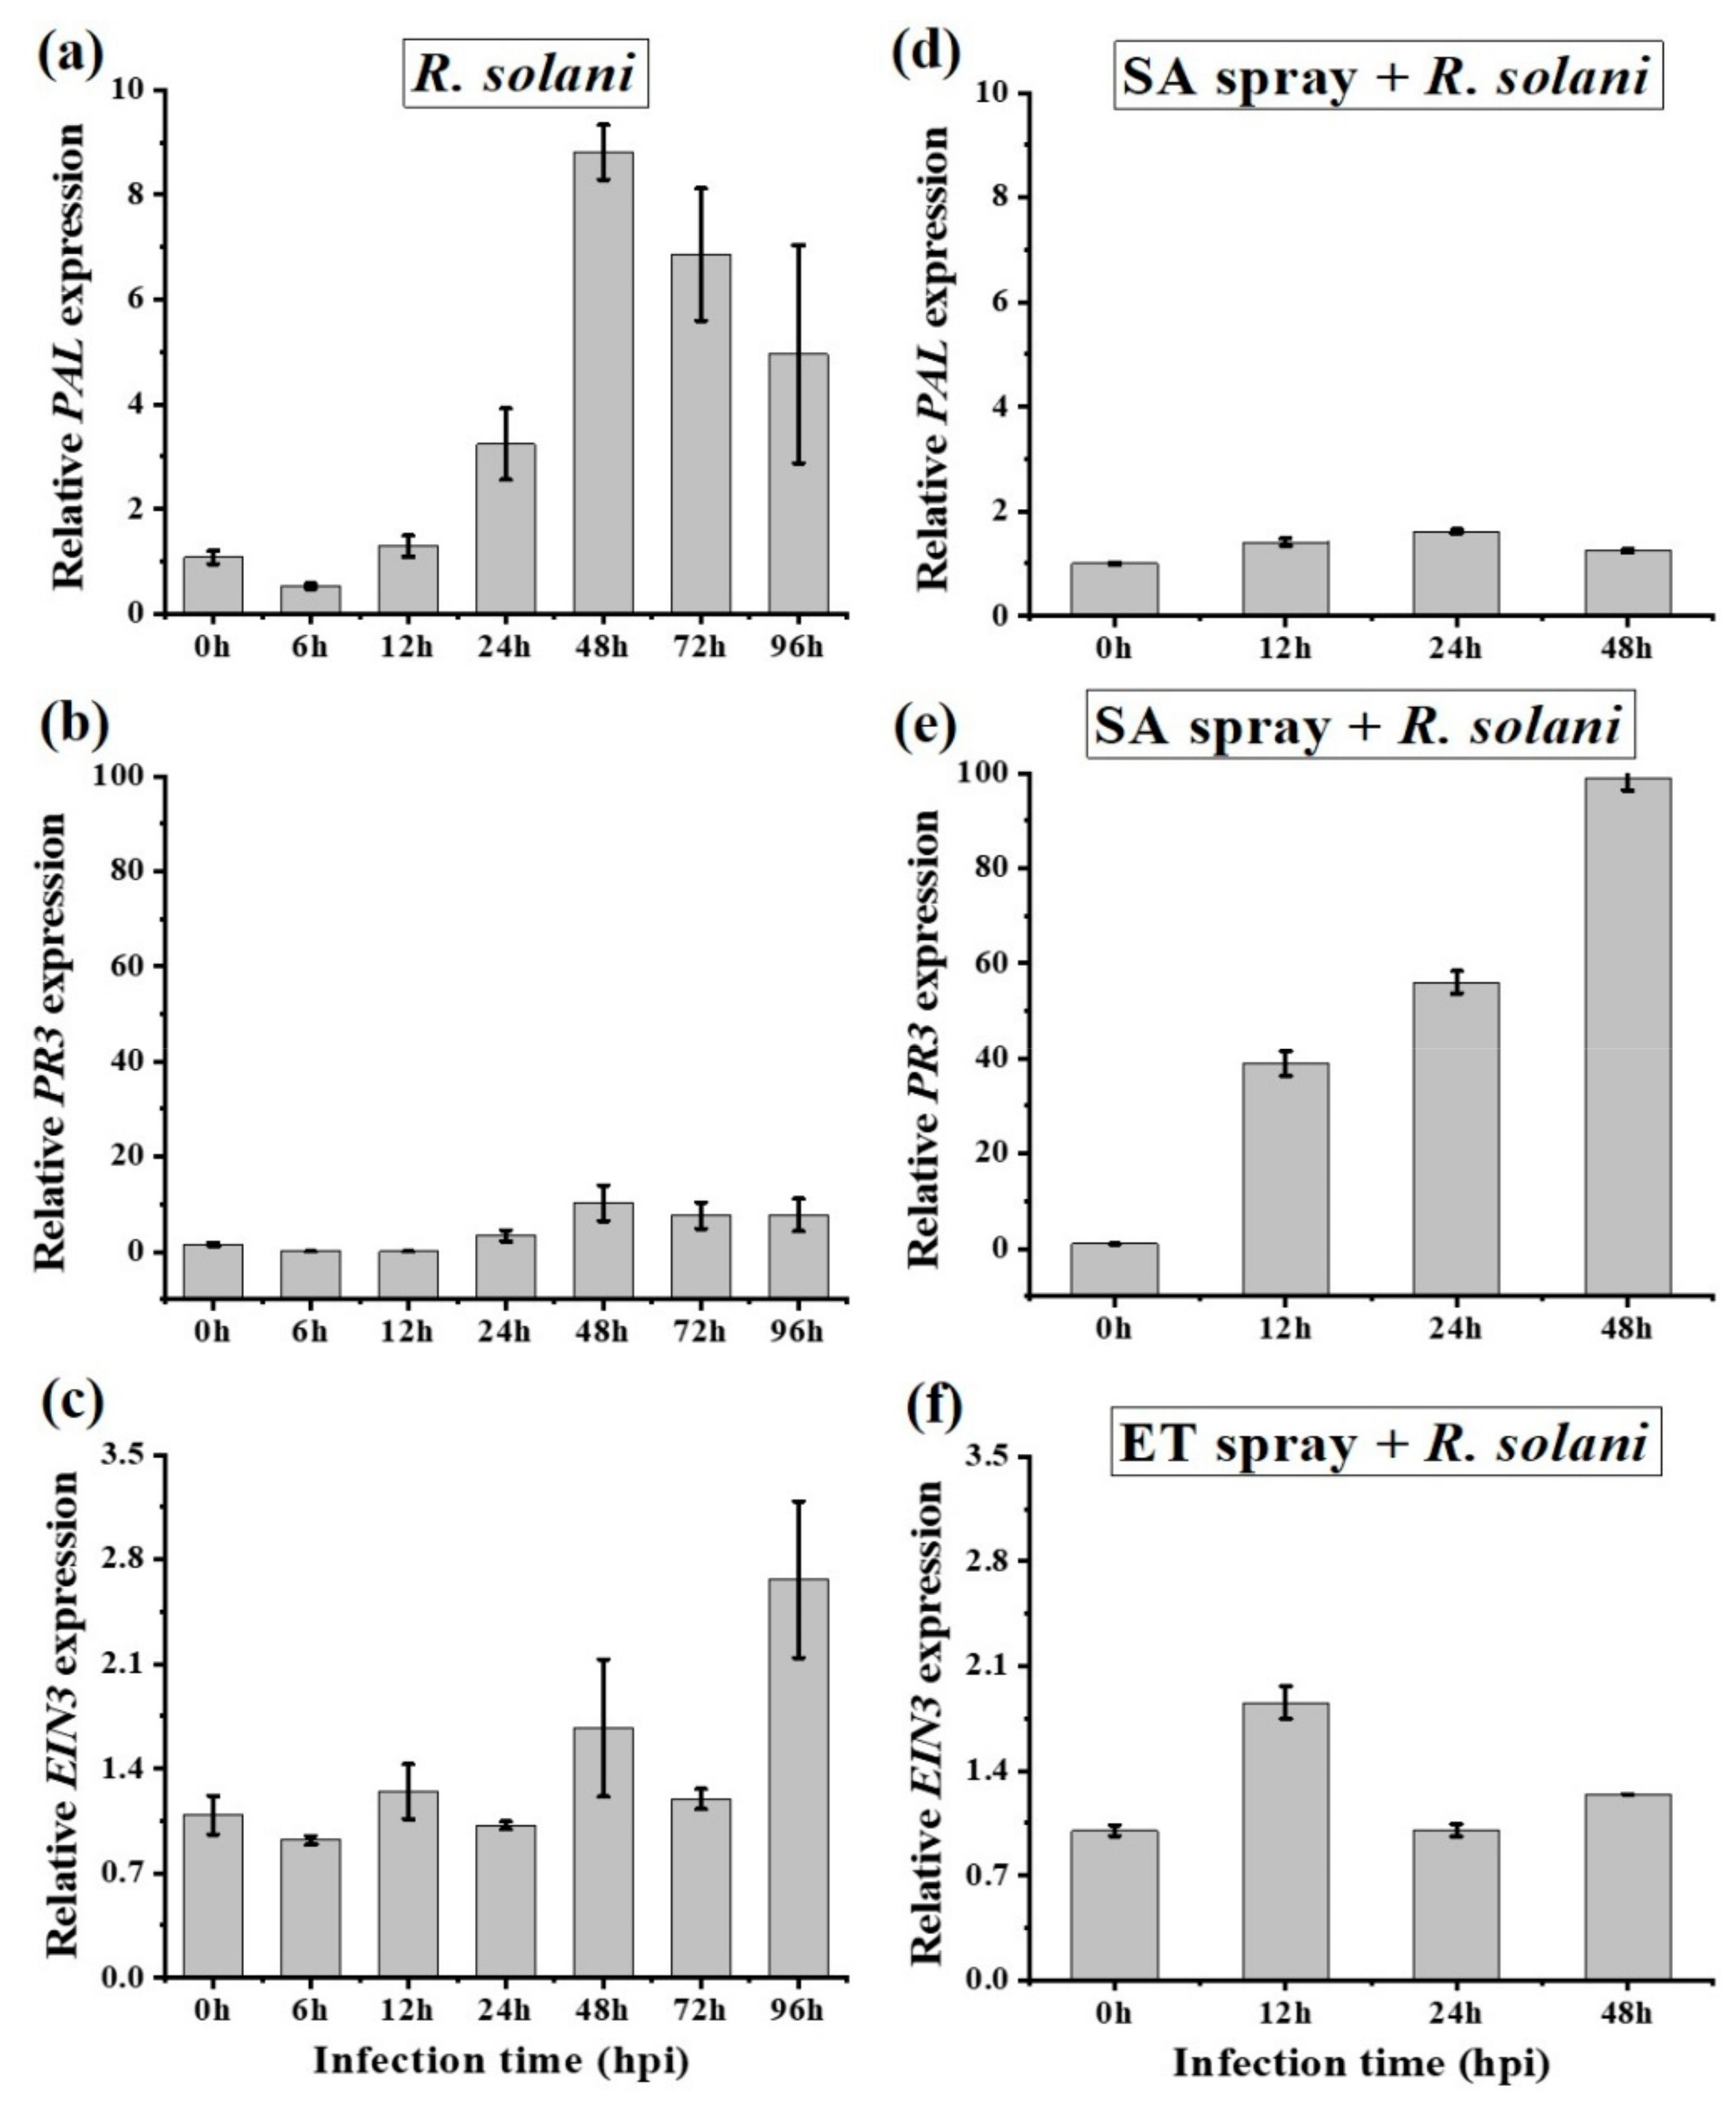
To determine the role of SA in plant defense response, we tested expression levels of two SA transcripts in A. philoxiroides: PAL and PR3 (Supplementary Table S3). We found that the expression of both transcripts consistently increased at each time interval, with the exception of 6 hpi (where expression decreased, Figure 7a,b). The reduced expression at 6 hpi was in contrast to the positive induction of JA transcripts (Figure 6a–c). After inoculation, both PAL and PR3 were also induced in SA pretreated plants (Figure 7d, e). However, PR3 showed very high levels of expression (up to 100-fold at 48 hpi, Figure 7e and Table S1), suggesting that SA promotes disease development in A. philoxiroides following inoculation with R. solani.
The ET transcript, EIN3, displayed a minor increase in expression over time in both the R. solani infected and ET-pretreatment samples (Figure 7c,f). Specifically, the expression of EIN3 was reduced at 6 hpi (similar to SA, Figure 7a). Overall, the results suggest ET-signaling may act synergistically with SA, thereby promoting disease susceptibility in A. philoxiroides.

2.6. Signaling Cross-Talk between SA, JA and ET in A. philoxiroides during Interactions with R. solani

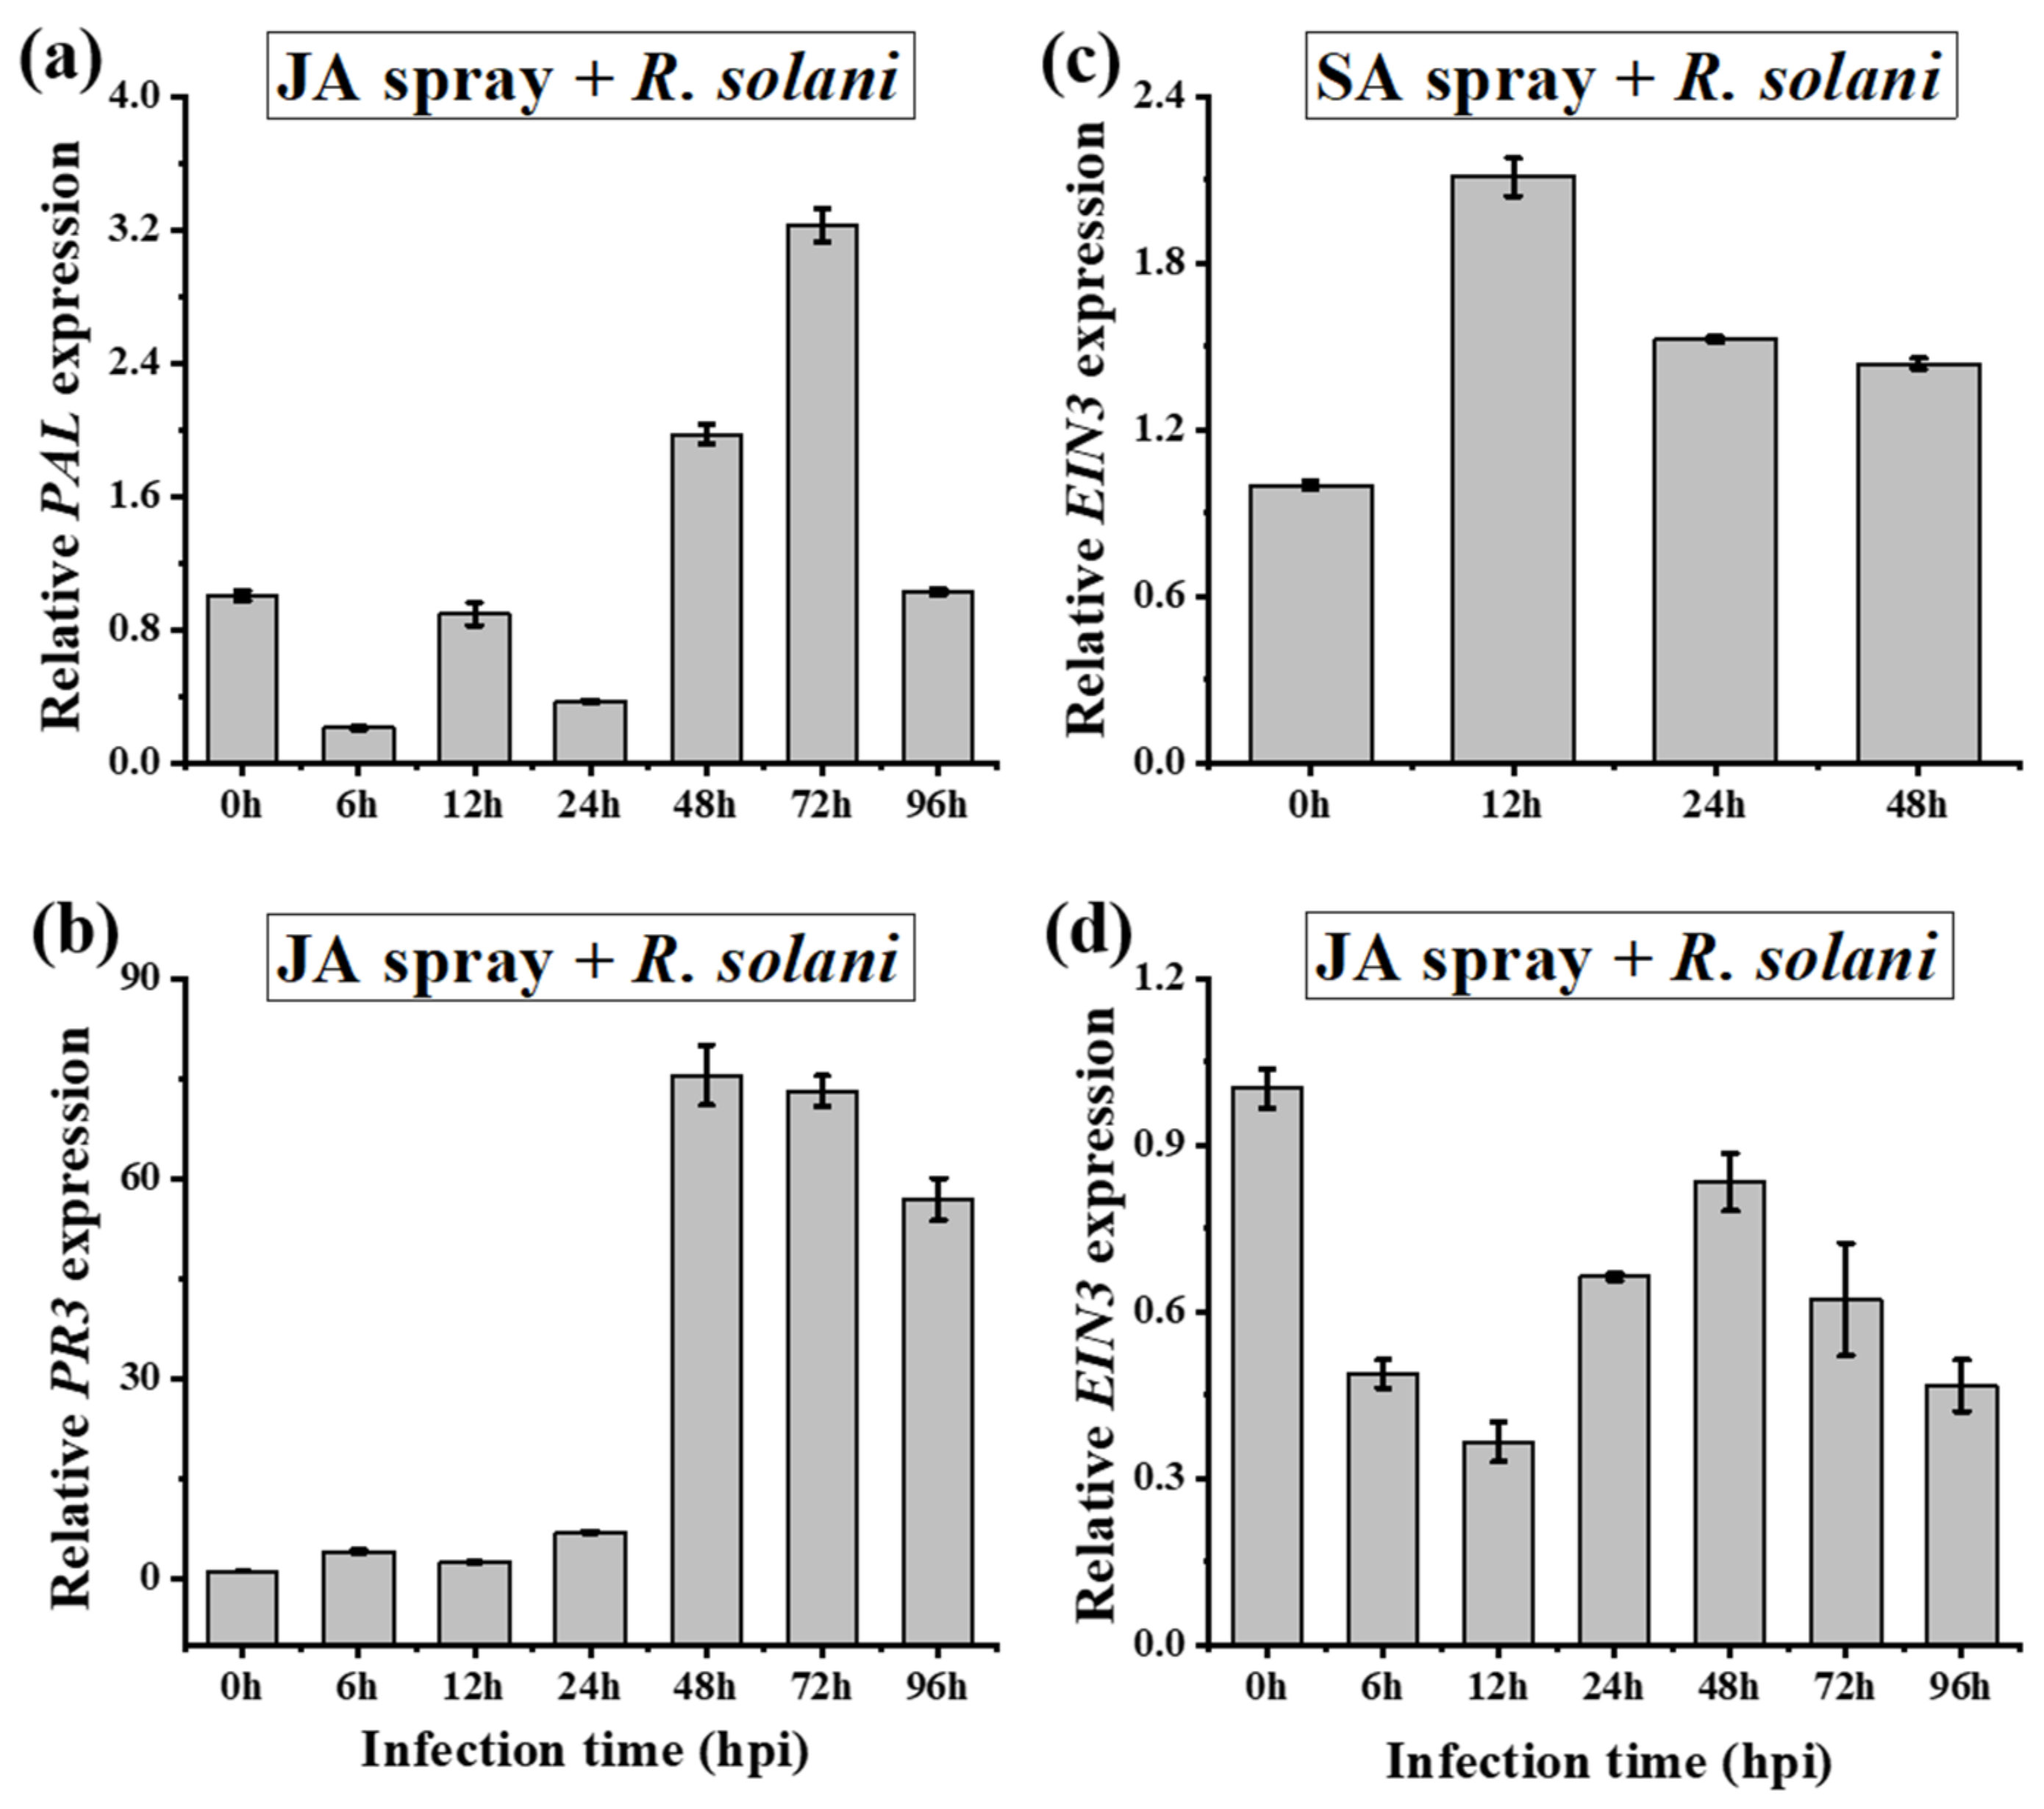
We investigated the cross-talk between hormone signaling pathways in response to R. solani infection and hormone pretreatments. We observed that JA (LOX, JAR1, and PR6) and SA (PAL and PR3) transcripts had prominent antagonistic cross-talk in A. philoxiroides at both earlier (at 6 hpi) and later (>24 hpi) time intervals following R. solani inoculations (Figure 6a–c and Figure 7a,b). In addition, MeJA pretreated A. philoxiroides showed decreased expressions in all three JA transcripts (Figure 6d–f), and also displayed higher expression levels of SA transcripts (PAL and PR3) (Figure 8a,b and Table S1). These results indicate a clear antagonistic cross-talk between SA and JA pathways in A. philoxiroides after inoculation with R. solani.
As described above for ET-EIN3, gene expression was induced in both treatments in A. philoxiroides (Figure 4c, f). In addition, we also tested the expression of EIN3 with other hormone pretreatments in A. philoxiroides. For example, SA pretreated plants induced EIN3 expression similar to the SA-PAL and PR3 transcripts (Figure 8c). In contrast, MeJA pretreated plants showed a decrease in EIN3 expression, similar to the JA (LOX, JAR1, and PR6) transcripts (Figure 8d). The differential expression of EIN3 to SA and MeJA suggests that ET may be regulated by both hormones depending on the type of infection and treatment. Other combinations of hormone signaling and their cross-talk gene expressions are presented in Supplementary Table S1.
To further test whether R. solani influences the hormones (SA, JA and ET) during pathogenesis in A. philoxiroides, we quantified the endogenous contents of each hormone in R. solani infected plants at each time interval (0, 6, 12, 24, 48, 72 and 96 hpi) using ELISA. We detected a 6.9-fold higher SA content (Figure S6a) and a 2.2-fold higher JA content (Supplementary Figure S6b) at 96 hpi compared to the control un-inoculated samples. ET was at a moderate level (about 3.2-fold higher) compared to both SA and JA in the infected plants (Supplementary Figure S6c). The levels of each hormone increased, as time since infection increased (Supplementary Figure S6).

2.7. R. solani Induced Resistance Trade-Offs between SA and JA-Signaling in A. philoxiroides

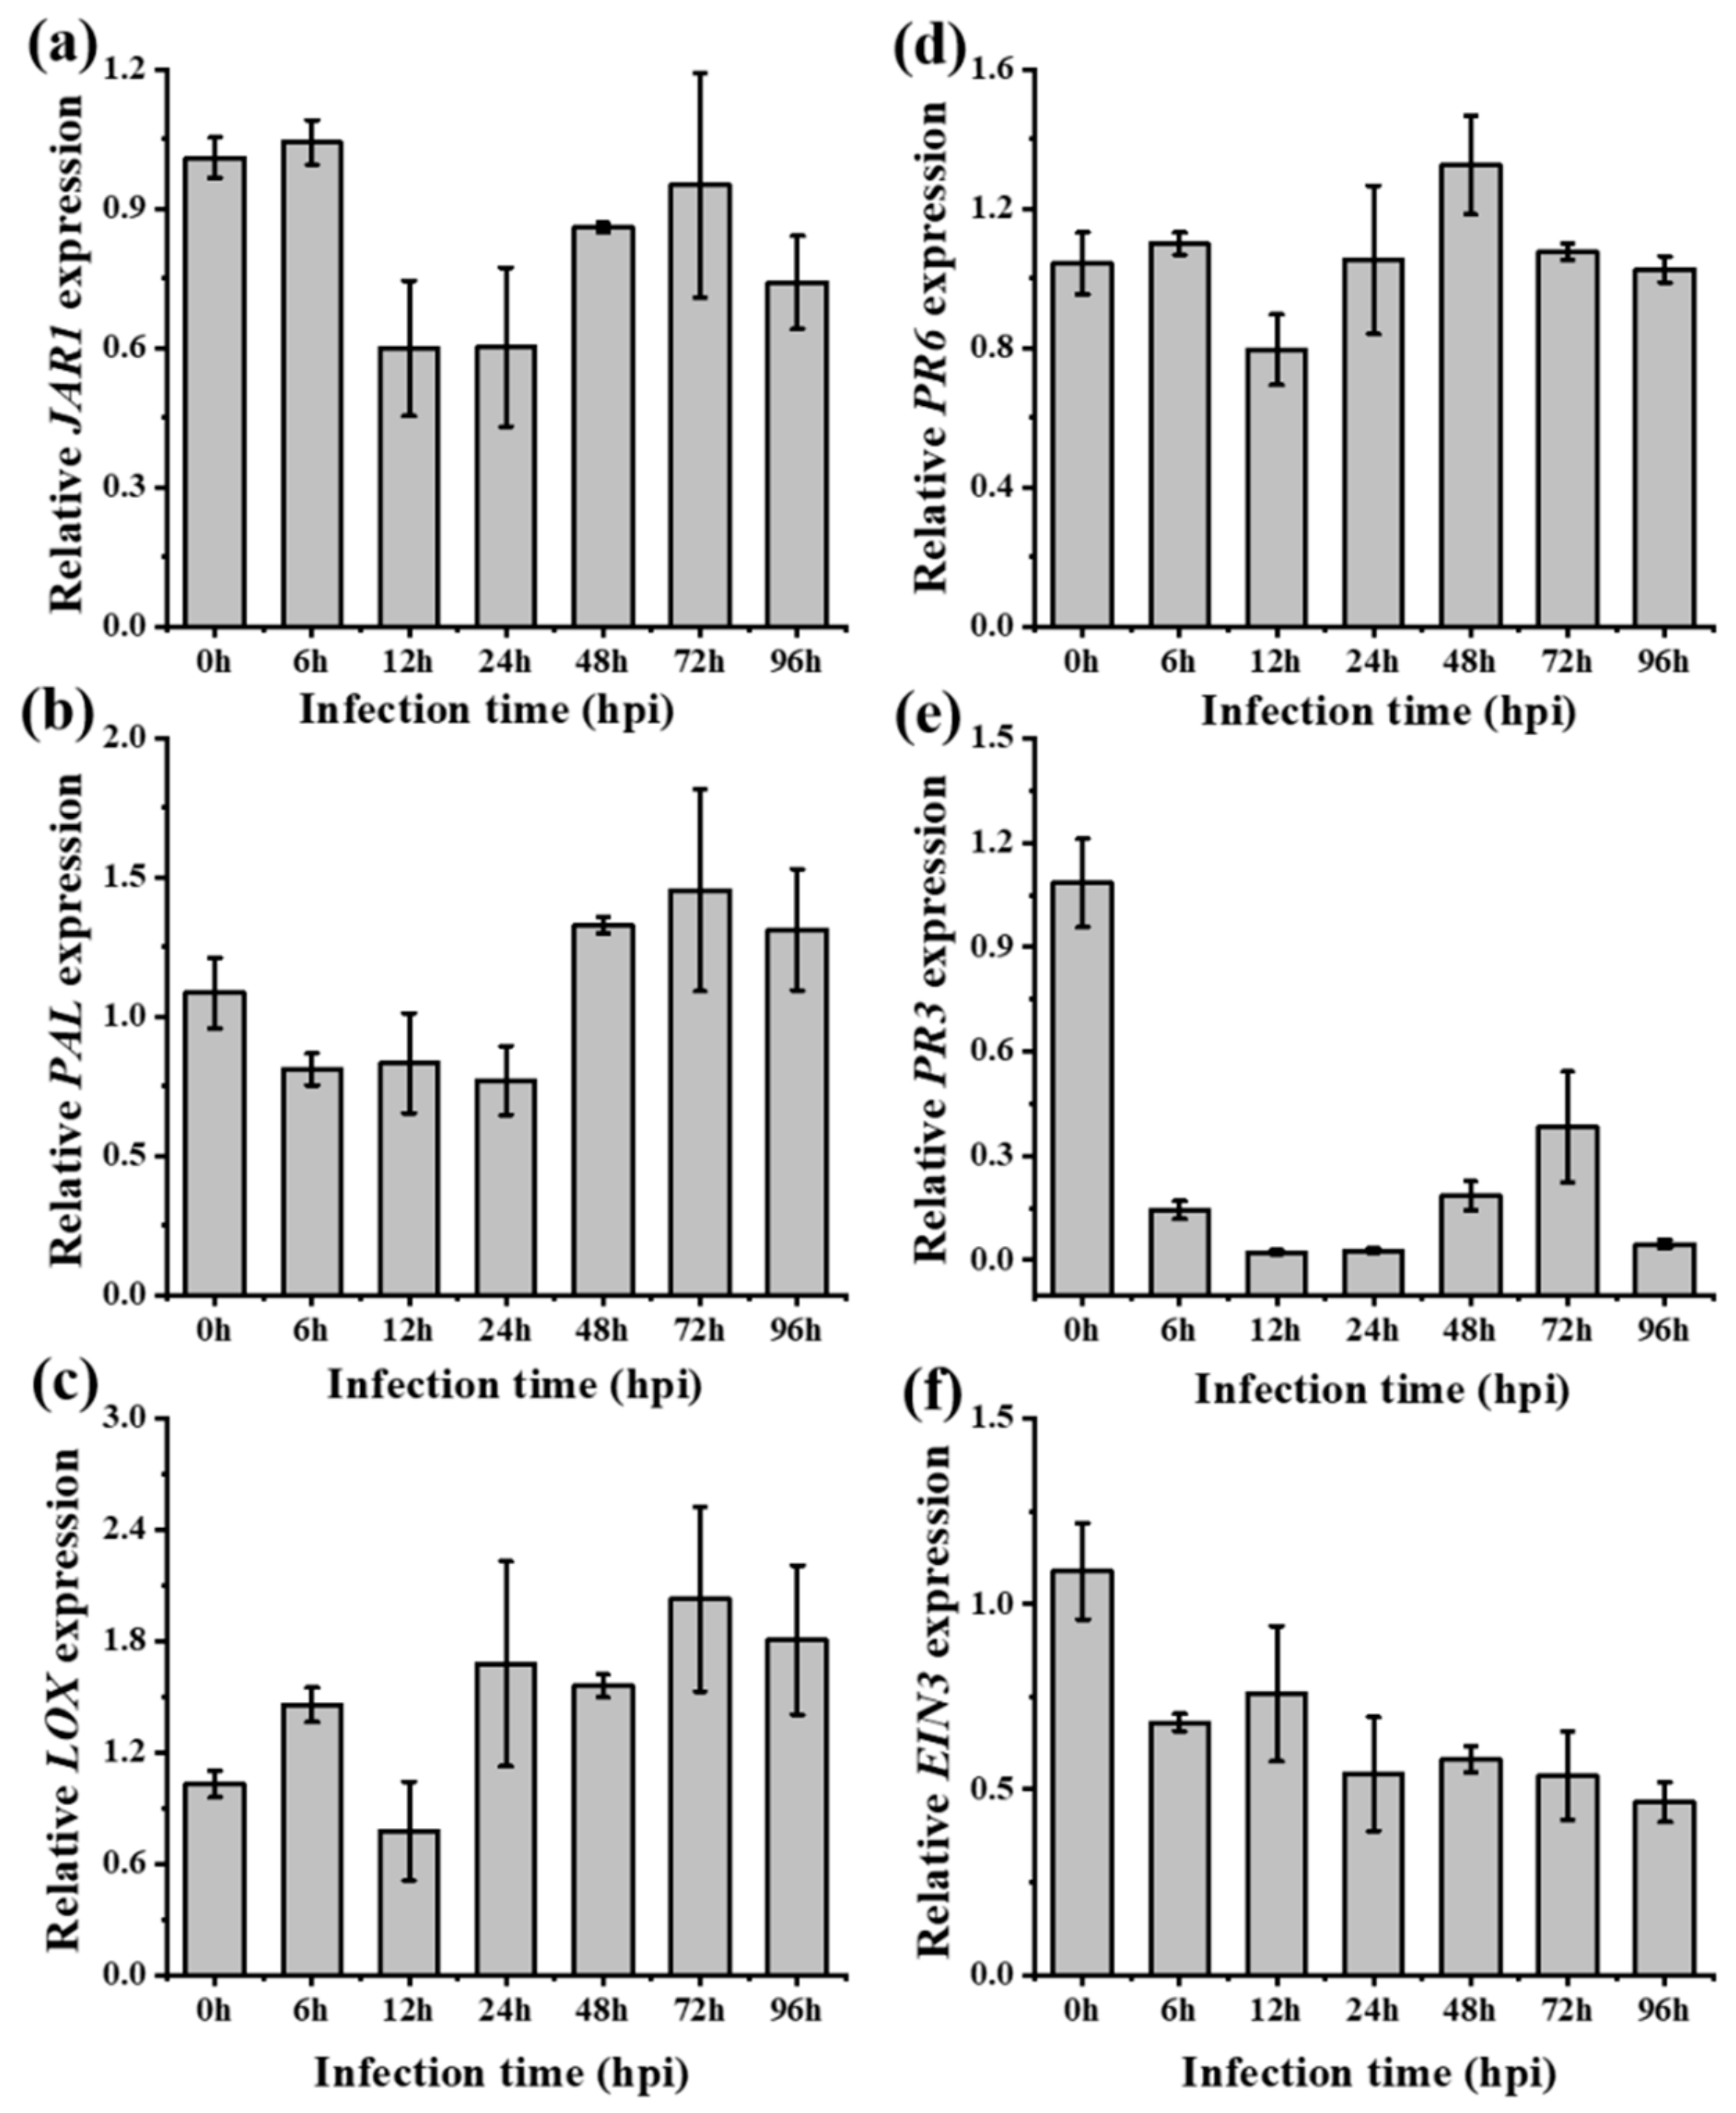
To identify and correlate whether hormonal cross-talk provides signals to adjacent leaves from local infected tissues, we examined the resistance trade-offs between SA and JA-signaling in A. philoxiroides. Our findings suggest that SA was induced during R. solani pathogenesis, which initiated antagonistic cross-talk to JA at the local infected leaves in A. philoxiroides (Figure 6 and Figure 7). Investigating neighboring leaves for this cross-talk may provide information regarding how trade-off signals are regulated during infection in invasive A. philoxiroides. Therefore, we quantified the expression levels of all six genes in neighboring un-inoculated leaves across all time intervals. We found that JA-JAR1 showed reduced expressions at each time interval (Figure 9a). In contrast, increased expression of SA-PAL from 48 hpi was detected (Figure 9b). The cross-talk between these transcripts in the neighboring un-inoculated leaf was similar to the infected leaves. However, other transcripts of JA-LOX and PR6 were induced in the same plants (Figure 9c,d), while SA-PR3 was much reduced (Figure 9e). These findings suggest that the key signaling component of SA (PAL) and JA (JAR1) engage in antagonistic cross-talk during pathogenesis. The ET-EIN3 expression was reduced at each time interval (Figure 9f).

3. Discussion

Plants are exposed to numerous biotic and abiotic stresses in their environment. Invasive plants may have evolved to adapt to these stresses and to fluctuating environmental conditions via plasticity in growth and development [6,28,70]. Studies investigating the molecular mechanisms responsible for invasion success are scarce in non-model plant species, but can now be investigated due to the availability of genomic technologies. In our study, we isolated partial gene sequences of key defense hormones in two non-model plant species (Table S6). These novel template gene sequences allowed us to investigate hormone signaling and their cross-talk within and between species to better understand the resistance of an invasive species to a globally distributed necrotrophic fungal pathogen. There were three major findings in our study: (1) R. solani successfully infected the invasive A. philoxeroides and its native congener A. sessilis, with disease development being much slower in A. philoxeroides compared to A. sessilis; (2) there were interspecific differences in hormone gene expression (including hormone signaling and cross-talk) following inoculation by R. solani; and (3) there were differences in the hormone signaling and their cross-talk between infected local and the un-infected systemic leaves.

3.1. Differential Expression between Invasive A. philoxiroides and Native A. sessilis during Disease Development

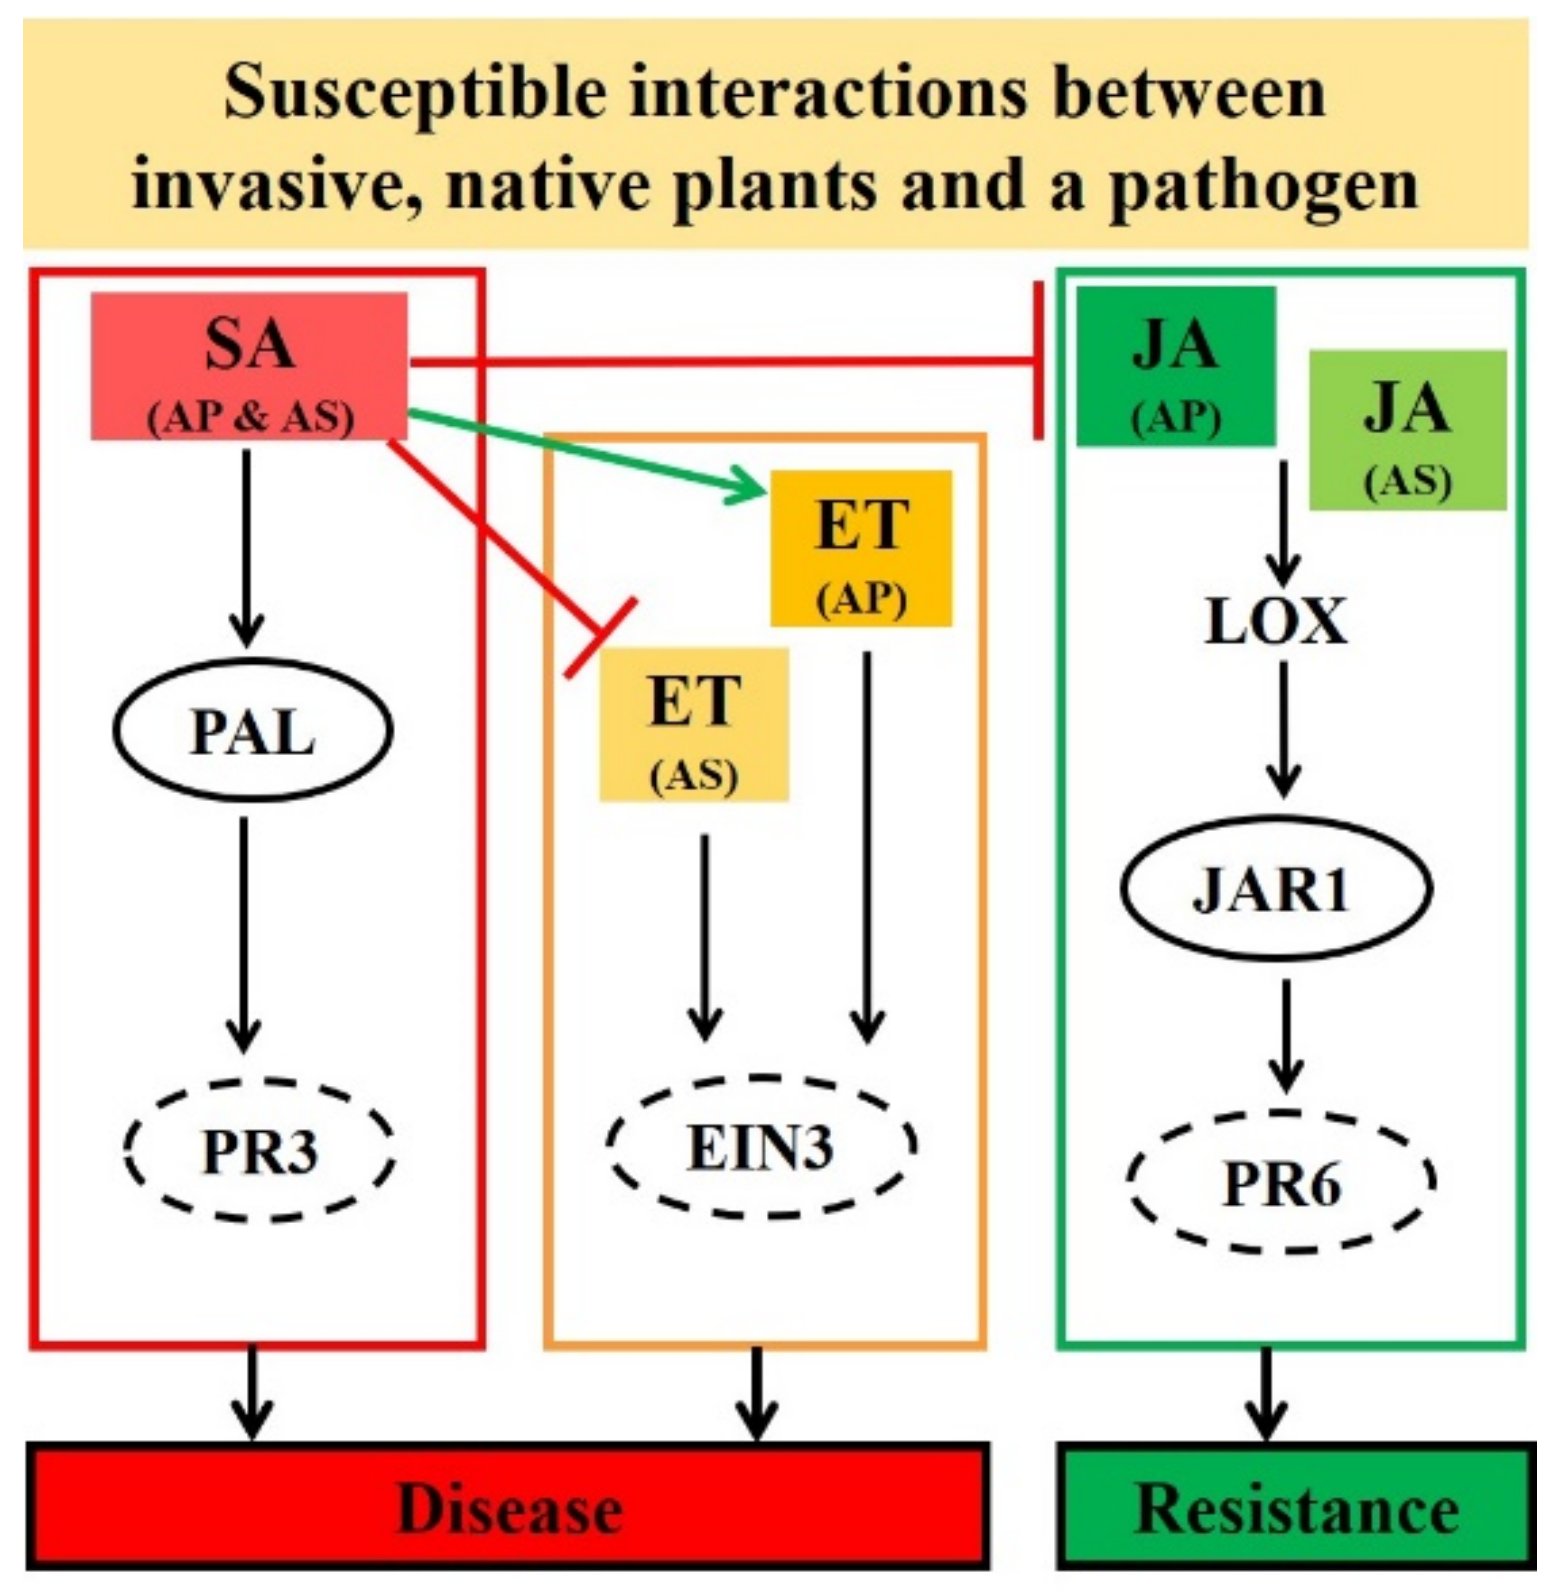
We found that there were interspecific differences in JA and ET-signaling, as well as in the degree of antagonistic cross-talk between SA and JA (which was stronger in the invasive species and weaker in the native species). This variation in the expression of defense hormone genes between species suggests R. solani may affect host plant defense hormones, specifically by inducing the major defense hormone SA (which may regulate other hormones, such as JA and ET, differently between plants for successful infection of plant tissue, Table 1). Our findings also suggest that the infection of R. solani was enhanced in the native A. sessilis, perhaps due to the weaker antagonistic cross-talk between SA and JA (which may allow faster or enhanced disease development to occur in the native species). Furthermore, our results indicate that the stronger antagonistic cross-talk between SA and JA in the invasive A. philoxiroides may delay disease progression. To our knowledge, this is the first study that demonstrates a necrotrophic pathogen influencing plant defense hormone pathways in an invasive clonal weed differentially compared to a native congener (Figure 10). A previous study [30] identified several genes that may be involved in the introduction success of invasive A. artemisiifolia. Of the 180 genes identified in this earlier study, some genes were found to be involved in the metabolism of plant hormone signaling and biosynthesis (e.g., lipoxygenases and cytokinins-zeatin o-glucosyltransferase) [30]. Gene expression differences between the invasive and native species suggested that invasive species may have evolved to stressful conditions during the invasion process [29,30,31].
The differences in defense hormone signaling between the invasive and native species observed in our study during pathogenesis may be the result of interspecific genetic variation. It would be interesting to study how differences in genetic variation between the invasive A. philoxeroides (which has previously been found to have low genetic diversity in China due to predominantly clonal vegetative propagation, [60,64]) and native A. sessilis (which may have higher genetic diversity in its native range, although this needs to be confirmed) may influence the resistance response of each species to pathogens. The data from our study provide an appropriate baseline for investigating this line of inquiry in the future.

3.2. Changes in Defense Hormone Gene Expression during Pathogenesis in A. philoxeroides

Our study demonstrates how a common and widespread pathogen regulates plant defense hormones (SA, JA, and ET) allowing for the successful infection of an invasive species, A. philoxeroides (using RT-qPCR). Our results showed that both JA-JAR1 and PR6 transcript expressions decreased during disease development following inoculation with R. solani AG4 HGI (Figure 6a,b), indicating that JA-signaling pathway is likely to be involved in plant resistance to the pathogen. There is much evidence to suggest that endogenous JA is triggered against necrotrophic pathogens [71,72]. For example, gene expression changes induced by R. solani AG1 IA in resistant and susceptible rice plants have been reported and it has also been shown that JA plays an important role in disease resistance [73]. In the present study, we found that the JA biosynthetic LOX gene was inconsistent in expression (Figure 6c). This was consistent with the findings of a previous study [74], where it was found that LOX expression increased approximately 6-fold in response to virulent and avirulent strains of Pseudomonas syringae.
In our study, R. solani induced SA (PAL and PR3), which may antagonize JA during pathogenesis in invasive A. philoxeroides (Figure 6a,b and Figure 7a,b). Earlier studies have shown cross-talk between hormone signaling pathways can greatly help the plant to regulate defense responses to a wide range of pathogens [75,76,77]. The predominant cross-talk observed between SA and JA is antagonistic [50,52]. For example, an exogenous application of SA was found to inhibit JA-induced proteinase inhibitor expression in tomato [54,78], whereas MeJA treatment inhibited SA-induced acidic PR gene expression in tobacco [55]. Like in our study, previous studies have found that phytopathogens can take advantage of the cross-talk between SA and JA allowing them to successfully infect plants [79,80]. For example, the hemi-biotrophic pathogen P. syringae was shown to manipulate antagonism between SA and JA by producing coronatine, which is a phytotoxin that mimics plant JA to suppress SA. This mechanism promotes disease infection in Arabidopsis and tomato [81]. The necrotrophic Botrytis cinerea produces exopolysaccharide (EPS), a virulence factor that elicits SA to activate antagonism to JA, thereby enhancing the ability of the fungus to infect tomato [56]. Our results are consistent with the findings of El Oirdi et al. [56], although the virulence factor from R. solani needs to be investigated further. A follow-up study by El Oirdi et al. [56] showed SA-signaling can also contribute to disease development (caused by another necrotrophic pathogen, Alternaria solani) in tomato [82]. It has also been found that the SA pathway might contribute to disease development (i.e., a SAR8.2k gene induced by SA may be involved in disease susceptibility caused by R. solani in tobacco [83]).
PR genes are often associated with specific signaling pathways and their expression can be regulated by different plant hormones [84]. In our study, at 48 hpi, the SA-inducible PR3 showed a 10-fold higher expression to R. solani infection (Figure 7b), a 100-fold higher expression for SA pretreatment (Figure 7e), and a 75-fold higher expression for JA pretreatment (Figure 8b). This increase in SA-inducible PR3 supports the hypothesis that SA enhances disease development by suppressing JA in A. philoxeroides.
Our results indicate that, as with SA, EIN3 (an active form of the ET transcription factor) [77] enhances disease development in A. philoxeroides (Figure 7c). Although EIN3 was induced at moderate levels, its expression was consistently induced over time during inoculation (Figure 7c,f). Previous studies have shown that ethylene is a potential modulator of plant pathogen defenses [85]. JA and ET together form an effective defense against necrotrophs [86], and can act positively or negatively with SA, depending on the specific pathogen interactions [87]. For example, ET modulates the antagonism between SA and JA pathways, and is mediated by NPR1 [53]. ET induces SA-responsive PR1 gene expression in Arabidopsis [88]. In contrast, ET (EIN3 and EIL1) represses the SA biosynthesis gene ICS/SID2, thereby reducing SA accumulation [89].

3.3. Hormonal Cross-Talk and Systemic Resistance in A. philoxeroides during R. solani Pathogenesis

Invasive plants may encounter multiple pathogens with different infection strategies in their non-native range. Hormonal cross-talk provides signals to adjacent leaves from local infected tissues to resist a forthcoming infection [90,91,92]. This systemic defense is effective against pathogens with a similar attacking strategy [93]. For pathogens with a different infection mode, hormonal cross-talk between pathways (specifically SA and JA) plays a critical role in plant resistance [90,94]. The biotrophic pathogen inducing SA can activate antagonism to JA in infected local and systemic tissues, which in turn favors insect herbivores or necrotrophic pathogens [91].
In our study, trade-offs between the SA and JA pathways was clearly observed in infected local leaves (Figure 6 and Figure 7). This trade-off was lower in neighboring leaves (Figure 9). Only the core signaling component of SA-PAL and JA-JAR1 showed antagonism in the neighboring leaves, whereas other gene transcriptions (i.e., JA-LOX and PR6) were not suppressed (Figure 9). Our results are consistent with the finding of Spoel et al. [90], who reported that P. syringae suppressed JA-mediated resistance to Alternaria brassicicola at the infected site. However, this antagonism was at modest levels in neighboring tissues in Arabidopisis [90]. It was suggested that, while antagonism between SA and JA was moderate, their cross-talk expression was detected in systemic tissues [90]. However, spatial separation (local, adjacent or systemic), time (immediate or delayed), pathogen type (biotroph or necrotroph), and inoculation dosage are important factors determining systemic resistance trade-offs in plants [91].

4. Materials and Methods

4.1. Plant Species and Pathogens

Alternanthera philoxeroides (Amaranthaceae) is one of the 100 worst invasive species in the world [59]. Climate modeling suggests that many regions around the world are suitable habitat for the growth of A. philoxeroides, including areas in Southeast Asia, Southern Africa, and Southern Europe [95]. In China, it has successfully invaded 19 provinces since its introduction (usually on roadsides and lakeshores) [96].
Alternanthera sessilis (L.) DC. is native to China, and was used for comparison with A. philoxeroides in our study [22]. Ramets of A. philoxeroides and A. sessilis were randomly collected in August (summer) 2016 from naturally occurring sites in Fuzhou National Forest Park (119°17′12′′E, 26°9′35′′N, Figure S7) and propagated in a greenhouse at Jiangsu University, Zhenjiang, China. Healthy stems with two nodes and without roots were planted in 250 g of sterilized sand in plastic pots (8 × 7 × 5 cm). Fixed volumes (30 mL) of distilled water or full-strength Hoagland liquid nutrient solution [97] were supplemented alternatively every two days to maintain optimal growth conditions.
Rhizoctonia solani is a ubiquitous soil-borne necrotroph that causes significant yield loss in many economically important crops globally [98]. The most common symptom is the ‘damping-off’ of seedlings or failure of infected seeds to germinate. The R. solani AG4-HGI (accession ACCC 30374) used in this study was obtained from the Agriculture Culture Collection of China (Agricultural and Microbial Culture Collection Management Center, Beijing, China). This strain was further sequenced to identify the specific anastomosis group (AG4-HGI), which was confirmed by PCR amplification of AG common and subgroup specific primers [99], and internal transcribed spacer (ITS) primers [100]. The fungus was grown and sub-cultured on potato dextrose agar (PDA) and incubated for five days at 28 °C.

4.2. Isolation of Putative Hormone-Responsive Genes for RT-qPCR

Partial gene sequences of six hormones and responsive genes (one for ET, two for SA and three for JA) were successfully isolated from both A. philoxiroides and A. sessilis. Although there is currently a lack of hormone specific sequence information for many invasive and native plant species (including Alternanthera species), the species from our study are in the Amaranthaceae family (which was used for sequence isolation). Twenty-one hormones and their responsive gene sequences (i.e., eight for SA, seven for JA, and six for ET) were retrieved from species in the Amaranthaceae (Table S6). Each gene sequence from species in the Amaranthaceae was aligned using Clustal Omega [101] for primer design in the conserved region (using Primer3) [102] (for initial screening). We also performed a phylogenetic analysis of these sequences (Figure S2) to compare with other species.
Plant leaf material was ground using liquid nitrogen, and 50–100 mg of ground tissue was used for DNA extraction using the Rapid Plant Genomic DNA Isolation Kit (Sangon Biotech, Shanghai, China). Genomic DNA was further precipitated by adding sodium acetate and ethanol and purified using the method of Dellaporta et al. [103]. PCR was performed, and DNA was purified using the UNIQ-10 Column MicroDNA Gel Extraction Kit (Sangon Biotech, Shanghai, China) prior to sequencing. A total of six genes (i.e., PAL and PR3 for SA; LOX, JAR1 and PR6 for JA; EIN3 for ET) were successfully isolated based on the PCR amplification of similar amplicon lengths obtained from both A. philoxiroides and A. sessilis (Table S3). Furthermore, the coding (exonic) region of each isolated gene sequence was confirmed by cDNA PCR. We performed a NCBI nucleotide search of each of the isolated sequences and found that they showed closest homology to sequences of species in the Amaranthaceae. RT-qPCR primers (amplicon length < 200 bp) were designed using web-based Integrated DNA Technologies (IDT)-Primer Quest [104] from initially screened sequences of each gene. Primers with similar amplification efficiency in the cDNA of both invasive and native plants were used in RT-qPCR. All the primer sequences used for RT-qPCR are listed in Supplementary Table S2.

4.3. Plant Inoculations with R. solani for RT-qPCR

Pathogenicity tests consisted of detached (in vitro) and in planta leaves from four-week old stem cuttings of A. philoxeroides and A. sessilis inoculated with 5-mm agar plugs (R. solani culture). Both detached and in planta leaf assays were performed using the method used by El Oirdi and Bouarab [105]. Inoculated leaves of in planta inoculations with mycelium plugs were covered with clear zip-lock plastic bags to maintain high humidity. Detached and in planta disease symptoms were photographed every day, up to five days after inoculation.
In planta inoculations of A. philoxeroides and A. sessilis were used for gene expression experiments by quantitative RT-qPCR. Inoculated leaf samples were harvested at different time intervals, including 0, 6, 12, 24, 48, 72, and 96 h post-inoculation (hpi). There were three biological replicates per time interval (i.e., one plant per replicate each for A. philoxeroides and A. sessilis). The 0 hpi time interval refers to un-inoculated control samples. All inoculated plants were grown at 25 °C and 70% humidity with a 16 h photoperiod. Harvested leaf material at different time intervals was quickly frozen in liquid nitrogen for RNA extractions. For the systemic acquired resistance (SAR) tests, samples of un-inoculated neighboring leaves (i.e., younger leaves just above the inoculated leaf) were investigated. For SAR gene expression experiments, samples of three biological replicates were taken per time interval (0, 6, 12, 24, 48, 72, and 96 hpi). That is, one plant per replicate for each species was investigated. The experiments of R. solani infection and SAR were repeated twice.
The effect of each hormone (SA, JA, and ET) on resistance to R. solani was tested using RT-qPCR by spraying each hormone two days before inoculation with R. solani. Hormone pretreatments were performed on four-week old plants of A. philoxeroides and A. sessilis. There were three treatments in this experiment group for each species (SA, JA, and ET pretreatments). Hormones SA (0.5 mM, BBI Life Sciences, Shanghai, China), methyl jasmonate (MeJA, 0.1 mM, Sigma-Aldrich, St. Louis, MO, USA), and ethephon (ET, 0.5 mM, BBI Life Sciences, Shanghai, China) were dissolved in water. Hormones were sprayed directly on plant leaves (in each treatment group) until drenched (surface run-off) once per day, for three consecutive days. All treatment plants were grown at 25 °C and 70% humidity with a 16 h photoperiod until they were harvested. Each of the hormone pretreated samples was harvested at different time intervals: 0, 6, 12, 24, 48, 72, and 96 hpi with R. solani. The hormone pre-treatment samples for SA and ET spray were unable to be collected after 72 and 96 h. This was because the ET-spray samples wilted early and could not be sampled (i.e., healthy leaves could not be obtained). The control treatment (0 hpi) consisted of only water pretreated and un-inoculated. There were three biological replicates for each time interval (i.e., one plant per replicate) for each species. All harvested samples were quickly frozen in liquid nitrogen for RNA extractions. The experiment was repeated twice.

4.4. RT-qPCR Analysis

Total RNA was isolated from leaves of invasive and native plants in each treatment using the TaKaRa MiniBEST Plant RNA Extraction Kit according to the manufacturer’s instructions (Takara, Shiga, Japan). First-strand cDNA was synthesized from 500 µg total RNA using PrimeScript RT Master Mix (Takara, Japan). The targets were amplified using primers that are listed in Table S2. RT-qPCR was performed using SYBR Premix Ex-Taq (Takara, Japan) on CFX96 Real-Time PCR Detection System (Bio-rad). Melt-curve analysis was performed after each PCR run to ensure specific amplification of each gene-specific primer. To identify the suitable housekeeping gene, we tested three reference genes, β-tub (β-tubulin), EF1α (Elongation factor 1-alpha), and Act (Actin), in R. solani infected samples based on Cycle threshold (Ct) difference and the coefficient of variance method [106]. Primers are listed in Table S2. Actin had the lowest Ct difference in R. solani infected samples across different time intervals (Manoharan B. et al., unpublished data) and was used for normalizing the expression level of each target gene. Relative gene expression was calculated using the comparative 2−ΔΔCT method [107]. Three biological replicates were used for each gene and each reaction was independently replicated three times.

4.5. Hormone Content Quantification

The endogenous hormone contents (SA, JA, and ET) was determined for R. solani infected A. philoxiroides and A. sessilis. Fungal inoculations were performed on four-week old plants (as described above). Samples collected at different time intervals (0, 6, 12, 24, 48, 72, and 96 hpi) were subjected to hormone quantification by Lengton Bio. Tec. Co., Ltd. (Shanghai, China) using the ELISA method [97]. The 0 hpi time interval refers to the un-inoculated control samples.

4.6. Quantification of Plant Cell Death by Trypan Blue Staining and Ion Leakage Assay

To visualize dead plant cells and to measure the cell death area of infected leaves, trypan blue staining was performed on the leaves of four-week old infected A. philoxiroides and A. sessilis. Leaves were removed at each time interval (0, 24, 48, 72, and 96 hpi) and stained with lactophenol-trypan blue, followed by de-staining with saturated chloral hydrate using the method of Koch and Slusarenko [108]. Samples were photographed every day before and after staining to measure the diameter of the infected area using ImageJ [109]. To further confirm cell death, ion leakage assay was performed on infected leaves of both species using an electrolytic conductivity meter (model P772) following the procedure outlined in Hatsugai and Katagiri [110].

4.7. Flanking Sequence Isolation and Bioinformatic Analyses

Six isolated DNA sequences from both A. philoxeroides and A. sessilis (Table S3) were searched in the NCBI non-redundant protein database using BLAST+ (version 2.2.31) to compare with other plant species. BLASTx output of each sequence was submitted to OrfPredictor [111] to identify the best matching open reading frame (ORF) sequence [110] (Table S4). Furthermore, one gene from each of the hormones, PAL (SA), JAR1 (JA), and EIN3 (ET) was selected for additional flanking sequence isolation for both A. philoxiroides and A. sessilis (for detailed function and bioinformation analysis). Flanking (5′ and 3′) sequences were isolated from a known sequence region (i.e., initially isolated sequences, Table S2) using 5′ Genome walking and 3′ RACE (Rapid Amplification of cDNA Ends) techniques, following the methods outlined in the respective kit instructions (Genome Walking Kit, code 6108 and 3′-Full RACE Core Set with PrimeScript RTase, code 6106, Takara, Shiga, Japan). Isolated sequences from both techniques were assembled for each gene with the corresponding initial sequence using CAP3 sequence assembly program with the following parameters: base quality cut-off for clipping value of 12, overlap length cut-off value ≥20, overlap percent identity ≥75, and overlap similarity score ≥500 [112]. The assembled single long contig was selected for annotating protein coding gene with ab-initio method and Beta vulgaris gene-specific parameters using the FGENESH online tool [113]. Predicted CDS and peptide sequences were reconfirmed by aligning to the NCBI RefSeq nucleotide and protein database using mega BLAST and BLASTp search tools. Clustal-W from MEGA 7.0.26 was used for multiple sequence alignment of each peptide sequence with other related species. A maximum likelihood phylogenetic tree was constructed with 1000 bootstrap replicates (Figure S2) [114]. In addition, motifs were searched for each peptide sequences using MEME suite [115] with the default options. The conserved domain was searched using the NCBI database with an expected value of 0.010000 [116].

4.8. Data Availability

The partial gene sequences isolated in this study were deposited in the GenBank under accession IDs: MK790145 to MK790156. The Rhizoctonia solani was sequenced to identify the specific anastomosis group and was deposited under GenBank accession ID: MK801228.

5. Conclusions

During the invasion process, an invasive species from a small founding population may face difficulties due to adverse abiotic and biotic stresses, impacting its survival and reproduction. Invasive species can undergo genetic changes to overcome these natural barriers. Our findings are consistent with previous studies, which identified that many stress induced genes are differentially expressed between invasive and native plant species [29,30,31]. Our study advances our current understanding of hormone resistance to a widespread pathogen in an invasive species compared to its native congener. In addition, our findings provide insights into the significance of invasive plant defense pathway genes that may have evolved during the invasion process. The manipulation of host defense hormones in favor of pathogen colonization in native plant species may be a mechanism where invasive species gain an advantage over co-occurring native congeners, and this should be the focus of future research. Further studies are required to identify the currently unknown virulence factors (i.e., pathogen effectors or toxins that mimic plant hormone coronatine from R. solani and other pathogens) that may affect the signaling pathways differentially between invasive and native species [56]. More specifically, research is needed on resistance (R) genes, such as the non-expresser of PR genes 1 (NPR1) of hormone SA, which is a major transcriptional activator that activates antagonism to JA or ET during disease development [117].

Supplementary Materials

All supplementary material from this study is available online at https://www.mdpi.com/1422-0067/20/19/4916/s1, including Figure S1: Endogenous hormone salicylic acid (SA), jasmonic acid (JA), and ethylene (ET) contents in both Alternanthera philoxiroides and A. sessilis after Rhizoctonia solani inoculations. Figure S2: Comparative phylogenetic analysis of the selected hormone genes in both the invasive and native species, as well as other closely related species. Figure S3: Identification of conserved motifs in selected genes from both invasive and native species. Figure S4: Identification and alignment of the conserved domain in each of the selected genes from both invasive and native species. Figure S5: Multiple sequence alignments of predicted amino acid sequences of both Alternanthera philoxeroides and A. sessilis along with other closely related plants. Figure S6: Endogenous hormone Salicylic acid (SA), jasmonic acid (JA), and ethylene (ET) contents in Alternanthera philoxiroides after infected with Rhizoctonia solani. Figure S7: Sampling site of invasive Alternanthera philoxeroides and native A. sessilis. Table S1: Fold-change ratio of defense hormones and their responsive genes under different treatment conditions in invasive Alternanthera philoxeroides compared to native A. sessilis. Table S2: Primers used for quantitative RT-qPCR. Table S3: List of putative defense hormones and responsive genes isolated in both Alternanthera philoxeroides and A. sessilis. Table S4: Sequence information of six defense hormones and responsive genes isolated from Alternanthera philoxeroides and A. sessilis. Table S5: Functional analysis of three hormone genes in both Alternanthera philoxeroides and A. sessilis. Table S6: Screening and isolation of defense hormones and responsive gene sequences from both invasive Alternanthera philoxeroides and native A. sessilis.

Author Contributions

Z.C.D., S.S.Q., D.L.D. and B.M. designed the research; Q.C., Q.L., Y.H.Y. and J.L. performed plant growth, sample collection and pathogenicity tests; B.M. and V.D. performed gene isolation and bioinformatic analyses; B.M., V.D., S.R., J.S.H.W. and S.J. analyzed the data; B.M. performed the research and wrote the manuscript; Z.C.D., S.S.Q., S.R., J.S.H.W. and S.J. reviewed the manuscript.

Funding

This study was funded by the State Key Research Development Program of China (2017YFC1200100), the National Natural Science Foundation of China (31700342, 31600326, 31770446, 31570414), the Natural Science Foundation of Jiangsu (BK20150503), and the China Postdoctoral Science Foundation (2017T100329). Part of the funding for this research was supported by the Priority Academic Program Development of Jiangsu Higher Education Institutions (PAPD), the Jiangsu Collaborative Innovation Center of Technology and Material of Water Treatment, and the Study Abroad Scholarship of Jiangsu Province and Jiangsu University.

Acknowledgments

We thank the Jiangsu University postdoctoral fellowship program.

Conflicts of Interest

The authors declare that they have no conflict of interest.

References

  1. Vila, M.; Espinar, J.L.; Hejda, M.; Hulme, P.E.; Jarosik, V.; Maron, J.L.; Pergl, J.; Schaffner, U.; Sun, Y.; Pysek, P. Ecological impacts of invasive alien plants: A meta-analysis of their effects on species, communities and ecosystems. Ecol. Lett. 2011, 14, 702–708. [Google Scholar] [CrossRef] [PubMed]
  2. Bradley, B.A.; Blumenthal, D.M.; Wilcove, D.S.; Ziska, L.H. Predicting plant invasions in an era of global change. Trends Ecol. Evol. 2010, 25, 310–318. [Google Scholar] [CrossRef] [PubMed]
  3. Chown, S.L.; Hodgins, K.A.; Griffin, P.C.; Oakeshott, J.G.; Byrne, M.; Hoffmann, A.A. Biological invasions, climate change and genomics. Evol. Appl. 2015, 8, 23–46. [Google Scholar] [CrossRef] [PubMed]
  4. Pyšek, P.; Richardson, D.M. Invasive Species, Environmental Change and Management, and Health. Annu. Rev. Environ. Resour. 2010, 35, 25–55. [Google Scholar] [CrossRef] [Green Version]
  5. Stewart, C.N.; Tranel, P.J.; Horvath, D.P.; Anderson, J.V.; Rieseberg, L.H.; Westwood, J.H.; Mallory-Smith, C.A.; Zapiola, M.L.; Dlugosch, K.M. Evolution of Weediness and Invasiveness: Charting the Course for Weed Genomics. Weed Sci. 2009, 57, 451–462. [Google Scholar] [CrossRef] [Green Version]
  6. Dlugosch, K.M.; Parker, I.M. Invading populations of an ornamental shrub show rapid life history evolution despite genetic bottlenecks. Ecol. Lett. 2008, 11, 701–709. [Google Scholar] [CrossRef] [PubMed]
  7. Richardson, D.M.; Pyšek, P. Naturalization of introduced plants: Ecological drivers of biogeographical patterns. N. Phytol. 2012, 196, 383–396. [Google Scholar] [CrossRef] [PubMed]
  8. Van Kleunen, M.; Dawson, W.; Schlaepfer, D.; Jeschke, J.M.; Fischer, M. Are invaders different? A conceptual framework of comparative approaches for assessing determinants of invasiveness. Ecol. Lett. 2010, 13, 947–958. [Google Scholar] [CrossRef]
  9. Engelkes, T.; Morriën, E.; Verhoeven, K.J.F.; Bezemer, T.M.; Biere, A.; Harvey, J.A.; McIntyre, L.M.; Tamis, W.L.M.; van der Putten, W.H. Successful range-expanding plants experience less above-ground and below-ground enemy impact. Nature 2008, 456, 946. [Google Scholar] [CrossRef]
  10. Cushman, J.H.; Lortie, C.J.; Christian, C.E. Native herbivores and plant facilitation mediate the performance and distribution of an invasive exotic grass. J. Ecol. 2011, 99, 524–531. [Google Scholar] [CrossRef]
  11. Fan, S.; Yu, H.; Dong, X.; Wang, L.; Chen, X.; Yu, D.; Liu, C. Invasive plant Alternanthera philoxeroides suffers more severe herbivory pressure than native competitors in recipient communities. Sci. Rep. 2016, 6, 36542. [Google Scholar] [CrossRef] [PubMed] [Green Version]
  12. Keane, R.M.; Crawley, M.J. Exotic plant invasions and the enemy release hypothesis. Trends Ecol. Evol. 2002, 17, 164–170. [Google Scholar] [CrossRef]
  13. Blossey, B.; Notzold, R. Evolution of Increased Competitive Ability in Invasive Nonindigenous Plants: A Hypothesis. J. Ecol. 1995, 83, 887–889. [Google Scholar] [CrossRef]
  14. DeWalt, S.J.; Denslow, J.S.; Ickes, K. Natural-enemy Release Facilitates Habitat Expansion of The Invasive Tropical Shrub Clidemia Hirta. Ecology 2004, 85, 471–483. [Google Scholar] [CrossRef]
  15. Roy, B.A.; Hudson, K.; Visser, M.; Johnson, B.R. Grassland fires may favor native over introduced plants by reducing pathogen loads. Ecology 2014, 95, 1897–1906. [Google Scholar] [CrossRef] [PubMed]
  16. Vila, M.; Maron, J.L.; Marco, L. Evidence for the enemy release hypothesis in Hypericum perforatum. Oecologia 2005, 142, 474–479. [Google Scholar] [CrossRef] [PubMed]
  17. Callaway, R.M.; Thelen, G.C.; Rodriguez, A.; Holben, W.E. Soil biota and exotic plant invasion. Nature 2004, 427, 731–733. [Google Scholar] [CrossRef]
  18. Reinhart, K.O.; Callaway, R.M. Soil Biota Facilitate Exotic Acer Invasions in Europe and North America. Ecol. Appl. 2004, 14, 1737–1745. [Google Scholar] [CrossRef]
  19. Reinhart, K.O.; Tytgat, T.; Van der Putten, W.H.; Clay, K. Virulence of soil-borne pathogens and invasion by Prunus serotina. N. Phytol. 2010, 186, 484–495. [Google Scholar] [CrossRef]
  20. Wolfe, L.M. Why alien invaders succeed: Support for the escape-from-enemy hypothesis. Am. Nat. 2002, 160, 705–711. [Google Scholar] [CrossRef]
  21. Parker, J.D.; Hay, M.E. Biotic resistance to plant invasions? Native herbivores prefer non-native plants. Ecol. Lett. 2005, 8, 959–967. [Google Scholar] [CrossRef]
  22. Fan, S.; Yu, D.; Liu, C. The invasive plant Alternanthera philoxeroides was suppressed more intensively than its native congener by a native generalist: Implications for the biotic resistance hypothesis. PLoS ONE 2013, 8, e83619. [Google Scholar] [CrossRef] [PubMed]
  23. Levine, J.M.; Adler, P.B.; Yelenik, S.G. A meta-analysis of biotic resistance to exotic plant invasions. Ecol. Lett. 2004, 7, 975–989. [Google Scholar] [CrossRef] [Green Version]
  24. Lombardero, M.J.; Alonso-Rodríguez, M.; Roca-Posada, E.P. Tree insects and pathogens display opposite tendencies to attack native vs. non-native pines. For. Ecol. Manag. 2012, 281, 121–129. [Google Scholar] [CrossRef]
  25. Pearse, I.S.; Hipp, A.L. Phylogenetic and trait similarity to a native species predict herbivory on non-native oaks. Proc. Natl. Acad. Sci. USA 2009, 106, 18097–18102. [Google Scholar] [CrossRef] [PubMed] [Green Version]
  26. Knevel, I.C.; Lans, T.; Menting, F.B.; Hertling, U.M.; van der Putten, W.H. Release from native root herbivores and biotic resistance by soil pathogens in a new habitat both affect the alien Ammophila arenaria in South Africa. Oecologia 2004, 141, 502–510. [Google Scholar] [CrossRef]
  27. Mitchell, C.E.; Power, A.G. Release of invasive plants from fungal and viral pathogens. Nature 2003, 421, 625–627. [Google Scholar] [CrossRef]
  28. Colautti, R.I.; Eckert, C.G.; Barrett, S.C.H. Evolutionary constraints on adaptive evolution during range expansion in an invasive plant. Proc. R. Soc. B Biol. Sci. 2010, 277, 1799–1806. [Google Scholar] [CrossRef] [Green Version]
  29. Guggisberg, A.; Lai, Z.; Huang, J.; Rieseberg, L.H. Transcriptome divergence between introduced and native populations of Canada thistle, Cirsium arvense. N. Phytol. 2013, 199, 595–608. [Google Scholar] [CrossRef]
  30. Hodgins, K.A.; Lai, Z.; Nurkowski, K.; Huang, J.; Rieseberg, L.H. The molecular basis of invasiveness: Differences in gene expression of native and introduced common ragweed (Ambrosia artemisiifolia) in stressful and benign environments. Mol. Ecol. 2013, 22, 2496–2510. [Google Scholar] [CrossRef]
  31. Lai, Z.; Kane, N.C.; Zou, Y.; Rieseberg, L.H. Natural variation in gene expression between wild and weedy populations of Helianthus annuus. Genetics 2008, 179, 1881–1890. [Google Scholar] [CrossRef] [PubMed]
  32. Andersen, E.J.; Ali, S.; Byamukama, E.; Yen, Y.; Nepal, M.P. Disease Resistance Mechanisms in Plants. Genes 2018, 9, 339. [Google Scholar] [CrossRef] [PubMed]
  33. Zipfel, C.; Robatzek, S.; Navarro, L.; Oakeley, E.J.; Jones, J.D.; Felix, G.; Boller, T. Bacterial disease resistance in Arabidopsis through flagellin perception. Nature 2004, 428, 764–767. [Google Scholar] [CrossRef]
  34. Kaku, H.; Nishizawa, Y.; Ishii-Minami, N.; Akimoto-Tomiyama, C.; Dohmae, N.; Takio, K.; Minami, E.; Shibuya, N. Plant cells recognize chitin fragments for defense signaling through a plasma membrane receptor. Proc. Natl. Acad. Sci. USA 2006, 103, 11086–11091. [Google Scholar] [CrossRef] [PubMed] [Green Version]
  35. Fliegmann, J.; Mithofer, A.; Wanner, G.; Ebel, J. An ancient enzyme domain hidden in the putative beta-glucan elicitor receptor of soybean may play an active part in the perception of pathogen-associated molecular patterns during broad host resistance. J. Biol. Chem. 2004, 279, 1132–1140. [Google Scholar] [CrossRef]
  36. Zipfel, C. Plant pattern-recognition receptors. Trends Immunol. 2014, 35, 345–351. [Google Scholar] [CrossRef] [PubMed]
  37. Kourelis, J.; van der Hoorn, R.A.L. Defended to the Nines: 25 Years of Resistance Gene Cloning Identifies Nine Mechanisms for R Protein Function. Plant Cell 2018, 30, 285–299. [Google Scholar] [CrossRef] [Green Version]
  38. Dodds, P.N.; Rathjen, J.P. Plant immunity: Towards an integrated view of plant–pathogen interactions. Nat. Rev. Genet. 2010, 11, 539. [Google Scholar] [CrossRef]
  39. Dangl, J.L.; Horvath, D.M.; Staskawicz, B.J. Pivoting the plant immune system from dissection to deployment. Science 2013, 341, 746–751. [Google Scholar] [CrossRef]
  40. Jones, J.D.G.; Dangl, J.L. The plant immune system. Nature 2006, 444, 323–329. [Google Scholar] [CrossRef] [Green Version]
  41. Han, G.Z. Origin and evolution of the plant immune system. N. Phytol. 2019, 222, 70–83. [Google Scholar] [CrossRef] [PubMed]
  42. Dai, Z.-C.; Qi, S.-S.; Miao, S.-L.; Liu, Y.-T.; Tian, Y.-F.; Zhai, D.-L.; Huang, P.; Du, D.-L. Isolation of NBS-LRR RGAs from invasive Wedelia trilobata and the calculation of evolutionary rates to understand bioinvasion from a molecular evolution perspective. Biochem. Syst. Ecol. 2015, 61, 19–27. [Google Scholar] [CrossRef]
  43. Bari, R.; Jones, J.D. Role of plant hormones in plant defence responses. Plant Mol. Biol. 2009, 69, 473–488. [Google Scholar] [CrossRef] [PubMed]
  44. De Vos, M.; Van Oosten, V.R.; Van Poecke, R.M.; Van Pelt, J.A.; Pozo, M.J.; Mueller, M.J.; Buchala, A.J.; Metraux, J.P.; Van Loon, L.C.; Dicke, M.; et al. Signal signature and transcriptome changes of Arabidopsis during pathogen and insect attack. Mol. Plant Microbe Interact. MPMI 2005, 18, 923–937. [Google Scholar] [CrossRef] [PubMed]
  45. Jegadeesan, S.; Beery, A.; Altahan, L.; Meir, S.; Pressman, E.; Firon, N. Ethylene production and signaling in tomato (Solanum lycopersicum) pollen grains is responsive to heat stress conditions. Plant Reprod. 2018, 31, 367–383. [Google Scholar] [CrossRef] [PubMed]
  46. Ku, Y.S.; Sintaha, M.; Cheung, M.Y.; Lam, H.M. Plant Hormone Signaling Crosstalks between Biotic and Abiotic Stress Responses. Int. J. Mol. Sci. 2018, 19, 3206. [Google Scholar] [CrossRef]
  47. Mine, A.; Seyfferth, C.; Kracher, B.; Berens, M.L.; Becker, D.; Tsuda, K. The Defense Phytohormone Signaling Network Enables Rapid, High-Amplitude Transcriptional Reprogramming during Effector-Triggered Immunity. Plant Cell 2018, 30, 1199–1219. [Google Scholar] [CrossRef] [PubMed] [Green Version]
  48. Pieterse, C.M.; Van der Does, D.; Zamioudis, C.; Leon-Reyes, A.; Van Wees, S.C. Hormonal modulation of plant immunity. Annu. Rev. Cell Dev. Biol. 2012, 28, 489–521. [Google Scholar] [CrossRef]
  49. Cutler, S.R.; Rodriguez, P.L.; Finkelstein, R.R.; Abrams, S.R. Abscisic acid: Emergence of a core signaling network. Annu. Rev. Plant Biol. 2010, 61, 651–679. [Google Scholar] [CrossRef]
  50. Glazebrook, J. Contrasting mechanisms of defense against biotrophic and necrotrophic pathogens. Annu. Rev. Phytopathol. 2005, 43, 205–227. [Google Scholar] [CrossRef]
  51. Vlot, A.C.; Dempsey, D.A.; Klessig, D.F. Salicylic Acid, a multifaceted hormone to combat disease. Annu. Rev. Phytopathol. 2009, 47, 177–206. [Google Scholar] [CrossRef] [PubMed]
  52. Pieterse, C.M.; Leon-Reyes, A.; Van der Ent, S.; Van Wees, S.C. Networking by small-molecule hormones in plant immunity. Nat. Chem. Biol. 2009, 5, 308–316. [Google Scholar] [CrossRef] [PubMed] [Green Version]
  53. Leon-Reyes, A.; Spoel, S.H.; De Lange, E.S.; Abe, H.; Kobayashi, M.; Tsuda, S.; Millenaar, F.F.; Welschen, R.A.; Ritsema, T.; Pieterse, C.M. Ethylene modulates the role of NONEXPRESSOR OF PATHOGENESIS-RELATED GENES1 in cross talk between salicylate and jasmonate signaling. Plant Physiol. 2009, 149, 1797–1809. [Google Scholar] [CrossRef] [PubMed]
  54. Leon-Reyes, A.; Van der Does, D.; De Lange, E.S.; Delker, C.; Wasternack, C.; Van Wees, S.C.; Ritsema, T.; Pieterse, C.M. Salicylate-mediated suppression of jasmonate-responsive gene expression in Arabidopsis is targeted downstream of the jasmonate biosynthesis pathway. Planta 2010, 232, 1423–1432. [Google Scholar] [CrossRef] [Green Version]
  55. Niki, T.; Mitsuhara, I.; Seo, S.; Ohtsubo, N.; Ohashi, Y. Antagonistic Effect of Salicylic Acid and Jasmonic Acid on the Expression of Pathogenesis-Related (PR) Protein Genes in Wounded Mature Tobacco Leaves. Plant Cell Physiol. 1998, 39, 500–507. [Google Scholar] [CrossRef]
  56. El Oirdi, M.; El Rahman, T.A.; Rigano, L.; El Hadrami, A.; Rodriguez, M.C.; Daayf, F.; Vojnov, A.; Bouarab, K. Botrytis cinerea manipulates the antagonistic effects between immune pathways to promote disease development in tomato. Plant Cell 2011, 23, 2405–2421. [Google Scholar] [CrossRef]
  57. Anderson, J.V.; Dogramaci, M.; Horvath, D.P.; Foley, M.E.; Chao, W.S.; Suttle, J.C.; Thimmapuram, J.; Hernandez, A.G.; Ali, S.; Mikel, M.A. Auxin and ABA act as central regulators of developmental networks associated with paradormancy in Canada thistle (Cirsium arvense). Funct. Integr. Genom. 2012, 12, 515–531. [Google Scholar] [CrossRef]
  58. Schooler, S.S. Alternanthera philoxeroides (Martius) Grisebach. In A Handbook of Global Freshwater Invasive Species; Francis, R.A., Ed.; Routlegde: Abingdon, UK, 2012. [Google Scholar]
  59. Buckingham, G.R. Biological Control of Alligatorweed, Alternanthera philoxeroides, the World’s First Aquatic Weed Success Story. Castanea 1996, 61, 232–243. [Google Scholar]
  60. Wang, B.; Li, W.; Wang, J. Genetic diversity of Alternanthera philoxeroides in China. Aquat. Bot. 2005, 81, 277–283. [Google Scholar] [CrossRef]
  61. Feng, J.; Zhu, Y. Alien invasive plants in China: Risk assessment and spatial patterns. Biodivers. Conserv. 2010, 19, 3489–3497. [Google Scholar] [CrossRef]
  62. Wan, L.-Y. Clonal integration is beneficial for resource sharing in a creeping amphibian herb (Alteranthera philoxeroides). Folia Geobot. 2017, 52, 10–432. [Google Scholar] [CrossRef]
  63. Shen, J.; Shen, M.; Wang, X.; Lu, Y. Effect of environmental factors on shoot emergence and vegetative growth of alligatorweed (Alternanthera philoxcroides). Weed Sci. 2005, 53, 471–478. [Google Scholar] [CrossRef]
  64. Geng, Y.-P.; Pan, X.-Y.; Xu, C.-Y.; Zhang, W.-J.; Li, B.; Chen, J.-K.; Lu, B.-R.; Song, Z.-P. Phenotypic plasticity rather than locally adapted ecotypes allows the invasive alligator weed to colonize a wide range of habitats. Biol. Invasions 2007, 9, 245–256. [Google Scholar] [CrossRef]
  65. Gilbert, R.L.; Auld, B.A.; Hennecke, B.R. Leaf and stem spot of Alternanthera philoxeroides (alligatorweed) in Australia caused by Nimbya sp. Plant Pathol. 2005, 54, 585. [Google Scholar] [CrossRef]
  66. Pomella, A.W.V.; Barreto, R.W.; Charudattan, R. Nimbya alternantherae a potential biocontrol agent for alligatorweed, Alternanthera philoxeroides. BioControl 2007, 52, 271–288. [Google Scholar] [CrossRef]
  67. Tan, W.Z.; Li, Q.J.; Qing, L. Biological control of alligatorweed (Alternanthera philoxeroides) with a Fusarium sp. BioControl 2002, 47, 463–479. [Google Scholar] [CrossRef]
  68. Joyner, B.G.; Freeman, T.E. Pathogenicity of Rhizoctonia solani to aquatic plants. Phytopathology 1972, 63, 681–685. [Google Scholar] [CrossRef]
  69. Saveinai, R.; Baiswar, P.; Kumar, R.; Rajesh, T.; Behere, G.T. Pathogenicity of Rhizoctonia solani AG 1-IA on major weeds prevalent in rice and maize ecosystem in Meghalaya. Indian Phytopathol. 2017, 70, 91–97. [Google Scholar] [CrossRef]
  70. Prentis, P.J.; Wilson, J.R.; Dormontt, E.E.; Richardson, D.M.; Lowe, A.J. Adaptive evolution in invasive species. Trends Plant Sci. 2008, 13, 288–294. [Google Scholar] [CrossRef]
  71. Berens, M.L.; Berry, H.M.; Mine, A.; Argueso, C.T.; Tsuda, K. Evolution of Hormone Signaling Networks in Plant Defense. Annu. Rev. Phytopathol. 2017, 55, 401–425. [Google Scholar] [CrossRef]
  72. Mengiste, T. Plant immunity to necrotrophs. Annu. Rev. Phytopathol. 2012, 50, 267–294. [Google Scholar] [CrossRef] [PubMed]
  73. Zhang, J.; Chen, L.; Fu, C.; Wang, L.; Liu, H.; Cheng, Y.; Li, S.; Deng, Q.; Wang, S.; Zhu, J.; et al. Comparative Transcriptome Analyses of Gene Expression Changes Triggered by Rhizoctonia solani AG1 IA Infection in Resistant and Susceptible Rice Varieties. Front. Plant Sci. 2017, 8, 1422. [Google Scholar] [CrossRef] [PubMed]
  74. Melan, M.A.; Dong, X.; Endara, M.E.; Davis, K.R.; Ausubel, F.M.; Peterman, T.K. An Arabidopsis thaliana lipoxygenase gene can be induced by pathogens, abscisic acid, and methyl jasmonate. Plant Physiol. 1993, 101, 441–450. [Google Scholar] [CrossRef] [PubMed]
  75. Beckers, G.J.; Spoel, S.H. Fine-Tuning Plant Defence Signalling: Salicylate versus Jasmonate. Plant Biol. 2006, 8, 1–10. [Google Scholar] [CrossRef] [PubMed]
  76. Robert-Seilaniantz, A.; Grant, M.; Jones, J.D. Hormone crosstalk in plant disease and defense: More than just jasmonate-salicylate antagonism. Annu. Rev. Phytopathol. 2011, 49, 317–343. [Google Scholar] [CrossRef] [PubMed]
  77. Shigenaga, A.M.; Argueso, C.T. No hormone to rule them all: Interactions of plant hormones during the responses of plants to pathogens. Semin. Cell Dev. Biol. 2016, 56, 174–189. [Google Scholar] [CrossRef] [PubMed]
  78. Doares, S.H.; Narvaez-Vasquez, J.; Conconi, A.; Ryan, C.A. Salicylic Acid Inhibits Synthesis of Proteinase Inhibitors in Tomato Leaves Induced by Systemin and Jasmonic Acid. Plant Physiol. 1995, 108, 1741–1746. [Google Scholar] [CrossRef] [PubMed]
  79. Ma, K.W.; Ma, W. Phytohormone pathways as targets of pathogens to facilitate infection. Plant Mol. Biol. 2016, 91, 713–725. [Google Scholar] [CrossRef] [PubMed] [Green Version]
  80. Tanaka, S.; Han, X.; Kahmann, R. Microbial effectors target multiple steps in the salicylic acid production and signaling pathway. Front. Plant Sci. 2015, 6, 349. [Google Scholar] [CrossRef] [PubMed] [Green Version]
  81. Uppalapati, S.R.; Ishiga, Y.; Wangdi, T.; Kunkel, B.N.; Anand, A.; Mysore, K.S.; Bender, C.L. The phytotoxin coronatine contributes to pathogen fitness and is required for suppression of salicylic acid accumulation in tomato inoculated with Pseudomonas syringae pv. tomato DC3000. Mol. Plant Microbe Interact. 2007, 20, 955–965. [Google Scholar] [CrossRef]
  82. Rahman, T.A.; Oirdi, M.E.; Gonzalez-Lamothe, R.; Bouarab, K. Necrotrophic pathogens use the salicylic acid signaling pathway to promote disease development in tomato. Mol. Plant Microbe Interact. MPMI 2012, 25, 1584–1593. [Google Scholar] [CrossRef] [PubMed]
  83. Portieles, R.; Ochagavia, M.E.; Canales, E.; Silva, Y.; Chacon, O.; Hernandez, I.; Lopez, Y.; Rodriguez, M.; Terauchi, R.; Borroto, C.; et al. High-throughput SuperSAGE for gene expression analysis of Nicotiana tabacum-Rhizoctonia solani interaction. BMC Res. Notes 2017, 10, 603. [Google Scholar] [CrossRef] [PubMed]
  84. Derksen, H.; Rampitsch, C.; Daayf, F. Signaling cross-talk in plant disease resistance. Plant Sci. 2013, 207, 79–87. [Google Scholar] [CrossRef]
  85. Broekaert, W.F.; Delaure, S.L.; De Bolle, M.F.; Cammue, B.P. The role of ethylene in host-pathogen interactions. Annu. Rev. Phytopathol. 2006, 44, 393–416. [Google Scholar] [CrossRef] [PubMed]
  86. Penninckx, I.A.; Thomma, B.P.; Buchala, A.; Metraux, J.P.; Broekaert, W.F. Concomitant activation of jasmonate and ethylene response pathways is required for induction of a plant defensin gene in Arabidopsis. Plant Cell 1998, 10, 2103–2113. [Google Scholar] [CrossRef]
  87. Adie, B.A.; Perez-Perez, J.; Perez-Perez, M.M.; Godoy, M.; Sanchez-Serrano, J.J.; Schmelz, E.A.; Solano, R. ABA is an essential signal for plant resistance to pathogens affecting JA biosynthesis and the activation of defenses in Arabidopsis. Plant Cell 2007, 19, 1665–1681. [Google Scholar] [CrossRef]
  88. De Vos, M.; Van Zaanen, W.; Koornneef, A.; Korzelius, J.P.; Dicke, M.; Van Loon, L.C.; Pieterse, C.M.J. Herbivore-Induced Resistance against Microbial Pathogens in Arabidopsis. Plant Physiol. 2006, 142, 352–363. [Google Scholar] [CrossRef] [Green Version]
  89. Chen, H.; Xue, L.; Chintamanani, S.; Germain, H.; Lin, H.; Cui, H.; Cai, R.; Zuo, J.; Tang, X.; Li, X.; et al. ETHYLENE INSENSITIVE3 and ETHYLENE INSENSITIVE3-LIKE1 repress SALICYLIC ACID INDUCTION DEFICIENT2 expression to negatively regulate plant innate immunity in Arabidopsis. Plant Cell 2009, 21, 2527–2540. [Google Scholar] [CrossRef]
  90. Spoel, S.H.; Johnson, J.S.; Dong, X. Regulation of tradeoffs between plant defenses against pathogens with different lifestyles. Proc. Natl. Acad. Sci. USA 2007, 104, 18842–18847. [Google Scholar] [CrossRef] [Green Version]
  91. Spoel, S.H.; Dong, X. Making sense of hormone crosstalk during plant immune responses. Cell Host Microbe 2008, 3, 348–351. [Google Scholar] [CrossRef]
  92. Spoel, S.H.; Dong, X. How do plants achieve immunity? Defence without specialized immune cells. Nat. Rev. Immunol. 2012, 12, 89–100. [Google Scholar] [CrossRef] [PubMed]
  93. Ton, J.; Van Pelt, J.A.; Van Loon, L.C.; Pieterse, C.M. Differential effectiveness of salicylate-dependent and jasmonate/ethylene-dependent induced resistance in Arabidopsis. Mol. Plant Microbe Interact. MPMI 2002, 15, 27–34. [Google Scholar] [CrossRef] [PubMed]
  94. Heil, M.; Ton, J. Long-distance signalling in plant defence. Trends Plant Sci. 2008, 13, 264–272. [Google Scholar] [CrossRef] [PubMed]
  95. Julien, M.H.; Skarratt, B.; Maywald, G.F. Potential geographical distribution of alligator weed and its biological control by Agasicles hygrophila. J. Aquat. Plant Manag. 1995, 33, 55–60. [Google Scholar]
  96. Weber, E.; Sun, S.-G.; Li, B. Invasive alien plants in China: Diversity and ecological insights. Biol. Invasions 2008, 10, 1411–1429. [Google Scholar] [CrossRef]
  97. Dai, Z.C.; Fu, W.; Qi, S.S.; Zhai, D.L.; Chen, S.C.; Wan, L.Y.; Huang, P.; Du, D.L. Different Responses of an Invasive Clonal Plant Wedelia trilobata and its Native Congener to Gibberellin: Implications for Biological Invasion. J. Chem. Ecol. 2016, 42, 85–94. [Google Scholar] [CrossRef]
  98. Paulitz, T.C.; Okubara, P.A.; Schillinger, W.F. First Report of Damping-Off of Canola Caused by Rhizoctonia solani AG 2-1 in Washington State. Plant Dis. 2006, 90, 829. [Google Scholar] [CrossRef] [PubMed]
  99. Matsumoto, M. Trials of direct detection and identification of Rhizoctonia solani AG 1 and AG 2 subgroups using specifically primed PCR analysis. Mycoscience 2002, 43, 185–189. [Google Scholar] [CrossRef]
  100. White, T.J.; Bruns, T.; Lee, S.; Taylor, J. Amplification and direct sequencing of fungal ribosomal RNA genes for phylogenetics. In PCR Protocols: A Guide to Methods and Applications; Innis, M.A., Gelfand, D.H., Sninsky, J.J., White, T.J., Eds.; Academic Press: San Diego, CA, USA, 1990; pp. 315–322. [Google Scholar]
  101. McWilliam, H.; Li, W.; Uludag, M.; Squizzato, S.; Park, Y.M.; Buso, N.; Cowley, A.P.; Lopez, R. Analysis Tool Web Services from the EMBL-EBI. Nucleic Acids Res. 2013, 41, W597–W600. [Google Scholar] [CrossRef] [Green Version]
  102. Untergasser, A.; Cutcutache, I.; Koressaar, T.; Ye, J.; Faircloth, B.C.; Remm, M.; Rozen, S.G. Primer3—New capabilities and interfaces. Nucleic Acids Res. 2012, 40, e115. [Google Scholar] [CrossRef]
  103. Dellaporta, S.L.; Wood, J.; Hicks, J.B. A plant DNA minipreparation: Version II. Plant Mol. Biol. Rep. 1983, 1, 19–21. [Google Scholar] [CrossRef]
  104. Thornton, B.; Basu, C. Real-time PCR (qPCR) primer design using free online software. Biochem. Mol. Biol. Educ. A Bimon. Publ. Int. Union Biochem. Mol. Biol. 2011, 39, 145–154. [Google Scholar] [CrossRef] [PubMed]
  105. El Oirdi, M.; Bouarab, K. Plant signalling components EDS1 and SGT1 enhance disease caused by the necrotrophic pathogen Botrytis cinerea. N. Phytol. 2007, 175, 131–139. [Google Scholar] [CrossRef] [PubMed]
  106. Lin, L.; Han, X.; Chen, Y.; Wu, Q.; Wang, Y. Identification of appropriate reference genes for normalizing transcript expression by quantitative real-time PCR in Litsea cubeba. Mol. Genet. Genom. Mgg 2013, 288, 727–737. [Google Scholar] [CrossRef]
  107. Livak, K.J.; Schmittgen, T.D. Analysis of relative gene expression data using real-time quantitative PCR and the 2(-Delta Delta C(T)) Method. Methods 2001, 25, 402–408. [Google Scholar] [CrossRef]
  108. Koch, E.; Slusarenko, A. Arabidopsis is susceptible to infection by a downy mildew fungus. Plant Cell 1990, 2, 437–445. [Google Scholar]
  109. Abràmoff, M.D.; Magalhães, P.J.; Ram, S.J. Image Processing with ImageJ. Biophoton. Int. 2004, 11, 36–42. [Google Scholar]
  110. Hatsugai, N.; Katagiri, F. Quantification of Plant Cell Death by Electrolyte Leakage Assay. Bio Protoc. 2018, 8, e2758. [Google Scholar] [CrossRef]
  111. Min, X.J.; Butler, G.; Storms, R.; Tsang, A. OrfPredictor: Predicting protein-coding regions in EST-derived sequences. Nucleic Acids Res. 2005, 33, W677–W680. [Google Scholar] [CrossRef]
  112. Huang, X.; Madan, A. CAP3: A DNA sequence assembly program. Genome Res. 1999, 9, 868–877. [Google Scholar] [CrossRef]
  113. Solovyev, V.; Kosarev, P.; Seledsov, I.; Vorobyev, D. Automatic annotation of eukaryotic genes, pseudogenes and promoters. Genome Biol. 2006, 7, S10.1–S12. [Google Scholar] [CrossRef]
  114. Kumar, S.; Stecher, G.; Tamura, K. MEGA7: Molecular Evolutionary Genetics Analysis Version 7.0 for Bigger Datasets. Mol. Biol. Evol. 2016, 33, 1870–1874. [Google Scholar] [CrossRef] [Green Version]
  115. Bailey, T.L.; Boden, M.; Buske, F.A.; Frith, M.; Grant, C.E.; Clementi, L.; Ren, J.; Li, W.W.; Noble, W.S. MEME Suite: Tools for motif discovery and searching. Nucleic Acids Res. 2009, 37, W202–W208. [Google Scholar] [CrossRef]
  116. Marchler-Bauer, A.; Bo, Y.; Han, L.; He, J.; Lanczycki, C.J.; Lu, S.; Chitsaz, F.; Derbyshire, M.K.; Geer, R.C.; Gonzales, N.R.; et al. CDD/SPARCLE: Functional classification of proteins via subfamily domain architectures. Nucleic Acids Res. 2017, 4, D200–D203. [Google Scholar] [CrossRef]
  117. Ding, Y.; Sun, T.; Ao, K.; Peng, Y.; Zhang, Y.; Li, X.; Zhang, Y. Opposite Roles of Salicylic Acid Receptors NPR1 and NPR3/NPR4 in Transcriptional Regulation of Plant Immunity. Cell 2018, 173, 1454–1467. [Google Scholar] [CrossRef]
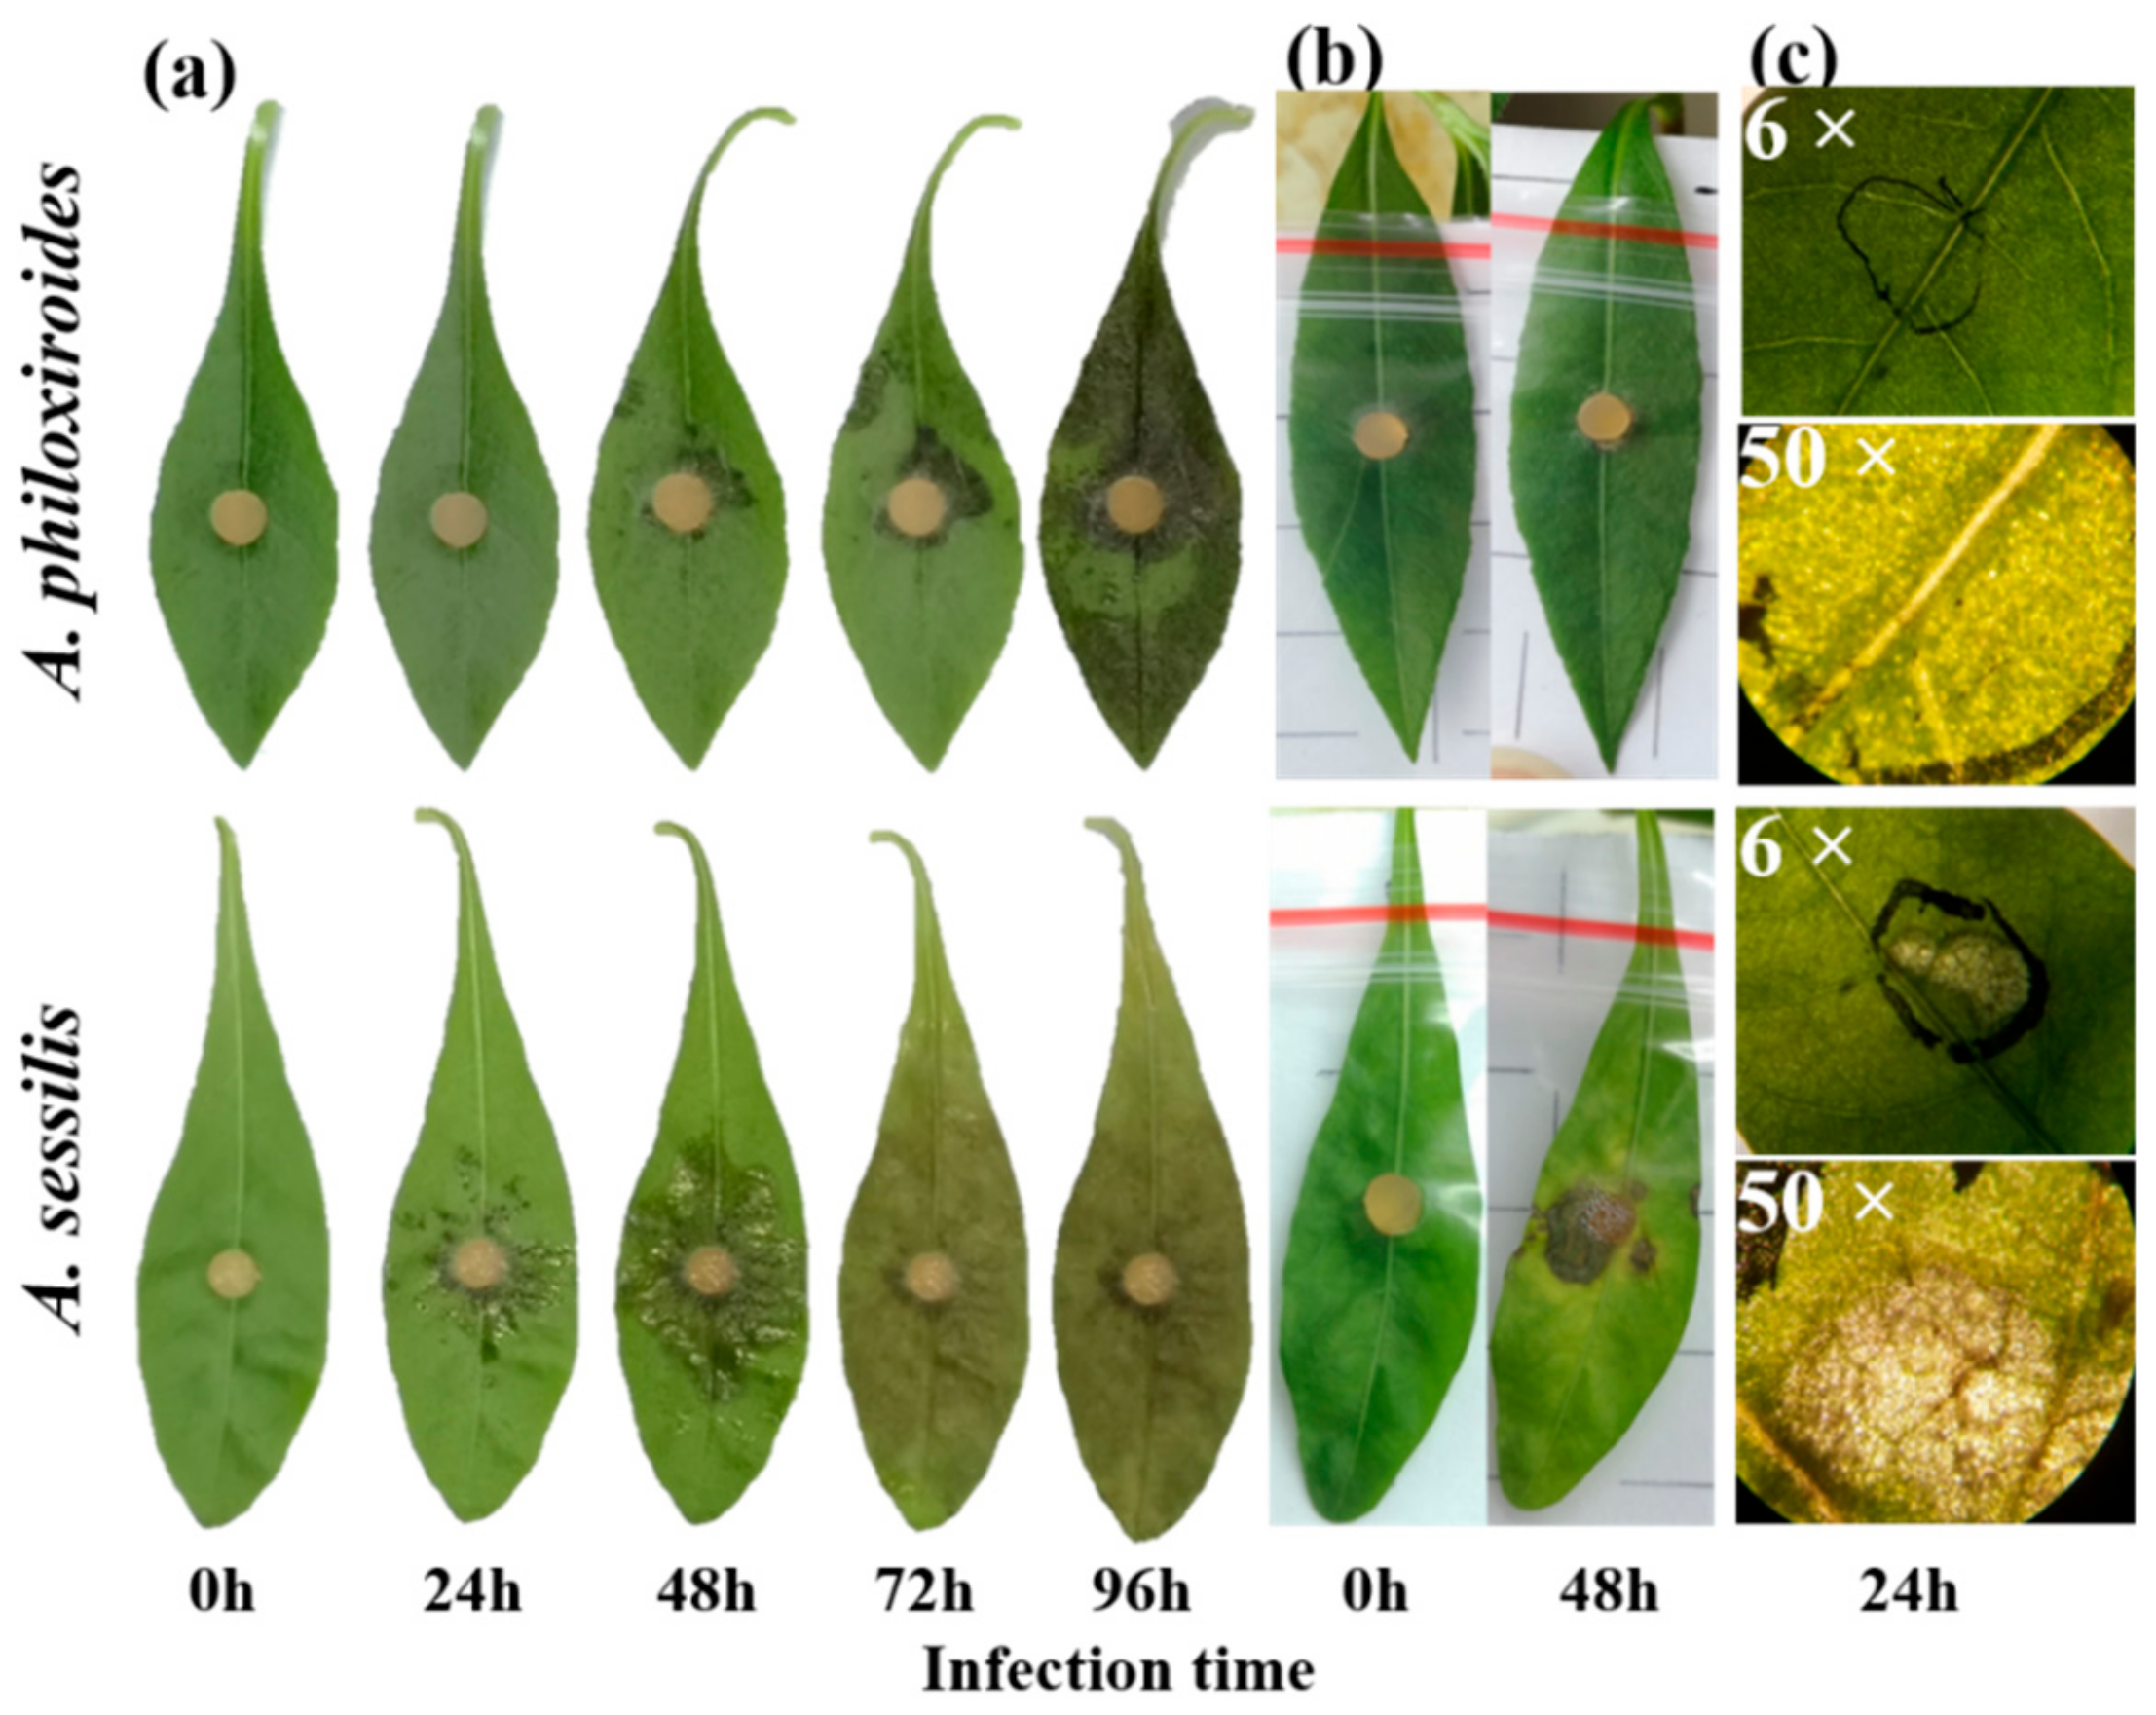
Figure 1. Disease symptoms caused by R. solani on invasive A. philoxiroides and native A. sessilis showing (a) in vitro detached leaf assay; (b) in planta pathogenicity test; and (c) microscopic observation of the infected area on leaves (at 24 hpi). Four-week-old plant leaves were inoculated with mycelium plugs of R. solani and disease symptoms were observed at various time intervals (24, 48, 72 and 96 hpi). For in planta tests, plastic bags were placed on the leaves after inoculation to avoid drying of plugs and moisture development for better infections. In (c), the inoculated area is circled with a black marker. After removing plugs, threads of fungal mycelium can be seen on the leaf surface in A. philoxiroides, indicating fungal colonization. This is in contrast to the clear necrotic disease lesions in A. sessilis.
Ijms 20 04916 g001
Figure 2. Trypan blue staining and ion leakage tests of R. solani infected leaves from invasive A. philoxiroides (AP) and native A. sessilis (AS) at different time intervals after inoculation. (a) Before and after staining with trypan blue for visualizing dead plant leave tissues. Circled areas on leaves are at 0 h (un-inoculated control) and 24 h (inoculated) before staining. (b) Cell death areas represented by means ± standard errors (SE) from three biological replicates with different letters representing the groups that were significantly different from other groups as determined by a one-way analysis of variance (ANOVA), followed by a multiple comparison using Duncan’s method (p < 0.05). (c) Electrolyte leakage of leaf discs infected by R. solani from 2 h to 96 h measured using an electrolytes’ conductivity meter. Electrolytic conductivity increased in native AS during earlier time intervals; however, it increased in invasive AP at later time intervals compared to the un-inoculated control (0 h). Error bars indicate means ± SE (number of disks = 12 for each species) and two discs from each plant representing a total of six biological replicates for each species. Asterisks indicate significantly different from native plants using Duncan’s method (p < 0.01).
Ijms 20 04916 g002
Figure 3. qPCR analysis of salicylic acid (SA), jasmonic acid (JA) and ethylene (ET)- responsive gene expressions between invasive A. philoxiroides (AP) and native A. sessilis (AS). Four-week-old plants were infected with R. solani and the samples were harvested for RNA extractions at the indicated time intervals (0 to 96 hours) after inoculations. Un-inoculated leaves were used as a control (0 h). Specific primers were used for JAR1 (a), PR6 (b), PAL (c), PR3 (d) and EIN3 (e) with Actin (control) as shown in Supplementary Table S2. Values represent means ± SE from three biological replicates. The asterisks (*) represent significantly different levels at each time period and were determined using one-way ANOVA, followed by a multiple comparison using Duncan’s method (p < 0.05).
Ijms 20 04916 g003
Figure 4. Expression analysis of SA, JA and ET-responsive genes for systemic acquired resistance tests between Alternanthera philoxiroides (AP) and A. sessilis (AS). Four-week-old plants were infected with R. solani and samples of healthy un-inoculated leaves were sampled for RNA extractions at the indicated time intervals (0 to 96 hours). 0 h is from the samples of plant completely un-infected for control. Relative expression of JAR1 (a), LOX (b), PR6 (c), PAL (d), PR3 (e), EIN3 (f) and Actin (control) were tested using gene specific primers at the indicated time intervals. Error bars show ± SE from three biological replicates and the asterisks (*) represent significantly different levels, which were determined via a one-way ANOVA, followed by a multiple comparison using Duncan’s method (p < 0.05).
Ijms 20 04916 g004
Figure 5. Expression analysis of SA, JA and ET-responsive genes for hormone pre-treatment tests between Alternanthera philoxiroides (AP) and A. sessilis (AS). Four-week-old plants were sprayed with MeJA pretreatment (a,b) SA pretreatment (c,d), and ET pretreatment (e) before being inoculated with R. solani. Samples were harvested for RNA extractions at the indicated time intervals after inoculations. Un-inoculated leaves were used as a control (0 h). Specific primers were used for JAR1 (a), PR6 (b), PAL (c), PR3 (d) and EIN3 (e) with Actin (control) being tested using gene specific primers at the indicated time intervals. Values represent means ± SE from three biological replicates. Asterisk (*) represent significantly different levels at each time period and was determined via a one-way ANOVA, followed by a multiple comparison using Duncan’s method (p < 0.05).
Ijms 20 04916 g005
Figure 6. qPCR analysis of JA-dependent gene expression in A. philoxiroides. Four-week-old plants were infected with R. solani (ac), or sprayed with MeJA pretreatment before being inoculated with R. solani (df). Samples were harvested for RNA extractions at the indicated time points (0 to 96 hours). 0 h is the un-inoculated control. Relative expression of JA responsive genes: JAR1 (a and d), PR6 (b and e), LOX (c,f) were tested with specific primers for A. philoxiroides as described in the Methods and Supplementary Table S2. Values represent means ± SE from three biological replicates.
Ijms 20 04916 g006
Figure 7. qPCR analysis of SA and ET-responsive gene expression in A. philoxiroides. Four-week-old plants were infected with R. solani (ac), or were sprayed prior to R. solani inoculations with SA pretreatment (d,e) or ET pretreatment (f). Samples were harvested for RNA extractions at the indicated time points after the inoculations. 0 h is the un-inoculated control. qPCR was performed with specific primers for SA-PAL (a,d), PR3 (b,e), ET-EIN3 (c,f) and Actin (control) as described in the Methods and shown in Supplementary Table S2. Values represent means ±SE from three biological replicates.
Ijms 20 04916 g007
Figure 8. Signaling cross-talk analysis between SA, JA and ET-responsive gene expressions during hormone pretreatments, before R. solani inoculations in A. philoxiroides. Four-week-old plants were sprayed with MeJA (a, b and d) and SA (c). Samples were harvested for RNA extractions at the indicated time points. Un-inoculated leaves were used as a control (0 h). qRT-PCR was performed with specific primers for SA-PAL (a), PR3 (b), ET-EIN3 (c,d) and Actin (control) as described in the Methods and shown in Supplementary Table S2. Values represent means ± SE from three biological replicates.
Ijms 20 04916 g008
Figure 9. Expression analysis of SA, JA and ET-responsive genes for systemic acquired resistance tests in A. philoxiroides. Four-week-old A. philoxiroides were infected with R. solani and samples of healthy un-inoculated leaves were collected for RNA extractions (at time intervals from 0 to 96 hours). 0 h is from the samples of plant completely un-infected for control. Relative expression of JAR1 (a), PAL (b), LOX (c), PR6 (d), PR3 (e) and EIN3 (f) with Actin (control) genes were tested using specific primers at the indicated time intervals. Values represent means ± SE from three biological replicates.
Ijms 20 04916 g009
Figure 10. Proposed model showing response of defense hormone genes, salicylic acid (SA), jasmonic acid (JA), and ethylene (ET) during pathogenesis in an invasive Alternanthera philoxeroides (AP) and native A. sessilis (AS). We investigated the molecular interactions between R. solani compared to two species (focusing on defense hormone signaling). Two key differences in hormone gene expressions were identified between species during pathogenesis. Firstly, the JA and ET-signaling was differentially regulated between species (partially suppressed in A. sessilis, whereas there was a consistent reduction in expression in A. philoxiroides, shown as difference in height and color of JA). Reduction in JA-dependent LOX, JAR1 and PR6 expressions during disease development suggested that JA-signaling is responsible for resistance to R. solani. Secondly, ET-EIN3 expression was reduced in A. sessilis, but was induced in A. philoxiroides (shown as difference in height and color of ET). SA level was induced in both species. The elevated levels of SA in both species during disease development suggest that the unknown virulence factor from pathogenic R. solani may potentially target SA. This in turn may affect the antagonistic effect between SA and JA/ET differentially between species (shown as a different arrow between SA and ET). Circled SA-PAL and JA-JAR1 show antagonistic effects in both the local inoculated and neighboring systemic leaves. Dotted circles (PR3, EIN3 and PR6) represent differential regulation in both inoculated and un-inoculated systemic sites.
Ijms 20 04916 g010
Table 1. Expression differences in defense hormones and their responsive genes in the invasive A. philoxeroides and native A. sessilis during R. solani pathogenesis. See Table S1 for fold–change ratios of each gene for each treatment in both the invasive and native species.
TreatmentAlternanthera philoxeroidesAlternanthera sessilis
Rhizoctonia solani
(Infected local leaves)
- JA was suppressed
(JAR1 (Figure 3a) and PR6 (Figure 3b))
- JA was partially suppressed
(JAR1 (Figure 3a) and PR6 (Figure 3b))
- SA was induced
(PAL (Figure 3c) and PR3 (Figure 3d))
- SA was induced
(PAL (Figure 3c) and PR3 (Figure 3d))
- ET was induced
(EIN3 (Figure 3e))
- ET was suppressed
(EIN3 (Figure 3e))
- SA may promote disease development by
suppressing JA and by inducing ET (Figure 3)
- Strong antagonistic cross-talk between SA and JA
- Stronger antagonistic resistance cross-talk between
SA and JA may be reason for the delayed disease
development (Figure 1 and Figure 2)
- SA may promote disease development but by partially
suppressing JA and by completely suppressing ET (Figure 3)
- No strict or strong antagonistic cross-talk between SA and JA
- Lack of stronger antagonistic resistance effect between
SA and JA may be reason for the enhanced disease
development (Figure 1 and Figure 2)
Rhizoctonia solani
(Systemic leaves)
- JA-JAR1 was suppressed (Figure 4a)
- JA-LOX (Figure 4b) and PR6 (Figure 4c) was induced
but lower than A. sessilis
- JA was induced
(JAR1 (Figure 4a), LOX (Figure 4b) and PR6 (Figure 4c))
- SA-PAL was induced from 48 hpi (Figure 4d)
- SA-PR3 was suppressed at all time (Figure 4e)
- SA-PAL was induced at all the indicated time (Figure 4d)
- SA-PR3 was completely suppressed (Figure 4e)
- ET-EIN3 was suppressed all the time (Figure 4f)- ET-EIN3 was partially suppressed (Figure 4f)
- An antagonism between SA-PAL and JA-JAR1 was
observed (Figure 4)
- No antagonism between SA-PAL and JA-JAR1 was
observed (Figure 4)
Rhizoctonia solani
(Hormone contents)
- Endogenous contents of SA, JA and ET were
higher. For example, at 96 hpi, SA, JA and ET
contents were significantly higher than control
samples (Figure S1)
- Endogenous contents of SA, JA and ET were
comparatively lower. For example, at 96 hpi, SA, JA
and ET contents were significantly higher than control
samples (Figure S1)