Histone Deacetylase HDT1 is Involved in Stem Vascular Development in Arabidopsis

 ,
,
Abstract
1. Introduction
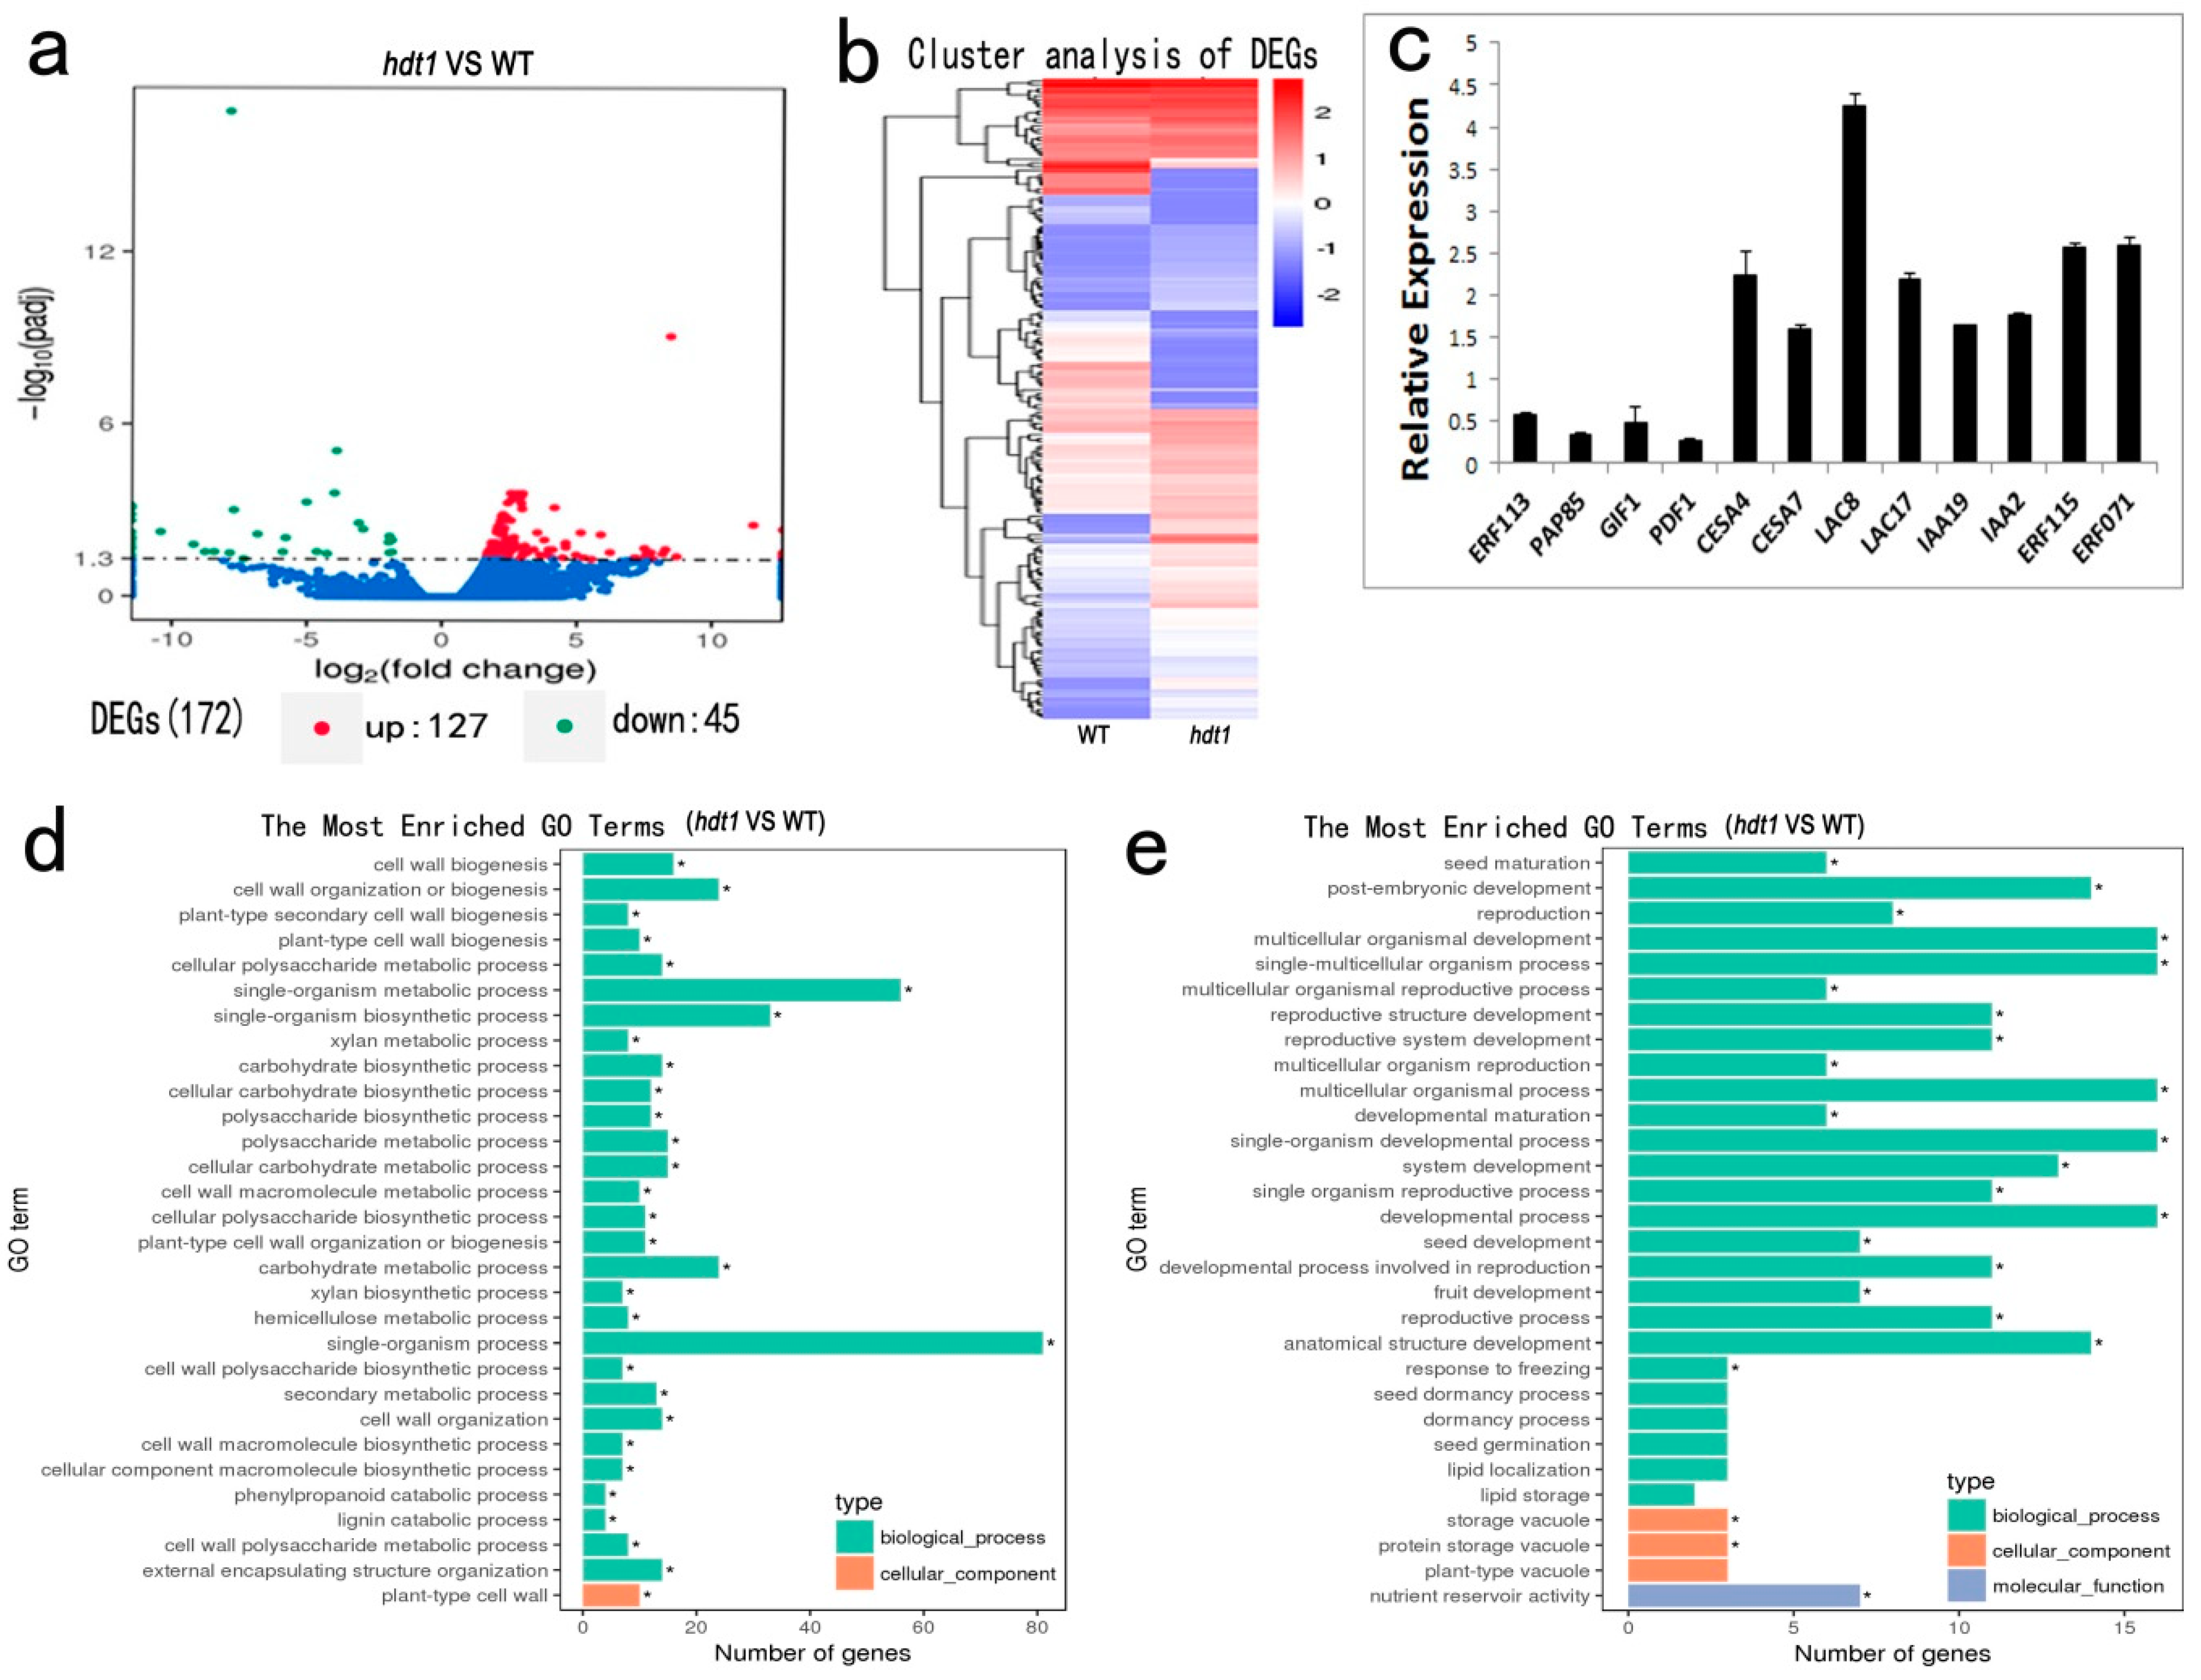
2. Results
2.1. Characterization of HDT1 Expression and Morphological Analysis of the hdt1 Mutant in Arabidopsis
2.2. Morphological Analysis of the hdt1 Mutants
2.3. Xylem Cellular Structure in the hdt1 Mutant
2.4. Lignin Analysis
2.5. Changes in Expression of Genes Affected by HDT1 During Stem Development
3. Discussion
3.1. HDT1 Participates in Regulation of Secondary Cell Wall Deposition during Xylem Development
3.2. HDT1 Regulates Cell Division in Vascular Cambium
4. Materials and Methods
4.1. Plant Materials and Growth Conditions
4.2. Stem Growth Phenotype Analyses
4.3. RT-PCR and Quantitative Real-Time PCR (qRT-PCR)
4.4. RNA-Sequencing and Analysis of Differentially Expressed Genes
4.5. Microscopy
4.6. Transmission Electron Microscopy (TEM)
4.7. Lignin Analysis
Supplementary Materials
Author Contributions
Funding
Acknowledgments
Conflicts of Interest
Abbreviations
| HDAC | Histone deacetylase |
| HD2 | HD-tuins |
| HAT | Histone transferase |
| RPD3 | Reduced potassium dependency 3 |
| sir2 | Silent information regulator 2 |
| RT-PCR | Reverse transcription-polymerase chain reaction |
| qRT-PCR | quantitative real-time PCR |
| GA | Gibberellin |
| TEM | Transmission electron microscopy |
| GO | Gene Ontology |
| RPKM | Per kb per million reads |
| TE | Tracheary elements |
| DEGs | Differentially expressed genes |
| CESA | Cellulose synthase |
| CT | Complementation transgenic |
| WT | Wild type |
| CESA | Cellulose synthase |
| PAL1 | Phenylalanine ammonia-lyase 1 |
| LAC | Laccase |
| FLA | Fasciclin-like arabinogalactan protein |
| AUX/IAA | AUXIN/INDOLE-3-ACETIC ACID |
| GUX1 | Xylan alpha-glucuronosyltransferase 1 |
| ERF | ETHYLENE RESPONSE FACTOR |
| PDF1 | PROTODERMAL FACTOR 1 |
| TSA | Trichostatin A |
| H3 | Histone 3 |
| ChIP | Chromatin immunoprecipitation |
| BiFC | Bimolecular fluorescence complementation |
References
- Jouannet, V.; Brackmann, K.; Greb, T. (Pro) cambium formation and proliferation: Two sides of the same coin? Curr. Opin. Plant Biol. 2015, 23, 54–60. [Google Scholar] [CrossRef] [PubMed]
- Aloni, R. Ecophysiological implications of vascular differentiation and plant evolution. Trees 2015, 29, 1–16. [Google Scholar] [CrossRef]
- Little, C.H.A.; Macdonald, J.E.; Olsson, O. Involvement of indole-3-acetic acid in fascicular and interfascicular cambial growth and interfascicular extraxylary fiber differentiation in Arabidopsis thaliana inflorescence stems. Int. J. Plant Sci. 2002, 163, 519–529. [Google Scholar] [CrossRef]
- Agusti, J.; Herold, S.; Schwarz, M.; Sanchez, P.; Ljung, K.; Dun, E.A.; Brewer, P.B.; Beveridge, C.A.; Sieberer, T.; Sehr, E.M.; et al. Strigolactone signaling is required for auxin-dependent stimulation of secondary growth in plants. J. Proc. Natl. Acad Sci. USA 2011, 108, 20242–20247. [Google Scholar] [CrossRef] [PubMed]
- Ilegems, M.; Douet, V.; Meylan-Bettex, M.; Uyttewaal, M.; Brand, L.; Bowman, J.L.; Stieger, P.A. Interplay of auxin, KANADI and Class III HD-ZIP transcription factors in vascular tissue formation. Development 2010, 137, 975–984. [Google Scholar] [CrossRef] [PubMed]
- Ohashi-Ito, K.; Kubo, M.; Demura, T.; Fukuda, H. Class III homeodomain leucine-zipper proteins regulate xylem cell differentiation. Plant Cell Physiol. 2005, 46, 1646–1656. [Google Scholar] [CrossRef] [PubMed]
- Ehlting, J.; Mattheus, N.; Aeschliman, D.S.; Li, E.; Hamberger, B.; Cullis, I.F.; Zhuang, J.; Kaneda, M.; Mansfield, S.D.; Samuels, L.; et al. Global transcript profiling of primary stems from Arabidopsis thaliana identifies candidate genes for missing links in lignin biosynthesis and transcriptional regulators of fiber differentiation. Plant J. 2010, 42, 618–640. [Google Scholar] [CrossRef] [PubMed]
- Ko, J.H.; Beers, E.P.; Han, K.H. Genomics Global comparative transcriptome analysis identifies gene network regulating secondary xylem development in Arabidopsis thaliana. Mol. Genet. 2006, 276, 517–531. [Google Scholar]
- Zhao, C.; Johanna, C.C.; Petzold, H.E.; Allan, W.D.; Beers, E.P. The xylem and phloem transcriptomes from secondary tissues of the Arabidopsis root-hypocotyl. Plant Physiol. 2005, 138, 803–818. [Google Scholar] [CrossRef] [PubMed]
- Ko, J.-H.; Kim, W.-C.; Han, K.-H. Ectopic expression of MYB46 identifies transcriptional regulatory genes involved in secondary wall biosynthesis in Arabidopsis. Plant J. Cell Mol. Biol. 2010, 60, 649–665. [Google Scholar] [CrossRef] [PubMed]
- McCarthy, R.L.; Zhong, R.; Ye, Z.H. MYB83 is a direct target of SND1 and acts redundantly with MYB46 in the regulation of secondary cell wall biosynthesis in Arabidopsis. Plant Cell Physiol. 2009, 50, 1950–1964. [Google Scholar] [CrossRef] [PubMed]
- Zhou, J.; Lee, C.; Zhong, R.; Ye, Z.H. MYB58 and MYB63 are transcriptional activators of the lignin biosynthetic pathway during secondary cell wall formation in Arabidopsis. Plant Cell 2009, 21, 248–266. [Google Scholar] [CrossRef] [PubMed]
- Zhong, R.; Richardson, E.A.; Ye, Z.H. The MYB46 transcription factor is a direct target of SND1 and regulates secondary wall biosynthesis in Arabidopsis. Plant Cell 2007, 19, 2776–2792. [Google Scholar] [CrossRef] [PubMed]
- De Veylder, L.; Beeckman, T.; Beemster, G.T.; de Almeida, E.J.; Ormenese, S.; Maes, S.; Naudts, M.; van der Schueren, E.; Jacqmard, A.; Engler, G.; et al. Control of proliferation, endoreduplication and differentiation by the Arabidopsis E2Fa–DPa transcription factor. EMBO J. 2002, 21, 1360–1368. [Google Scholar] [CrossRef] [PubMed]
- Jenuwein, T.; Allis, C.D. Translating the histone code. Science 2001, 293, 1074–1080. [Google Scholar] [CrossRef] [PubMed]
- Turner, B.M. Cellular memory and the histone code. Cell 2002, 111, 285–291. [Google Scholar] [CrossRef]
- Shahbazian, M.M.G. Functions of Site-Specific Histone Acetylation and Deacetylation. Ann. Rev. Biochem. 2007, 76, 75–100. [Google Scholar] [CrossRef] [PubMed]
- Millar, C.B.; Xu, F.; Zhang, K.; Grunstein, M. Acetylation of H2AZ Lys 14 is associated with genome-wide gene activity in yeast. Genes Dev. 2006, 20, 711–722. [Google Scholar] [CrossRef]
- Pandey, R.; MuÈller, A.; Napoli, C.A.; Selinger, D.A.; Pikaard, C.S.; Richards, E.J.; Bender, J.; Mount, D.W.; Jorgensen, R.A. Analysis of histone acetyltransferase and histone deacetylase families of Arabidopsis thaliana suggests functional diversification of chromatin modification among multicellular eukaryotes. Nucleic Acids Res. 2002, 30, 5036–5055. [Google Scholar] [CrossRef]
- Alinsug, M.V.; Yu, C.-W.; Wu, K. Phylogenetic analysis, subcellular localization, and expression patterns of RPD3/HDA1 family histone deacetylases in plants. BMC Plant Biol. 2009, 9, 37. [Google Scholar] [CrossRef]
- Hollender, C.; Liu, Z. Histone deacetylase genes in Arabidopsis development. J. Integr. Plant Biol. 2008, 50, 875–885. [Google Scholar] [CrossRef] [PubMed]
- Luo, M.; Wang, Y.-Y.; Liu, X.; Yang, S.; Lu, Q.; Cui, Y.; Wu, K. HD2C interacts with HDA6 and is involved in ABA and salt stress response in Arabidopsis. J. Exp. Bot. 2012, 63, 3297–3306. [Google Scholar] [CrossRef] [PubMed]
- Cigliano, R.A.; Cremona, G.; Paparo, R.; Termolino, P.; Perrella, G.; Gutzat, R.; Consiglio, M.F.; Conicella, C. Histone deacetylase AtHDA7 is required for female gametophyte and embryo development in Arabidopsis. Plant Physiol. 2013, 163, 431–440. [Google Scholar] [CrossRef] [PubMed]
- Van Zanten, M.; Zöll, C.; Wang, Z.; Philipp, C.; Carles, A.; Li, Y.; Kornet, N.G.; Liu, Y.; Soppe, W.J.J. HISTONE DEACETYLASE 9 represses seedling traits in Arabidopsis thaliana dry seeds. Plant J. 2015, 80, 475–488. [Google Scholar] [CrossRef] [PubMed]
- Tian, L.; Chen, Z.J. Blocking histone deacetylation in Arabidopsis induces pleiotropic effects on plant gene regulation and development. Proc. Natl. Acad. Sci. USA 2001, 98, 200–205. [Google Scholar] [CrossRef]
- Ueno, Y.; Ishikawa, T.; Watanabe, K.; Terakura, S.; Iwakawa, H.; Okada, K.; Machida, C.; Machida, Y. Histone deacetylases and ASYMMETRIC LEAVES2 are involved in the establishment of polarity in leaves of Arabidopsis. Plant Cell 2007, 19, 445–457. [Google Scholar] [CrossRef] [PubMed]
- Li, H.; Torresgarcia, J.; Latrasse, D.; Polman, S.; Franken, C.; Geurts, R.; Bisseling, T. Plant-specific Histone Deacetylases HDT½ Regulate GIBBERELLIN 2-OXIDASE 2 Expression to Control Arabidopsis Root Meristem Cell Number. Plant Cell 2017, 29, 2183. [Google Scholar] [CrossRef]
- Wu, K.; Tian, L.; Malik, K.; Brown, D.; Miki, B. Functional analysis of HD2 histone deacetylase homologues in Arabidopsis thaliana. Plant J. 2000, 22, 19–27. [Google Scholar] [CrossRef]
- Hu, Y.; Qin, F.; Huang, L.; Sun, Q.; Li, C.; Zhao, Y.; Zhou, D.-X. Rice histone deacetylase genes display specific expression patterns and developmental functions. Biochem. Biophys Res. Commun. 2009, 388, 266–271. [Google Scholar] [CrossRef]
- Zhou, C.; Labbe, H.; Sridha, S.; Wang, L.; Tian, L.; Latoszek-Green, M.; Yang, Z.; Brown, D.; Miki, B.; Wu, K. Expression and function of HD2-type histone deacetylases in Arabidopsis development. Plant J. 2004, 38, 715–724. [Google Scholar] [CrossRef]
- Ye, Z.-H.; Freshour, G.; Hahn, M.G.; Burk, D.H.; Zhong, R. Vascular development in Arabidopsis. Int. Rev. Cytol. 2002, 220, 225–256. [Google Scholar] [PubMed]
- Kumar, M.; Campbell, L.; Turner, S. Secondary cell walls, biosynthesis and manipulation. J. Exp. Bot. 2016, 67, 515–531. [Google Scholar] [CrossRef] [PubMed]
- Sewalt, V.; Ni, W.; Blount, J. Reduced Lignin Content and Altered Lignin Composition in Transgenic Tobacco Down-Regulated in Expression of L-Phenylalanine Ammonia-Lyase or Cinnamate 4-Hydroxylase. Plant Physiol. 1997, 115, 41–50. [Google Scholar] [CrossRef] [PubMed]
- Berthet, S.; Demont-Caulet, N.; Pollet, B.; Bidzinski, P.; Cézard, L.; le Bris, P.; Borrega, N.; Hervé, J.; Blondet, E.; Balzergue, S.; et al. Disruption of LACCASE4 and 17 results in tissue-specific alterations to lignification of Arabidopsis thaliana stems. Plant Cell 2011, 23, 1124–1137. [Google Scholar] [CrossRef] [PubMed]
- Zhao, Q.; Nakashima, J.; Chen, F.; Yin, Y.; Fu, C.; Yun, J.; Shao, H.; Wang, X.; Wang, Z.-Y.; Dixon, R.A. Laccase is necessary and nonredundant with peroxidase for lignin polymerization during vascular development in Arabidopsis. Plant Cell 2013, 25, 3976–3987. [Google Scholar] [CrossRef] [PubMed]
- Liepman, A.H.; Wightman, R.; Geshi, N.; Turner, S.R.; Scheller, H.V. Arabidopsis—A powerful model system for plant cell wall research. Plant J. 2010, 61, 1107–1121. [Google Scholar] [CrossRef] [PubMed]
- Rennie, E.A.; Sara, F.H.; Baidoo, E.E.K.; Hadi, M.Z.; Keasling, J.D.; Henrik, V.S. Three members of the Arabidopsis glycosyltransferase family 8 are xylan glucuronosyltransferases. Plant Physiol. 2012, 159, 1408–1417. [Google Scholar] [CrossRef]
- Hao, Z.; Avci, U.; Tan, L.; Zhu, X.; Glushka, J.; Pattathil, S.; Eberhard, S.; Sholes, T.; Rothstein, G.E.; Lukowitz, W.; et al. Loss of Arabidopsis GAUT12/IRX8 causes anther indehiscence and leads to reduced G lignin associated with altered matrix polysaccharide deposition. Front. Plant Sci. 2014, 5, 357. [Google Scholar] [CrossRef]
- Dahiya, P.; Findlay, K.; Roberts, K.; McCann, C.M. A fasciclin-domain containing gene, ZeFLA11, is expressed exclusively in xylem elements that have reticulate wall thickenings in the stem vascular system of Zinnia elegans cv Envy. Planta 2006, 223, 1281–1291. [Google Scholar] [CrossRef]
- Ito, S.; Suzuki, Y.; Miyamoto, K.; Ueda, J.; Yamaguchi, I. AtFLA11, a fasciclin-like arabinogalactan-protein, specifically localized in sclerenchyma cells. J. Agr. Chem. Soc. JPN 2005, 69, 1963–1969. [Google Scholar]
- Lafarguette, F.; Leplé, J.-C.; Déjardin, A.; Laurans, F.; Costa, G.; Lesage-Descauses, M.-C.; Pilate, G. Poplar genes encoding fasciclin-like arabinogalactan proteins are highly expressed in tension wood. New Phytol. 2004, 164, 107–121. [Google Scholar] [CrossRef]
- MacMillan, C.P.; Mansfield, S.D.; Stachurski, Z.H.; Evans, R.; Southerton, S.G. Fasciclin-like arabinogalactan proteins: Specialization for stem biomechanics and cell wall architecture in Arabidopsis and Eucalyptus. Plant J. 2010, 62, 689–703. [Google Scholar] [CrossRef] [PubMed]
- Patzlaff, A.; McInnis, S.; Courtenay, A.; Surman, C.; Newman, L.J.; Smith, C.; Bevan, M.W.; Mansfield, S.; Whetten, R.W.; Sederoff, R.R. Characterisation of a pine MYB that regulates lignification. Plant J. 2003, 36, 743–754. [Google Scholar] [CrossRef] [PubMed]
- Xu, Q.; Yin, X.; Zeng, J.; Ge, H.; Song, M.; Xu, C.; Li, X.; Ferguson, I.B.; Chen, K. Activator- and repressor-type MYB transcription factors are involved in chilling injury induced flesh lignification in loquat via their interactions with the phenylpropanoid pathway. J. Exp. Bot. 2014, 65, 4349–4359. [Google Scholar] [CrossRef] [PubMed]
- Fujiwara, S.; Mitsuda, N.; Nakai, Y.; Kigoshi, K.; Suzuki, K.; Ohme-Takagi, M. Chimeric repressor analysis identifies MYB87 as a possible regulator of morphogenesis via cell wall organization and remodeling in Arabidopsis. Biotech. Lett. 2014, 36, 1049. [Google Scholar] [CrossRef] [PubMed]
- Tank, J.G.; Pandya, R.V.; Thaker, V.S. IAA and zeatin controls cell division and endoreduplication process in quiescent center cells of Allium cepa root. Indian J. Plant Physiol. 2015, 20, 1–6. [Google Scholar] [CrossRef]
- Kohno, M.; Takato, H.; Horiuchi, H.; Fujita, K.; Suzuki, S. Auxin-nonresponsive grape Aux/IAA19 is a positive regulator of plant growth. Mol. Biol. Rep. 2012, 39, 911–917. [Google Scholar] [CrossRef] [PubMed]
- Etchells, J.P.; Claire, M.P.; Simon, R.T. Plant vascular cell division is maintained by an interaction between PXY and ethylene signalling. PLoS Genetics. 2012, 8, e1002997. [Google Scholar] [CrossRef]
- Heyman, J.; Cools, T.; Vandenbussche, F.; Heyndrickx, K.S.; van Leene, J.; Vercauteren, I.; Vanderauwera, S.; Vandepoele, K.; de Jaeger, G.; van der Straeten, D.; et al. ERF115 controls root quiescent center cell division and stem cell replenishment. Science 2013, 342, 860–863. [Google Scholar] [CrossRef]
- Abe, M.; Takahashi, T.; Komeda, Y. Identification of a cis-regulatory element for L1 layer-specific gene expression, which is targeted by an L1-specific homeodomain protein. Plant J. 2001, 26, 487–494. [Google Scholar] [CrossRef]
- Deng, F.; Tu, L.; Tan, J.; Li, Y.; Nie, Y.; Zhang, X. GbPDF1 (Protodermal factor 1) is involved in cotton fiber initiation via the core cis-element HDZIP2ATATHB2. Plant Physiol. 2011, 158, 890–904. [Google Scholar] [CrossRef] [PubMed]
- Richmond, T. Higher plant cellulose synthases. Genome Biol. 2000, 1, 1–5. [Google Scholar] [CrossRef] [PubMed][Green Version]
- Borevitz, J.O.; Xia, Y.; Blount, J.; Dixon, R.A.; Lamb, C. Activation tagging identifies a conserved MYB regulator of phenylpropanoid biosynthesis. Plant Cell. 2000, 12, 2383–2393. [Google Scholar] [CrossRef] [PubMed]
- Deluc, L.; Barrieu, F.; Marchive, C.; Lauvergeat, V.; Decendit, A.; Richard, T.; Carde, J.-P.; Mérillon, J.-M.; Hamdi, S.; et al. Characterization of a grapevine R2R3-MYB transcription factor that regulates the phenylpropanoid pathway. Plant Physiol. 2006, 140, 499–511. [Google Scholar] [CrossRef] [PubMed]
- Finnin, M.S.; Donigian, J.R.; Cohen, A.; Richon, V.M.; Rifkind, R.A.; Marks, P.A.; Breslow, R.; Pavletich, N.P. Structures of a histone deacetylase homologue bound to the TSA and SAHA inhibitors. Nature 1999, 401, 188–193. [Google Scholar] [CrossRef]
- Rosa, S.; Ntoukakis, V.; Ohmido, N.; Pendle, A.; Abranches, R.; Shaw, P. Cell differentiation and development in Arabidopsis are associated with changes in histone dynamics at the single-cell level. Plant Cell 2014, 26, 4821–4833. [Google Scholar] [CrossRef] [PubMed]
- Achard, P.; Gusti, A.; Soizic, C.; Alioua, M.; Dhondt, S.; Coppens, F.; Beemster, G.T.S.; Genschik, P. Gibberellin signaling controls cell proliferation rate in Arabidopsis. Curr. Biol. 2009, 19, 1188–1193. [Google Scholar] [CrossRef]
- Grieneisen, V.A.; Xu, J.; Marée, A.F.; Hogeweg, P.; Scheres, B. Auxin transport is sufficient to generate a maximum and gradient guiding root growth. Nature 2007, 449, 1008–1013. [Google Scholar] [CrossRef]
- Zhou, C.; Zhang, L.; Duan, J.; Miki, B.; Wu, K. HISTONE DEACETYLASE19 is involved in jasmonic acid and ethylene signaling of pathogen response in Arabidopsis. Plant Cell 2005, 17, 1196–1204. [Google Scholar] [CrossRef]
- Jang, I.C.; Pahk, Y.M.; Sang, I.S.; Kwon, H.J.; Nahm, B.H.; Kim, J.K.J.P.J. Structure and expression of the rice class-I type histone deacetylase genes OsHDAC1–3, OsHDAC1 overexpression in transgenic plants leads to increased growth rate and altered architecture. Plant J. 2010, 33, 531–541. [Google Scholar] [CrossRef]
- Tian, L.; Fong, M.P.; Wang, J.J.; Wei, N.E.; Jiang, H.; Doerge, R.W.; Chen, Z.J. Reversible histone acetylation and deacetylation mediate genome-wide, promoter-dependent and locus-specific changes in gene expression during plant development. Genetics 2005, 169, 337–345. [Google Scholar] [CrossRef] [PubMed]
- Zhou, Y.; Tan, B.; Luo, M.; Li, Y.; Liu, C.; Chen, C.; Yu, C.-W.; Yang, S.; Dong, S.; Ruan, J.; et al. HISTONE DEACETYLASE19 interacts with HSL1 and participates in the repression of seed maturation genes in Arabidopsis seedlings. Plant Cell 2013, 25, 134–148. [Google Scholar] [CrossRef] [PubMed]
- Ding, B.; del Rosario, B.M.; Ning, Y.; Blake, C.M.; Wang, G.-L. HDT701, a histone H4 deacetylase, negatively regulates plant innate immunity by modulating histone H4 acetylation of defense-related genes in rice. Plant Cell 2012, 24, 3783–3794. [Google Scholar] [CrossRef] [PubMed]
- Altamura, M.M.; Possenti, M.; Matteucci, A.; Baima, S.; Ruberti, I.; Morelli, G. Development of the vascular system in the inflorescence stem of Arabidopsis. New Phytol. 2001, 151, 381–389. [Google Scholar] [CrossRef]
- Livak, K.J.; Schmittgen, T.D. Analysis of relative gene expression data using real-time quantitative PCR and the 2(-Delta Delta C(T)) Method. Methods 2001, 25, 402–408. [Google Scholar] [CrossRef]
- Mortazavi, A.; Williams, B.A.; McCue, K.; Schaeffer, L.; Wold, B. Mapping and quantifying mammalian transcriptomes by RNA-Seq. Nat. Methods 2008, 5, 621–628. [Google Scholar] [CrossRef] [PubMed]
- Young, M.D.; Wakefield, M.J.; Smyth, G.K.; Oshlack, A. Gene ontology analysis for RNA-seq, accounting for selection bias. Genome. Biol. 2010, 11, R14. [Google Scholar] [CrossRef]
- López, M.; Huerta-Pujol, O.; Martínez-Farré, F.X.; Soliva, M. Approaching compost stability from Klason lignin modified method: Chemical stability degree for OM and N quality assessment. Resour. Conserv. Recy. 2011, 55, 171–181. [Google Scholar]


| Functional Category | AGI No. | Putative ID | a Fold Change | p-Value |
|---|---|---|---|---|
| Upregulated Genes | ||||
| Transcription factors | AT2G47520 | ERF071 | 8.1782 | 1.64 × 10⁻⁴ |
| AT5G07310 | ERF115 | 3.0198 | 1.43 × 10⁻⁴ | |
| AT3G15540 | IAA19 | 1.7525 | 3.15 × 10⁻⁴ | |
| AT3G23030 | IAA2 | 1.6792 | 2.14 × 10⁻⁴ | |
| AT4G37780 | MYB87 | 8.6901 | 2.31 × 10⁻⁴ | |
| AT2G40750 | WRKY54 | 1.9848 | 9.54 × 10⁻⁵ | |
| AT5G22570 | WRKY38 | 5.8852 | 1.43 × 10⁻⁵ | |
| AT1G25560 | TEM1 | 1.8477 | 3.59 × 10⁻⁵ | |
| AT2G30400 | OFP2 | 3.0713 | 5.39 × 10⁻⁵ | |
| AT2G30395 | OFP17 | 6.2226 | 1.37 × 10⁻⁴ | |
| Lignin synthesis | AT5G01040 | LAC8, Laccase-8 | 7.5751 | 2.12 × 10⁻⁴ |
| AT5G60020 | LAC17 | 2.4538 | 1.69 × 10⁻⁴ | |
| AT2G38080 | LAC4/IRX12 | 2.5538 | 4.39 × 10⁻⁸ | |
| AT5G39580 | PER62, Peroxidase 62 | 7.1886 | 2.65 × 10⁻⁴ | |
| AT2G37040 | PAL1, Phenylalanine ammonia-lyase 1 | 1.7664 | 9.34 × 10⁻⁵ | |
| Xylan synthesis | AT2G37090 | IRX9, Beta-1,4-xylosyltransferase 9 | 2.5472 | 2.33 × 10⁻⁶ |
| AT3G18660 | GUX1, Xylan alpha-glucuronosyltransferase 1 | 2.5645 | 1.87 × 10⁻⁷ | |
| AT5G54690 | GAUT12, Galacturonosyltransferase 12 | 2.1985 | 5.86 × 10⁻⁶ | |
| AT2G38320 | TBL34, Protein trichome birefringence-like 34 | 3.9005 | 1.96 × 10⁻⁴ | |
| AT3G55990 | Protein ESKIMO 1 | 2.3088 | 5.61 × 10⁻⁶ | |
| AT3G15050 | IQ-domain 10 | 1.9627 | 9.72 × 10⁻⁵ | |
| Cellulose synthesis | AT5G44030 | CESA4, Cellulose synthase A catalytic subunit 4 | 2.0603 | 8.00 × 10⁻⁶ |
| AT5G17420 | CESA7 | 1.7013 | 1.34 × 10⁻⁴ | |
| Others related to cell wall formation | AT3G13520 | AGP12, Arabinogalactan peptide 12 | 2.4194 | 2.27 × 10⁻⁵ |
| AT5G10430 | AGP4 | 2.3787 | 1.72 × 10⁻⁶ | |
| AT5G03170 | FLA11 | 2.044 | 1.12 × 10⁻⁵ | |
| AT5G60490 | FLA12, Fasciclin-like arabinogalactan protein 12 | 1.9173 | 4.39 × 10⁻⁵ | |
| AT1G41830 | SKS6 | 2.9462 | 1.12 × 10⁻⁷ | |
| AT4G08685 | SAH7, Pollen Ole e 1 allergen and extensin family protein | 1.9925 | 3.94 × 10⁻⁵ | |
| AT5G15630 | COBL4, COBRA-like protein 4 | 1.9612 | 3.83 × 10⁻⁵ | |
| AT5G57220 | CYP81F2, Cytochrome P450, family 81, subfamily F, polypeptide 2 | 1.7666 | 1.33 × 10⁻⁴ | |
| AT1G62440 | LRX2, Leucine-rich repeat/extensin 2 | 3.7927 | 2.62 × 10⁻⁵ | |
| AT1G09610 | GXM1, Glucuronoxylan 4-O-methyltransferase 1 | 2.9384 | 3.01 × 10⁻⁷ | |
| AT2G32990 | AtGH9B8, Endoglucanase 11 | 2.6682 | 3.45 × 10⁻⁵ | |
| AT1G19940 | AtGH9B5 | 1.9237 | 3.02 × 10⁻⁴ | |
| AT5G16190 | CSLA11, Mannan synthase 11 | 1.8223 | 2.52 × 10⁻⁴ | |
| AT1G02640 | BXL2, Beta-D-xylosidase 2 | 2.0764 | 4.82 × 10⁻⁶ | |
| AT3G62020 | GLP10, Germin-like protein subfamily 2 member 4 | 2.1733 | 9.13 × 10⁻⁶ | |
| AT5G66920 | SKU5 similar 17 | 2.4182 | 1.60 × 10⁻⁴ | |
| AT1G45130 | Beta-galactosidase 5 | 1.9347 | 2.25 × 10⁻⁴ | |
| Cell differentiation | AT1G04040 | HAD superfamily, subfamily IIIB acid phosphatase | 1.7168 | 2.42 × 10⁻⁴ |
| Other | AT2G01280 | MEE65, Cyclin/Brf1-like TBP-binding protein | 4.5845 | 3.76 × 10⁻⁵ |
| AT4G21200 | GA2ox8, Gibberellin 2-beta-dioxygenase 8 | 2.539 | 4.19 × 10⁻⁵ | |
| AT1G20850 | XCP2, Xylem cysteine proteinase 2 | 3.1489 | 1.45 × 10⁻⁴ | |
| Downregulated Genes | ||||
| Transcription factors | AT5G13330 | ERF113 | −1.9415 | 1.73 × 10⁻⁵ |
| AT1G02065 | SPL8, Squamosa promoter-binding-like protein 8 | −4.2595 | 1.71 × 10⁻⁴ | |
| Cell wall formation | AT3G22640 | PAP85, Cupin family protein | −10.417 | 1.01 × 10⁻⁵ |
| Cell cycle | AT1G53490 | HEI10, E3 ubiquitin-protein ligase CCNB1IP1 homolog | −1.9356 | 1.50 × 10⁻⁴ |
| Cell proliferation | AT5G28640 | GIF1, GRF1-interacting factor 1 | −4.6295 | 1.19 × 10⁻⁴ |
| Other | AT1G24793 | LPXC4, N-acetylglucosamine deacetylase 5 | −2.919 | 7.19 × 10⁻⁶ |
| AT2G42840 | PDF1, Protodermal factor 1 | −5.894 | 1.37 × 10⁻⁴ | |
© 2019 by the authors. Licensee MDPI, Basel, Switzerland. This article is an open access article distributed under the terms and conditions of the Creative Commons Attribution (CC BY) license (http://creativecommons.org/licenses/by/4.0/).
Share and Cite
Zhang, Y.; Yin, B.; Zhang, J.; Cheng, Z.; Liu, Y.; Wang, B.; Guo, X.; Liu, X.; Liu, D.; Li, H.; et al. Histone Deacetylase HDT1 is Involved in Stem Vascular Development in Arabidopsis. Int. J. Mol. Sci. 2019, 20, 3452. https://doi.org/10.3390/ijms20143452
Zhang Y, Yin B, Zhang J, Cheng Z, Liu Y, Wang B, Guo X, Liu X, Liu D, Li H, et al. Histone Deacetylase HDT1 is Involved in Stem Vascular Development in Arabidopsis. International Journal of Molecular Sciences. 2019; 20(14):3452. https://doi.org/10.3390/ijms20143452
Chicago/Turabian StyleZhang, Yongzhuo, Bin Yin, Jiaxue Zhang, Ziyi Cheng, Yadi Liu, Bing Wang, Xiaorui Guo, Xiatong Liu, Di Liu, Hui Li, and et al. 2019. "Histone Deacetylase HDT1 is Involved in Stem Vascular Development in Arabidopsis" International Journal of Molecular Sciences 20, no. 14: 3452. https://doi.org/10.3390/ijms20143452
APA StyleZhang, Y., Yin, B., Zhang, J., Cheng, Z., Liu, Y., Wang, B., Guo, X., Liu, X., Liu, D., Li, H., & Lu, H. (2019). Histone Deacetylase HDT1 is Involved in Stem Vascular Development in Arabidopsis. International Journal of Molecular Sciences, 20(14), 3452. https://doi.org/10.3390/ijms20143452