A Pilot Study towards the Impact of Type 2 Diabetes on the Expression and Activities of Drug Metabolizing Enzymes and Transporters in Human Duodenum

 ,
,  and
and 
Abstract
1. Introduction
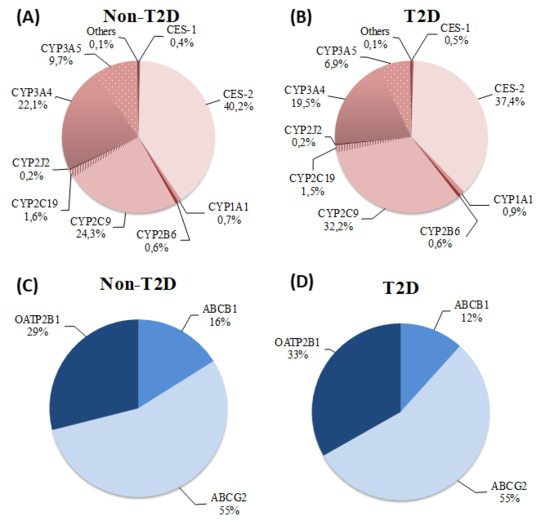
2. Results
3. Discussion
4. Methods
4.1. Subjects
4.2. Study Design and Sample Collection
4.3. Determination of Intestinal CYP450 activities
4.4. Quantification of Intestinal CYP450 mRNAs and CYP450 Genotype Analysis
4.5. Determination of Proinflammatory Cytokine Levels
4.6. Statistical Analysis
Supplementary Materials
 ) versus non-diabetic controls (blue circles
  ). Each experiment was performed three times in triplicates, means are displayed for all individuals, and the Mann Whitney t-test was performed on overall mean values. Figure S2. Correlations between mRNA expression levels as N-fold differences relative to the average expression of housekeeping genes and calibrator (2−ΔΔCT) and metabolic activities expressed as metabolite formation rates (pmoles mg protein−1 min−1) in both study groups for CYP2C9 (OH-Tol), CYP2J2 (OH-Eba), CYP3A4, and CYP3A5 (1-OH-Mdz). Patients with T2D are displayed with red squares () and non-diabetic controls are blue circles (). Spearman’s rank correlation coefficient (rs) and respective p-values are provided on each graph. Table S1. Correlation between proinflammatory cytokine levels and CYP450 activities. Table S2. Correlation between CYP450 activities and T2D-related and demographic covariables. Table S3. Influence of time since diagnostic of T2D on metabolic activity of CYP2C9, CYP2J2, and CYP3A. Table S4. Qualitative analysis of the influence of genetic variants on metabolic activity in the overall study population.
Author Contributions
Funding
Acknowledgments
Conflicts of Interest
References
- WHO. Global Status Report on Noncommunicable Diseases 2014; World Health Organization: Geneva, Switzerland, 2014. [Google Scholar]
- Esposito, K.; Chiodini, P.; Bellastella, G.; Maiorino, M.I.; Giugliano, D. Proportion of patients at HbA1c target <7% with eight classes of antidiabetic drugs in type 2 diabetes: systematic review of 218 randomized controlled trials with 78 945 patients. Diabetes Obes. Metab. 2012, 14, 228–233. [Google Scholar] [CrossRef] [PubMed]
- Hall, H.M.; Banerjee, S.; McGuire, D.K. Variability of clopidogrel response in patients with type 2 diabetes mellitus. Diab. Vasc. Dis Res. 2011, 8, 245–253. [Google Scholar] [CrossRef] [PubMed]
- Holstein, A.; Plaschke, A.; Ptak, M.; Egberts, E.H.; El-Din, J.; Brockmoller, J.; Kirchheiner, J. Association between CYP2C9 slow metabolizer genotypes and severe hypoglycaemia on medication with sulphonylurea hypoglycaemic agents. Br. J. Clin. Pharm. 2005, 60, 103–106. [Google Scholar] [CrossRef] [PubMed]
- Manolopoulos, V.G.; Ragia, G.; Tavridou, A. Pharmacogenomics of oral antidiabetic medications: Current data and pharmacoepigenomic perspective. Pharmacogenomics 2011, 12, 1161–1191. [Google Scholar] [CrossRef] [PubMed]
- Nathan, D.M.; Buse, J.B.; Davidson, M.B.; Ferrannini, E.; Holman, R.R.; Sherwin, R.; Zinman, B.; American Diabetes Association; European Association for the Study of Diabetes. Medical management of hyperglycemia in type 2 diabetes: a consensus algorithm for the initiation and adjustment of therapy: A consensus statement of the American Diabetes Association and the European Association for the Study of Diabetes. Diabetes Care 2009, 32, 193–203. [Google Scholar] [CrossRef] [PubMed]
- Pacanowski, M.A.; Hopley, C.W.; Aquilante, C.L. Interindividual variability in oral antidiabetic drug disposition and response: The role of drug transporter polymorphisms. Expert Opin. Drug Metab. Toxicol. 2008, 4, 529–544. [Google Scholar] [CrossRef]
- Pavek, P.; Dvorak, Z. Xenobiotic-induced transcriptional regulation of xenobiotic metabolizing enzymes of the cytochrome P450 superfamily in human extrahepatic tissues. Curr. Drug Metab. 2008, 9, 129–143. [Google Scholar] [CrossRef]
- Chaudhary, K.R.; Batchu, S.N.; Seubert, J.M. Cytochrome P450 enzymes and the heart. IUBMB Life 2009, 61, 954–960. [Google Scholar] [CrossRef]
- Karlgren, M.; Miura, S.; Ingelman-Sundberg, M. Novel extrahepatic cytochrome P450s. Toxicol. Appl. Pharm. 2005, 207, 57–61. [Google Scholar] [CrossRef]
- Ding, X.; Kaminsky, L.S. Human extrahepatic cytochromes P450: Function in xenobiotic metabolism and tissue-selective chemical toxicity in the respiratory and gastrointestinal tracts. Annu. Rev. Pharm. Toxicol. 2003, 43, 149–173. [Google Scholar] [CrossRef]
- Maximos, S.; Chamoun, M.; Gravel, S.; Turgeon, J.; Michaud, V. Tissue Specific Modulation of cyp2c and cyp3a mRNA Levels and Activities by Diet-Induced Obesity in Mice: The Impact of Type 2 Diabetes on Drug Metabolizing Enzymes in Liver and Extra-Hepatic Tissues. Pharmaceutics 2017, 9, 40. [Google Scholar] [CrossRef] [PubMed]
- Groer, C.; Busch, D.; Patrzyk, M.; Beyer, K.; Busemann, A.; Heidecke, C.D.; Drozdzik, M.; Siegmund, W.; Oswald, S. Absolute protein quantification of clinically relevant cytochrome P450 enzymes and UDP-glucuronosyltransferases by mass spectrometry-based targeted proteomics. J. Pharm. Biomed. Anal. 2014, 100, 393–401. [Google Scholar] [CrossRef] [PubMed]
- Drozdzik, M.; Groer, C.; Penski, J.; Lapczuk, J.; Ostrowski, M.; Lai, Y.; Prasad, B.; Unadkat, J.D.; Siegmund, W.; Oswald, S. Protein abundance of clinically relevant multidrug transporters along the entire length of the human intestine. Mol. Pharm. 2014, 11, 3547–3555. [Google Scholar] [CrossRef] [PubMed]
- Mitschke, D.; Reichel, A.; Fricker, G.; Moenning, U. Characterization of cytochrome P450 protein expression along the entire length of the intestine of male and female rats. Drug Metab. Dispos. 2008, 36, 1039–1045. [Google Scholar] [CrossRef] [PubMed]
- Grangeon, A.; Clermont, V.; Barama, A.; Gaudette, F.; Turgeon, J.; Michaud, V. Development and validation of an absolute protein assay for the simultaneous quantification of fourteen CYP450s in human microsomes by HPLC-MS/MS-based targeted proteomics. J. Pharm. Biomed. Anal. 2019, 173, 96–107. [Google Scholar] [CrossRef] [PubMed]
- Clermont, V.; Grangeon, A.; Barama, A.; Lallier, M.; Malaise, J.; Turgeon, J.; Michaud, V. Activity and mRNA expression levels of selected cytochromes P450 in various sections of the small intestine. Br. J. Clin. Pharmacol. 2019, 85, 1367–1377. [Google Scholar] [CrossRef] [PubMed]
- Paine, M.F.; Hart, H.L.; Ludington, S.S.; Haining, R.L.; Rettie, A.E.; Zeldin, D.C. The human intestinal cytochrome P450 “pie”. Drug Metab. Dispos. 2006, 34, 880–886. [Google Scholar] [CrossRef]
- Rendic, S.; Guengerich, F.P. Update information on drug metabolism systems--2009, part II: Summary of information on the effects of diseases and environmental factors on human cytochrome P450 (CYP) enzymes and transporters. Curr. Drug Metab. 2010, 11, 4–84. [Google Scholar] [CrossRef]
- Morgan, E.T. Impact of infectious and inflammatory disease on cytochrome P450-mediated drug metabolism and pharmacokinetics. Clin. Pharm. 2009, 85, 434–438. [Google Scholar] [CrossRef]
- Zhou, S.F.; Liu, J.P.; Chowbay, B. Polymorphism of human cytochrome P450 enzymes and its clinical impact. Drug Metab. Rev. 2009, 41, 89–295. [Google Scholar] [CrossRef]
- Helsby, N.A. Pheno- or genotype for the CYP2C19 drug metabolism polymorphism: The influence of disease. Proc. West. Pharm. Soc. 2008, 51, 5–10. [Google Scholar]
- Zordoky, B.N.; El-Kadi, A.O. Modulation of cardiac and hepatic cytochrome P450 enzymes during heart failure. Curr. Drug Metab. 2008, 9, 122–128. [Google Scholar] [PubMed]
- Du Souich, P.; Fradette, C. The effect and clinical consequences of hypoxia on cytochrome P450, membrane carrier proteins activity and expression. Expert Opin. Drug Metab. Toxicol. 2011, 7, 1083–1100. [Google Scholar] [CrossRef] [PubMed]
- Zhang, W.; Dolan, M.E. The emerging role of microRNAs in drug responses. Curr. Opin. Mol. 2010, 12, 695–702. [Google Scholar]
- Aitken, A.E.; Richardson, T.A.; Morgan, E.T. Regulation of drug-metabolizing enzymes and transporters in inflammation. Annu. Rev. Pharm. Toxicol. 2006, 46, 123–149. [Google Scholar] [CrossRef] [PubMed]
- Renton, K.W. Cytochrome P450 regulation and drug biotransformation during inflammation and infection. Curr. Drug Metab. 2004, 5, 235–243. [Google Scholar] [CrossRef] [PubMed]
- Morgan, E.T. Regulation of Cytochromes P450 During Inflammation and Infection. Drug Metab. Rev. 1997, 29, 1129–1188. [Google Scholar] [CrossRef] [PubMed]
- Morgan, E.T. Regulation of cytochrome p450 by inflammatory mediators: Why and how? Drug Metab. Dispos. 2001, 29, 207–212. [Google Scholar] [PubMed]
- Donath, M.Y.; Shoelson, S.E. Type 2 diabetes as an inflammatory disease. Nat. Rev. Immunol. 2011, 11, 98. [Google Scholar] [CrossRef]
- Wellen, K.E.; Hotamisligil, G.S. Inflammation, stress, and diabetes. J. Clin. Investig. 2005, 115, 1111–1119. [Google Scholar] [CrossRef]
- Goldberg, R.B. Cytokine and cytokine-like inflammation markers, endothelial dysfunction, and imbalanced coagulation in development of diabetes and its complications. J. Clin. Endocrinol. Metab. 2009, 94, 3171–3182. [Google Scholar] [CrossRef] [PubMed]
- Gravel, S.; Chiasson, J.-L.; Dallaire, S.; Turgeon, J.; Michaud, V. Evaluating the impact of type 2 diabetes mellitus on CYP450 metabolic activities: Protocol for a case–control pharmacokinetic study. BMJ Open 2018, 8. [Google Scholar] [CrossRef]
- Gravel, S.; Chiasson, J.L.; Turgeon, J.; Grangeon, A.; Michaud, V. Modulation of CYP450 activities in patients with type 2 diabetes. Clin. Pharmacol. Ther. 2019. [Google Scholar] [CrossRef] [PubMed]
- Patoine, D.; Petit, M.; Pilote, S.; Picard, F.; Drolet, B.; Simard, C. Modulation of CYP3a expression and activity in mice models of type 1 and type 2 diabetes. Pharm. Res. Perspect. 2014, 2, e00082. [Google Scholar] [CrossRef] [PubMed]
- Kudo, T.; Toda, T.; Ushiki, T.; Ohi, K.; Ikarashi, N.; Ochiai, W.; Sugiyama, K. Differences in the pharmacokinetics of Cyp3a substrates in TSOD and streptozotocin-induced diabetic mice. Xenobiotica 2010, 40, 282–290. [Google Scholar] [CrossRef]
- Borbas, T.; Benko, B.; Dalmadi, B.; Szabo, I.; Tihanyi, K. Insulin in flavin-containing monooxygenase regulation. Flavin-containing monooxygenase and cytochrome P450 activities in experimental diabetes. Eur. J. Pharm. Sci. 2006, 28, 51–58. [Google Scholar] [CrossRef]
- Kaminsky, L.S.; Zhang, Q.-Y. THE SMALL INTESTINE AS A XENOBIOTIC-METABOLIZING ORGAN. Drug Metab. Dispos. 2003, 31, 1520–1525. [Google Scholar] [CrossRef]
- Obach, R.S.; Zhang, Q.Y.; Dunbar, D.; Kaminsky, L.S. Metabolic characterization of the major human small intestinal cytochrome p450s. Drug Metab. Dispos. 2001, 29, 347–352. [Google Scholar]
- Xu, M.; Ju, W.; Hao, H.; Wang, G.; Li, P. Cytochrome P450 2J2: Distribution, function, regulation, genetic polymorphisms and clinical significance. Drug Metab. Rev. 2013, 45, 311–352. [Google Scholar] [CrossRef]
- Taketani, M.; Shii, M.; Ohura, K.; Ninomiya, S.; Imai, T. Carboxylesterase in the liver and small intestine of experimental animals and human. Life Sci. 2007, 81, 924–932. [Google Scholar] [CrossRef]
- Satoh, T.; Taylor, P.; Bosron, W.F.; Sanghani, S.P.; Hosokawa, M.; Du, B.N.L. Current Progress on Esterases: From Molecular Structure to Function. Drug Metab. Dispos. 2002, 30, 488–493. [Google Scholar] [CrossRef] [PubMed]
- Imai, T.; Ohura, K. The role of intestinal carboxylesterase in the oral absorption of prodrugs. Curr. Drug Metab. 2010, 11, 793–805. [Google Scholar] [CrossRef] [PubMed]
- Wang, Z.; Hall, S.D.; Maya, J.F.; Li, L.; Asghar, A.; Gorski, J.C. Diabetes mellitus increases the in vivo activity of cytochrome P450 2E1 in humans. Br. J. Clin. Pharm. 2003, 55, 77–85. [Google Scholar] [CrossRef] [PubMed]
- De Waziers, I.; Cugnenc, P.H.; Yang, C.S.; Leroux, J.P.; Beaune, P.H. Cytochrome P 450 isoenzymes, epoxide hydrolase and glutathione transferases in rat and human hepatic and extrahepatic tissues. J. Pharm. Exp. 1990, 253, 387–394. [Google Scholar]
- Zhang, Q.Y.; Dunbar, D.; Ostrowska, A.; Zeisloft, S.; Yang, J.; Kaminsky, L.S. Characterization of human small intestinal cytochromes P-450. Drug Metab. Dispos. 1999, 27, 804–809. [Google Scholar]
- Bieche, I.; Narjoz, C.; Asselah, T.; Vacher, S.; Marcellin, P.; Lidereau, R.; Beaune, P.; de Waziers, I. Reverse transcriptase-PCR quantification of mRNA levels from cytochrome (CYP)1, CYP2 and CYP3 families in 22 different human tissues. Pharm. Genom. 2007, 17, 731–742. [Google Scholar] [CrossRef]
- Lindell, M.; Karlsson, M.O.; Lennernas, H.; Pahlman, L.; Lang, M.A. Variable expression of CYP and Pgp genes in the human small intestine. Eur. J. Clin. Investig. 2003, 33, 493–499. [Google Scholar] [CrossRef]
- Dostalek, M.; Court, M.H.; Yan, B.; Akhlaghi, F. Significantly reduced cytochrome P450 3A4 expression and activity in liver from humans with diabetes mellitus. Br. J. Pharm. 2011, 163, 937–947. [Google Scholar] [CrossRef]
- Kudo, T.; Shimada, T.; Toda, T.; Igeta, S.; Suzuki, W.; Ikarashi, N.; Ochiai, W.; Ito, K.; Aburada, M.; Sugiyama, K. Altered expression of CYP in TSOD mice: A model of type 2 diabetes and obesity. Xenobiotica 2009, 39, 889–902. [Google Scholar] [CrossRef]
- Lam, J.L.; Jiang, Y.; Zhang, T.; Zhang, E.Y.; Smith, B.J. Expression and functional analysis of hepatic cytochromes P450, nuclear receptors, and membrane transporters in 10- and 25-week-old db/db mice. Drug Metab. Dispos. 2010, 38, 2252–2258. [Google Scholar] [CrossRef]
- Sakuma, T.; Honma, R.; Maguchi, S.; Tamaki, H.; Nemoto, N. Different expression of hepatic and renal cytochrome P450s between the streptozotocin-induced diabetic mouse and rat. Xenobiotica 2001, 31, 223–237. [Google Scholar] [CrossRef] [PubMed]
- Ghose, R.; Omoluabi, O.; Gandhi, A.; Shah, P.; Strohacker, K.; Carpenter, K.C.; McFarlin, B.; Guo, T. Role of high-fat diet in regulation of gene expression of drug metabolizing enzymes and transporters. Life Sci. 2011, 89, 57–64. [Google Scholar] [CrossRef] [PubMed]
- Nawa, A.; Fujita-Hamabe, W.; Tokuyama, S. Altered intestinal P-glycoprotein expression levels in a monosodium glutamate-induced obese mouse model. Life Sci. 2011, 89, 834–838. [Google Scholar] [CrossRef] [PubMed]
- Sugioka, N.; Haraya, K.; Fukushima, K.; Ito, Y.; Takada, K. Effects of obesity induced by high-fat diet on the pharmacokinetics of nelfinavir, a HIV protease inhibitor, in laboratory rats. Biopharm. Drug Dispos. 2009, 30, 532–541. [Google Scholar] [CrossRef] [PubMed]
- Wienkers, L.C.; Heath, T.G. Predicting in vivo drug interactions from in vitro drug discovery data. Nat. Rev. Drug Discov. 2005, 4, 825–833. [Google Scholar] [CrossRef] [PubMed]
- Shimada, T.; Yamazaki, H.; Mimura, M.; Inui, Y.; Guengerich, F.P. Interindividual variations in human liver cytochrome P-450 enzymes involved in the oxidation of drugs, carcinogens and toxic chemicals: Studies with liver microsomes of 30 Japanese and 30 Caucasians. J. Pharm. Exp. 1994, 270, 414–423. [Google Scholar]
- Thummel, K.E.; O’Shea, D.; Paine, M.F.; Shen, D.D.; Kunze, K.L.; Perkins, J.D.; Wilkinson, G.R. Oral first-pass elimination of midazolam involves both gastrointestinal and hepatic CYP3A-mediated metabolism. Clin. Pharm. 1996, 59, 491–502. [Google Scholar] [CrossRef]
- Paine, M.F.; Shen, D.D.; Kunze, K.L.; Perkins, J.D.; Marsh, C.L.; McVicar, J.P.; Barr, D.M.; Gillies, B.S.; Thummel, K.E. First-pass metabolism of midazolam by the human intestine. Clin. Pharm. 1996, 60, 14–24. [Google Scholar] [CrossRef]
- Galetin, A.; Houston, J.B. Intestinal and hepatic metabolic activity of five cytochrome P450 enzymes: Impact on prediction of first-pass metabolism. J. Pharm. Exp. 2006, 318, 1220–1229. [Google Scholar] [CrossRef]
- Thirumaran, R.K.; Lamba, J.K.; Kim, R.B.; Urquhart, B.L.; Gregor, J.C.; Chande, N.; Fan, Y.; Qi, A.; Cheng, C.; Thummel, K.E.; et al. Intestinal CYP3A4 and midazolam disposition in vivo associate with VDR polymorphisms and show seasonal variation. Biochem. Pharm. 2012, 84, 104–112. [Google Scholar] [CrossRef]
- Pinto, A.G.; Horlander, J.; Chalasani, N.; Hamman, M.; Asghar, A.; Kolwankar, D.; Hall, S.D. Diltiazem inhibits human intestinal cytochrome P450 3A (CYP3A) activity in vivo without altering the expression of intestinal mRNA or protein. Br. J. Clin. Pharm. 2005, 59, 440–446. [Google Scholar] [CrossRef] [PubMed]
- McConn, D.J., 2nd; Lin, Y.S.; Mathisen, T.L.; Blough, D.K.; Xu, Y.; Hashizume, T.; Taylor, S.L.; Thummel, K.E.; Shuhart, M.C. Reduced duodenal cytochrome P450 3A protein expression and catalytic activity in patients with cirrhosis. Clin. Pharm. 2009, 85, 387–393. [Google Scholar] [CrossRef] [PubMed]
- Holstein, A.; Beil, W.; Kovacs, P. CYP2C metabolism of oral antidiabetic drugs--impact on pharmacokinetics, drug interactions and pharmacogenetic aspects. Expert Opin. Drug Metab. Toxicol. 2012, 8, 1549–1563. [Google Scholar] [CrossRef] [PubMed]
- Preissner, S.; Kroll, K.; Dunkel, M.; Senger, C.; Goldsobel, G.; Kuzman, D.; Guenther, S.; Winnenburg, R.; Schroeder, M.; Preissner, R. SuperCYP: A comprehensive database on Cytochrome P450 enzymes including a tool for analysis of CYP-drug interactions. Nucleic Acids Res. 2010, 38, D237–D243. [Google Scholar] [CrossRef] [PubMed]
- Zhou, X.; Rougee, L.R.; Bedwell, D.W.; Cramer, J.W.; Mohutsky, M.A.; Calvert, N.A.; Moulton, R.D.; Cassidy, K.C.; Yumibe, N.P.; Adams, L.A.; et al. Difference in the Pharmacokinetics and Hepatic Metabolism of Antidiabetic Drugs in Zucker Diabetic Fatty and Sprague-Dawley Rats. Drug Metab. Dispos. 2016, 44, 1184–1192. [Google Scholar] [CrossRef] [PubMed]
- Lee, C.A.; Neul, D.; Clouser-Roche, A.; Dalvie, D.; Wester, M.R.; Jiang, Y.; Jones, J.P.; Freiwald, S.; Zientek, M.; Totah, R.A. Identification of Novel Substrates for Human Cytochrome P450 2J2. Drug Metab. Dispos. 2010, 38, 347–356. [Google Scholar] [CrossRef]
- Xie, F.; Ding, X.; Zhang, Q.-Y. An update on the role of intestinal cytochrome P450 enzymes in drug disposition. Acta Pharm. Sin. B 2016, 6, 374–383. [Google Scholar] [CrossRef] [PubMed]
- Hashizume, T.; Imaoka, S.; Mise, M.; Terauchi, Y.; Fujii, T.; Miyazaki, H.; Kamataki, T.; Funae, Y. Involvement of CYP2J2 and CYP4F12 in the Metabolism of Ebastine in Human Intestinal Microsomes. J. Pharmacol. Exp. Ther. 2002, 300, 298–304. [Google Scholar] [CrossRef]
- Matsumoto, S.; Hirama, T.; Matsubara, T.; Nagata, K.; Yamazoe, Y. Involvement of CYP2J2 on the Intestinal First-Pass Metabolism of Antihistamine Drug, Astemizole. Drug Metab. Dispos. 2002, 30, 1240–1245. [Google Scholar] [CrossRef]
- Zeldin, D.C.; Foley, J.; Goldsworthy, S.M.; Cook, M.E.; Boyle, J.E.; Ma, J.; Moomaw, C.R.; Tomer, K.B.; Steenbergen, C.; Wu, S. CYP2J subfamily cytochrome P450s in the gastrointestinal tract: Expression, localization, and potential functional significance. Mol. Pharm. 1997, 51, 931–943. [Google Scholar] [CrossRef]
- Liu, K.-H.; Kim, M.-G.; Lee, D.-J.; Yoon, Y.-J.; Kim, M.-J.; Shon, J.-H.; Choi, C.S.; Choi, Y.K.; Desta, Z.; Shin, J.-G. Characterization of Ebastine, Hydroxyebastine, and Carebastine Metabolism by Human Liver Microsomes and Expressed Cytochrome P450 Enzymes: Major Roles for CYP2J2 and CYP3A. Drug Metab. Dispos. 2006, 34, 1793–1797. [Google Scholar] [CrossRef] [PubMed]
- Dai, M.; Wu, L.; Wang, P.; Wen, Z.; Xu, X.; Wang, D.W. CYP2J2 and Its Metabolites EETs Attenuate Insulin Resistance via Regulating Macrophage Polarization in Adipose Tissue. Sci. Rep. 2017, 7, 46743. [Google Scholar] [CrossRef] [PubMed]
- Li, R.; Xu, X.; Chen, C.; Wang, Y.; Gruzdev, A.; Zeldin, D.C.; Wang, D.W. CYP2J2 attenuates metabolic dysfunction in diabetic mice by reducing hepatic inflammation via the PPARgamma. Am. J. Physiol. Endocrinol. Metab. 2015, 308, E270–E282. [Google Scholar] [CrossRef] [PubMed]
- Chen, G.; Xu, R.; Zhang, S.; Wang, Y.; Wang, P.; Edin, M.L.; Zeldin, D.C.; Wang, D.W. CYP2J2 overexpression attenuates nonalcoholic fatty liver disease induced by high-fat diet in mice. Am. J. Physiol. Endocrinol. Metab. 2015, 308, E97–E110. [Google Scholar] [CrossRef] [PubMed]
- Chen, G.; Wang, P.; Zhao, G.; Xu, G.; Gruzdev, A.; Zeldin, D.C.; Wang, D.W. Cytochrome P450 epoxygenase CYP2J2 attenuates nephropathy in streptozotocin-induced diabetic mice. Prostaglandins Other Lipid Mediat. 2011, 96, 63–71. [Google Scholar] [CrossRef] [PubMed]
- Ma, B.; Xiong, X.; Chen, C.; Li, H.; Xu, X.; Li, X.; Li, R.; Chen, G.; Dackor, R.T.; Zeldin, D.C.; et al. Cardiac-specific overexpression of CYP2J2 attenuates diabetic cardiomyopathy in male streptozotocin-induced diabetic mice. Endocrinology 2013, 154, 2843–2856. [Google Scholar] [CrossRef] [PubMed]
- Connarn, J.N.; Zhang, X.; Babiskin, A.; Sun, D. Metabolism of bupropion by carbonyl reductases in liver and intestine. Drug Metab. Dispos. 2015, 43, 1019–1027. [Google Scholar] [CrossRef]
- Tucker, T.G.; Milne, A.M.; Fournel-Gigleux, S.; Fenner, K.S.; Coughtrie, M.W. Absolute immunoquantification of the expression of ABC transporters P-glycoprotein, breast cancer resistance protein and multidrug resistance-associated protein 2 in human liver and duodenum. Biochem. Pharm. 2012, 83, 279–285. [Google Scholar] [CrossRef]
- Englund, G.; Rorsman, F.; Ronnblom, A.; Karlbom, U.; Lazorova, L.; Grasjo, J.; Kindmark, A.; Artursson, P. Regional levels of drug transporters along the human intestinal tract: Co-expression of ABC and SLC transporters and comparison with Caco-2 cells. Eur. J. Pharm. Sci. 2006, 29, 269–277. [Google Scholar] [CrossRef]
- Zanger, U.M.; Schwab, M. Cytochrome P450 enzymes in drug metabolism: Regulation of gene expression, enzyme activities, and impact of genetic variation. Pharmacol. Ther. 2013, 138, 103–141. [Google Scholar] [CrossRef]
- Zhang, Y.; Klein, K.; Sugathan, A.; Nassery, N.; Dombkowski, A.; Zanger, U.M.; Waxman, D.J. Transcriptional Profiling of Human Liver Identifies Sex-Biased Genes Associated with Polygenic Dyslipidemia and Coronary Artery Disease. PLoS ONE 2011, 6, e23506. [Google Scholar] [CrossRef] [PubMed]
- Cotreau, M.M.; von Moltke, L.L.; Greenblatt, D.J. The influence of age and sex on the clearance of cytochrome P450 3A substrates. Clin. Pharm. 2005, 44, 33–60. [Google Scholar] [CrossRef] [PubMed]
- Yang, X.; Zhang, B.; Molony, C.; Chudin, E.; Hao, K.; Zhu, J.; Gaedigk, A.; Suver, C.; Zhong, H.; Leeder, J.S.; et al. Systematic genetic and genomic analysis of cytochrome P450 enzyme activities in human liver. Genome Res. 2010, 20, 1020–1036. [Google Scholar] [CrossRef] [PubMed]
- Hu, Z.-Y.; Zhao, Y.-S. Sex-Dependent Differences in Cytochrome P450 3A Activity as Assessed by Midazolam Disposition in Humans: A Meta-Analysis. Drug Metab. Dispos. 2010, 38, 817–823. [Google Scholar] [CrossRef] [PubMed]
- Oh, S.J.; Choi, J.M.; Yun, K.U.; Oh, J.M.; Kwak, H.C.; Oh, J.G.; Lee, K.S.; Kim, B.H.; Heo, T.H.; Kim, S.K. Hepatic expression of cytochrome P450 in type 2 diabetic Goto-Kakizaki rats. Chem. Biol. Interact. 2012, 195, 173–179. [Google Scholar] [CrossRef] [PubMed]
- Bonkovsky, H.L.; Hauri, H.P.; Marti, U.; Gasser, R.; Meyer, U.A. Cytochrome P450 of small intestinal epithelial cells. Immunochemical characterization of the increase in cytochrome P450 caused by phenobarbital. Gastroenterology 1985, 88, 458–467. [Google Scholar] [CrossRef]
- Huguet, J.; Gaudette, F.; Michaud, V.; Turgeon, J. Development and validation of probe drug cocktails for the characterization of CYP450-mediated metabolism by human heart microsomes. Xenobiotica 2018, 49, 1–13. [Google Scholar] [CrossRef]


| Parameters | Non-T2D Patients | Patients with T2D |
|---|---|---|
| No. of subjects | 16 | 20 |
| Sex: No. (%) M:F | 7:9 (44:56) | 8:12 (40:60) |
| Age (years) | 57 ± 16 | 62 ± 11 |
| BMI (kg m −2) | 25.8 ± 5.7 | 30.2 ± 6.6 * |
| Insulin (pmol L−1) | 44.8 ± 26.2 | 188.2 ± 262.7 * |
| Glycemia (mmol L−1) | 4.8 ± 0.5 | 7.1 ± 2.3 * |
| HbA1C (%) | 5.4 ± 0.4 | 7.2 ± 1.0 * |
| HOMA-IR | 1.4 ± 0.9 | 11.4 ± 25.8 * |
| HOMA-β | 98 ± 50 | 151 ± 145 |
| Time since diagnostic (years) | NA | 9.5 ± 5.8 |
| Medication use, No. (%) of subjects | ||
| Metformin | 0 | 13 (65) * |
| Sulfonylurea | 0 | 7 (35) * |
| DPP4-I | 0 | 3 (15) |
| Insulin | 0 | 5 (25) |
| Statins | 2 (13) | 9 (45) |
| ACEI | 2 (13) | 4 (20) |
| ARB | 2 (13) | 7 (35) |
| CCB | 2 (13) | 4 (20) |
| PPI | 10 (63) | 8 (40) |
| β-Blockers | 2 (13) | 4 (20) |
| Aspirin | 4 (26) | 8 (40) |
| other NSAID | 3 (19) | 1 (5) |
| Antidepressants | 1 (6) | 5 (25) |
| Item | Non-T2D Patients (n = 15) | Patients with T2D (n = 20) | p-Value | Adjusted p-Value a |
|---|---|---|---|---|
| Drug Metabolizing Enzymes | ||||
| CES-1 | 2.5 (1.3–3.7) | 2.8 (2.1–3.8) | 0.4 | 0.5 |
| CES-2 | 2.1 (2.0–2.6) | 2.3 (2.1–2.6) | 0.8 | 0.9 |
| CYP1A1 | 6.0 (1.5–15.2) | 6.2 (3.3–20.2) | 0.5 | 0.4 |
| CYP2B6 | 4.1 (1.9–4.7) | 4.8 (3.4–8.9) | 0.3 | 0.2 |
| CYP2C8 | 3.8 (1.8–6.2) | 2.7 (1.4–4.4) | 0.5 | 0.3 |
| CYP2C9 | 9.0 (6.3–13.0) | 11.9 (8.9–14.7) | 0.051 | 0.09 |
| CYP2C19 | 4.4 (3.3–5.2) | 4.3 (3.4–5.6) | 0.7 | 0.7 |
| CYP2D6 | 2.4 (1.5–3.6) | 2.9 (1.6–5.3) | 0.1 | 0.1 |
| CYP2E1 | 2.2 (0.9–6.8) | 1.6 (1.2–2.6) | 0.3 | 0.2 |
| CYP2J2 | 1.8 (1.2–2.1) | 2.0 (1.5–2.5) | 0.3 | 0.3 |
| CYP3A4 | 4.1 (2.9–5.9) | 4.6 (3.5–7.1) | 0.5 | 0.6 |
| CYP3A5 | 3.9 (3.0–19.4) | 4.2 (3.5–8.1) | 0.3 | 0.3 |
| Drug Transporters | ||||
| ABCB1 | 1.5 (1.1–2.0) | 1.6 (1.2–1.9) | 0.7 | 0.5 |
| ABCG2 | 2.7 (2.3–3.6) | 3.2 (2.8–4.1) | 0.2 | 0.2 |
| OATP2B1 | 0.7 (0.6–0.9) | 0.9 (0.8–0.1) | 0.02* | 0.02 * |
| Proinflammatory Cytokines | Non-T2D Patients (n = 16) | Patients with T2D (n = 20) | p-Value |
|---|---|---|---|
| IFN-γ | 3.80 ± 2.67 | 3.41 ± 2.15 | 0.98 |
| IL-1β | 0.07 ± 0.07 | 0.09 ± 0.10 | 0.86 |
| IL-6 | 0.99 ± 0.49 | 1.07 ± 0.94 | 0.35 |
| TNF-α | 2.00 ± 0.36 | 2.71 ± 1.25 | 0.03 * |
© 2019 by the authors. Licensee MDPI, Basel, Switzerland. This article is an open access article distributed under the terms and conditions of the Creative Commons Attribution (CC BY) license (http://creativecommons.org/licenses/by/4.0/).
Share and Cite
Gravel, S.; Panzini, B.; Belanger, F.; Turgeon, J.; Michaud, V. A Pilot Study towards the Impact of Type 2 Diabetes on the Expression and Activities of Drug Metabolizing Enzymes and Transporters in Human Duodenum. Int. J. Mol. Sci. 2019, 20, 3257. https://doi.org/10.3390/ijms20133257
Gravel S, Panzini B, Belanger F, Turgeon J, Michaud V. A Pilot Study towards the Impact of Type 2 Diabetes on the Expression and Activities of Drug Metabolizing Enzymes and Transporters in Human Duodenum. International Journal of Molecular Sciences. 2019; 20(13):3257. https://doi.org/10.3390/ijms20133257
Chicago/Turabian StyleGravel, Sophie, Benoit Panzini, Francois Belanger, Jacques Turgeon, and Veronique Michaud. 2019. "A Pilot Study towards the Impact of Type 2 Diabetes on the Expression and Activities of Drug Metabolizing Enzymes and Transporters in Human Duodenum" International Journal of Molecular Sciences 20, no. 13: 3257. https://doi.org/10.3390/ijms20133257
APA StyleGravel, S., Panzini, B., Belanger, F., Turgeon, J., & Michaud, V. (2019). A Pilot Study towards the Impact of Type 2 Diabetes on the Expression and Activities of Drug Metabolizing Enzymes and Transporters in Human Duodenum. International Journal of Molecular Sciences, 20(13), 3257. https://doi.org/10.3390/ijms20133257